
Waiting for the Turnaround
Bitcoin shrugs off the turmoil rocking other financial markets. The price bobs along with the waves but stays remarkably stable around $65,000. As risks pile up, the bulls hold firm — but for how long?

It was a quiet week on the crypto market. Bitcoin's price rose to nearly $67,000 on Tuesday, then slipped back to $65,000, a level we've seen far more often in July.
Beyond the crypto market, plenty is brewing:
- AI stocks are still in the middle of their mid-cycle slowdown, a rotation within the AI theme. We're seeing stagnation across the major stock indices.
- The war in Iran is flaring up again. A barrel of Brent crude cost $102 yesterday, already 45% more than the $70 at the bottom on July 2.
- The US 10-year yield rose to 4.7%, its highest level since January 2025. That's bad news for the US housing market.
The market has now priced in two 25 bps rate hikes for the remainder of 2026. The next rate decision is on Wednesday, July 29. Based on rate futures, the market puts the odds at 38% that the rate committee, led by Fed chair Kevin Warsh, will raise rates.
A rising interest rate is bad news for bitcoin, for two reasons. Because rising rates put the brakes on the economy while there are already macroeconomic figures pointing to a slowing economy. And because higher rates make bitcoin (and gold) less attractive relative to bonds.
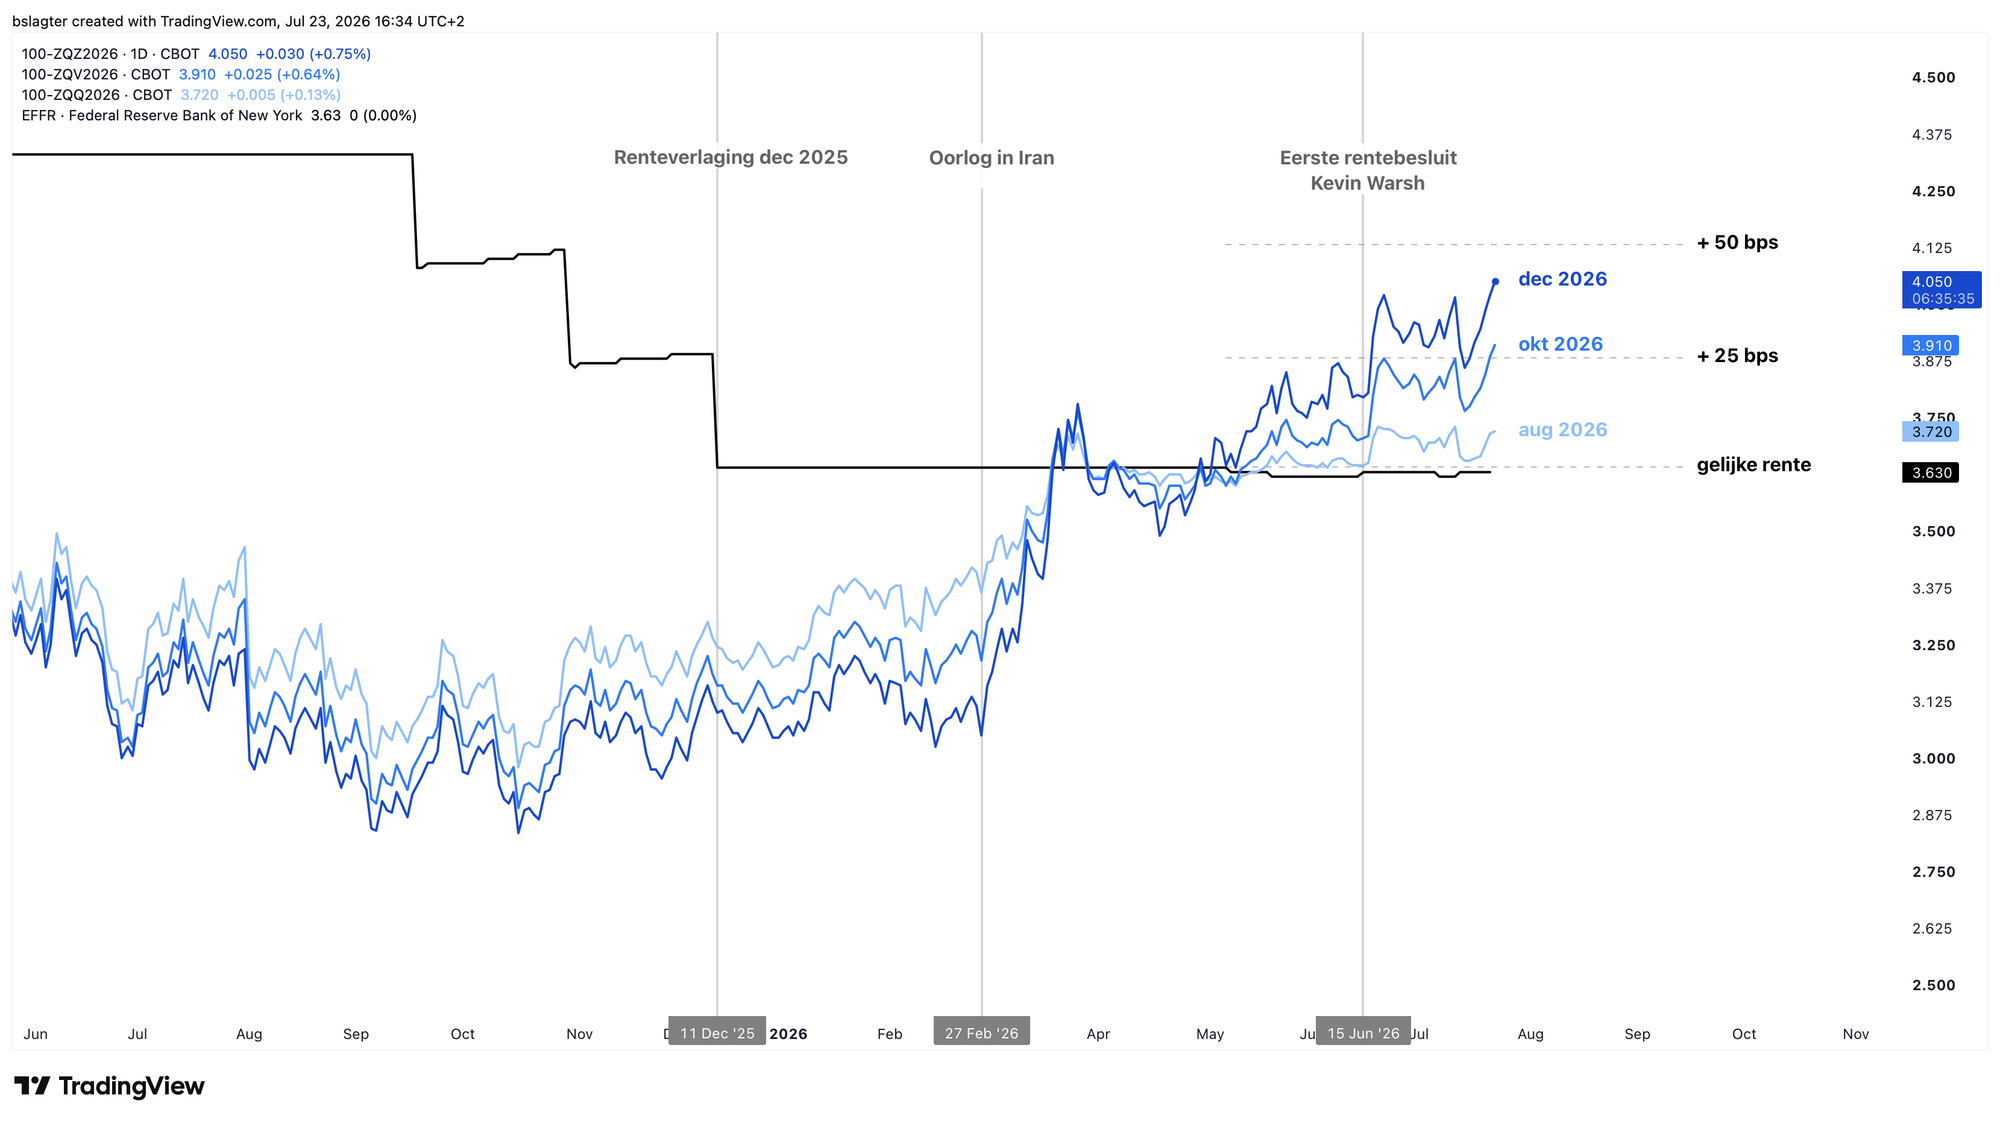
Yet bitcoin isn't paying it much mind. The price bobs along with the waves, but otherwise goes its own way. That fits well with the final phase of the bull market, where panic and capitulation fade into the background, and despondency and indifference take over.
What's characteristic of this phase of the bear market is that the conversation slowly shifts from problems to solutions. During the panic and capitulation from November through March, the future looked pitch black: quantum computing would break bitcoin's security, Strategy would collapse in this bear market, and the Trump administration saw crypto as a plaything.
Bear markets are for building. Nine companies, including BlackRock, Coinbase, Galaxy and Strategy, have launched the Bitcoin Security Consortium, with $15 million in the coffers to fund R&D into quantum security. Strategy has revised its policy framework and built up a dollar reserve of $3.2 billion, enough to cover nearly two years of obligations. And US Treasury Secretary Scott Bessent called crypto a matter of strategic geopolitical importance in a major speech.
Bitcoin’s security is a shared responsibility.
— Michael Saylor (@saylor) July 23, 2026
Today we are launching the Bitcoin Security Consortium, backed by $15 million in commitments to support the developers and researchers strengthening Bitcoin for the decades ahead. https://t.co/J2VbkgJRZm
Another sign that the character of the bear market is changing. That there's a glimmer of hope on the horizon. In last week's Markets, we discussed a list of "early signs that we've reached the conditions in which it's realistic to expect a trend reversal" — we can add this one to it.
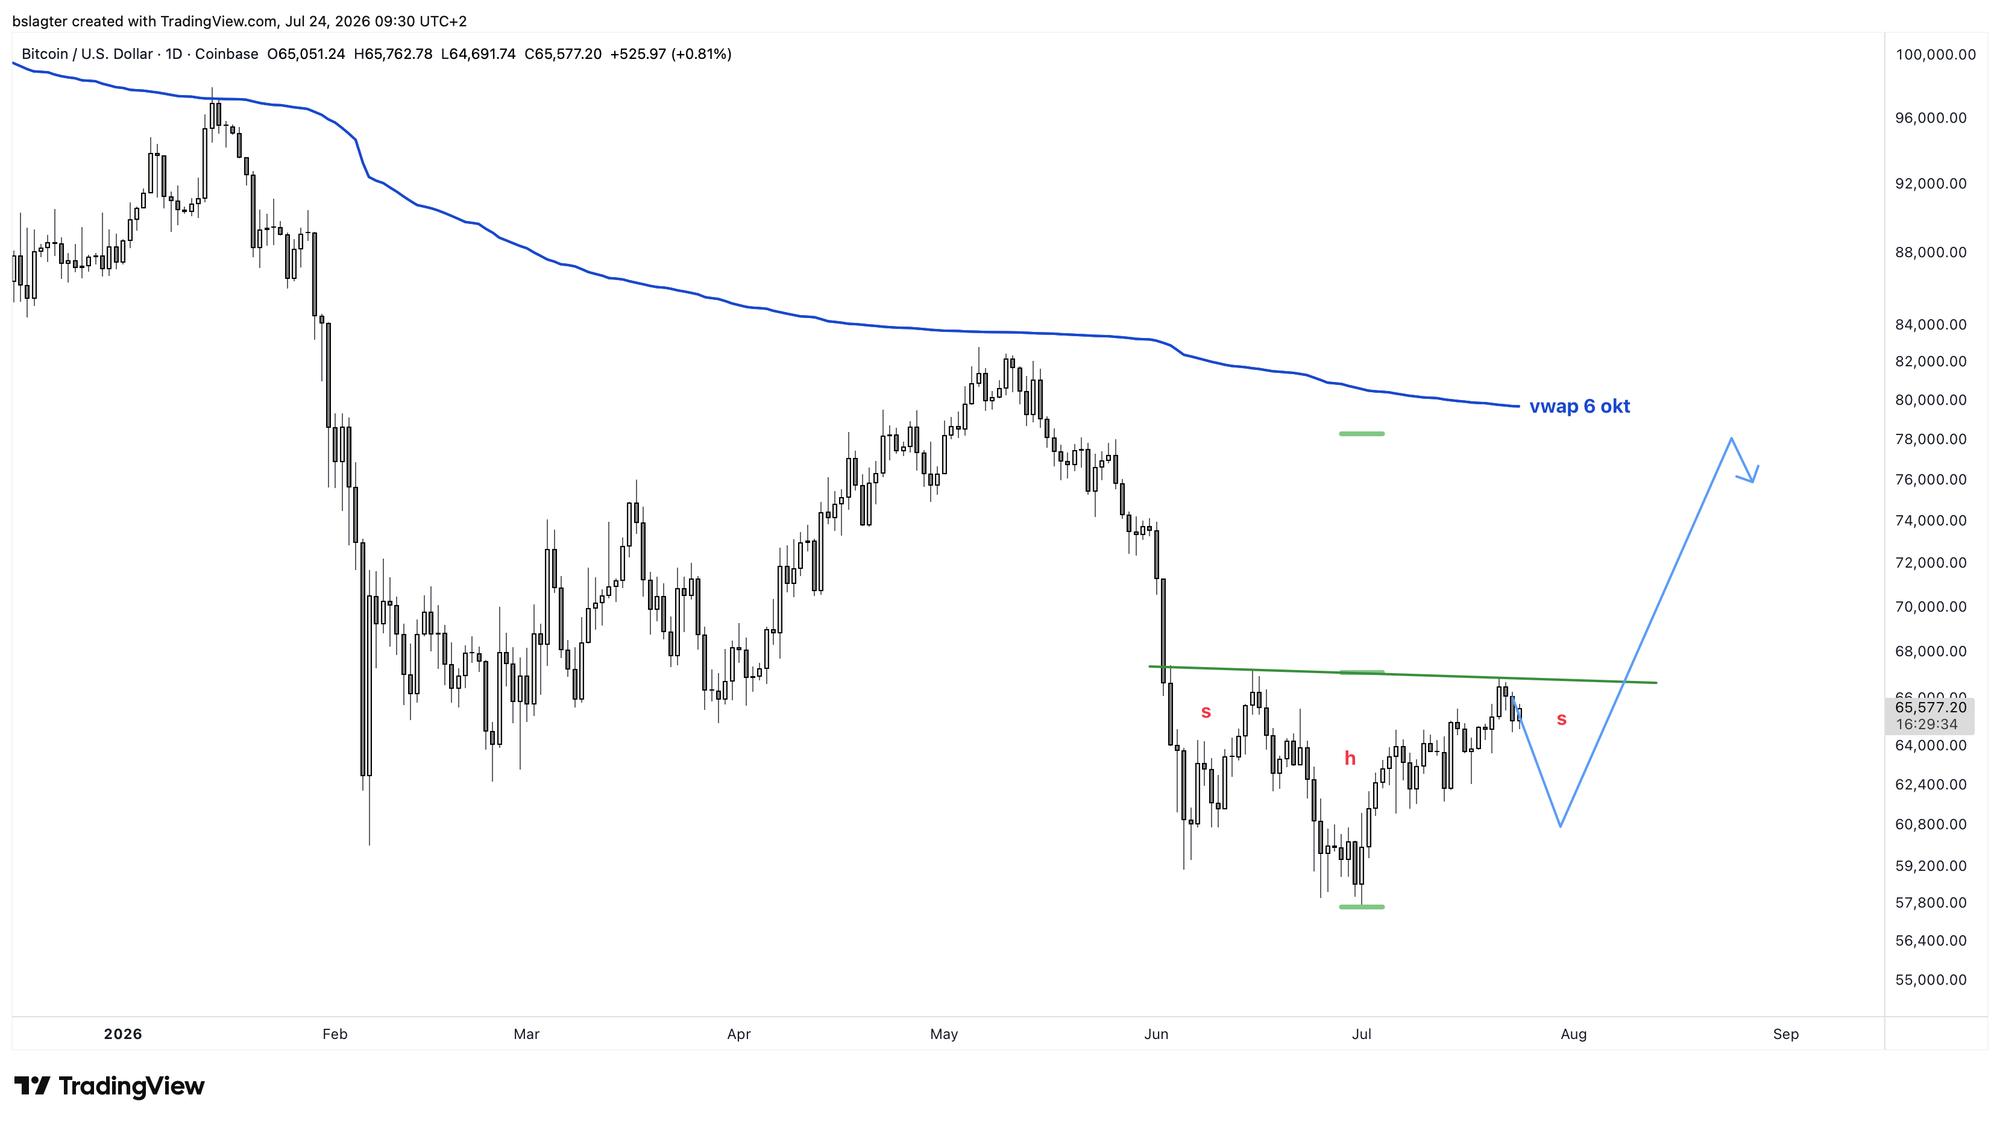
Still, it's worth keeping in mind that the bottom of the bear market may well take a while yet. The summer period lends itself perfectly to a sideways market. Perhaps a brief head-fake below $57,700 or above $67,000, but no big step up or down.
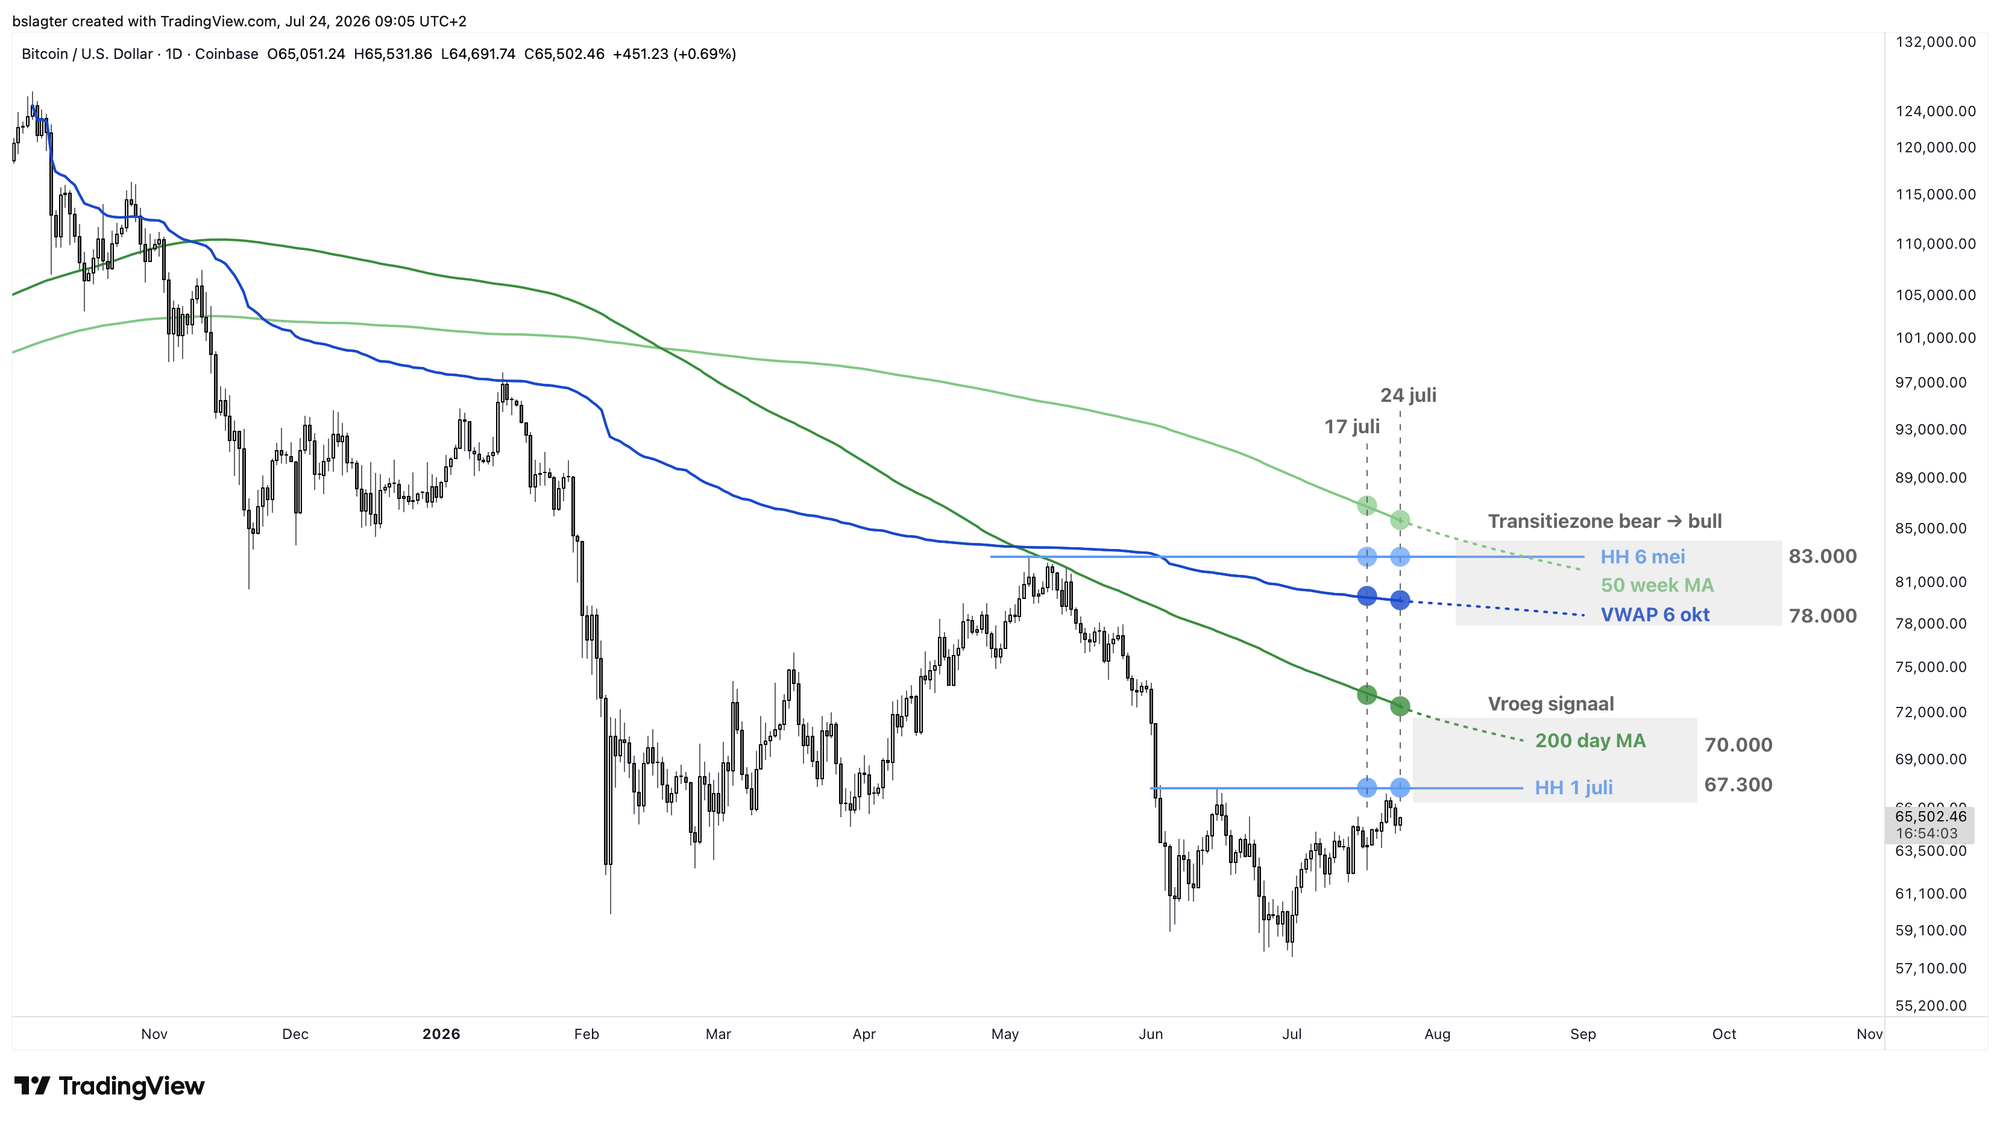
Only above $85,000 is it time to reassess the scenarios. Then we'll shift our base case from "we're in a bear market" to "we're in a new bull market." By then we'll have ticked three, maybe four, boxes on our checklist:
⏹️ A higher high (HH) above the $83,000 of May 6
⏹️ A higher low (HL) above the $57,700 of July 1
⏹️ A weekly close above the 50-week average at $85,500
⏹️ A change in direction of that average from falling to rising
Until then, we practice patience, cautiously rebuild our position, and check in each week to see how the charts are developing. Let's grab a few from last week, with updated prices.
Let's start with the chart showing the milestones:
- The June 15 top at $67,200. If this daily cycle is falling, we don't expect the price to break above here. This is also roughly where the realized price of short-term holders (STH-RP) sits.
- The 200-day average at $72,000. Some analysts use this average as the dividing line between bull and bear markets.
- The vwap from the top at $79,700. The average purchase price from the top often escorts the downtrend.
- The May 6 top at $83,000. Above this, we'd have a first higher high (HH) on the weekly chart.
- The 50-week average at $85,500. We see a weekly close above this as an important signal.
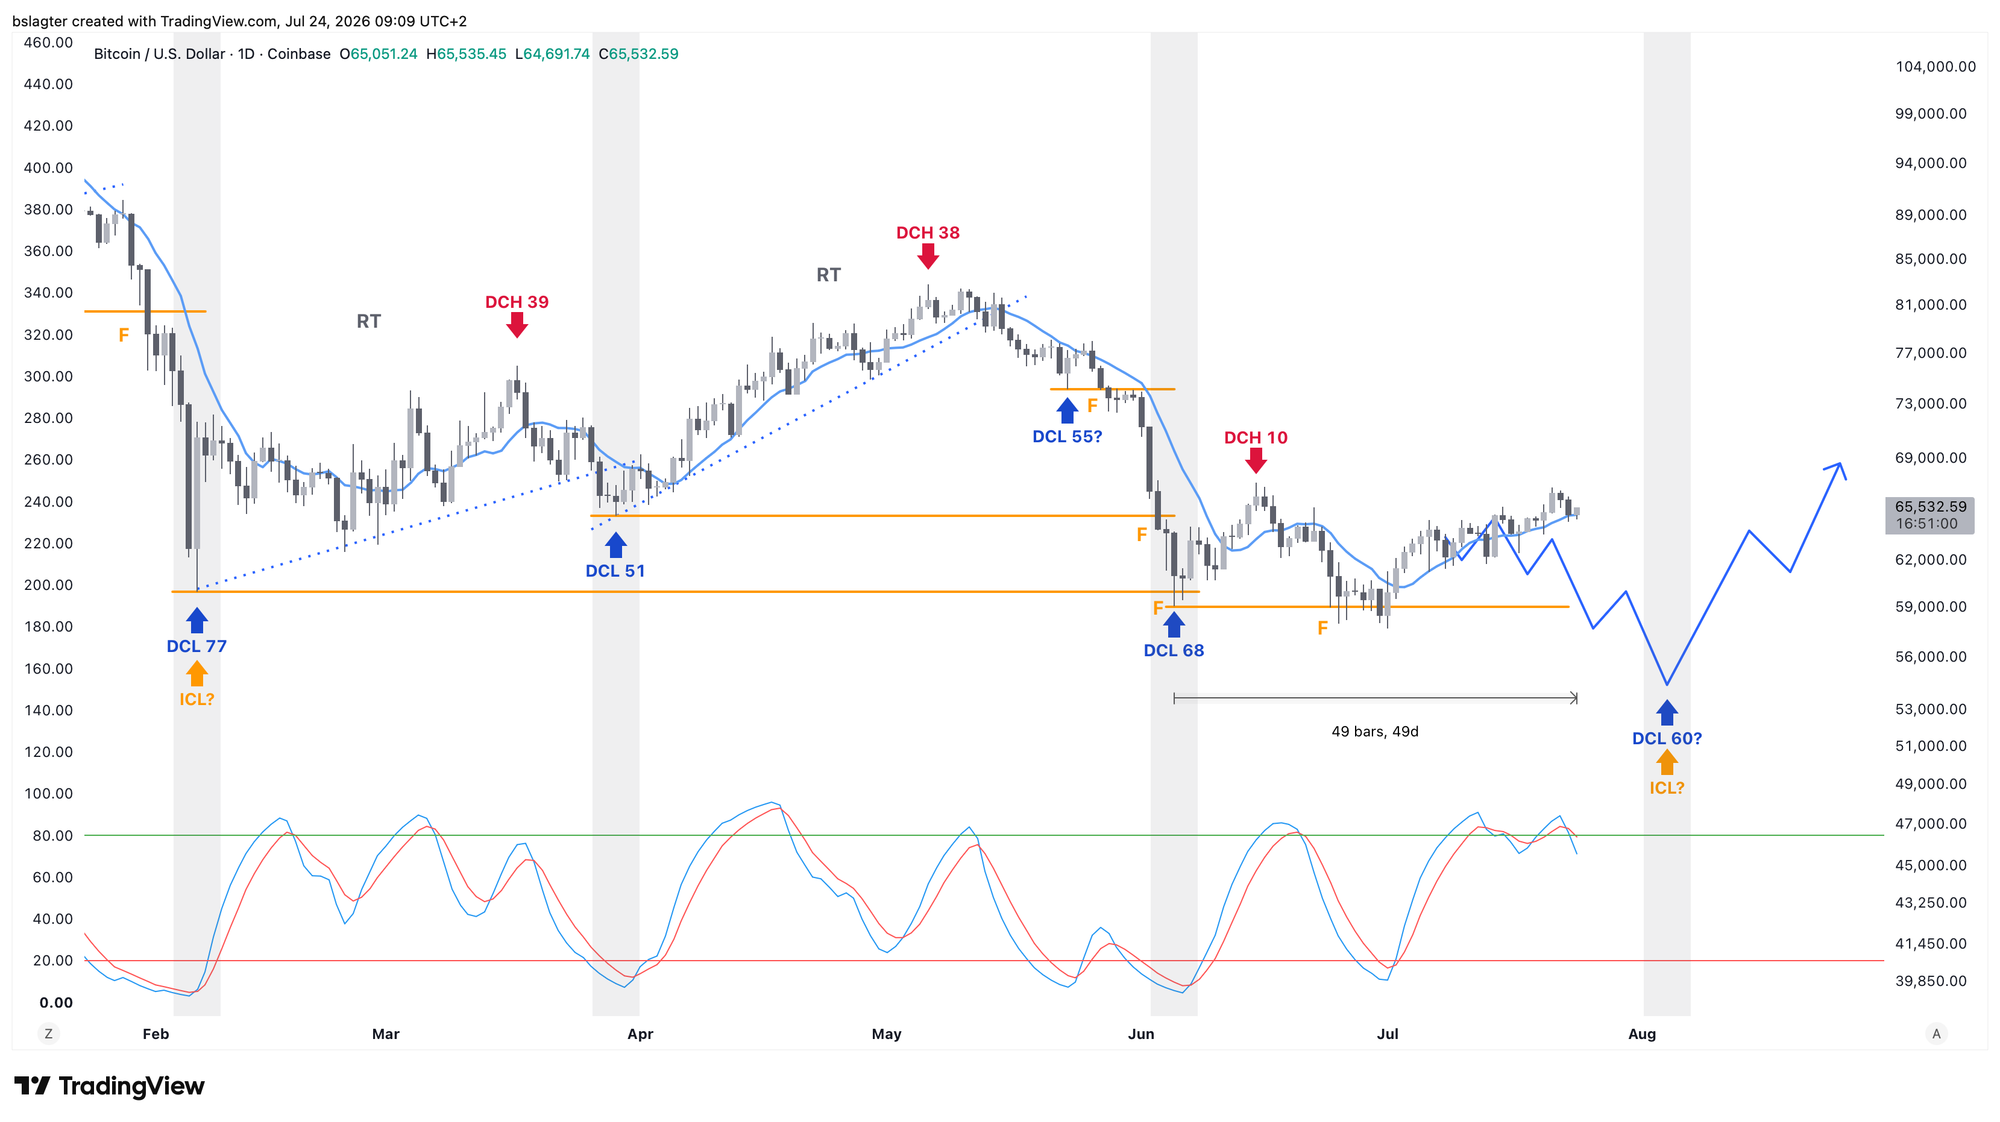
The next chart is the daily cycle. Today is day 49 of an average of 60 days. It seemed likely we'd begin the declining stretch of the cycle over the past week, heading toward the daily cycle low (DCL). That didn't happen; instead we saw another push higher, nicely visible in the double top of the oscillator at the bottom.
Now it really is time for the descent to the DCL. Normally we'd expect it to sit below the half-cycle low of $57,700. That would make the DCL a decent candidate to also be the weekly cycle low (ICL) and yearly cycle low (YCL) at the same time.
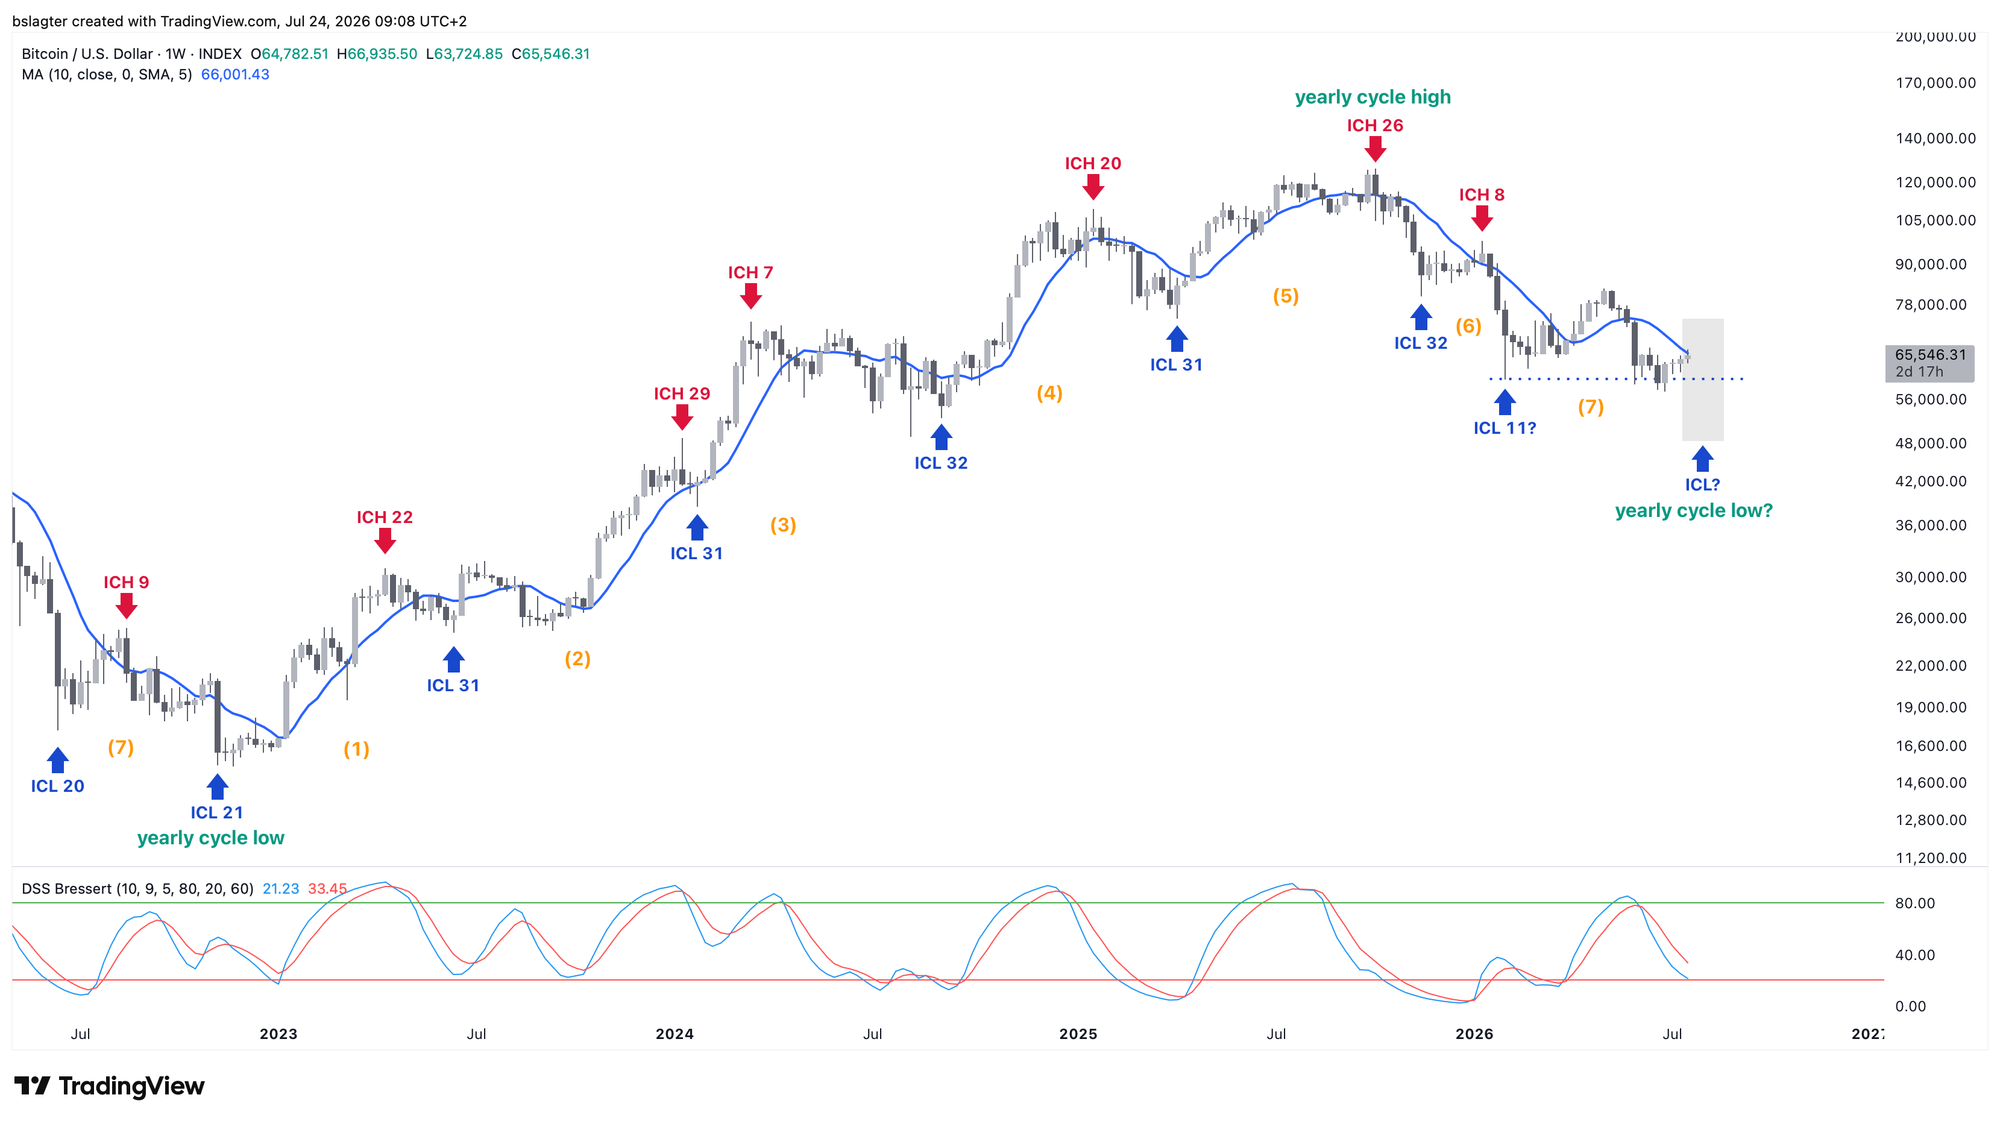
On the weekly cycle chart, we can see the oscillator at the bottom already moving nicely toward the low end. We're in the time window where an ICL would fit just fine.
Of course, alternative scenarios are always conceivable, namely another extra daily cycle within this weekly cycle. We saw that in the summer of 2024, for example. Or another whole extra weekly cycle before we see the bottom of the bear market.
Cycle analysis tells us something about the rhythm of the market, the natural alternation of strength and weakness. It's not a crystal ball that can foresee future events. Escalating wars, imploding bond markets, and panic on the stock market can disrupt or stretch that rhythm.
That's why we work with probabilities. In February, we assigned a very low probability to the scenario that February 6 was the bottom of the bear market. Anything is possible, but not everything is probable. That's different now. It's highly plausible that the coming DCL will be the ICL and the YCL. Now we wait.
A period in which a market moves sideways can easily produce top and bottom formations. On X we're seeing plenty of head-and-shoulders patterns pop up. As a possible top for AI stocks and as a possible bottom for bitcoin.
Such a pattern has little predictive power while it's still incomplete. Only upon confirmation or invalidation does it give a signal. There are plenty of examples of a possible H&S top that fails, after which the price shoots higher like an arrow. Makes sense — that's a strong encouragement for the bulls.
So that applies to the AI bull market. If stocks fail to complete their topping formation and begin a new leg up, things could move fast. For bitcoin, we're of course hoping for the reverse, namely that forming a bottom in this price range does succeed!
We'll continue with the following topics:
- The upward momentum in memory stocks appears broken
- Risks are piling up for bitcoin, but the price holds firm
- AI bull market gets a dotcom-style warning
1️⃣ The upward momentum in memory stocks appears broken
 Contribution by
 Sam
In the section "Alt season vibes at Micron and Sandisk" in the Markets of July 10, we described the importance of the $850 level at Micron and $1,514 at Sandisk. Both have since posted a weekly close below the mentioned levels, and although the price recovered nicely after that weekly close, there's a significant risk of further decline.
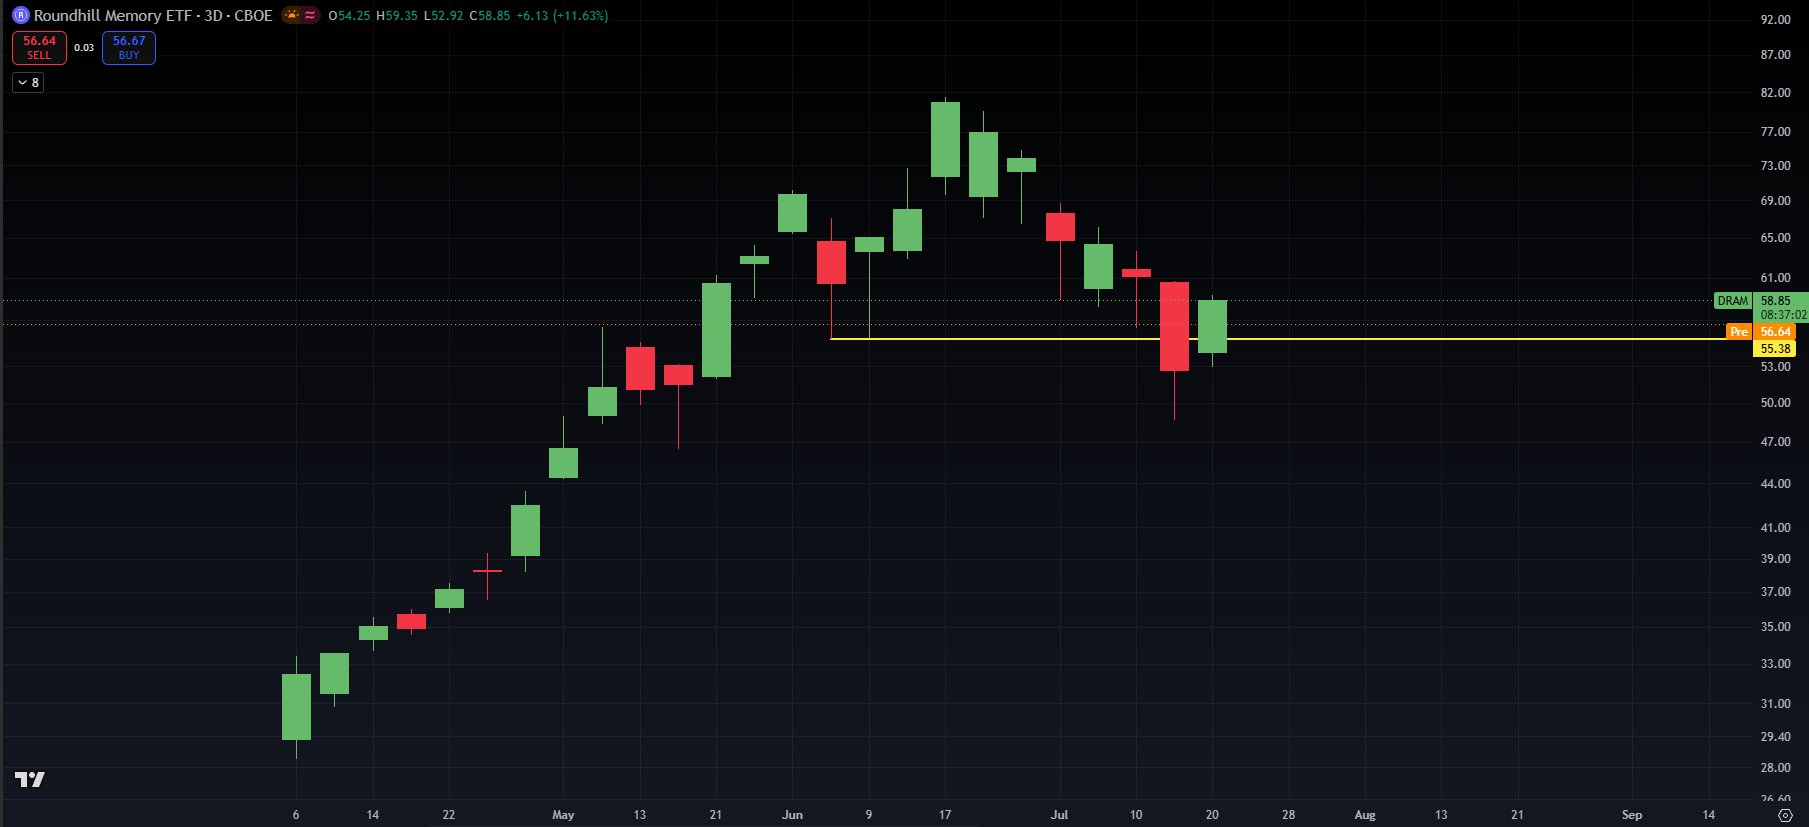
That the upward momentum is under pressure across the sector is also reflected in the Roundhill Memory ETF (DRAM). This is the very first thematic ETF in the world specifically focused on the market for computer memory and data storage. Although it consists of 21 positions, 75% of the fund is allocated to three companies: Samsung, Micron and SK Hynix.
On the 3-day chart below in particular, you can clearly see that a lower low has been set below the yellow line.
If we zoom into the 12-hour chart, we also see several clear interactions with the yellow line, both as support and resistance. It's also apparent that on this timeframe there's still a downtrend of lower highs and lower lows. Only once there's a close on the 12-hour chart above $62.30 will there be a higher high.
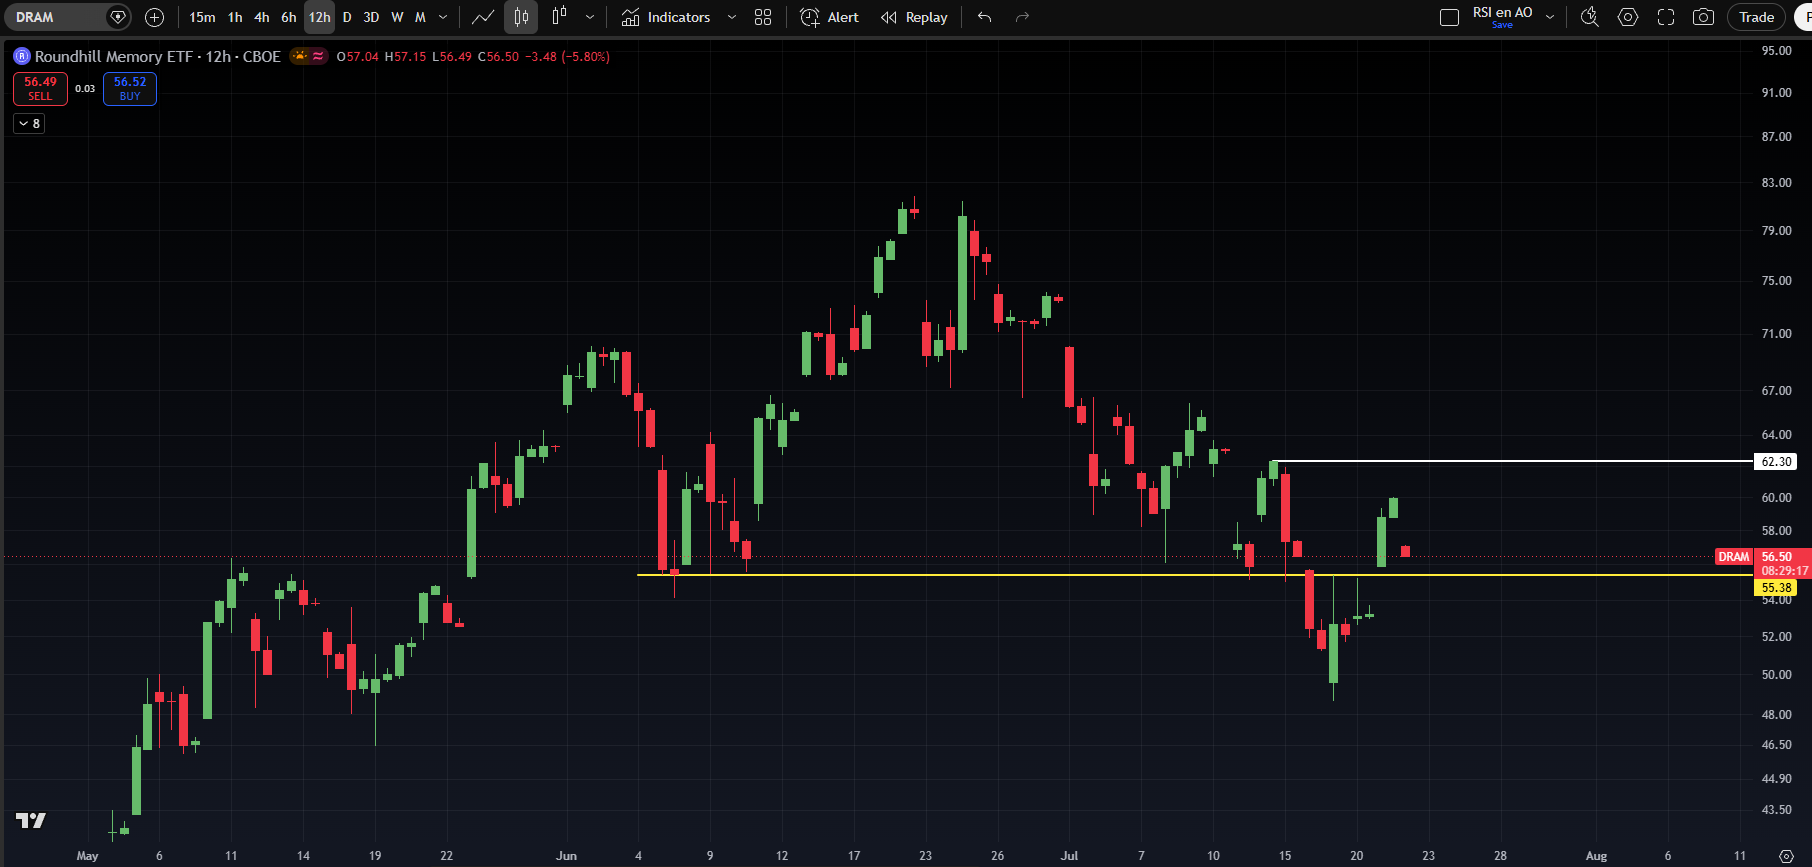
The burden of proof therefore currently lies with the bulls. The period of short, sharp corrections followed by quick new highs seems to be over for now. This is, at the very least, a warning that there's been a change in behavior. It's therefore advisable to at least wait for some strength (a higher high, for instance) rather than blindly buying the small dips and expecting to be quickly rewarded for it.
2️⃣ Risks are piling up for bitcoin, but the price holds firm
 Contribution by
 Thom
The Brent oil price has climbed to $98 at the time of writing due to the further escalation of the war in Iran. As a result, the odds of a rate hike by the US central bank on July 29 have risen to 35.8 percent. Last week those odds were still just 11.8 percent.
For September, the market is now pricing in a 78.8 percent chance of a rate hike. For the remainder of 2026, about 1.68 rate hikes are being factored in.
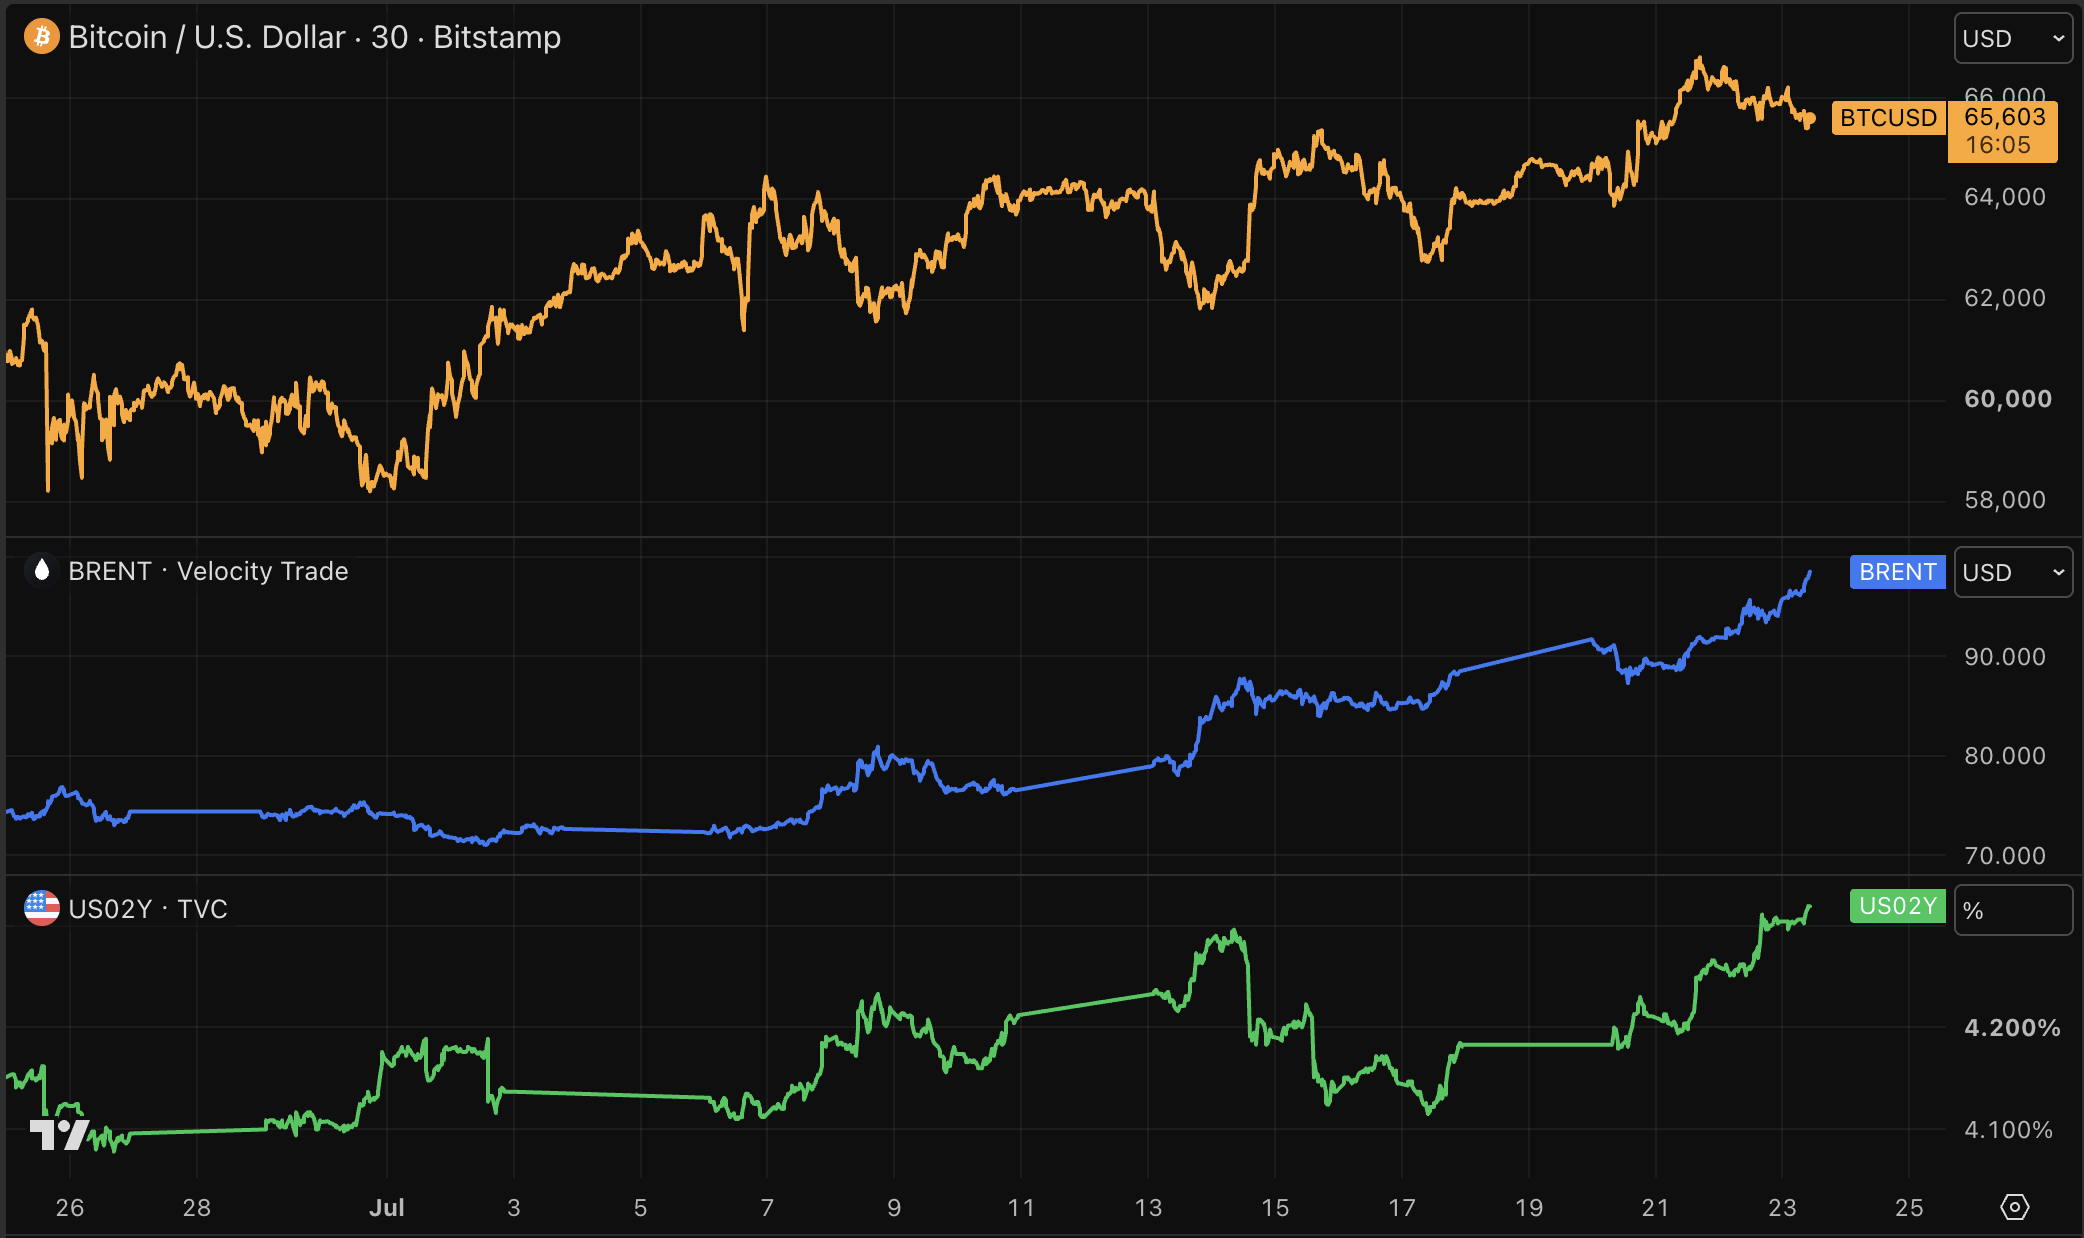
The market is therefore starting to factor in a stricter Federal Reserve as a result of the renewed escalation in Iran and the accompanying rise in the oil price.
Yet a sharp drop in bitcoin's price hasn't materialized for now. The bulls are putting up stiff resistance and risk appetite in the financial markets, though increasingly fragile, is holding up.
The fact that the US dollar index (DXY) hasn't broken out yet is probably because the expected rate paths of other central banks are also becoming stricter. As a result, the interest rate differentials aren't yet moving convincingly in the dollar's favor.
Even so, it seems only a matter of time before risk assets reach their tolerance threshold for higher oil prices. The longer energy prices stay elevated, the greater the chance that inflation expectations and interest rates climb further. At that point, bitcoin's resilience could also be seriously put to the test.
A potential advantage for bitcoin is that investors are increasingly doubting the sustainability of the AI bull market. On Wednesday evening, Alphabet, Google's parent company, presented its quarterly results. Although the company once again raised its investment plans for 2026, from $190 billion to $205 billion, the stock lost 3 percent in after-hours trading.
Investors are no longer content with ever-larger investment budgets. Those must be matched by demonstrable returns, in the form of higher profits, better margins and strong cash flows.
That last point in particular seems to be a sore spot for Alphabet. For the first time since its IPO in 2004, the company reported negative free cash flow.
Combined with bitcoin's relative strength, a further correction within the AI complex could provide extra tailwind. Capital flowing out of overvalued tech stocks could partly find its way to bitcoin.
Still, caution is warranted here too. Bitcoin is balancing on a tightrope. A limited cooling of the AI hype could be beneficial, but if the AI bull market actually comes to an end, the consequences threaten to be far greater.
The enormous wave of investment around AI has by now become a key engine of economic growth, corporate profits and the stock market. If that engine stalls, the risk of a recession rises. In such a darker scenario, I don't expect bitcoin to fully escape the selling pressure.
3️⃣ AI bull market gets a dotcom-style warning
Contribution by Thom
The analysts at JPMorgan Asset Management use a combination of four charts to reveal an interesting parallel between the internet bubble of 2000 and the current AI cycle.
The scary part of a bubble begins the moment the front of the train, in this case hyperscalers like Google, starts to stutter. The stock price stagnates and, for the first time since its 2004 IPO, the company reported negative free cash flow.
For now, the infrastructure suppliers are still reporting extremely strong figures, but the danger is that the source of investment (the hyperscalers) dries up.
In the internet cycle, we saw that in communication services and communication equipment. Top left, you can see that the S&P 500 communication services index had already begun to fall, while communication equipment stocks kept rising for months. So the front of the train started braking while the back was still hitting the gas.
Top right, we see the same thing at the company level. Verizon, closer to the end customer, flattened out. Cisco, the big infrastructure winner of that era, kept rising spectacularly. In hindsight, we know this wasn't a sign of healthy strength, but of a final phase of euphoria.
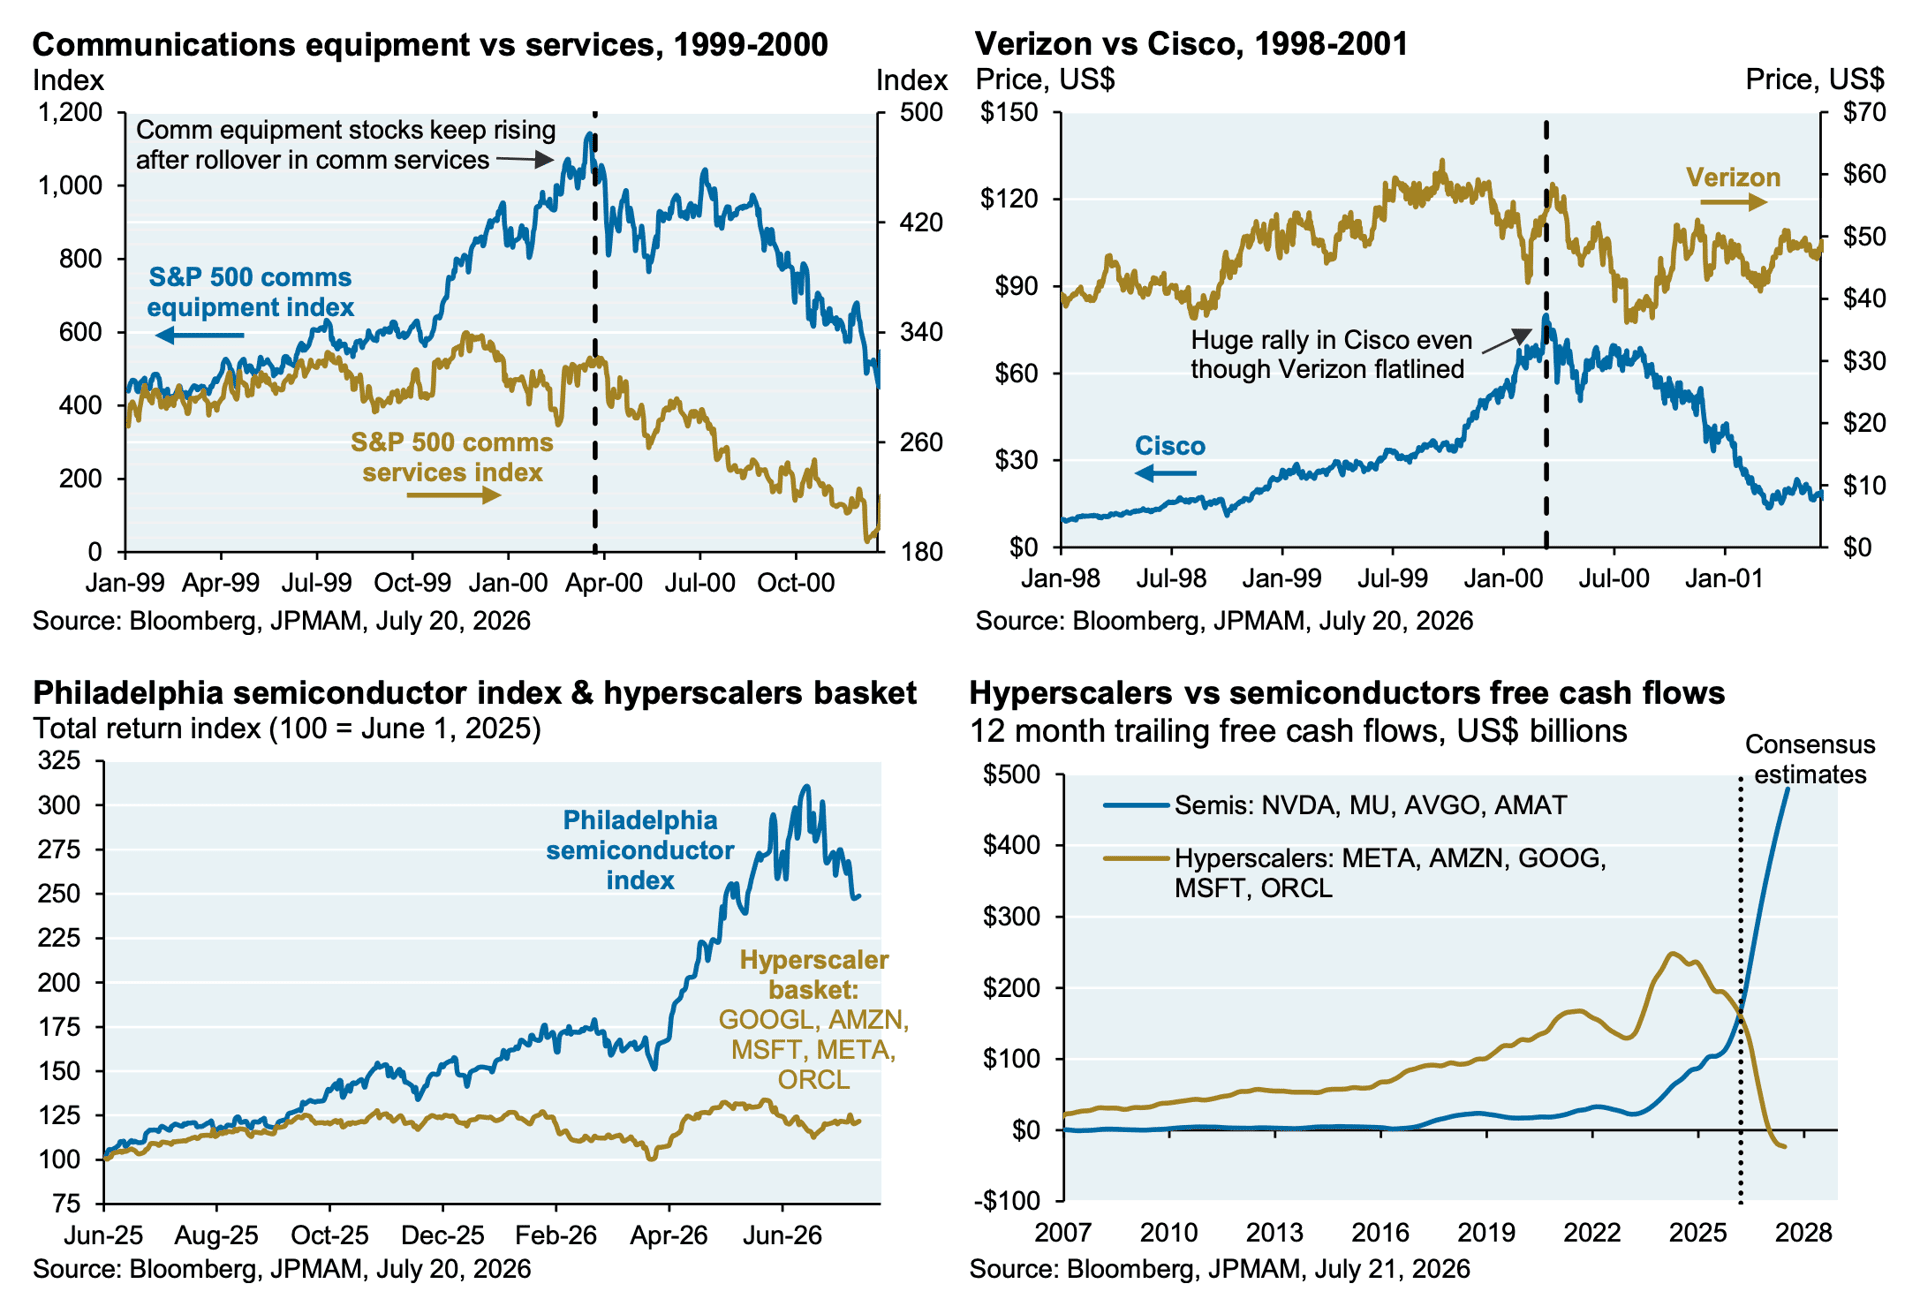
Bottom left, we see that the Philadelphia Semiconductor Index has risen much harder than the hyperscalers Google, Amazon, Microsoft, Meta and Oracle since June 2025. The chipmakers are the clear winners of the AI capex wave. They supply the pickaxes. But the hyperscalers, who have to build the infrastructure and ultimately have to make money, are lagging relatively behind.
Bottom right, the tension becomes even sharper. The free cash flows of semiconductor companies are shooting up, while the free cash flows of hyperscalers are dropping hard.
This is exactly the point where we are now. The AI bull market isn't automatically over. In fact, the geopolitical and economic logic behind a longer AI bull market remains strong. But the market is becoming more critical. Investors don't just want to see more investment, but proof that those investments deliver returns.
In closing
You can read all previous editions of Alpha Markets in the archive. Questions, comments and suggestions are more than welcome in the community.
Thank you for reading!
To stay informed about the latest market developments and insights, follow our team members on X:
- Bart Mol (@Bart_Mol)
- Peter Slagter (@pesla)
- Bert Slagter (@bslagter)
- Mike Lelieveld (@mlelieveld)
We appreciate your continued support and look forward to bringing you more comprehensive analysis in our next edition.
Until then!