Trading with Fibonacci
Fibonacci levels are a trader favorite for timing entries and exits. What are the golden pocket, retracements, and other key signals traders are watching right now?

Sam
Fibonacci was a 13th-century Italian mathematician who became famous for the Fibonacci sequence: a series of numbers where each number is the sum of the two preceding ones (0, 1, 1, 2, 3, 5, 8, 13, …). The ratio between consecutive numbers approaches the golden ratio: 1.618.
Fibonacci's number sequence is also widely used in technical analysis of financial markets. For instance, we often see a reversal after a counter-move has retraced 61.8% of a prior move. That level marks the beginning of the so-called 'golden pocket,' which runs from 61.8% to 65%.
Before we dive into the application of these percentages, it's important to know that they don't constitute a proven predictive model. You could perhaps argue that it works because so many traders watch these levels: a self-fulfilling prophecy.
The chart below shows how we establish these Fibonacci levels. First, we identify the swing high and swing low between which we'll measure. A swing high is a peak preceded and followed by a lower peak. For a swing low, shown on the right side of the chart, the opposite applies.
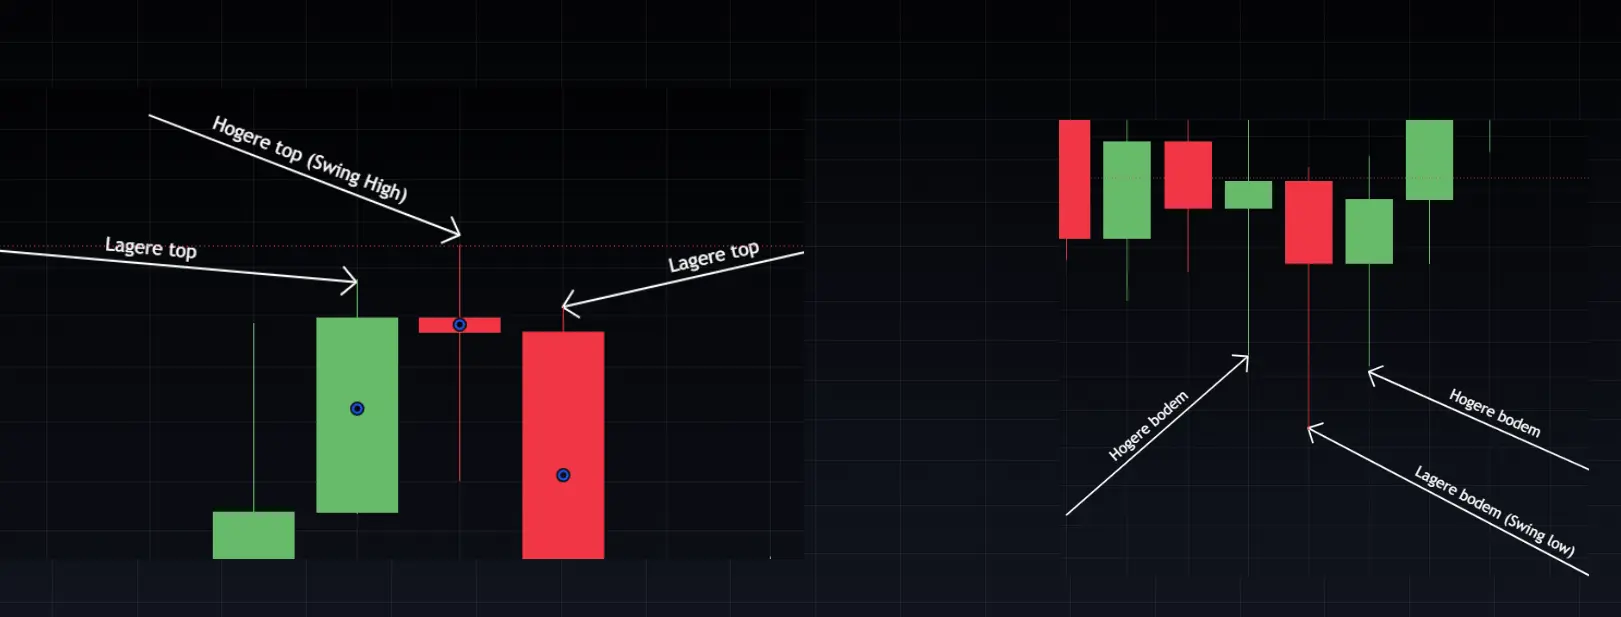
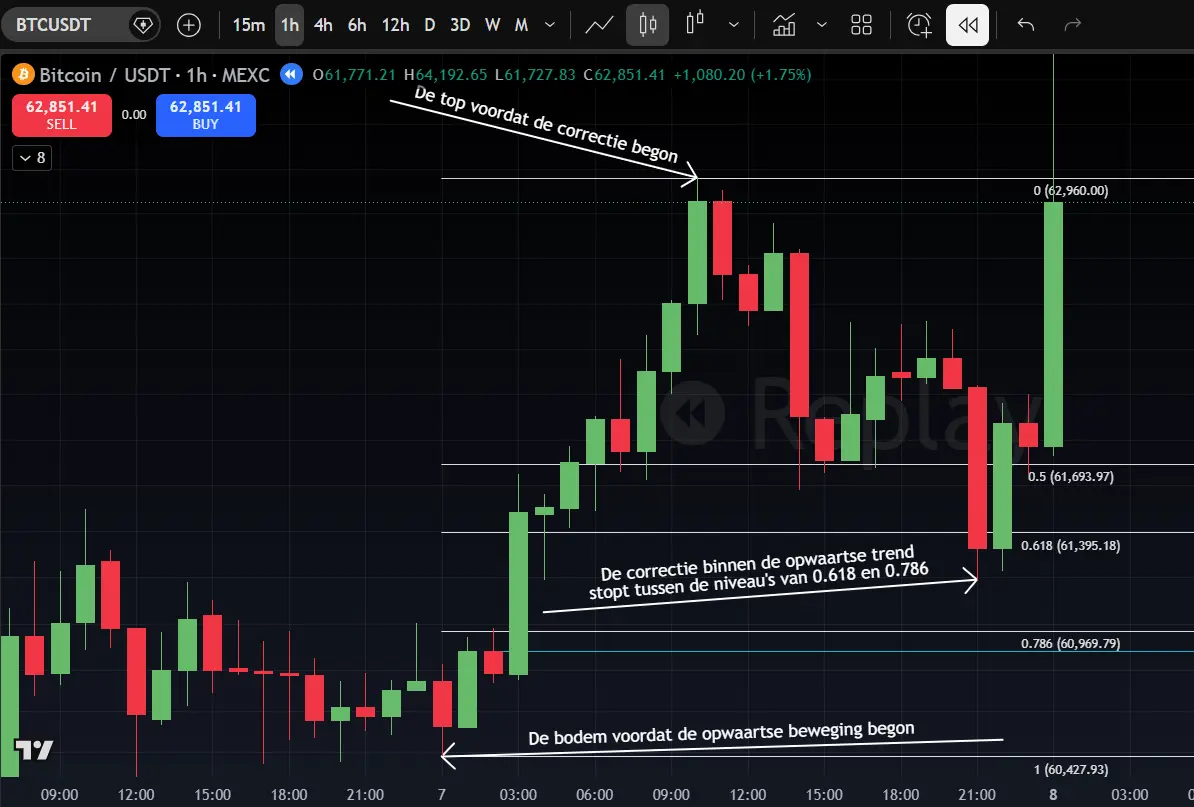
In an uptrending market, you select the last clear low before a strong move upward to a higher high took place. You determine the top by waiting until a clearly visible correction has begun. As shown below, the correction within the uptrend ends around the golden pocket.
Now that you understand how traders look at Fibonacci on a chart, we can discuss a possible reason why it often works.
If we simplify the principle, you could say that at a bottom, the market considered the price cheap. Few sellers wanted to sell at that level, and buyers saw it as an attractive price. At a top, the opposite applies: the market deemed it too expensive, and sellers gained the upper hand.
If we then take the midpoint (50% or 0.5) between expensive and cheap, you get a kind of 'fair' price as determined by the market. If the price is above 50%, buyers are paying a premium, and below 50%, you could see it as a discount. Just like bargain hunters everywhere, traders love a discount.
Not only do traders love a discount, good traders also actively seek asymmetric positions. That means they want a risk/reward ratio greater than 1: measured from the 0.618 level to the top, they get back €1.62 for every euro they risk. From the 0.786 level to the top, that already rises to €3.67.
Many traders use a rule of thumb that they want to earn €2 to €3 per euro risked on a winning trade. This way, they can achieve very attractive returns by being right on just half of their trades.
Finally, many traders adhere to the principle that a trend continues until proven otherwise. An early warning sign is when a correction gives back more than 80% of the upward move. You could then argue that buyers lack a certain urgency to buy, or that sellers still consider the price expensive. This is a warning of weakness and in many cases leads to a pause or end of the — in this example — uptrend.
Let's project the above onto bitcoin's current situation, using the downward move from $74,000 to $59,000 as the price range between which we'll measure. As shown in the chart below, this produces the following values:
50% = $66,700
61.8% = $68,500
78.6% = $71,000
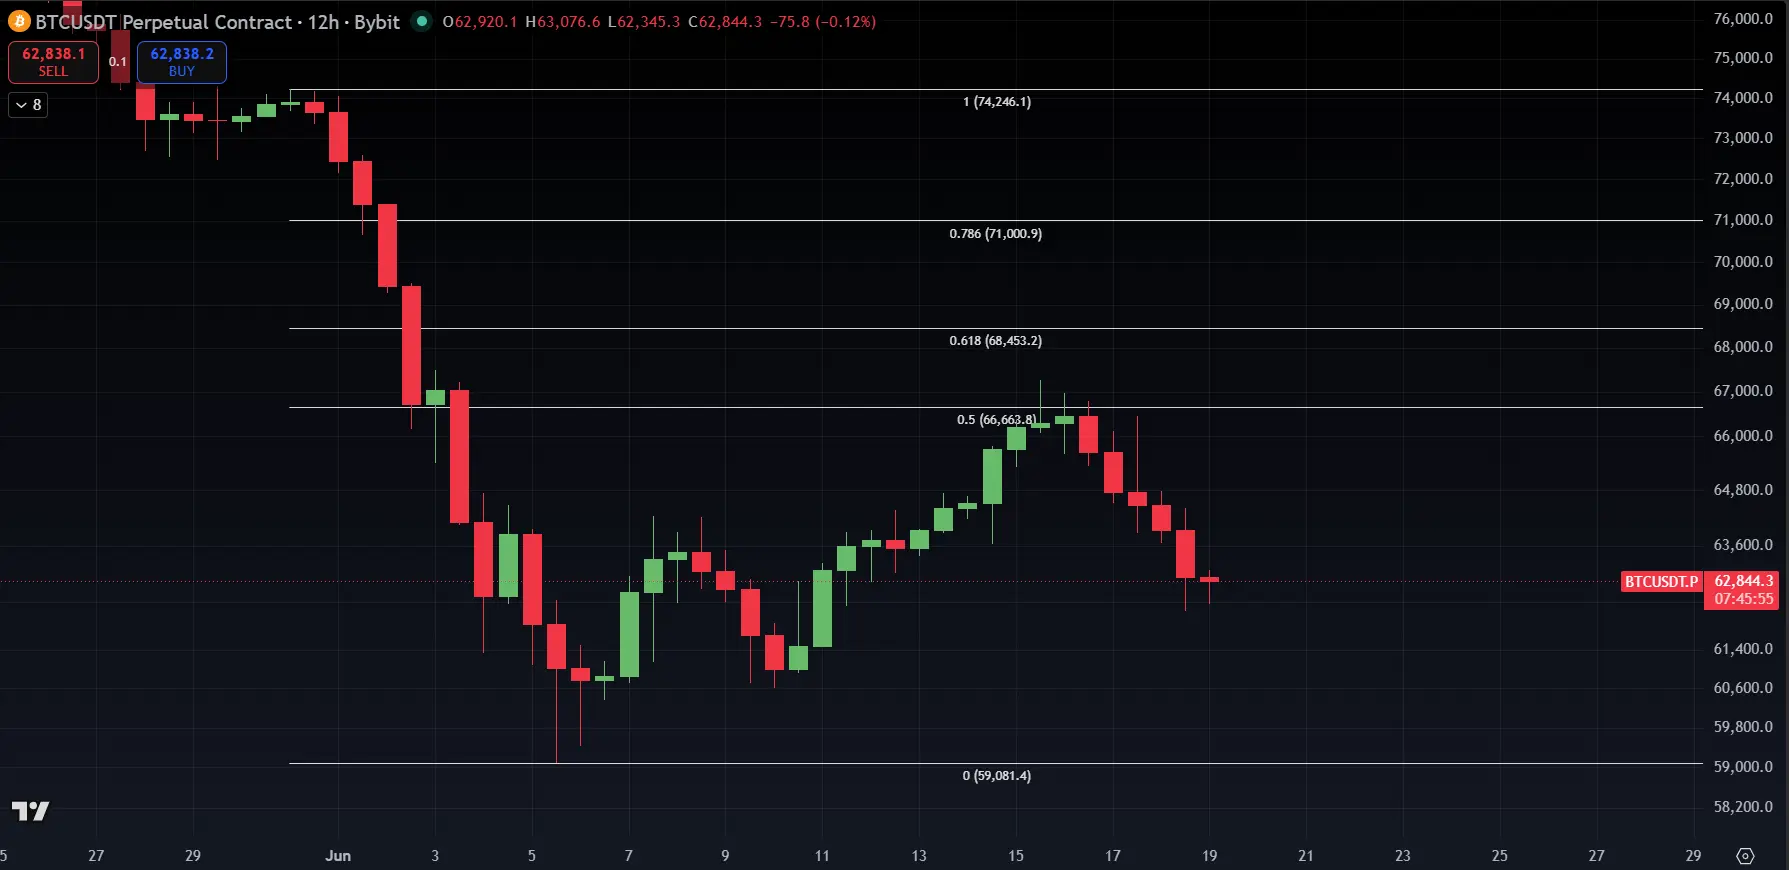
The expectation is that if the current rally has more room to run, it will end somewhere between roughly $67,000 and $71,000, in line with the downtrend.
If you bought at $60,000 and want to take profits, there's a fairly significant percentage difference between $67,000 and $71,000. You can anticipate this by waiting until a lower low is established on a lower timeframe, for example on the 1-hour or 4-hour chart. This can of course lead to false signals, but at least there's an objective plan behind it.
Another option would be to look for additional warning signals within that price range, such as bearish divergence on the RSI, contact with a key declining EMA, or simply a previously proven resistance level.
That brings us back to Fibonacci himself. The Italian mathematician probably never could have imagined that his number sequence would appear on millions of screens centuries later. Yet that's exactly what happens. Fibonacci isn't a crystal ball, but it is one of the most popular ways to bring order to the ongoing battle between buyers and sellers.
July 1 | Community Event | Bitvavo x Bitcoin Alpha
Bitvavo and Bitcoin Alpha are hosting a meetup at Bitvavo's office on July 1. We kick off at 4:30 PM. There will be a substantive program, and we'll wrap up with drinks. All in all, we'll be heading home around 7:30 PM.
We'll be talking about trading with leverage. What is it, how does it work, when is it useful, and can it be done safely?
Bitvavo will then give a behind-the-scenes look: how do you develop a complex feature like margin trading? From the initial ideas and user insights to design, compliance, risk management, engineering, and extensive testing.
Sign up: https://btca.nl/bitvavo
We continue with the following topics for our Alpha Plus members:
- The beast called HYPE
- xxx
- xxx
1️⃣ The beast called HYPE
Sam
HYPE continues to perform exceptionally well this year, setting yet another all-time high this week. By zooming out, we can see that it's not particularly surprising that a higher low and higher high have been established, in line with the uptrend. Additionally, the previous all-time high from September 2025 has been tested three times as support, and every weekly close has remained above it.
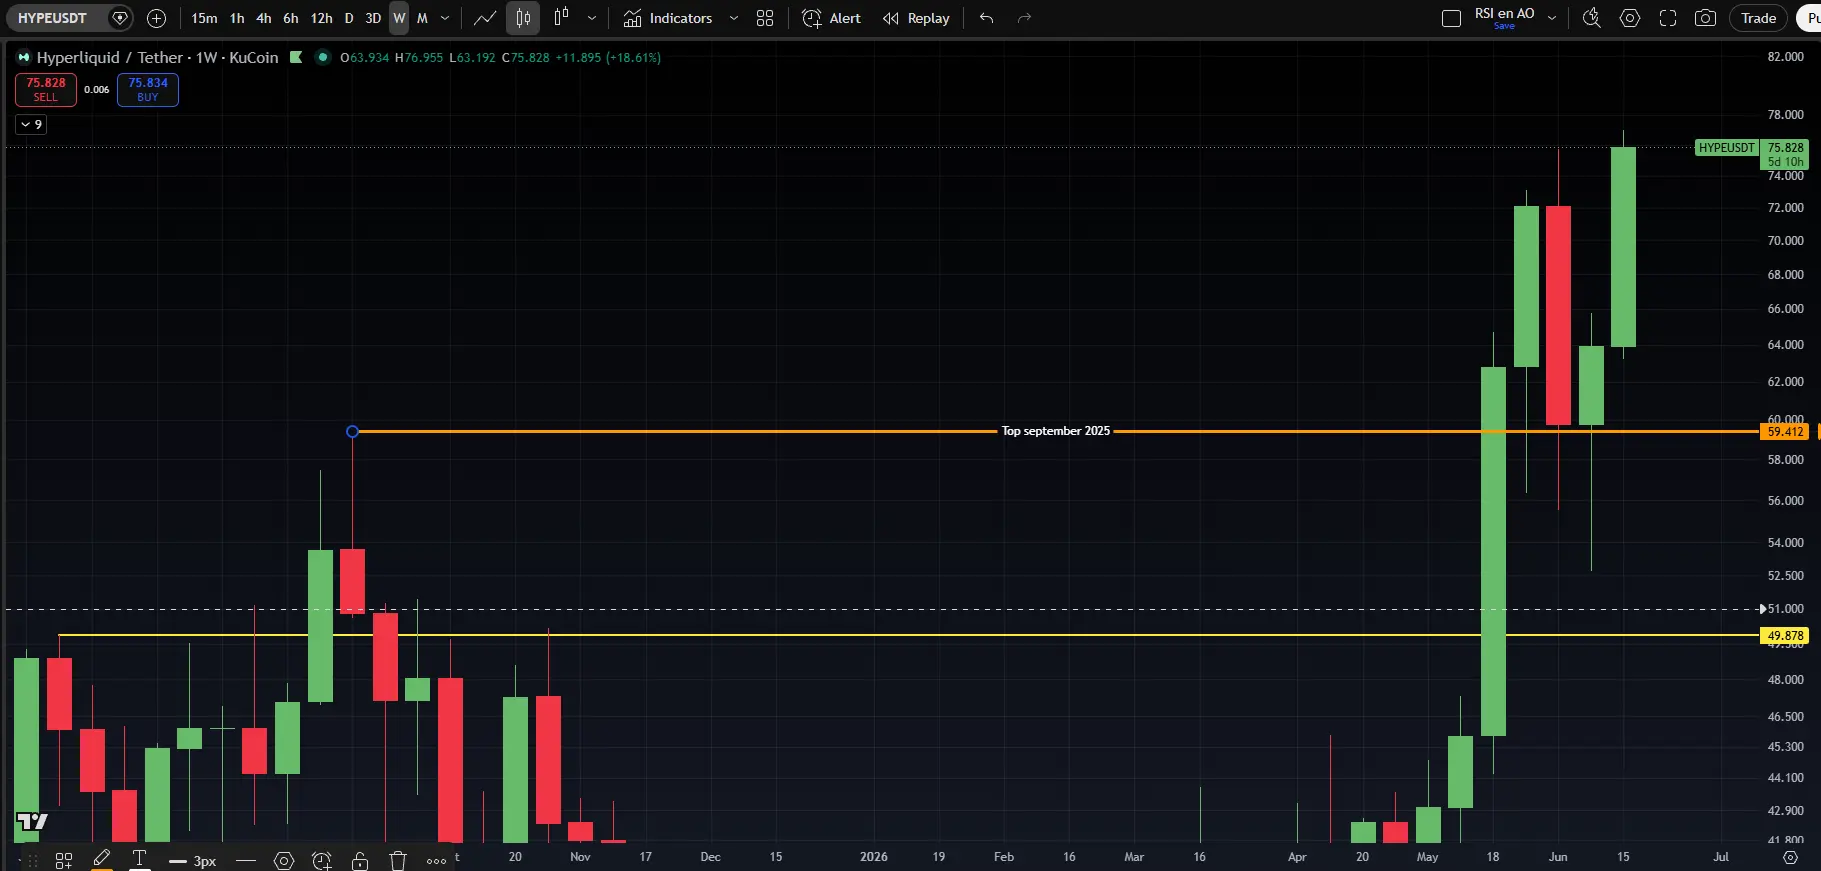
If we also look at the Fibonacci levels below, the bottom was set almost perfectly at the 0.618 level:
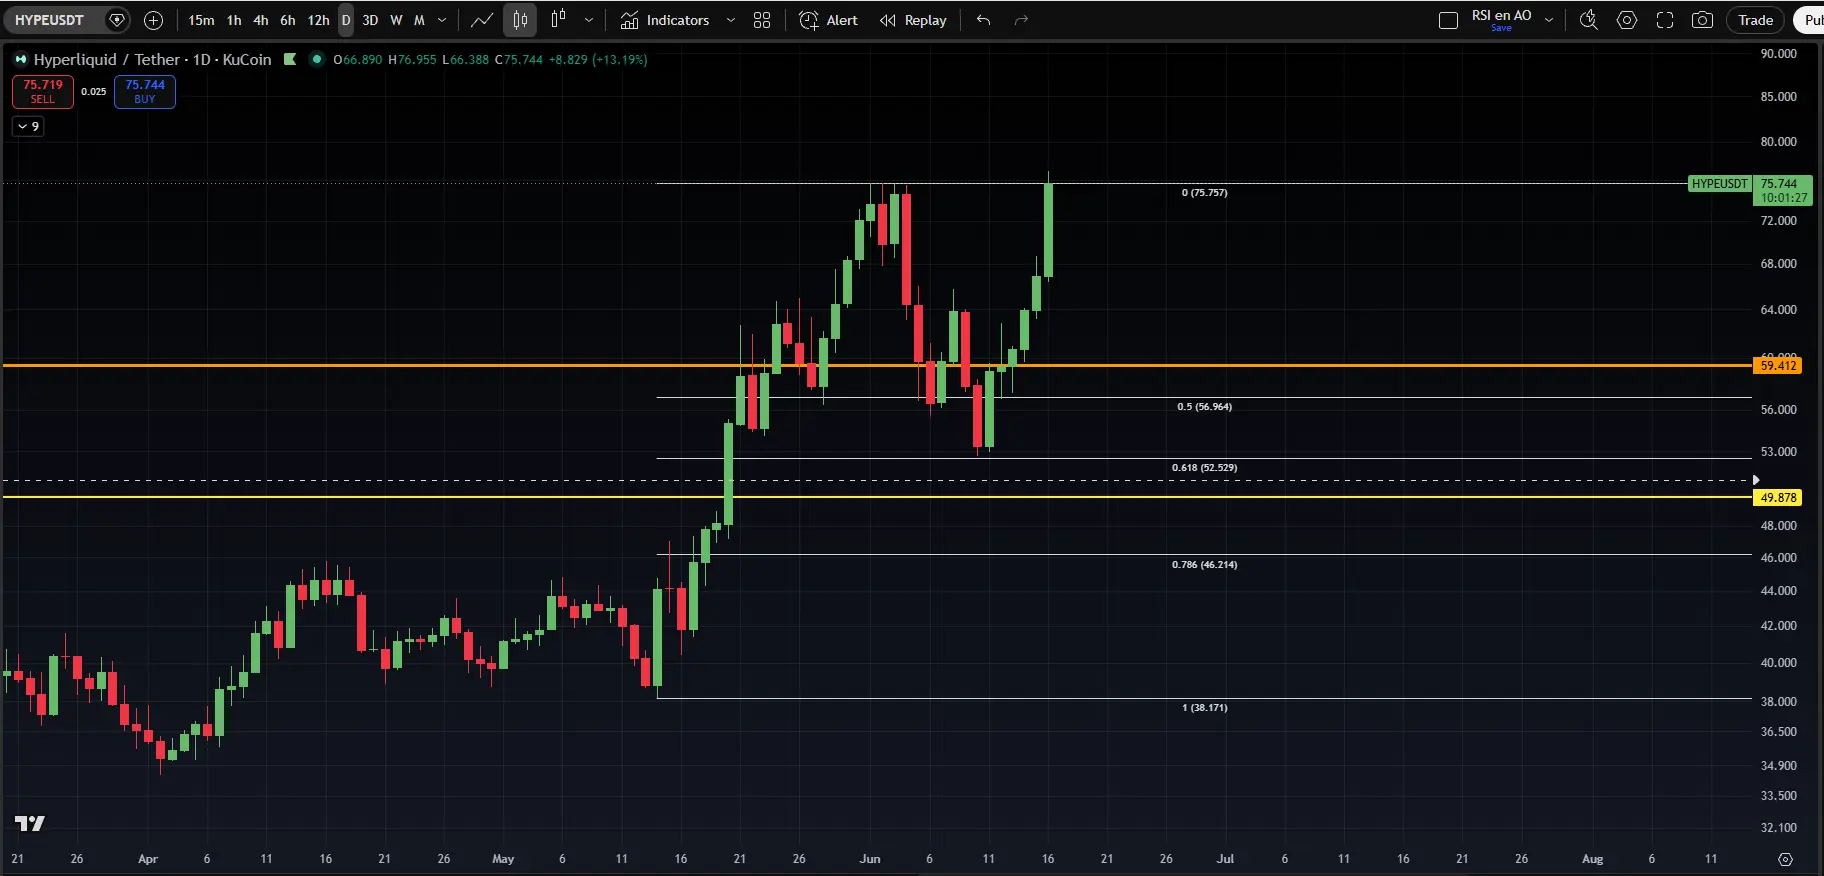
And yet, timing this bottom was far from easy. On the daily chart, lower highs and lower lows had already formed, and it was entirely plausible that the price could have dropped another 10 to 15 percent in line with that downtrend before finding support.
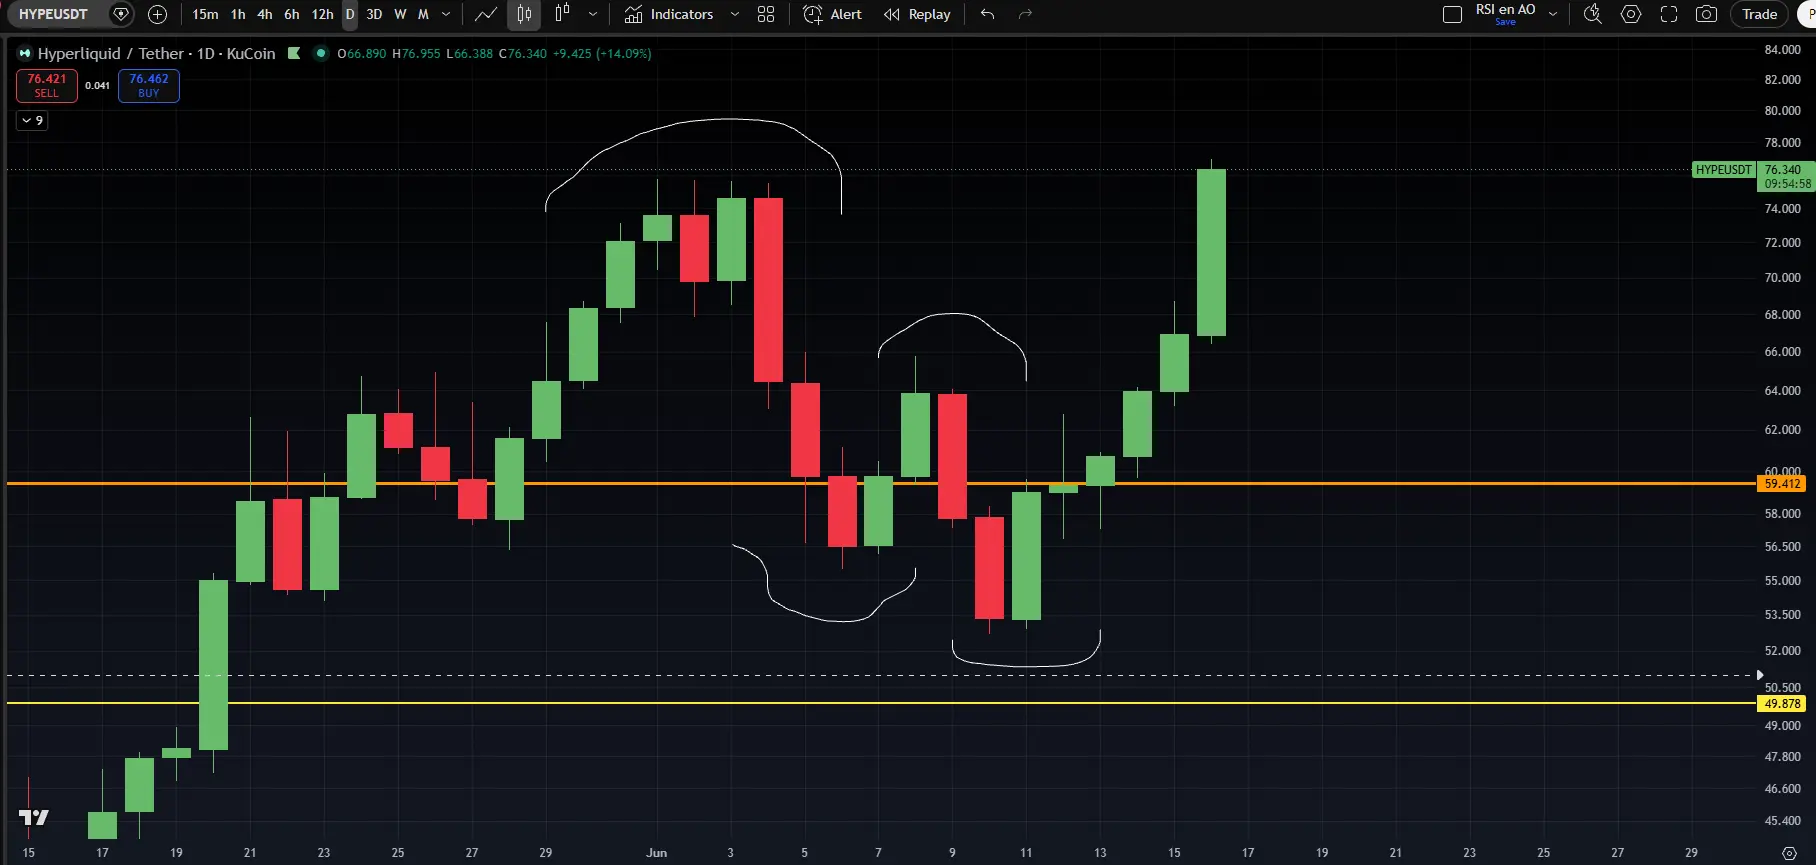
However, when a daily close came in above $66, a higher high was established. But it wasn't really followed by a higher low — instead, it pushed almost directly to a new all-time high. Great to see that much strength, unless you were sitting on the sidelines.
Should a cooldown toward $62 to $66 occur in the coming period, that would be a logical area to look at gaining some exposure to HYPE.
2️⃣ Markets look calm on the surface, but there's a storm under the hood
Thom
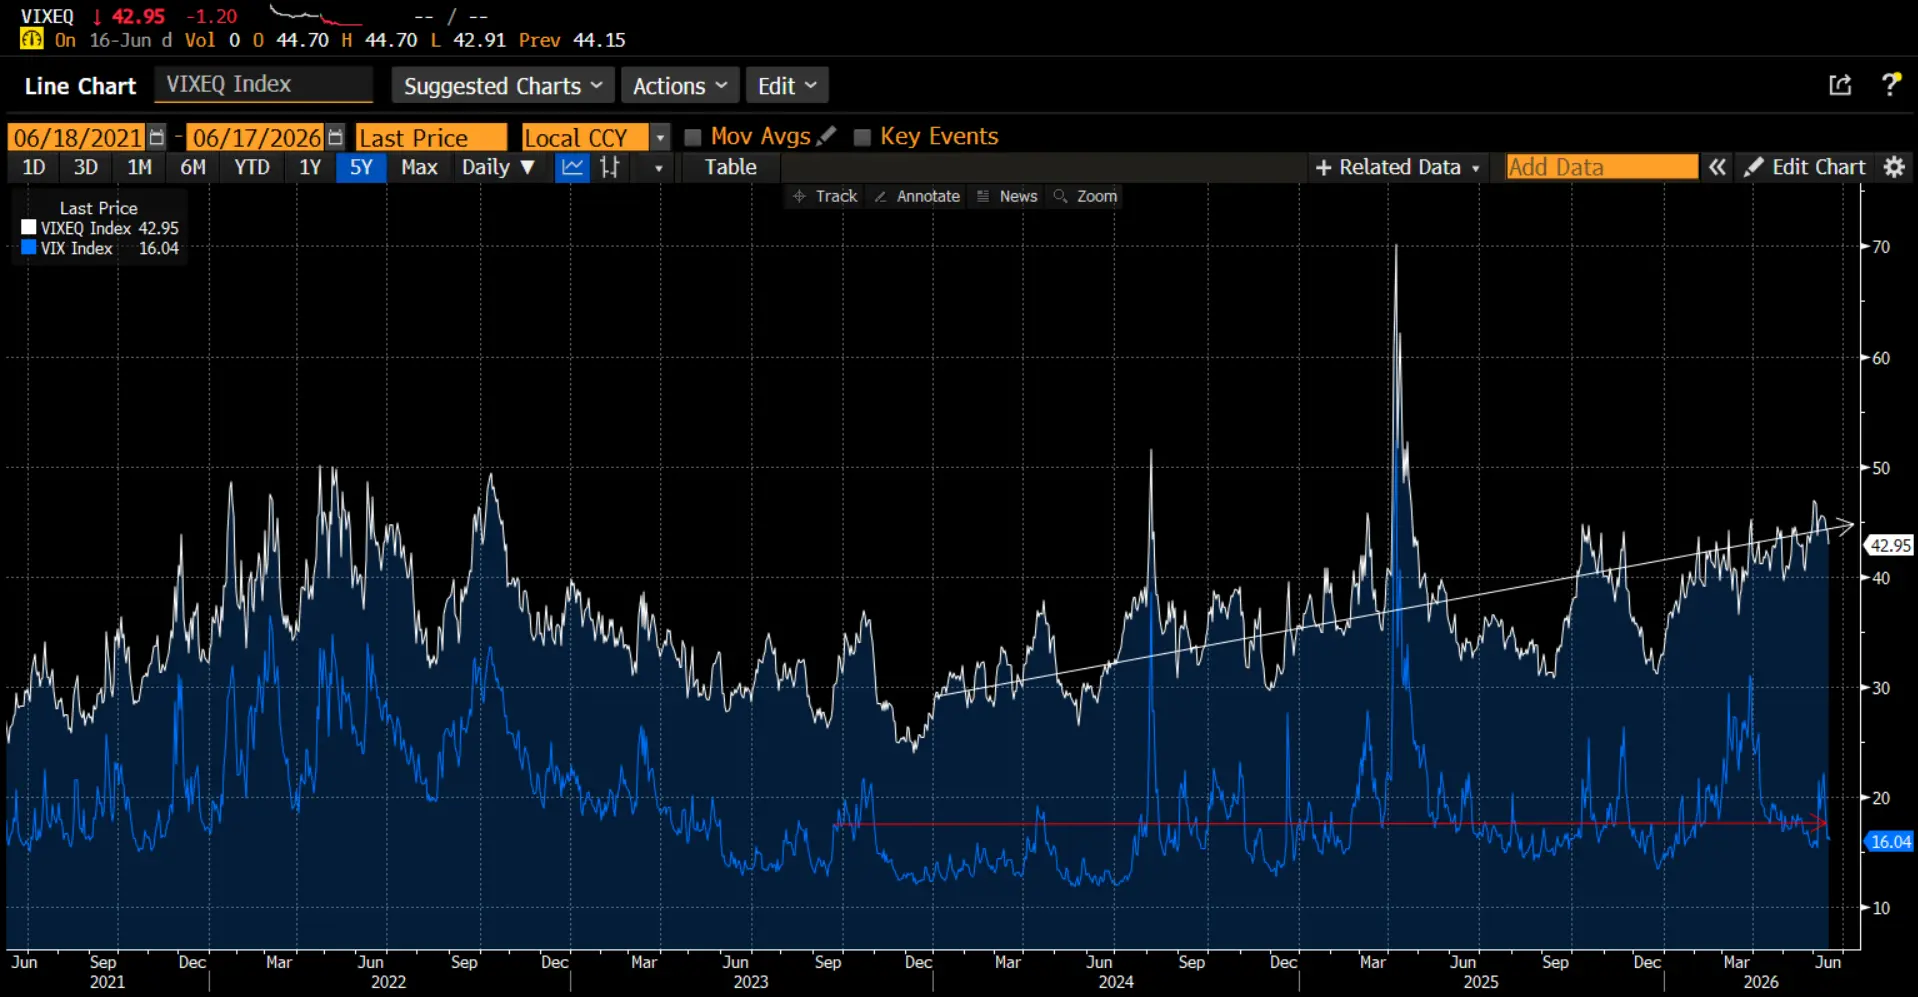
If you only look at the VIX, an index that tracks stock market volatility, you'd get the impression that not much is going on. Wall Street's best-known fear gauge is trading around 16 points, a level that is historically fairly normal. Based on that, you might conclude that investors aren't particularly worried about the future.
Under the hood, however, the picture looks very different.
Data from options exchange Cboe shows that the average volatility of individual stocks has actually been steadily rising in recent years. More and more stocks are making exceptionally large moves, while the broad S&P 500 as a whole remains relatively stable — see the blue line.
If you look, for example, at the volatility of the average stock within the index, shown in white, you'll see it has been climbing for several years and now ranks among the highest 20 percent of readings over the past five years.
Normally, most stocks largely move in the same direction. When the economy is strong, most companies rise. During a recession, they decline together. The correlation between them is high.
Right now, that's different.
The implied correlation between stocks has dropped to a level that rarely occurs. Some companies are surging thanks to enthusiasm around artificial intelligence, while other sectors are under pressure from higher interest rates, weak consumer demand, or disappointing earnings.
This creates a market where the index barely moves, but individual stocks are seeing enormous swings.
A handful of large tech companies are pulling U.S. stock indices to new records, while many other stocks are struggling to keep up. As a result, the market looks strong at first glance, while the gap between winners and losers is wider than it has been in years.
For bitcoin, that's an important observation. The data shows that financial markets are currently not moving as one. Capital is concentrating in a limited number of AI stocks, while many other risk assets are struggling to attract investors. For now, bitcoin also falls into that latter category.
3️⃣ Oil prices down 30%, yet the Fed is leaning toward higher rates
Thom
Kevin Warsh was probably nominated by Donald Trump for the chairmanship of the Federal Reserve because he had long advocated that AI would unleash a productivity revolution. That revolution would structurally suppress inflation, which according to Warsh would give the Fed room to cut rates.
This week, however, it became clear that his colleagues at the Federal Reserve see things very differently for now. No fewer than nine members of the rate-setting committee expect at least one rate hike in 2026. Six of them even anticipate multiple hikes.
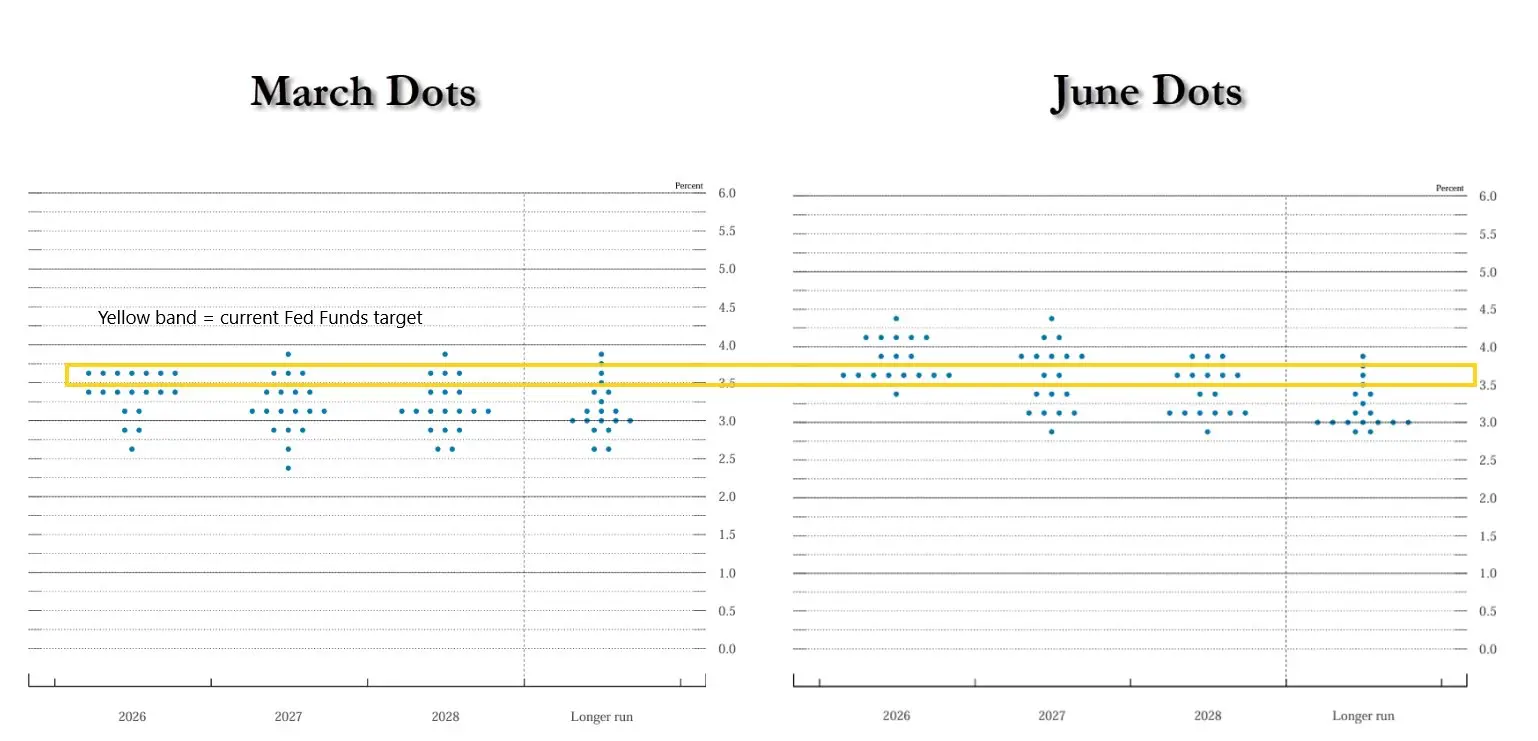
That's striking. In March, the committee was still leaning toward rate cuts, while oil prices were roughly 30 percent higher at the time. By now, the futures market is also pricing in approximately one and a half rate hikes for 2026.
The big question is why the Fed and the market are factoring in a tighter rate path right now, even as oil prices have dropped significantly.
Personally, I suspect we shouldn't read too much into these expectations. Inflation is still too high, and as long as normal traffic through the Strait of Hormuz hasn't fully resumed, it makes sense for the Federal Reserve to hedge its bets.
After all, we've heard before that peace and the reopening of the Strait of Hormuz were supposedly just days away.
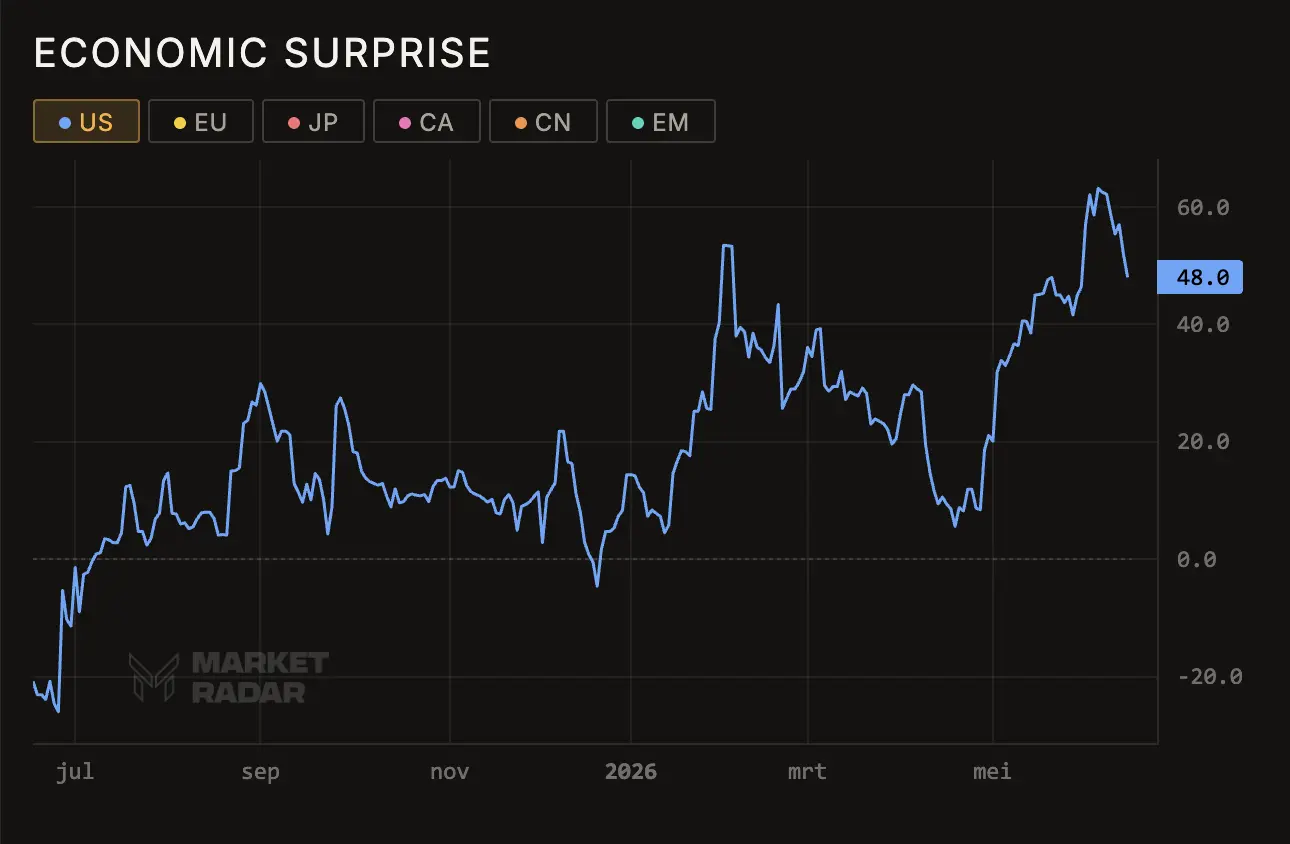
On top of that, the U.S. economy has delivered a remarkably strong run of positive surprises since the start of the war. The labor market proved more resilient than expected, and consumer spending also appears to be accelerating again. At the same time, that acceleration was accompanied by a sharp jump in commodity prices.
Each of these developments argues against rate cuts. In fact, you could make the case that the end of the Iran war actually removes the biggest threat to economic growth. That primarily leaves a scenario where the economy is strong and inflation potentially remains elevated.
For the economy as a whole, that's not necessarily bad news. A strong economy that doesn't need rate cuts remains fundamentally a healthy environment for companies with high earnings growth — especially as long as investors accept higher rates and remain willing to pay for growth.
That inevitably leads you to AI and technology. That's where earnings expectations are strongest, the growth narrative is most compelling, and risk appetite remains the highest. In the short term, I therefore see little reason why the bull market in AI stocks would have to end anytime soon.
For bitcoin, this creates reasonable conditions to quietly build the foundation for the next bull run. Sooner or later, even the AI craze will peak and the market will go looking for a new narrative.
With the next bitcoin halving approaching, bitcoin's absolute scarcity could once again capture attention. If that coincides with renewed focus on the theme of rising government debt, bitcoin could easily catch a tailwind once more.
In closing
All previous editions of Alpha Markets can be found in the archive. Questions, comments, and suggestions are always welcome in the community.
Thank you for reading!
To stay informed about the latest market developments and insights, follow our team members on X:
- Bart Mol (@Bart_Mol)
- Peter Slagter (@pesla)
- Bert Slagter (@bslagter)
- Mike Lelieveld (@mlelieveld)
We appreciate your continued support and look forward to bringing you more comprehensive analysis in our next edition.
Until then!