Scapegoat
Bitcoin plunged nearly 20% to just above $60,000 this week. Strategy's first BTC sale since 2022 and a controversial raid on its dollar reserve accelerated the selloff — and the bloodhounds smell weakness.

MSTR is basically Terra Luna. The only question is when does the music stop. — Charles Edwards
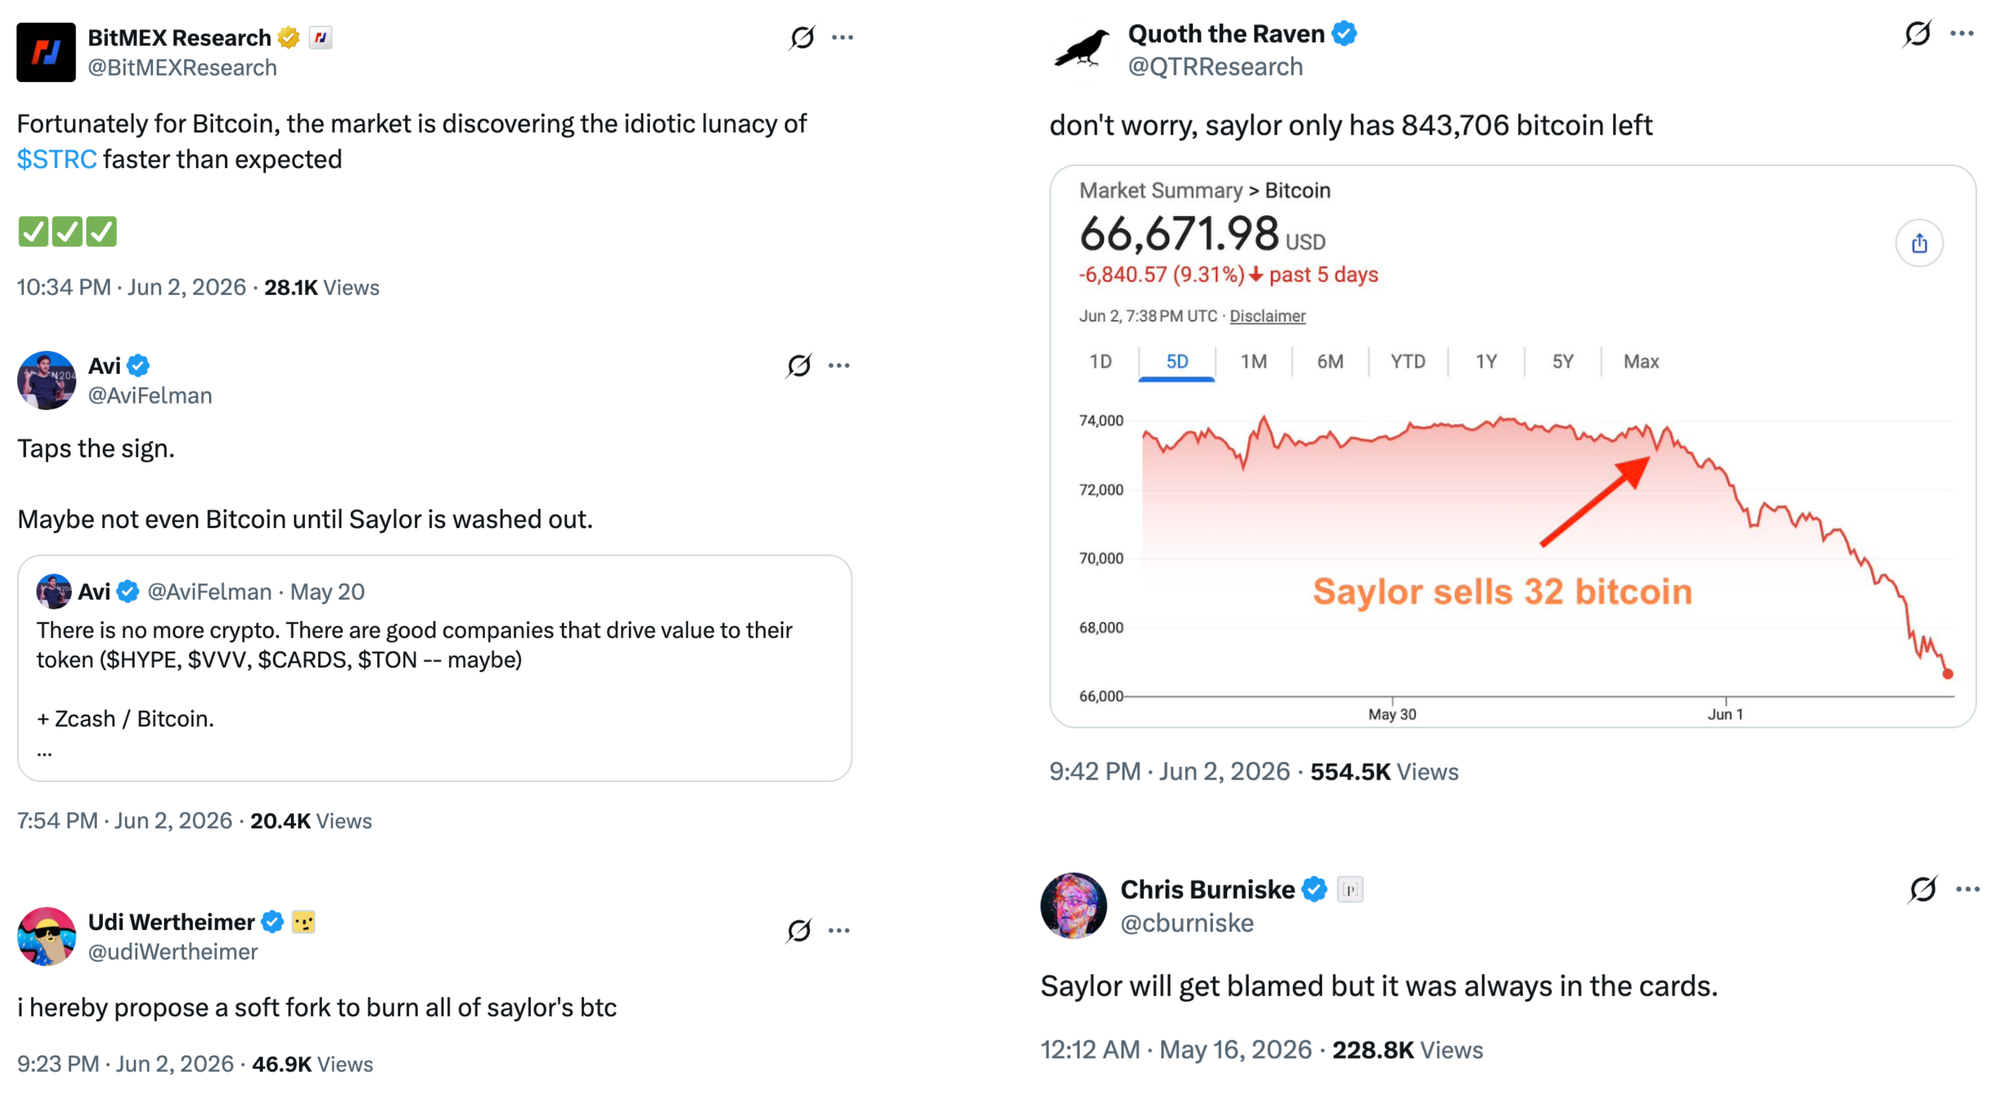
Every bull market has its hero and every bear market its villain. In this bear market, Michael Saylor is the fall guy. The new bull market can only begin once Strategy has imploded and sold all its bitcoin — or so the story goes.
The reason for the public outrage is a combination of two decisions:
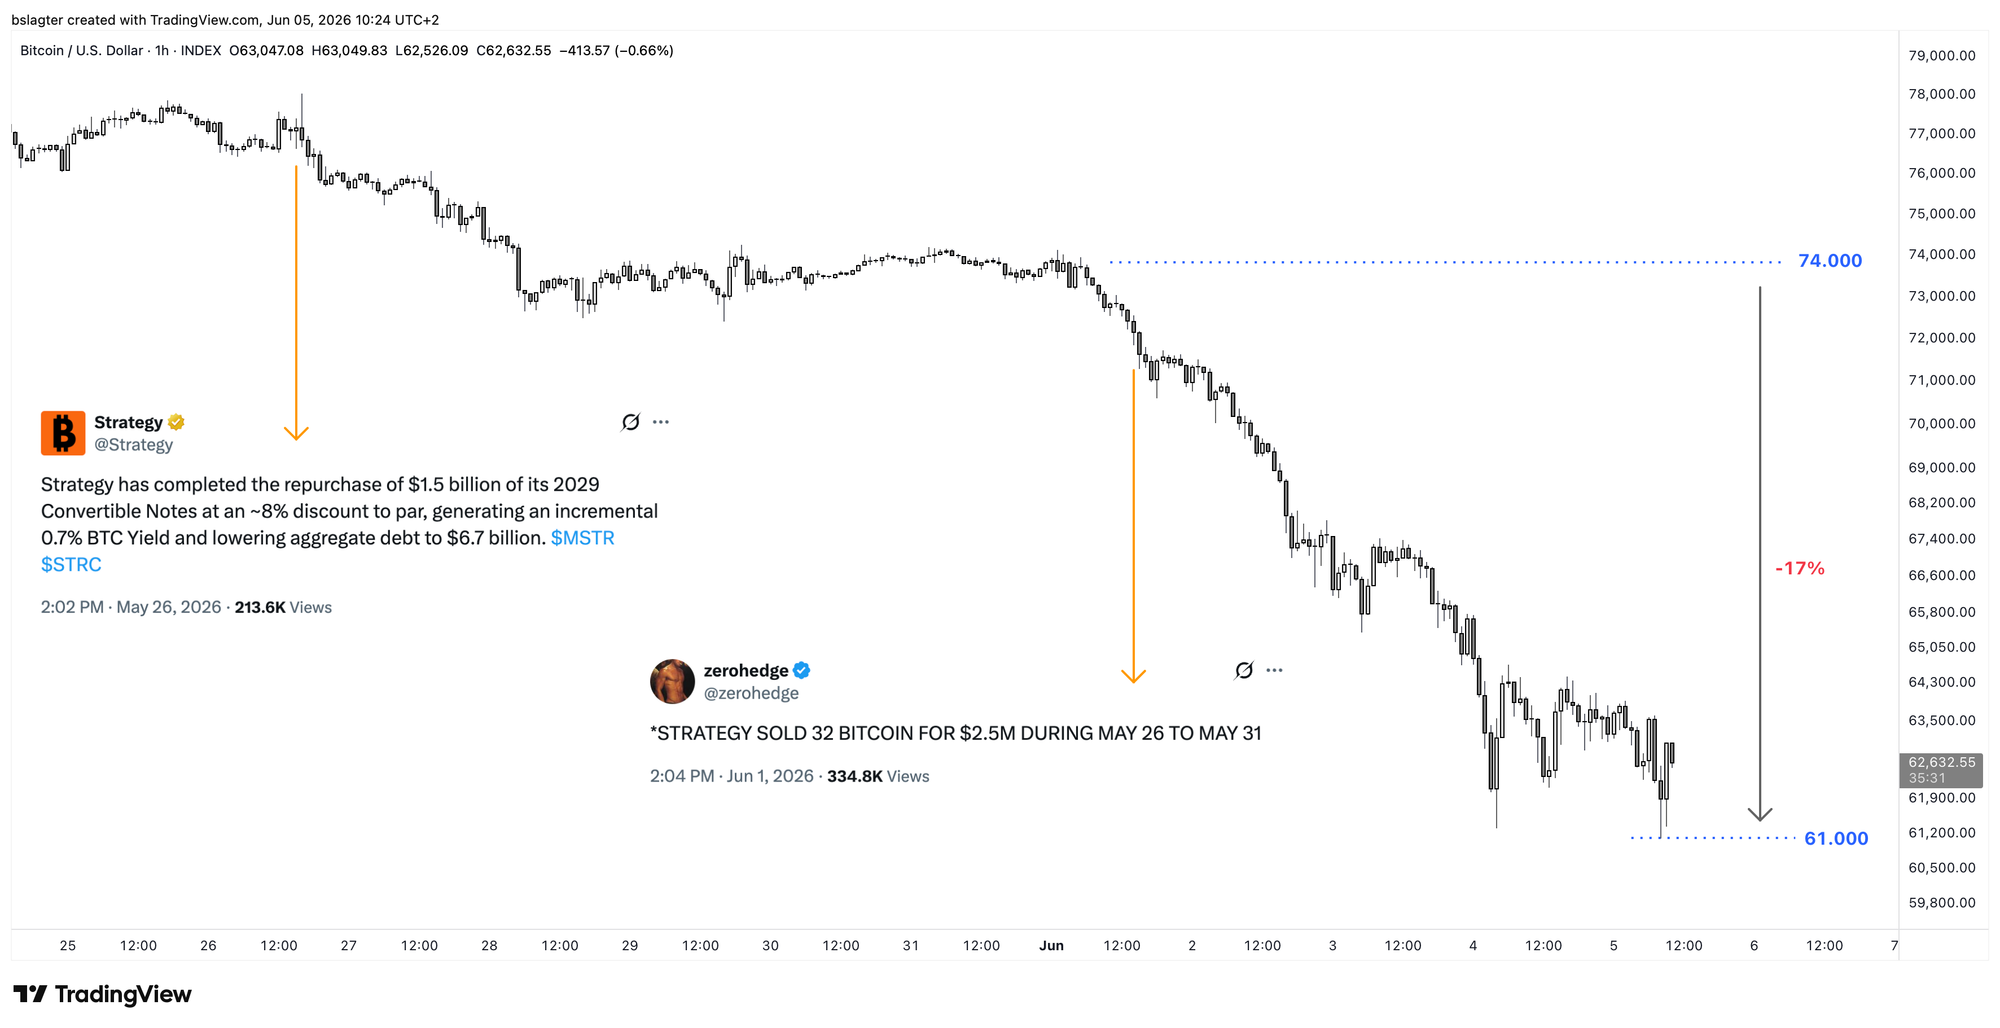
- On May 26, the company announced that it had used $1.38 billion from its dollar reserve to repurchase a loan. That loan carried a 0% interest rate and wasn't due until 2029.
- On June 1, it emerged that the company had sold 32 bitcoin the week prior for a total of roughly $2.5 million.
On its own, it's not unreasonable for Strategy to want bitcoin sales as a tool in its toolkit. For example, to buy back MSTR shares when they trade at a discount to the bitcoin position. To optimize taxes. Or to pay dividends on preferred shares like STRC.
According to some analysts, a sale is important to demonstrate that the 843,706 BTC in the vault are actually sellable — a prerequisite for inclusion in a major stock index like the S&P 500.
Saylor has discussed tactically selling bitcoin several times in recent months on podcasts where he appeared as a guest. With the caveat that on a larger time scale, he would always buy more than he sells. From "never sell your bitcoin" to "buy more than you sell."
Well, go ahead then, you'd think. Sell 10,000 BTC in a week, and triumphantly announce on Monday that you did it without the market even noticing. The bitcoin market is liquid enough and can easily absorb that kind of supply in most weeks.
It's already odd that Strategy chose to sell the paltry amount of 32 BTC. As if they were afraid to bring more supply to market. But the real problem was the combination with the previous week's action — raiding the dollar reserve.
On December 1, 2025, Strategy announced the establishment of a 'USD Reserve' from which the company could pay dividends and interest. The goal was to always have 24 months' worth of obligations on hand:
Strategy's current intention is to maintain a USD Reserve in an amount sufficient to fund at least twelve months of its Dividends, and Strategy intends to strengthen the USD Reserve over time, with the goal of ultimately covering 24 months or more of its Dividends.
Initially, there was $1.44 billion in the vault, later in December topped up to $2.19 billion. At that point, it was enough for those 24 months of obligations. The message: no matter what happens with the bitcoin price or MSTR stock, the company can hold out for two years.
That coverage gradually declined in the following months because the reserve stayed flat while dividend obligations increased. By May 25, the $2.19 billion was still enough for roughly 1 year and 4 months.
You'd think, if you want to sell some bitcoin anyway, make sure you use the proceeds to replenish that reserve. That way you kill two birds with one stone: you strengthen the image of robustness and you demonstrate that you can sell bitcoin.
Instead, Strategy used the dollar reserve to pay off a debt that wasn't really in the way. The reserve is now only good for 6 months of dividends. And in a week and a half, just 5 months. The clock is ticking.
And that's exactly what the bloodhounds smell.
There are plenty of them. Michael Saylor is anything but beloved in the financial sector. ETF expert Nate Geraci said: "I can't ever remember a company that traditional professional investors were so actively cheering to see fail as MSTR. [..] The hate is real."
Can't ever remember a company that traditional professional investors were actively cheering to see fail more than MSTR…
— Nate Geraci (@NateGeraci) June 3, 2026
Not sure if driven by bitcoin skepticism, the financial engineering, Saylor's celebrity, perceived loose compliance, or all the above.
But the hate is real.
Objectively, there's not much wrong with Strategy right now. They still have $900 million in the vault. And MSTR stock is still trading at a 26% premium, which means they can raise money without any problems by issuing additional shares.
Can the market put Strategy's back against the wall and force it to sell large amounts of bitcoin? Not in the short term.
Still, it's understandable that this situation has shifted sentiment in the bitcoin market. The likelihood of Strategy buying large amounts of bitcoin in the near future has decreased, and it was precisely Saylor's weekly purchases that gave hope for a shallow and short bear market.
And then you quickly see the reflexivity of the market at work. The price drops. Investors who wanted to buy hold off on their purchase. After all, tomorrow it'll be cheaper than today. And so the price drops further.
The result was the third major capitulation of this bear market. The price fell 17% in four days, from $74,000 to $61,000.
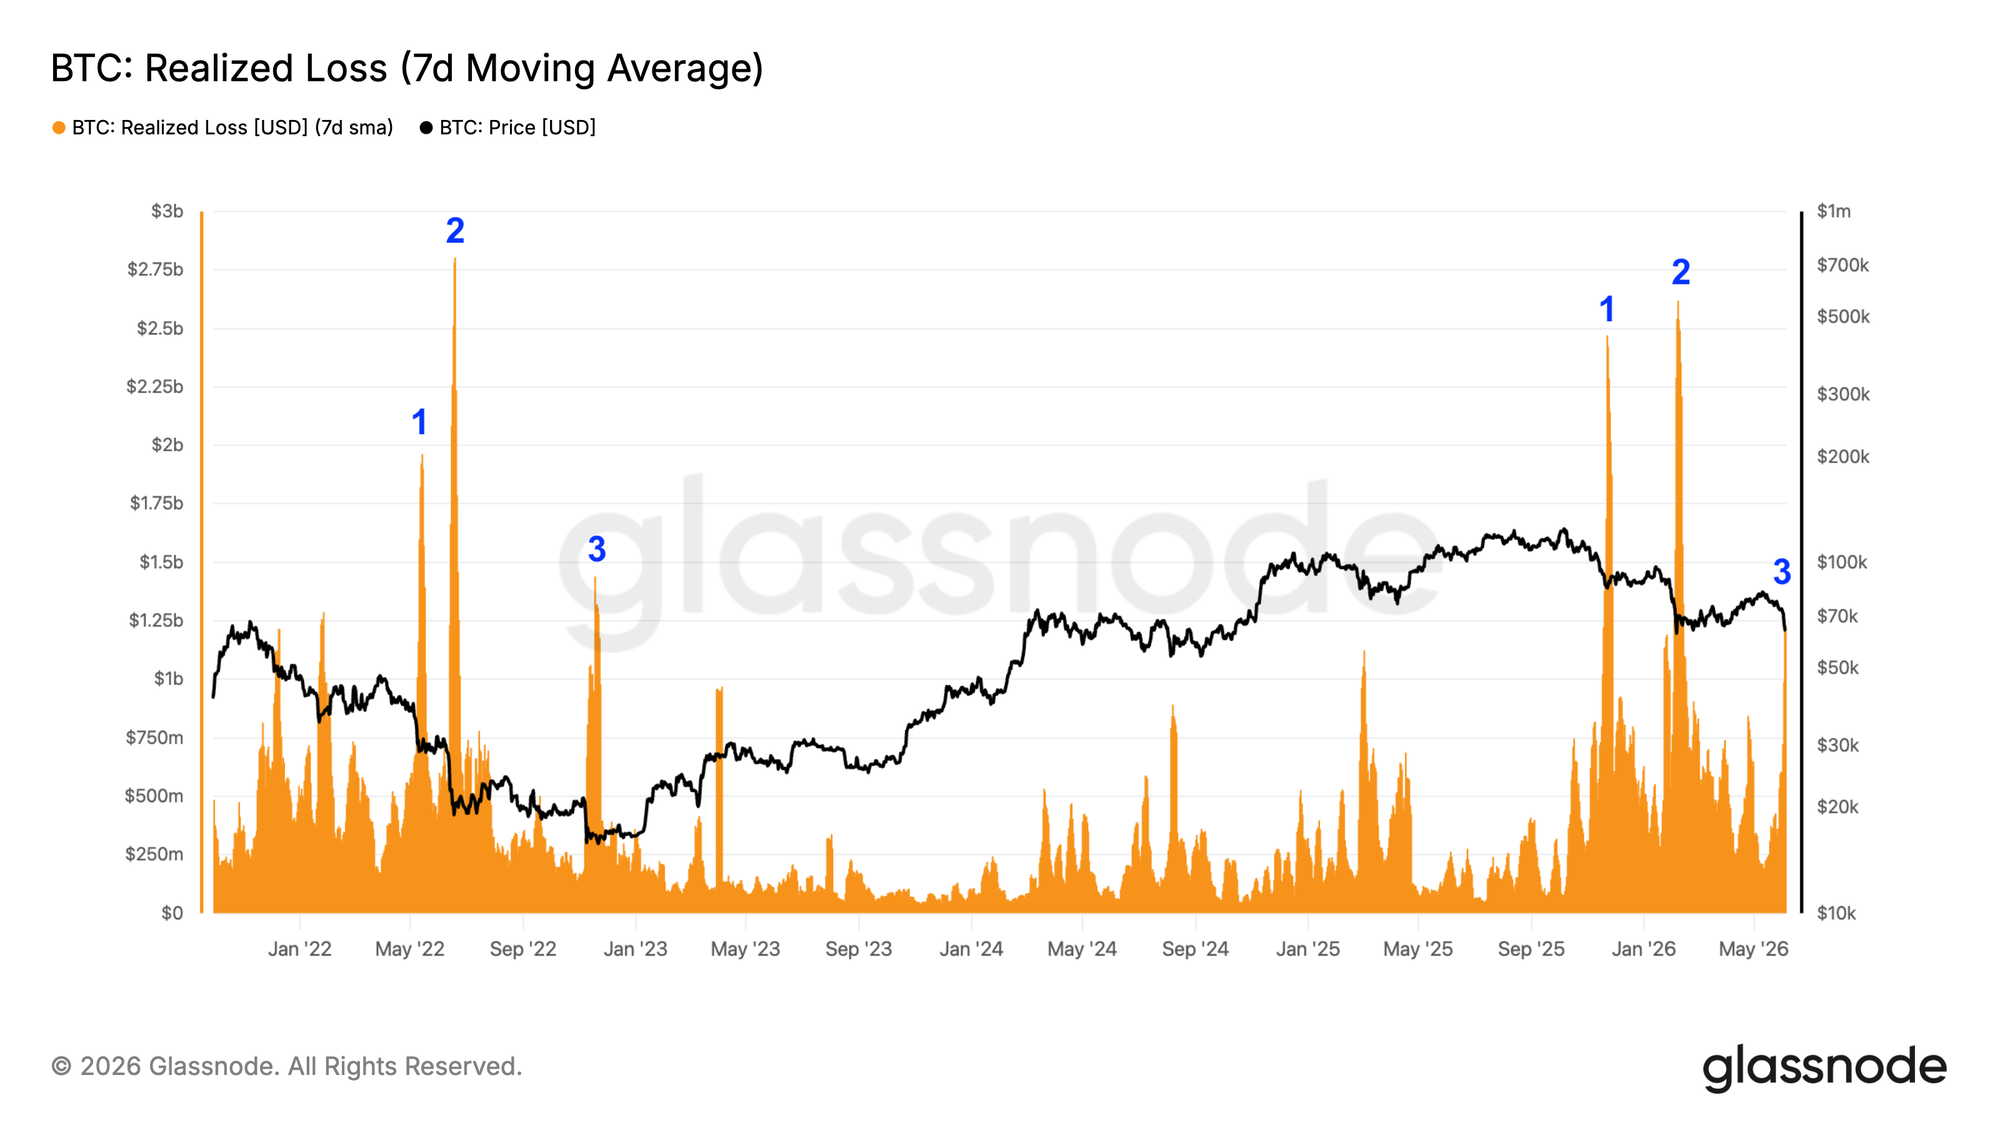
A hallmark of capitulations is that investors sell en masse at a loss. In market data, rapid declines are accompanied by high trading volumes. In on-chain data, we see spikes of 'realized loss.' The chart below shows the 7-day moving average. We're now in the third major capitulation of this bear market.
Strategy and Michael Saylor are in the spotlight right now, but the price decline has actually been underway for weeks. The commotion may have accelerated things, but the root cause lies elsewhere.
Many analysts see capital flowing from the crypto market to AI, or positioning ahead of major IPOs like SpaceX, OpenAI, and Anthropic. The $4 billion in outflows from bitcoin ETFs is also attributed to this.
That's possible. But it doesn't really matter much. In bear markets, capital always flows out of the market to something else, and there's always a fitting explanation. And in bull markets, the money flows back in, also with a neat narrative.
It's the ebb and flow of financial markets. The alternation of strength and weakness that has been visible in charts for centuries. Bitcoin is now entering the phase of the bear market where bottoms are formed. Maybe this week, maybe in six months. But unless bitcoin fundamentally fails, a bull market will eventually return.
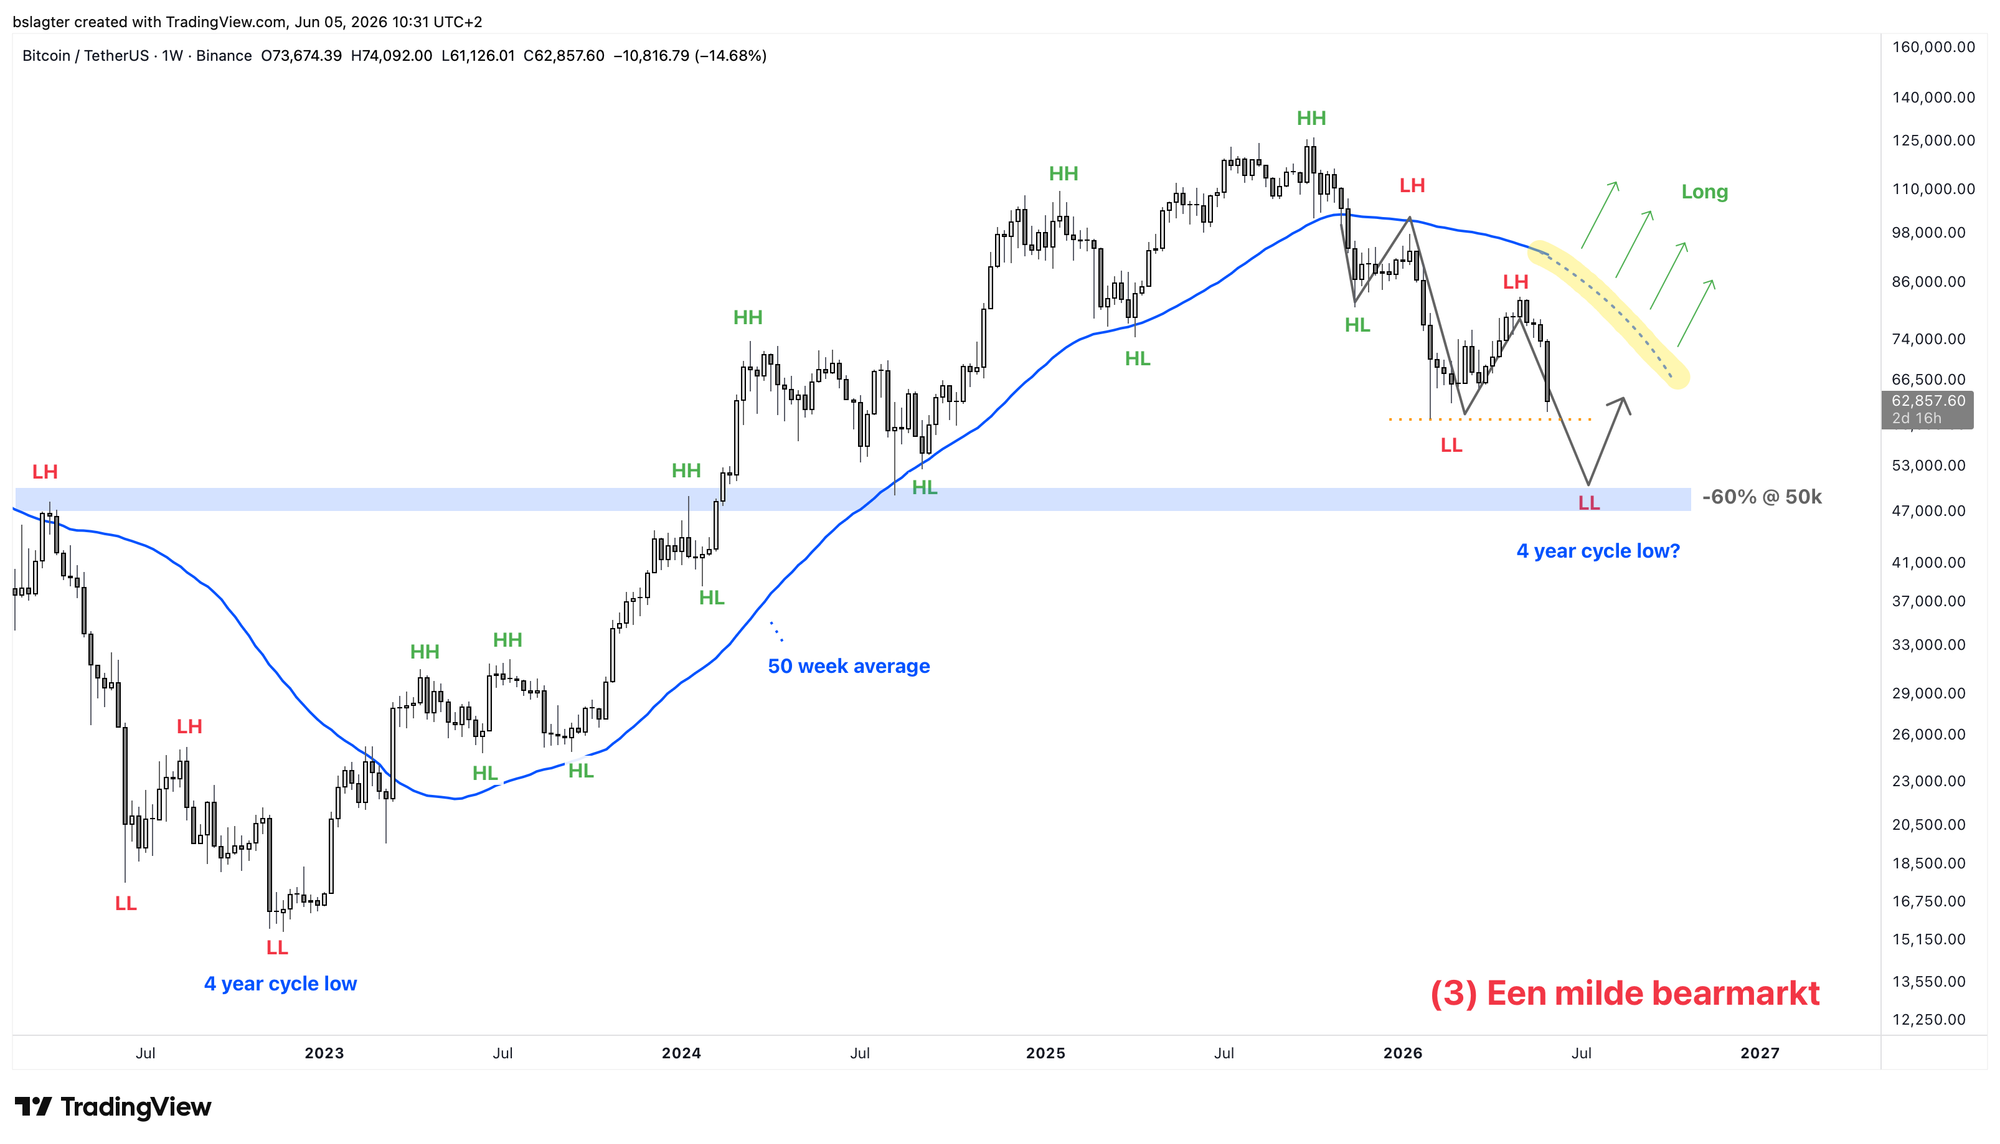
Not yet, though. The trend on the weekly chart is still declining, with lower lows (LL) and lower highs (LH), and a price below the dominant moving average.
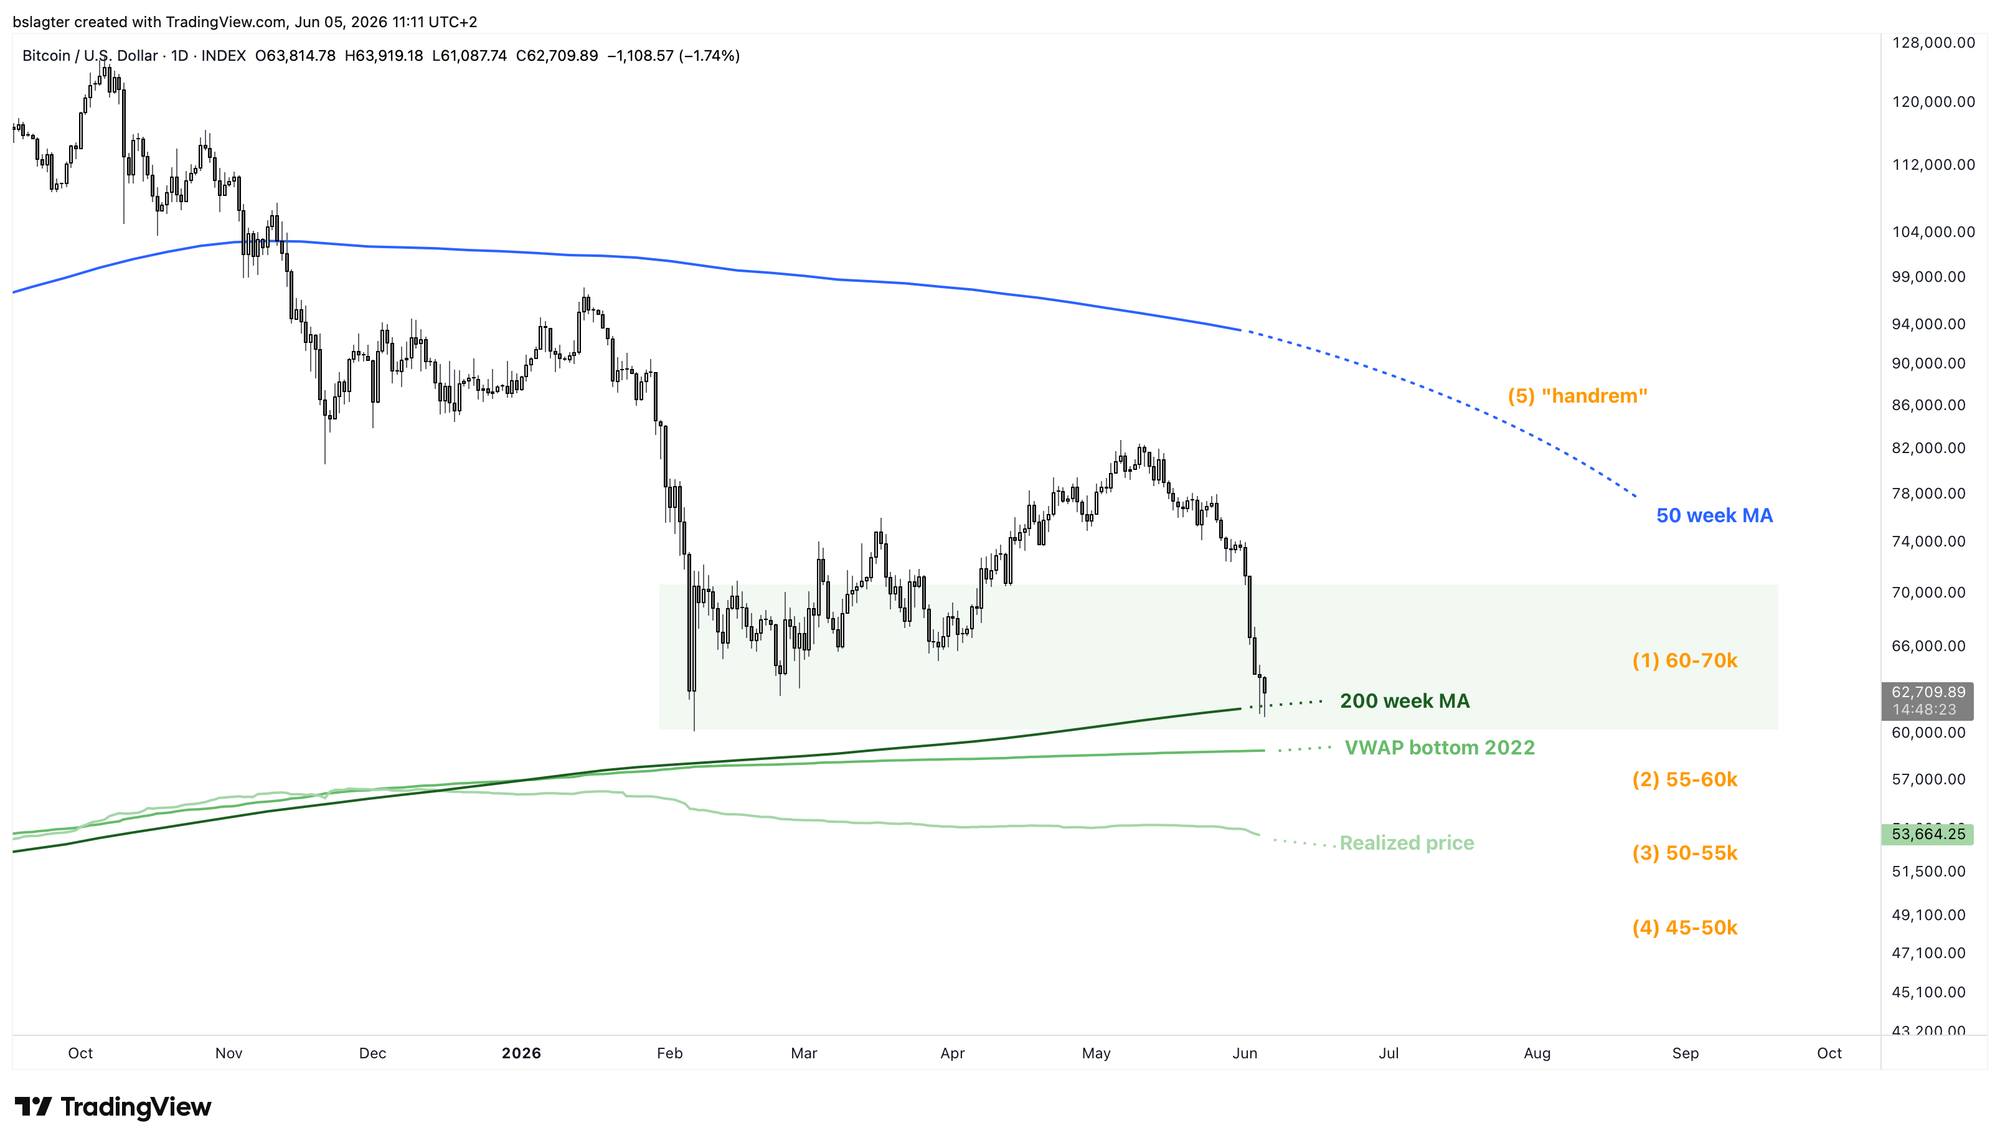
We haven't yet set a lower low below the $60,000 of February 6. In our base case scenario, that will happen. We made the chart below in November, when we pulled the handbrake and switched from "bull market continuation" to "a new bear market" as our base case.
What's next? Even within our base case, there are several variants to consider.
- In the most favorable variant, we see the bear market bottom in the coming weeks, just below $60k.
- In the middle scenario, a bottom forms after the next daily cycle, late July or early August, somewhere around $55k.
- In the least favorable variant, misery piles up this summer. The AI bubble pops, the Fed raises rates, the war in Iran escalates, the Clarity Act fails to pass. We don't see the bottom until fall, around $48k.
Will it be longer or deeper than that? Then we'll have to set aside our base case and look at the scenario we dubbed "a deep bear market" back in November.
In all cases, we have a clear signal for the end of the bear market: a weekly close above the 50-week moving average, ideally supported by a few more of the following checkboxes:
⏹️ A higher low (HL) above the $60,000 of February 6
⏹️ A weekly close above the 50-week moving average at $92,500
⏹️ A higher high (HH) above the $83,000 of May 6
⏹️ A directional change of that moving average from declining to rising
It's interesting to compare today's checklist with the one from the Alpha Markets edition of May 15, quoted here for convenience:
⏹️ A higher low (HL) above the $60,000 of February 6
⏹️ A weekly close above the 50-week moving average at $95,000
⏹️ A higher high (HH) above the $98,000 of January 14
⏹️ A directional change of that moving average from declining to rising
You can see that the criteria have become 'easier.' The moving average is declining, and the highs and lows keep getting lower. This also makes the handbrake that many of our members pulled in November increasingly valuable in hindsight, because the re-entry price keeps moving further below the exit price.
As for re-entry, we've been seeing signs of accumulation at prices between $60,000 and $70,000 for a while now. It's not unreasonable to buy back the first portion now. And spread the rest below $60k. Miss part of your entry? You always have the weekly close above the 50-week moving average as your 'final boarding call.'
An example of such a plan:
- 25% between $60k and $70k
- 25% between $55k and $60k
- 25% between $50k and $55k
- 25% between $45k and $50k
- Whatever hasn't been deployed yet at a weekly close above the 50-week moving average
An alternative is to start from now with a weekly or monthly purchase schedule, through which you fully re-enter over the next 6, 9, or 12 months.
If you can follow this plan completely, your average purchase price will be between $53k and $59k. Well below the handbrake that most pulled between $95k and $100k.
Didn't exit, but want to start accumulating or add to your position during this bear market? You can use the same approach.
We continue with the following topics for our Alpha Plus members:
- Yearly, weekly & daily cycle
- Hunting for bullish divergence
- The key hurdle at $74,000
- Will Bitcoin's narrative return to its core?
- How can the bull market for stocks come to an end?
1️⃣ Yearly, weekly & daily cycle
Bert
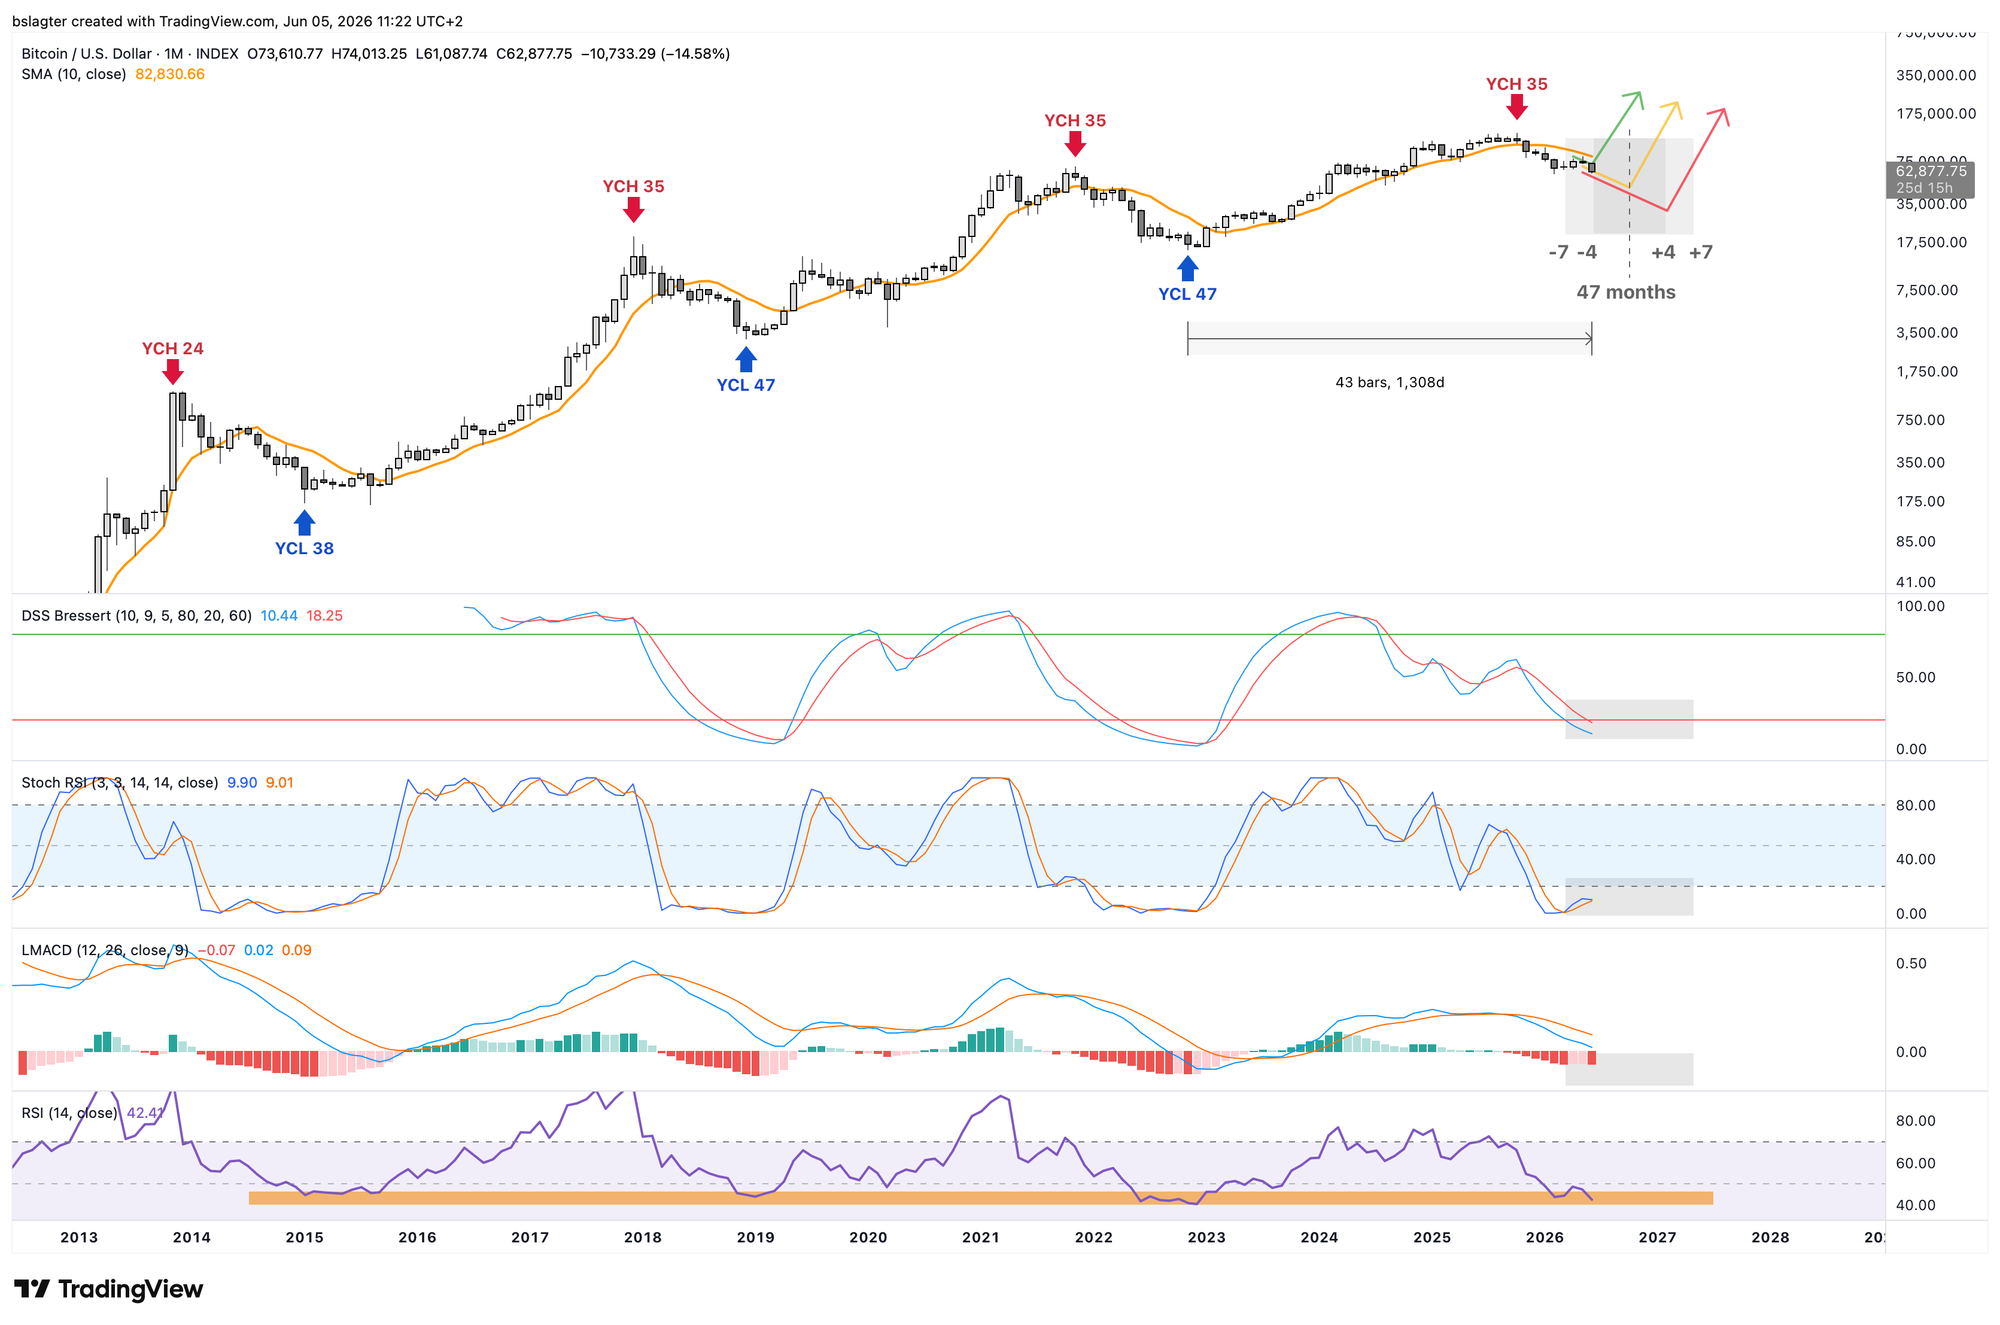
The month of May is behind us, which means the monthly chart has a new data point. On the monthly chart below, we've drawn the yearly cycle. We're now in month 43 of the average 47 months. We're in the time window where we can expect the bottom.
The indicators at the bottom (DSS Bressert, Stoch RSI, MACD, and RSI) are also in the (early stages of the) zone where bottoms tend to form.
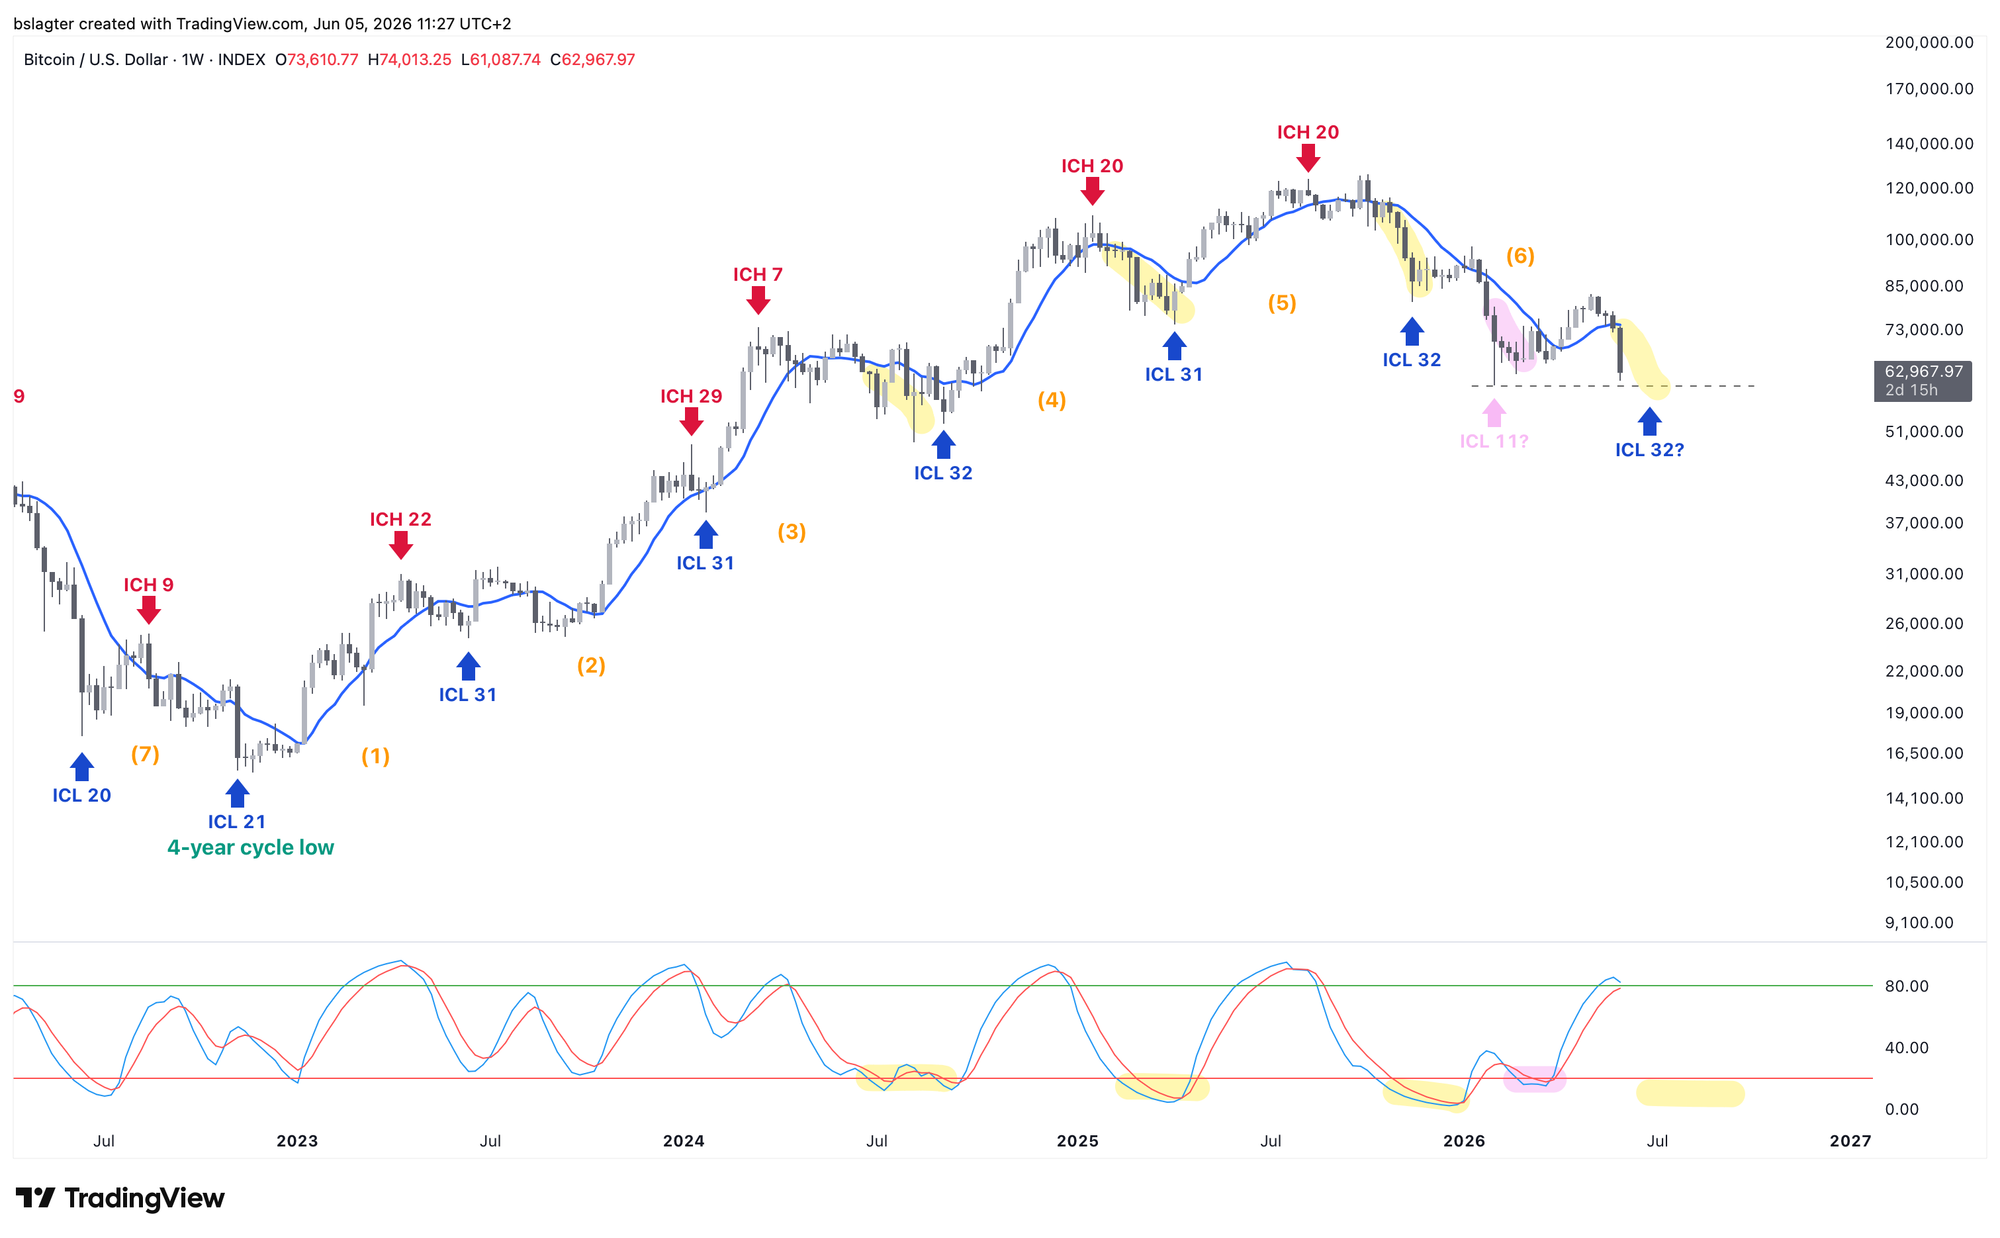
Now on to the weekly cycle. There are two possible interpretations, with the key difference being whether we should mark February 6 as a weekly cycle low (ICL).
Ultimately, it doesn't matter much:
- In both cases, we're in the declining portion of the yearly cycle, heading toward the yearly cycle low (YCL)
- In both cases, we've started the declining portion of the weekly cycle, heading toward the weekly cycle low (ICL)
The oscillator at the bottom suggests it will really take a few more weeks before we reach the ICL.
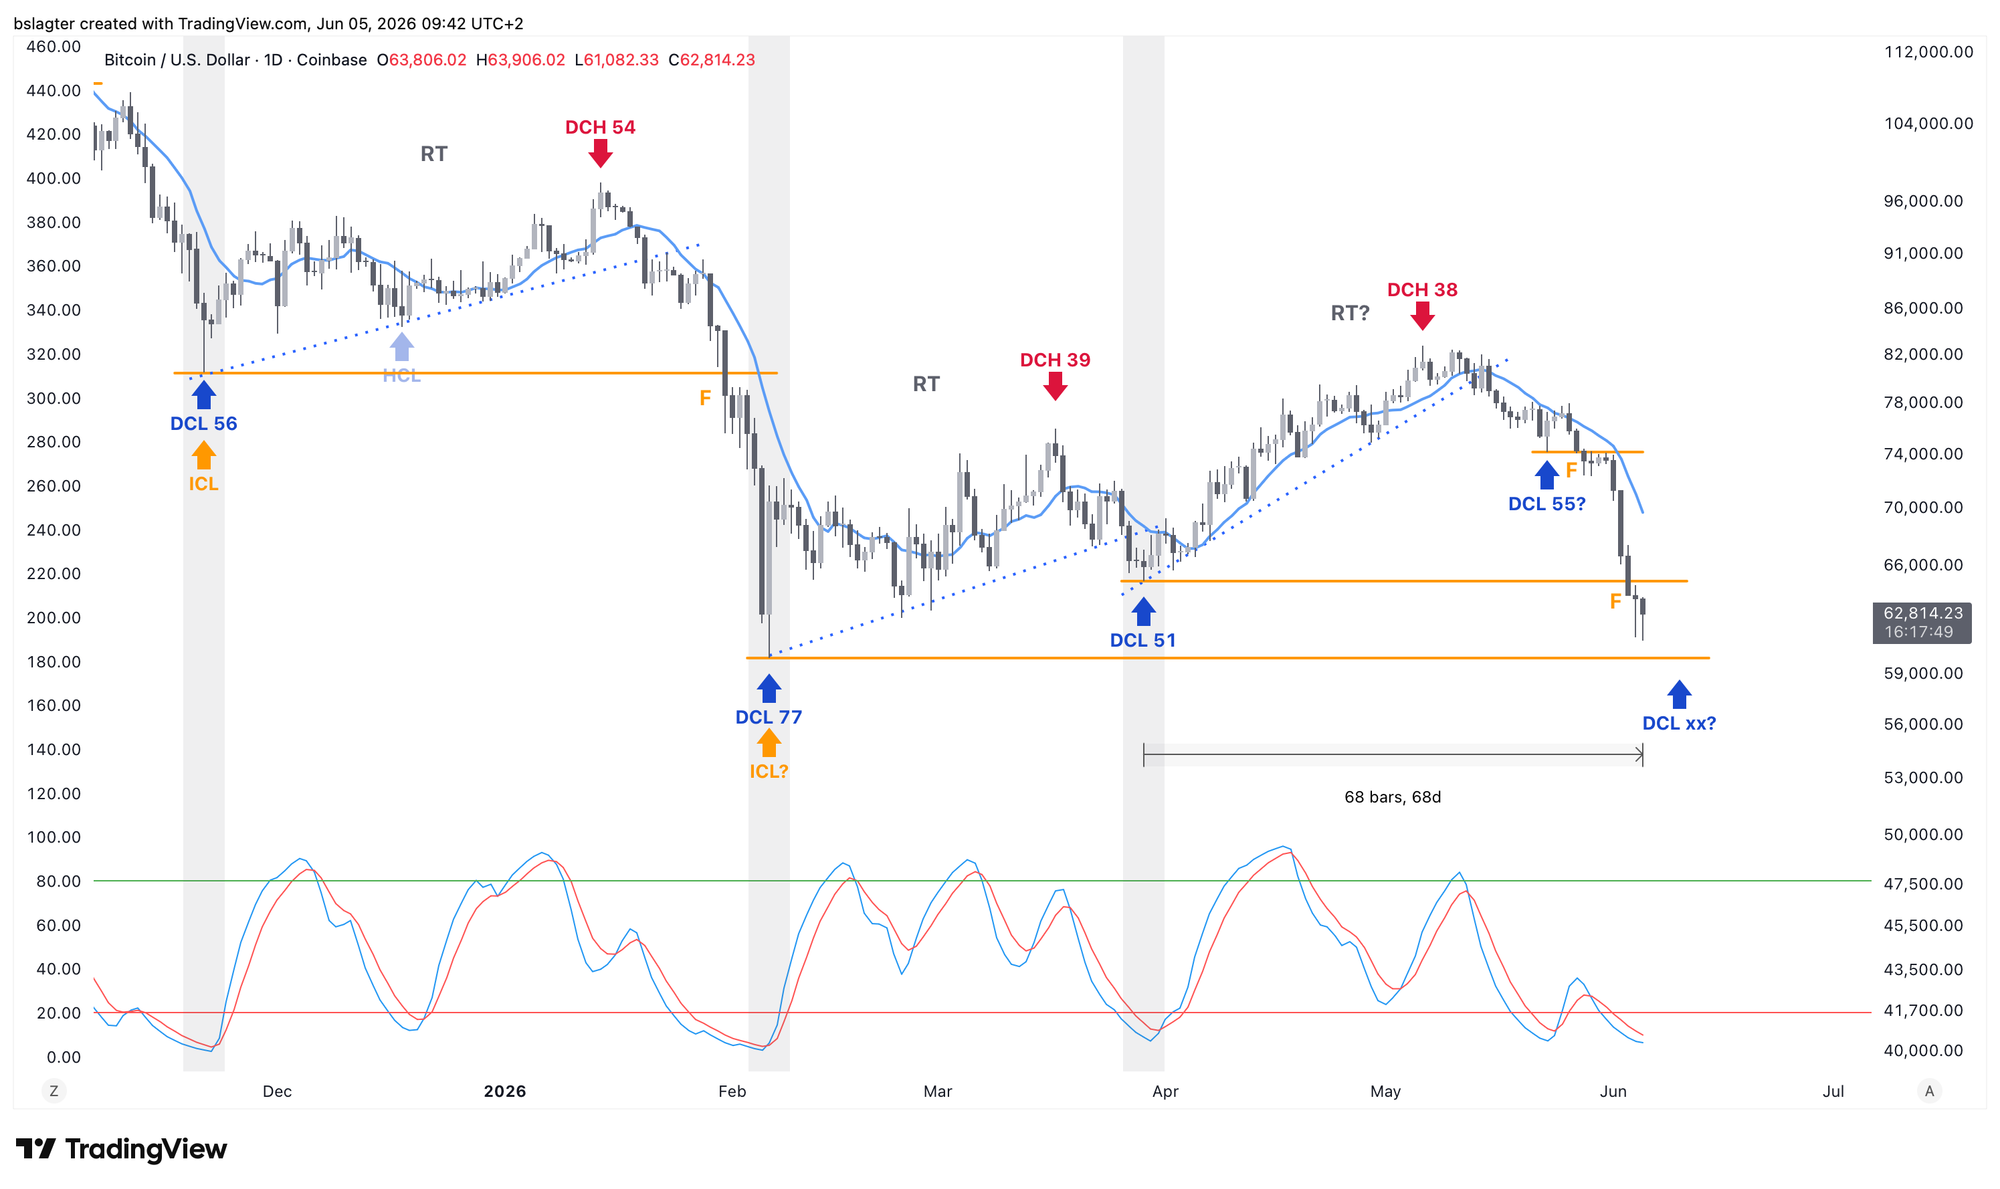
There are also two possible interpretations for the daily cycle. The question centers on whether May 23 was a daily cycle low (DCL). There was one daily close just above the 10-day moving average, and the oscillator had just started a new rise.
Again, it doesn't really matter. In both cases, this daily cycle can now be classified as 'failed.' The idea behind 'failed' is that a cycle is supposed to be rising, and when that doesn't happen, it has failed.
That's its only direct meaning. But there are also indirect consequences for the probabilities of future scenarios. A failed daily cycle is often seen at the end of a weekly cycle. And a failed weekly cycle is often seen at the end of a yearly cycle.
For the definitive interpretation of the daily cycle chart, we need to wait and see how the coming weeks unfold. If we get a typical 'start of the cycle,' then May 23 was not the DCL — rather June 5, 6, 7, or whenever it ends up being.
In short: cycle analysis doesn't give us a very precise calendar right now. There's more uncertainty than usual, which makes this tool slightly less useful for the short term than at other moments.
On the longer term, the picture is clear: we're in the declining part of the yearly cycle, heading toward the bear market bottom.
2️⃣ Hunting for bullish divergence
Bert
As bitcoin moves through its market cycle, it has a habit of building up significant divergences at the end of both the rising (bull market) and falling (bear market) trends.
In a bull market, price makes higher highs while various indicators are already printing lower highs. We see this in market data like momentum and trading volume, in on-chain data, and in sentiment. In bear markets, it's the opposite: price goes lower, but the declines become progressively less convincing. There's less and less force behind them.
These divergences are a sign of the final phase of a bull or bear market. Take the RSI as an example. In the middle stretch of the bull market, price keeps rising, and so does the RSI. It's only at the end that we see the divergence emerge.
If we do indeed get a lower low soon, we'll be looking at how these divergences are shaping up. Below is the weekly chart with the RSI. Does the RSI stay higher than in February? Or is the bear market so powerful that the RSI gets pushed to new lows as well?
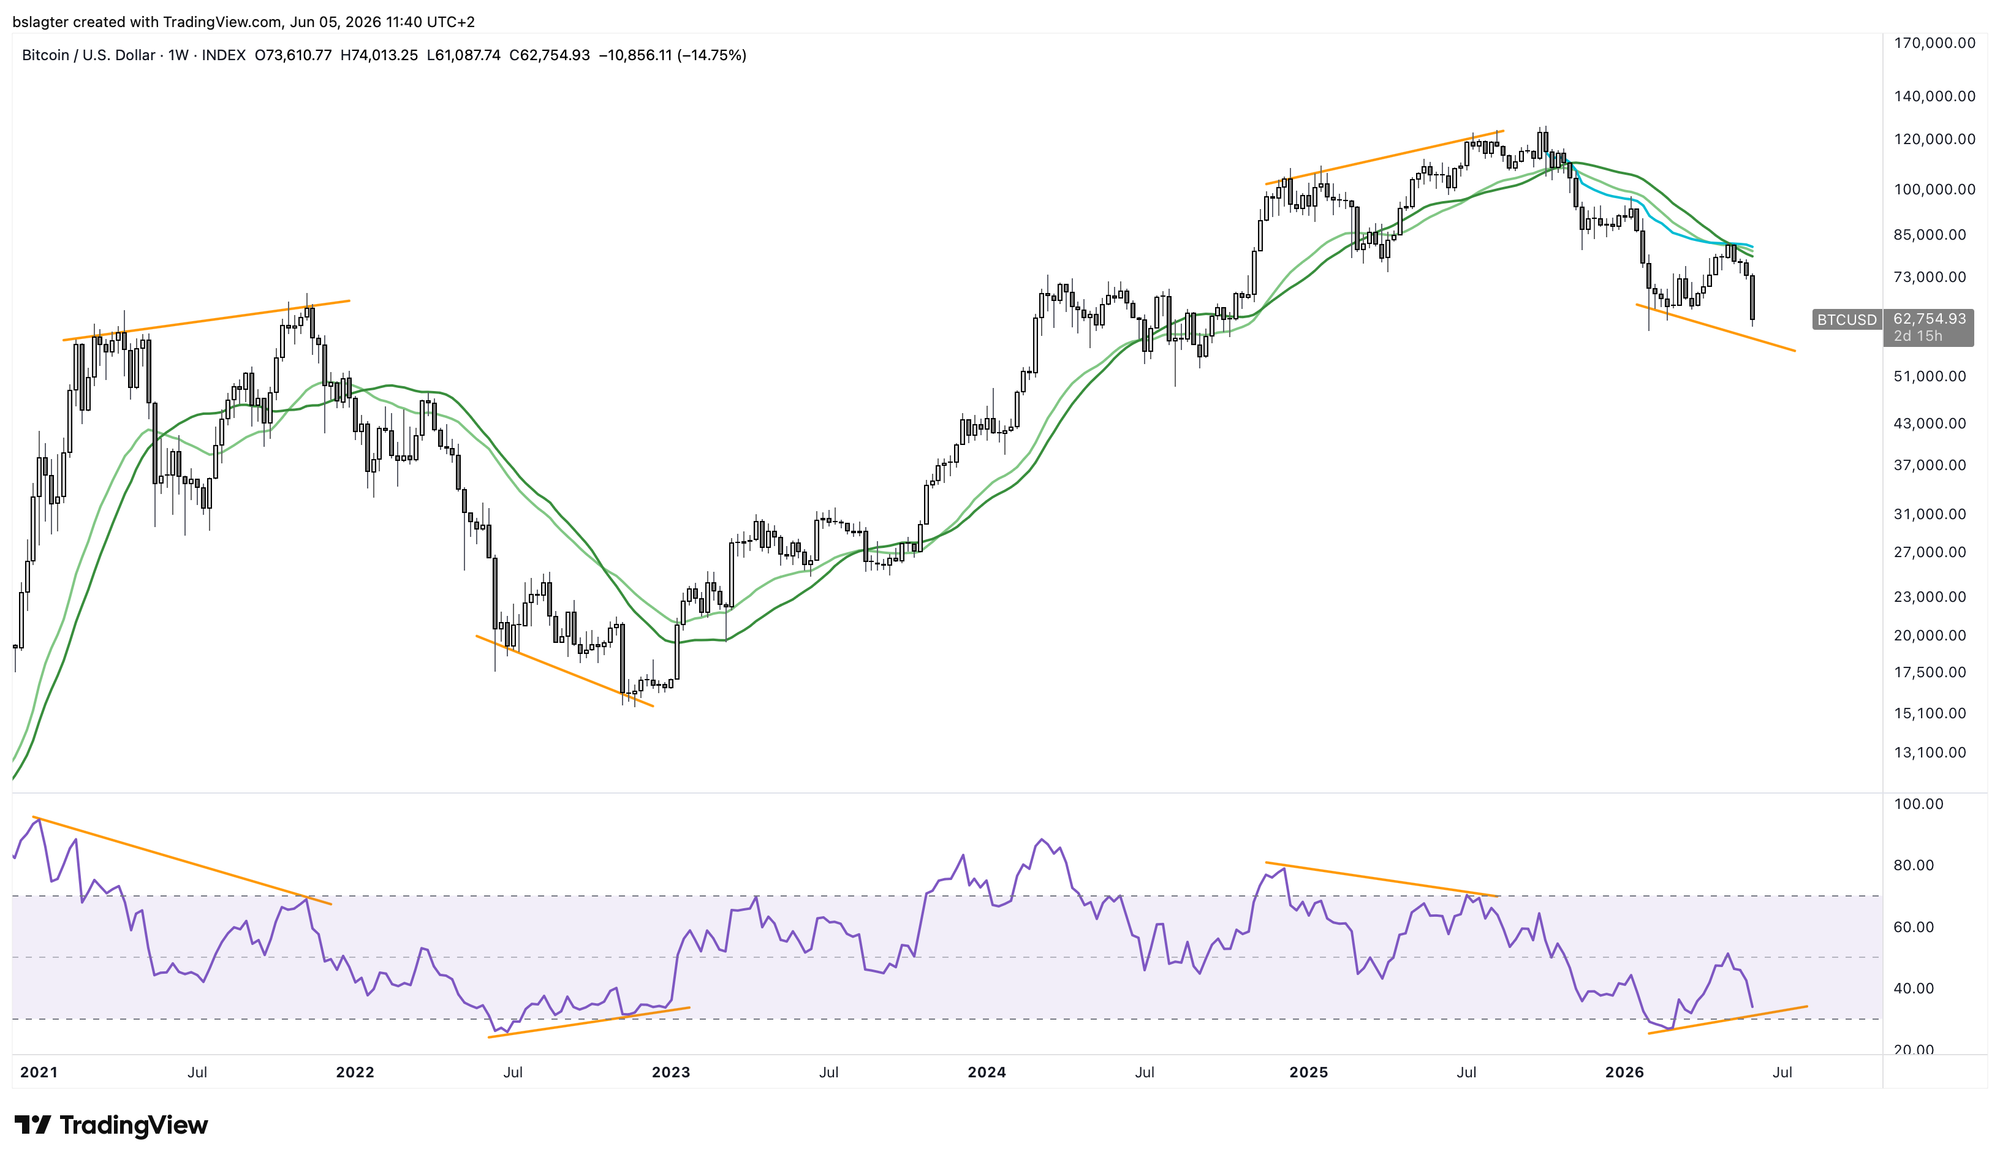
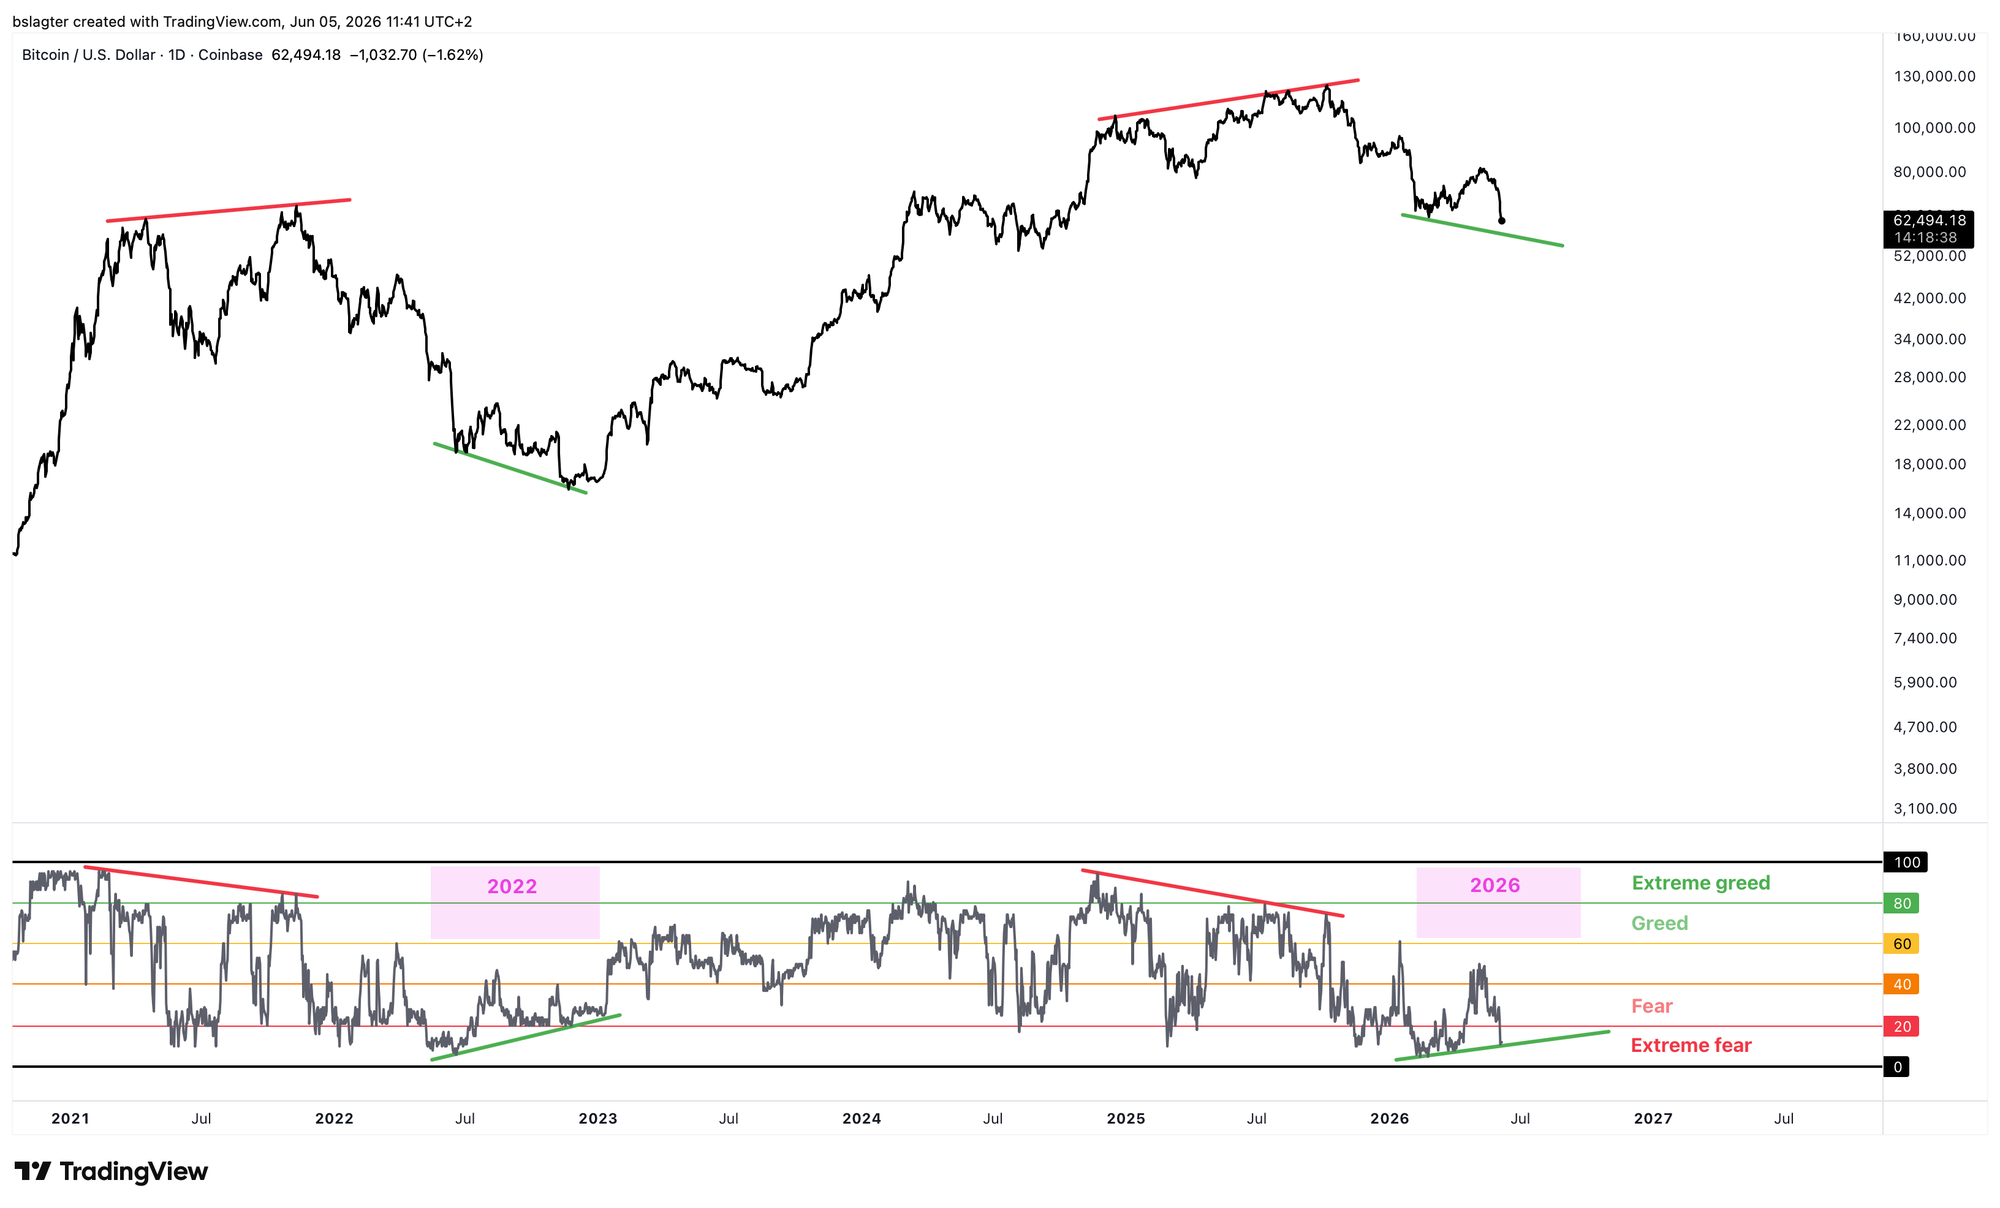
Below you can see the Fear & Greed index. In recent years, it has also shown a decent divergence with price. So that's another thing we can watch for. We're curious to see what happens!
3️⃣ The key hurdle at $74,000
Sam
Since the local top on Wednesday, May 6 around $83,000, bitcoin has shown little other than weakness. Every bounce was short-lived and followed by increasingly stronger selling waves.
That sellers have the upper hand is clear, and therefore the base case remains that bitcoin will visit the $60,000 bottom in the coming weeks.
That said, it has also become apparent that there is substantial demand between $60,000 and $65,000. The chance is therefore present that we'll form a higher low relative to the February bottom.
In fact, because bitcoin has now traded below all local lows except the absolute current bear market bottom, it actually increases the probability that the bottom is in. Not the base case, but a somewhat higher probability.
Now that most of the work on the downside has been done, we can look at the key hurdle of $74,000 that needs to be overcome to gain more conviction that the bottom is behind us. What makes this $74,000 so special?
First, a daily close above it would be the first higher high since the local top in early May. Additionally, it was the top of March 2024, the bottom of August 2024, and there has been a lot of interaction with this level in terms of support and resistance. See also the image below.
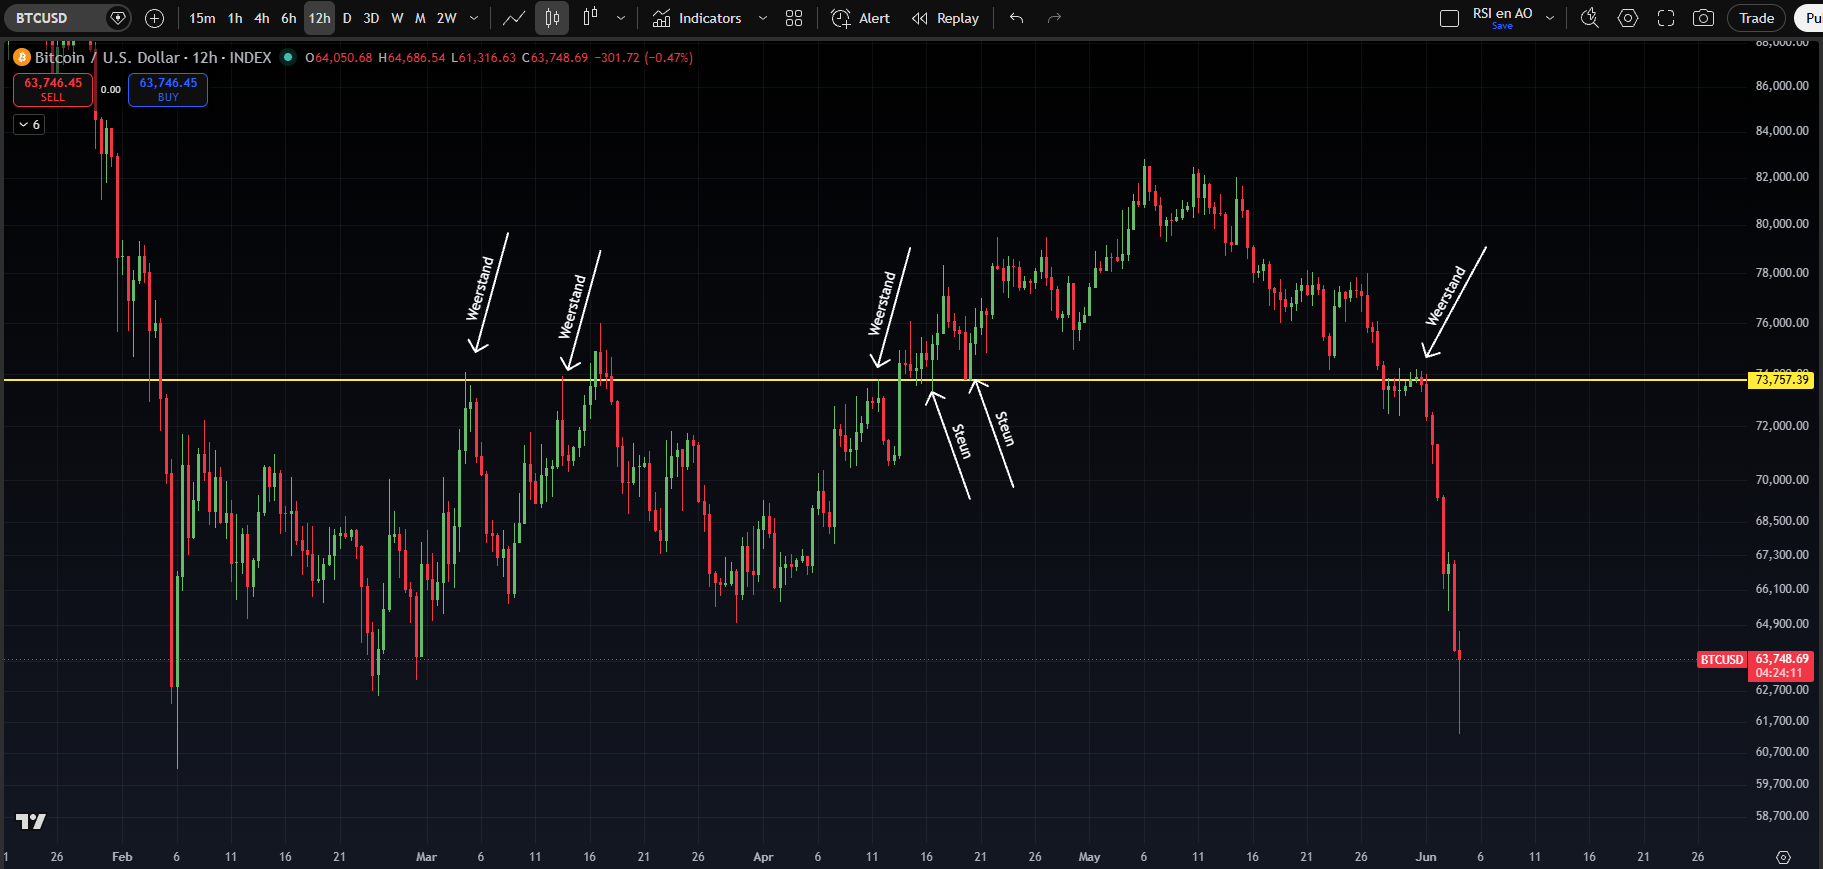
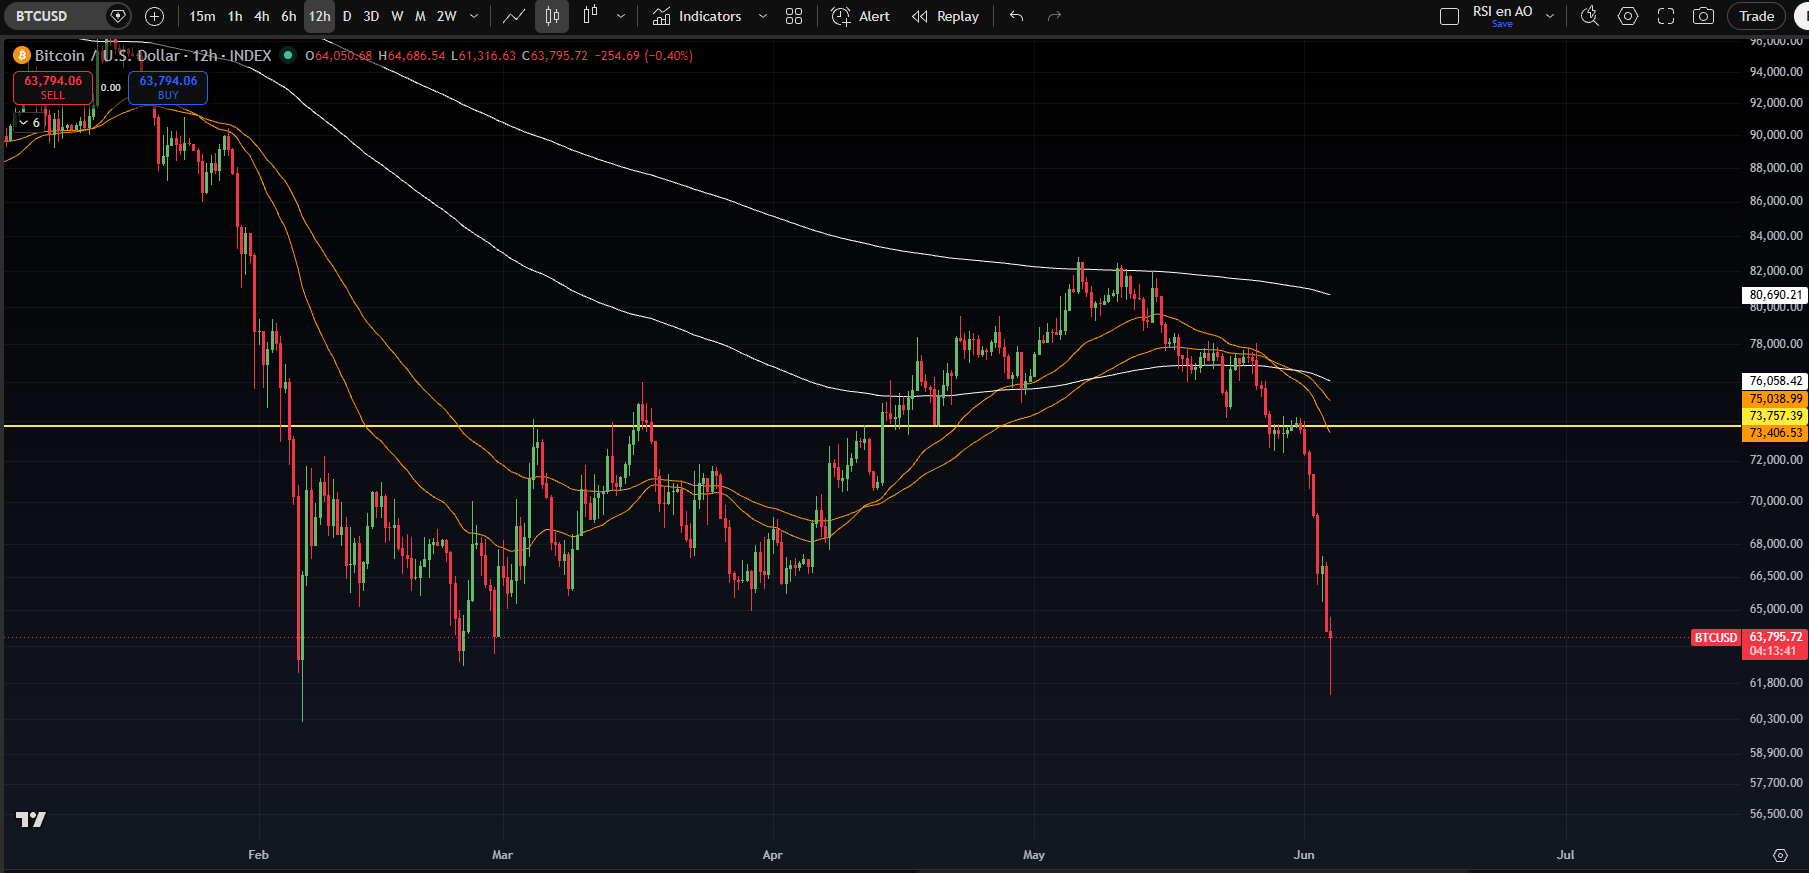
A second argument is based on the EMAs. The orange EMAs (100 and 200 4-hour EMA) are situated around $74,000, as shown in the following image.
The white EMAs (100 and 200 daily EMA) are still above this level, but will gradually approach it as time progresses.
So if bitcoin gets above $74,000, it will certainly be above the orange EMAs and will also be close to "conquering" the white EMAs.
The above is based on the scenario that a higher low is formed relative to the early February bottom. Additionally, a longer period of sideways movement and/or a lower low compared to Wednesday night could provide earlier signals for bulls. In any case, given the historical significance, $74,000 will remain a key hurdle to overcome in the future.
4️⃣ Will Bitcoin's narrative return to its core?
Thom
We're in a phase where bitcoin is primarily about Wall Street adoption. At the same time, the financial world is entirely consumed by AI. As a result, there's less and less discussion about bitcoin's core properties and how they fit the macroeconomic reality of the coming years.
While it's difficult to feel much enthusiasm for bitcoin right now, I do see the right things happening in the background.
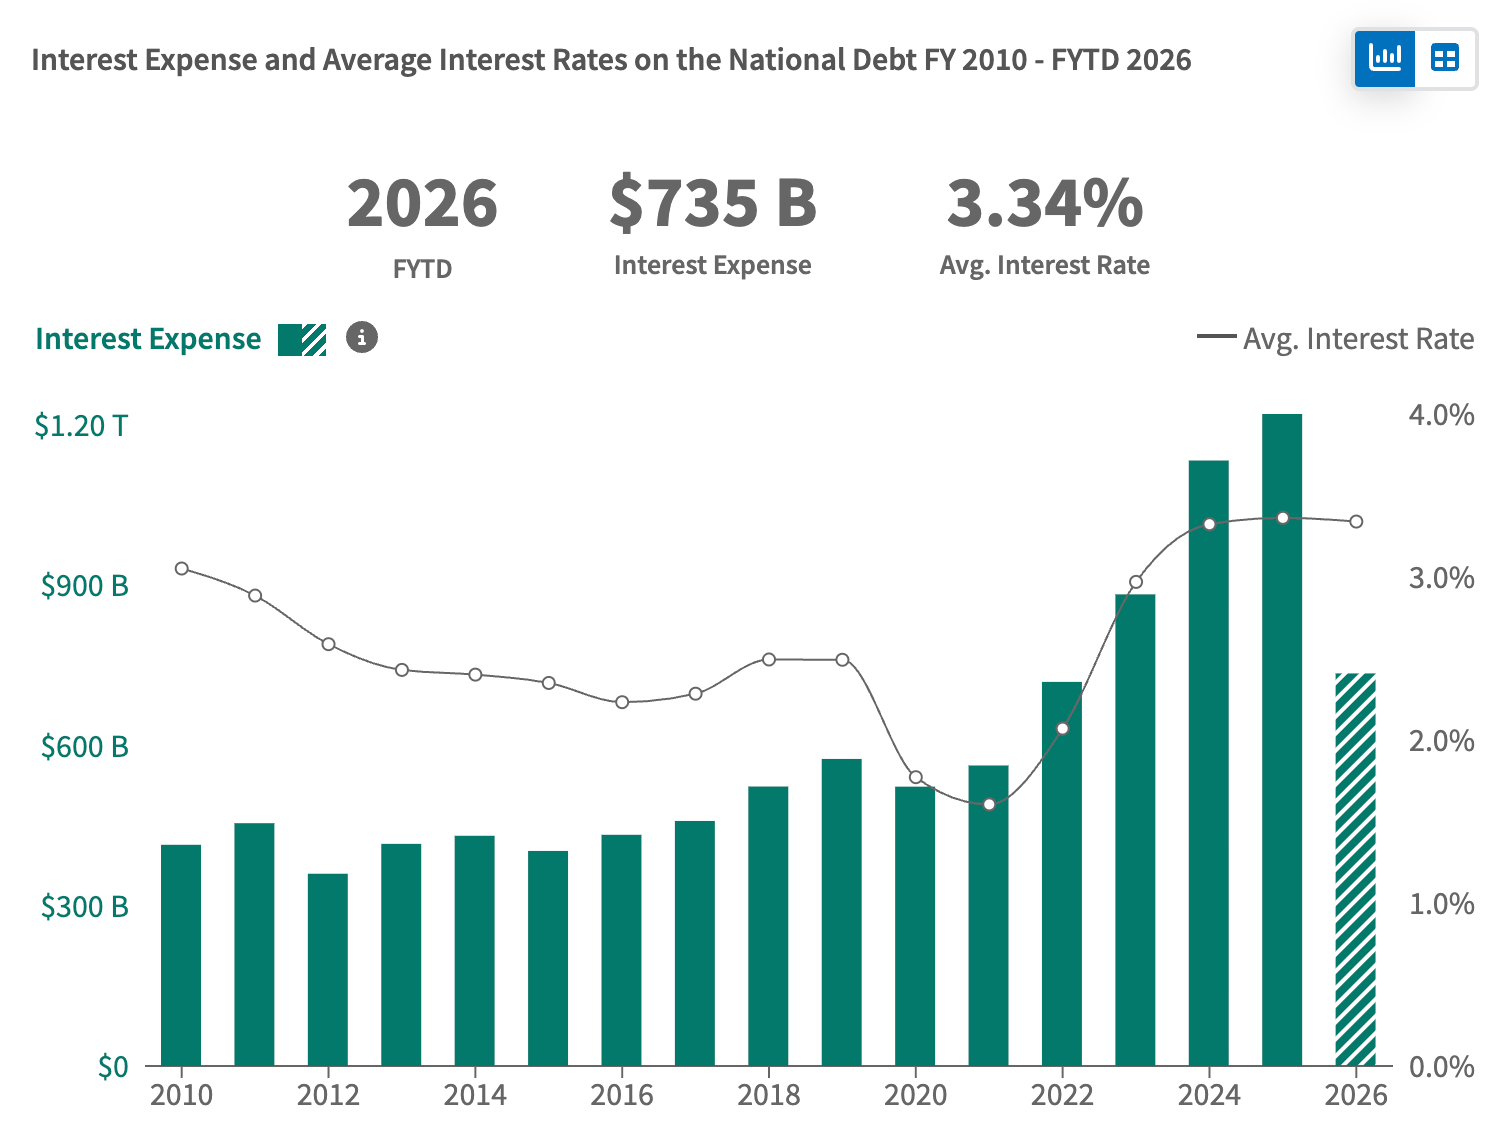
Take the 10-year yield on US Treasuries, for example. It currently sits around 4.48 percent. That's clearly higher than the rates we've grown accustomed to since the 2008 financial crisis. Yet I don't expect a dramatic decline in that yield even after a potential reopening of the Strait of Hormuz.
The inflation expectation for the next ten years still sits just below 2.5 percent. This suggests that the tensions around the Strait of Hormuz haven't had a huge impact on the US 10-year yield. Based on that inflation expectation, the real rate comes in at around 2 percent.
That's higher than what we've been used to since 2008, but not extreme in a historical context. In fact, a real rate of about 2 percent fits reasonably well with an economy that grows at roughly the same pace over the longer term.
The flip side of the return of higher rates is that it becomes more expensive for governments to finance their debt pile. This development has the potential to grow budget deficits, which will likely need to be filled with new debt.
From that perspective, I'd find it remarkable if Kevin Warsh, the new Fed chair, manages to shrink the central bank's balance sheet. That apparently is at least a serious ambition of his.
He could achieve that by giving the private sector more regulatory room to absorb Treasuries, or even by compelling them to do so. However, it's questionable whether the market would react positively to such forms of capital controls.
My main point, however, is that the discussion about government debt isn't in the spotlight right now, but it's still a serious issue lurking in the background. The US government's budget deficits have only grown in recent years.
When that narrative returns to the foreground, investors may once again connect it to Bitcoin's core properties. These are, in essence, why investors find Bitcoin's absolute scarcity so compelling.
5️⃣ How can the bull market for stocks come to an end?
Thom
An increasing number of analysts believe that bitcoin can only perform again once the AI frenzy is over. The natural follow-up question then is: how can the record-breaking rally in the S&P 500 and Nasdaq 100 come to an end?
The honest answer is that it can happen in countless ways. One of those scenarios I want to discuss today, because we're cautiously seeing the first early signs of it. It involves a so-called commodity supercycle that drives a rapid rise in inflation and bond yields — causing both stocks and bonds to sell off.
In the top panel of the following chart, we see Bloomberg's commodity index breaking out. The bottom panel shows that commodity supercycles (dark blue) and equity supercycles (turquoise) often mirror each other.
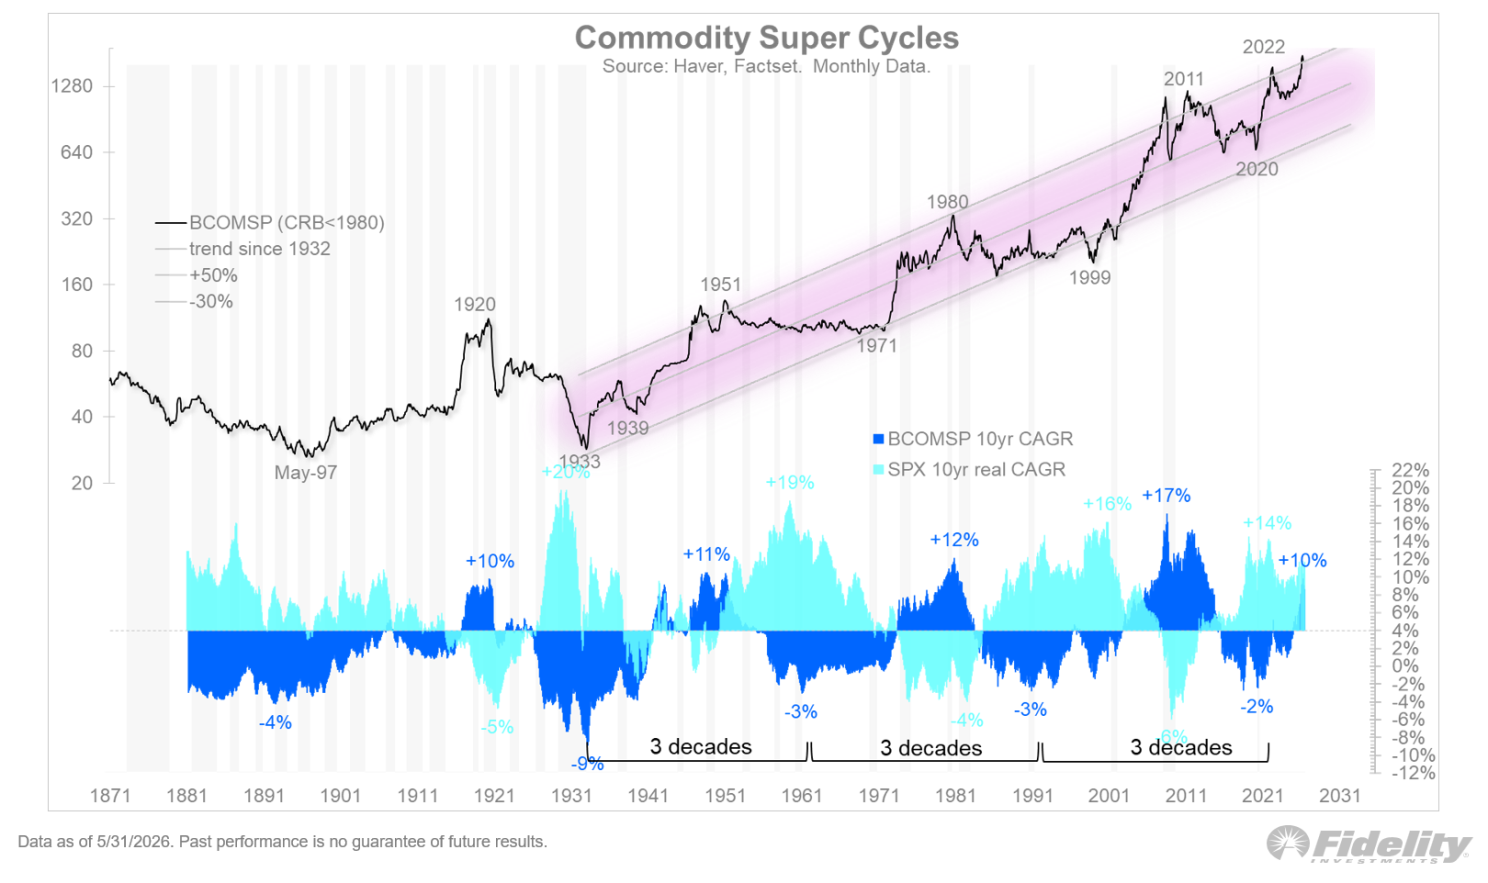
That makes sense. A powerful commodity rally often means the global economy is running into physical constraints. Energy, metals, food, and other basic goods become more expensive. That feeds through to inflation, puts pressure on profit margins, and makes it harder for central banks to lower rates.
The surge in commodity prices doesn't come out of nowhere, by the way. For the first time in a long while, the technology sector is investing massively in the physical economy again. The AI revolution isn't just about software and smart models — it's also about data centers, power grids, cooling, chips, copper, steel, energy, and logistics.
The situation becomes especially interesting when we look at the gap between the Bloomberg Commodity Spot Index and the 5-year TIPS break-even. The commodity index is clearly breaking out, while inflation expectations for the next five years remain relatively calm.
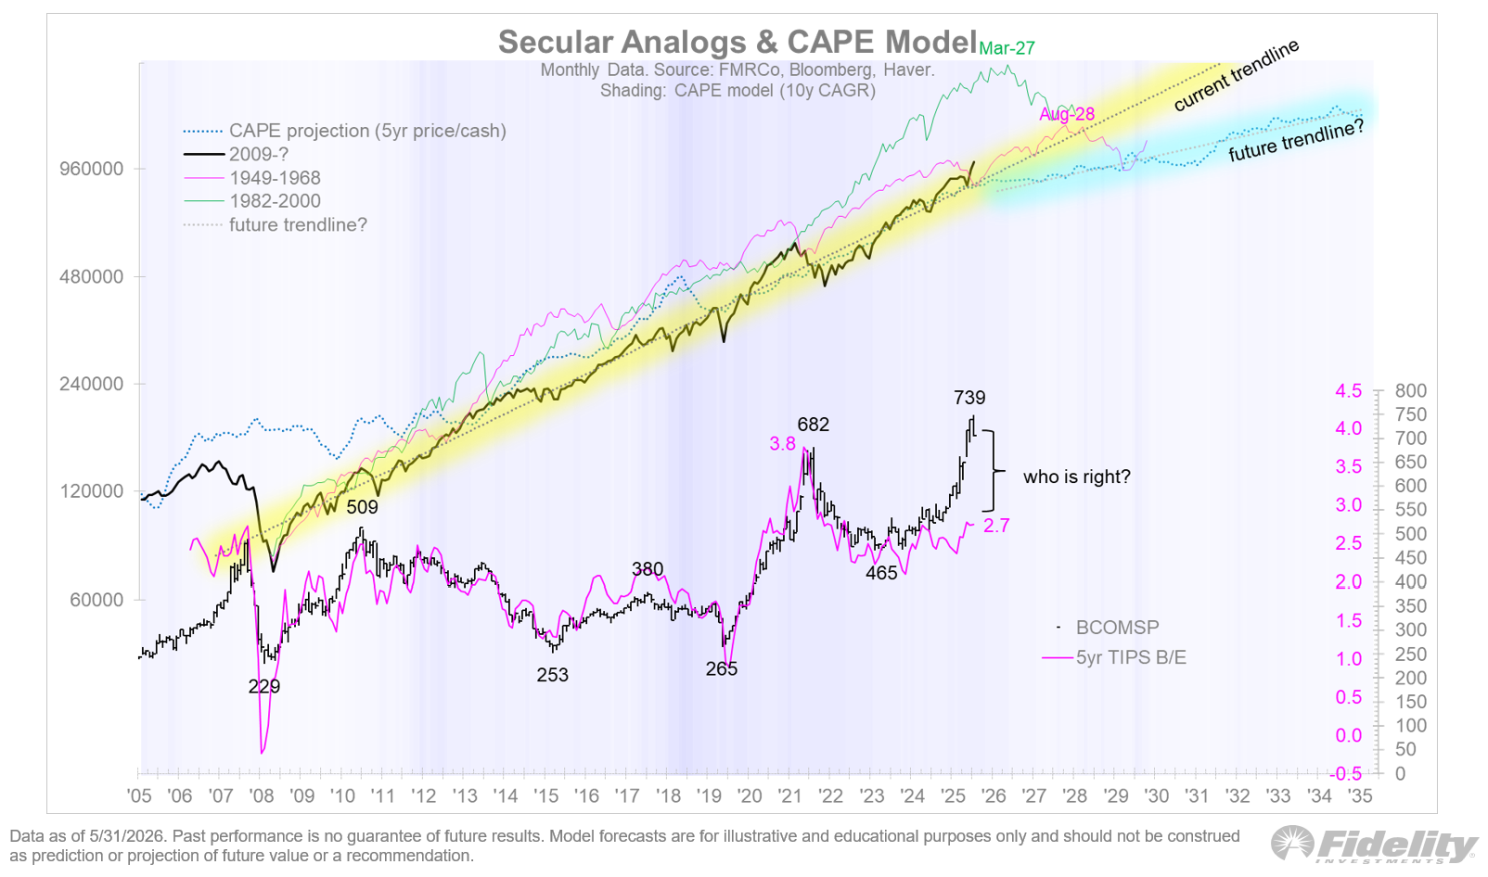
In that sense, commodities and inflation expectations appear to be contradicting each other. If commodities turn out to be right, then the bond market may be underestimating inflationary pressure. In that case, inflation expectations could still rise, bond yields would increase, and equity valuations would come under pressure.
Yet it's questionable whether a commodity supercycle would help bitcoin in the short term. If this is indeed the way the AI bull market comes to a halt, I suspect bitcoin would simply get dragged down with it initially.
In closing
All previous editions of Alpha Markets can be found in the archive. Questions, comments, and suggestions are always welcome in the community.
Thank you for reading!
To stay informed about the latest market developments and insights, follow our team members on X:
- Bart Mol (@Bart_Mol)
- Peter Slagter (@pesla)
- Bert Slagter (@bslagter)
- Mike Lelieveld (@mlelieveld)
We appreciate your continued support and look forward to bringing you more comprehensive analysis in our next edition.
Until then!