Capitulations define the bear market
Last Friday and Saturday, bitcoin traded below $60,000 for the first time this bear market—the culmination of a textbook capitulation. With panic selling exhausted and accumulation signs emerging, is this where the bottom takes shape?

July 1 | Community Event | Bitvavo x Bitcoin Alpha
Bitvavo and Bitcoin Alpha are hosting a meetup at Bitvavo's office on July 1. We kick off at 4:30 PM. There's a content-packed program and we'll wrap up with drinks. All in all, we'll call it a night around 7:30 PM.
We'll be talking about leveraged trading. What is it, how does it work, when is it useful, and can it be done safely?
Bitvavo will then take you behind the scenes: how do you develop a complex feature like margin trading? From initial ideas and user insights to design, compliance, risk management, engineering, and extensive testing.
Register: https://btca.nl/bitvavo
A big misconception about ProCap Financial ($BRR) is that it is a bitcoin company. We are an AI company with bitcoin on the balance sheet. — Anthony Pompliano
A hallmark of powerful bull markets is that hype and excitement peak toward the end of the rally. Not because excitement in itself proves the top is near—things can always get more exuberant. But in hindsight, once the top is in, it turns out that most investors entered during that final phase. Firmly convinced, of course, that prices had much further to climb.
Strength and weakness alternate. In every market and on every time frame. In fact, they cause each other. The overconfidence and euphoria during periods of strength lay the groundwork for the fear and panic during periods of weakness.
Those who entered near the top face a choice on the way down. Sit tight and wait for better times, or cut their losses. The latter is sometimes a rational decision based on a pre-made plan. But more often, emotions take center stage because the red numbers in the portfolio app become unbearable.
In a bear market, there are brief moments when many of these loss-driven sales converge. Price drops, investors sell. Price drops further, investors sell more. A flywheel of panic that only stops when the last doubter has been shaken out. These are the capitulations that define the bear market.
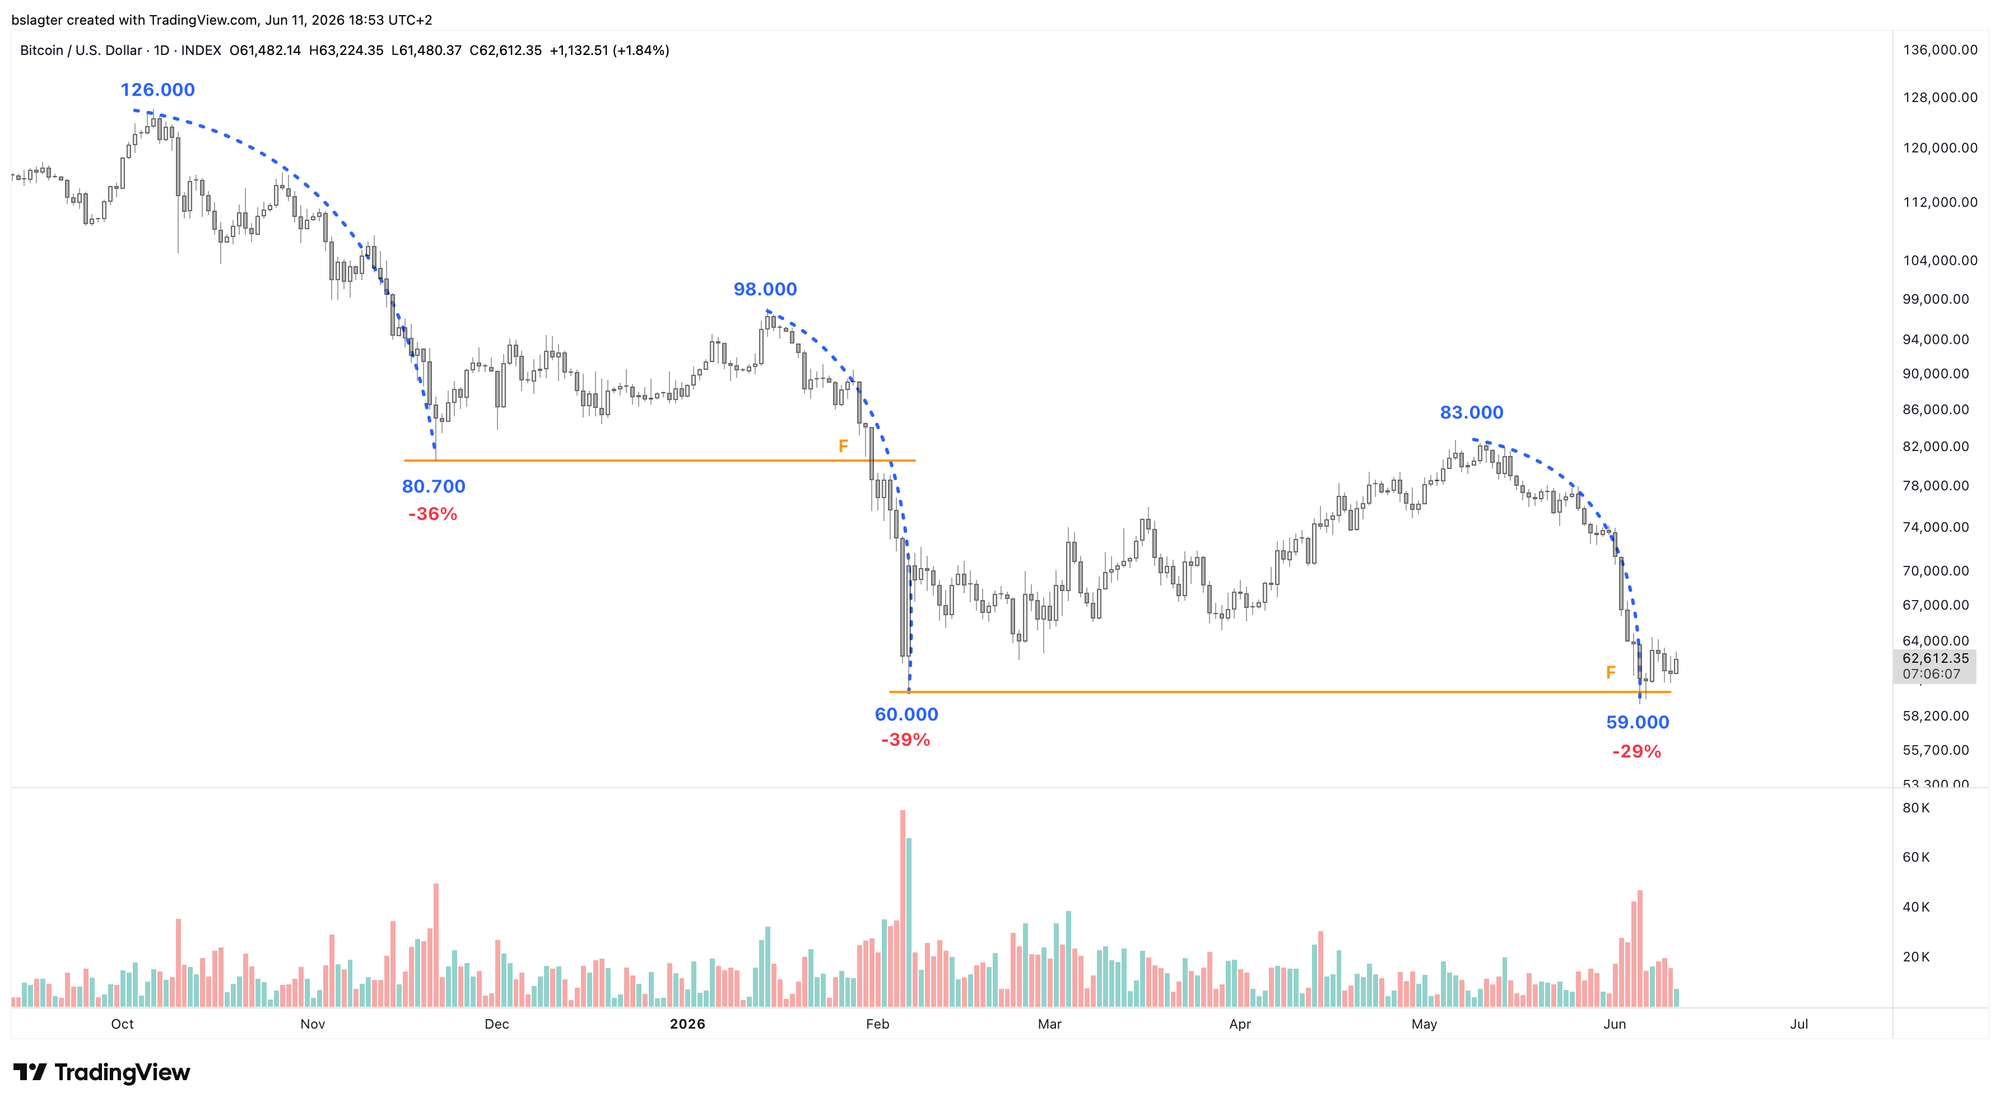
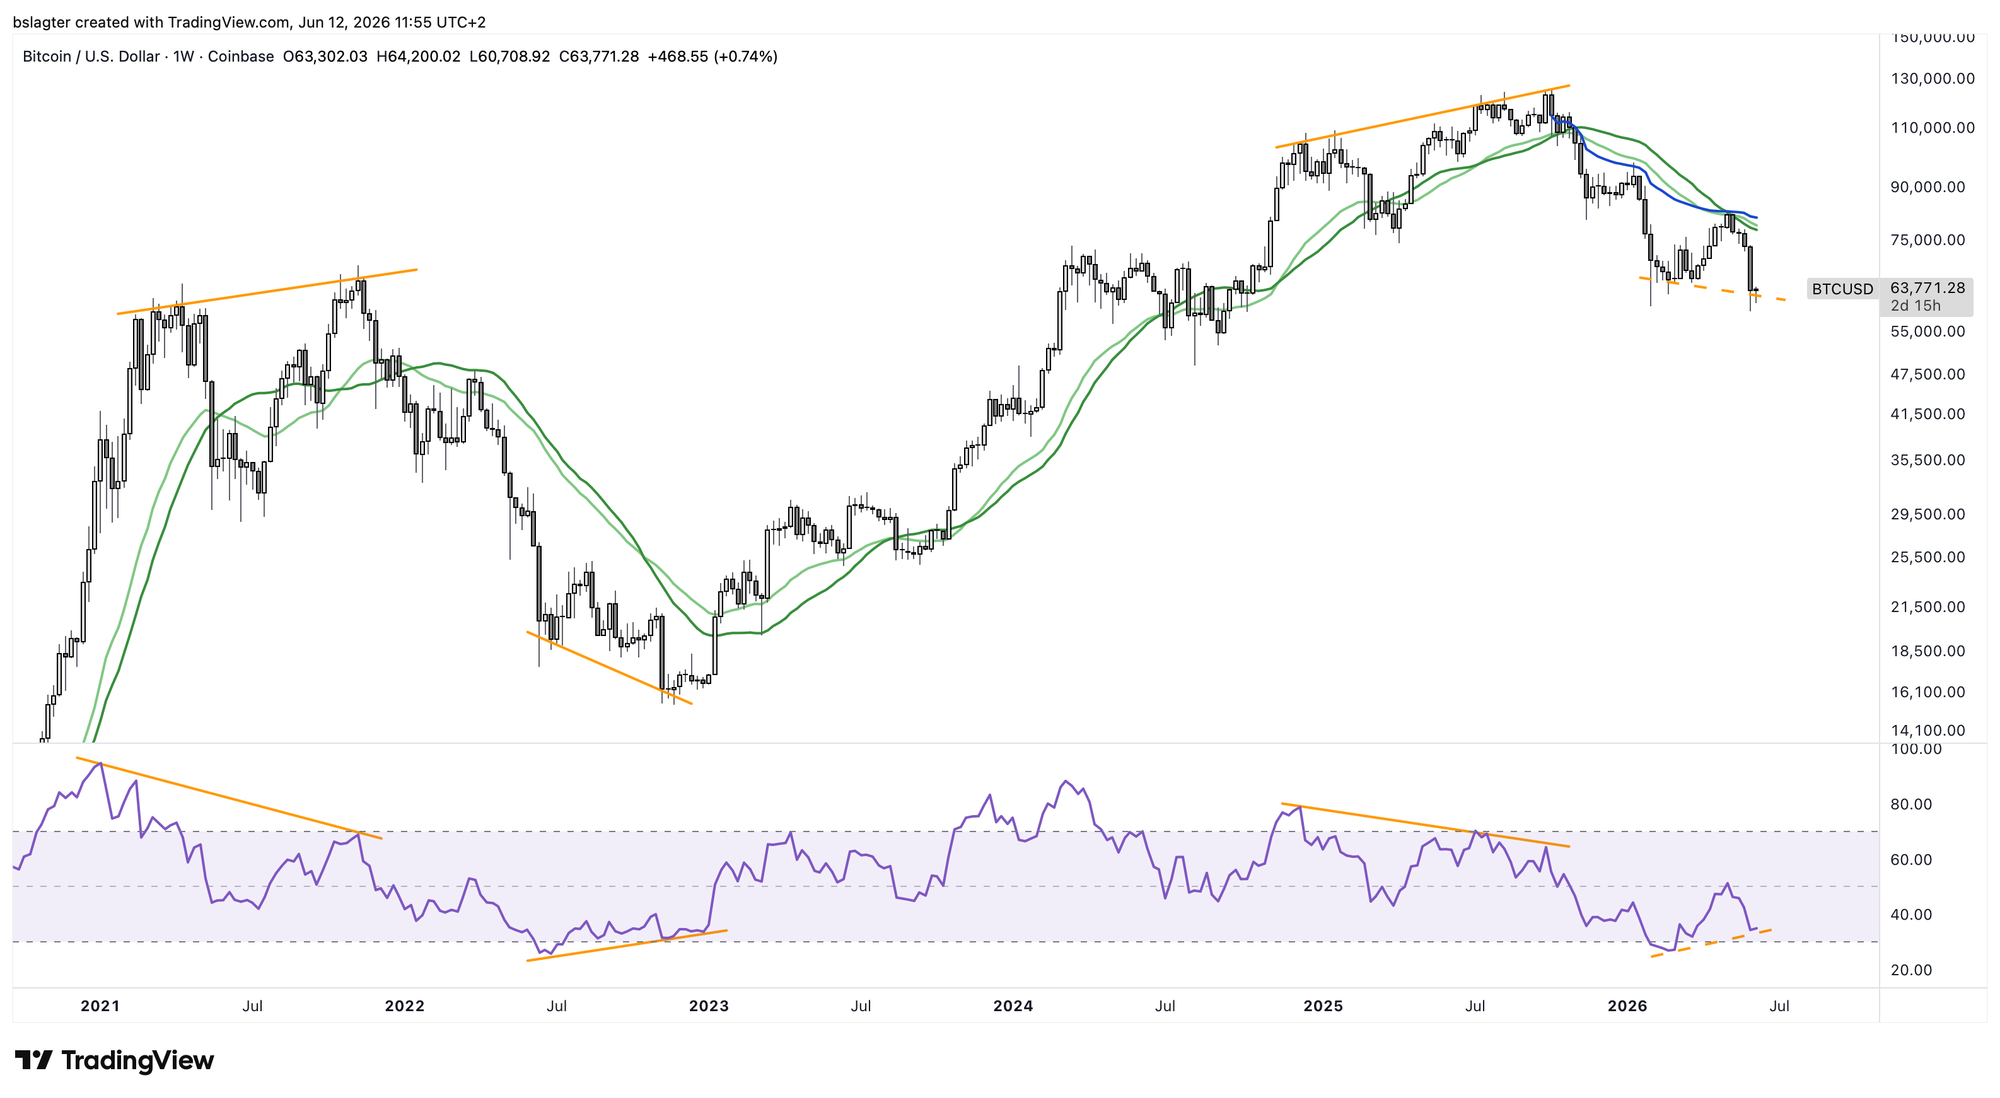
In the chart below, you can see the capitulations of this bear market. The blue dashed line marks the parabolic acceleration. At the bottom, you can see the spikes in trading volume that coincide with them.
The most recent capitulation was last Friday, June 5. In the span of five days, price dropped 20% from $73,000 to $59,000. That's below the $60,000 level from February 6, making it the lowest point of this bear market.
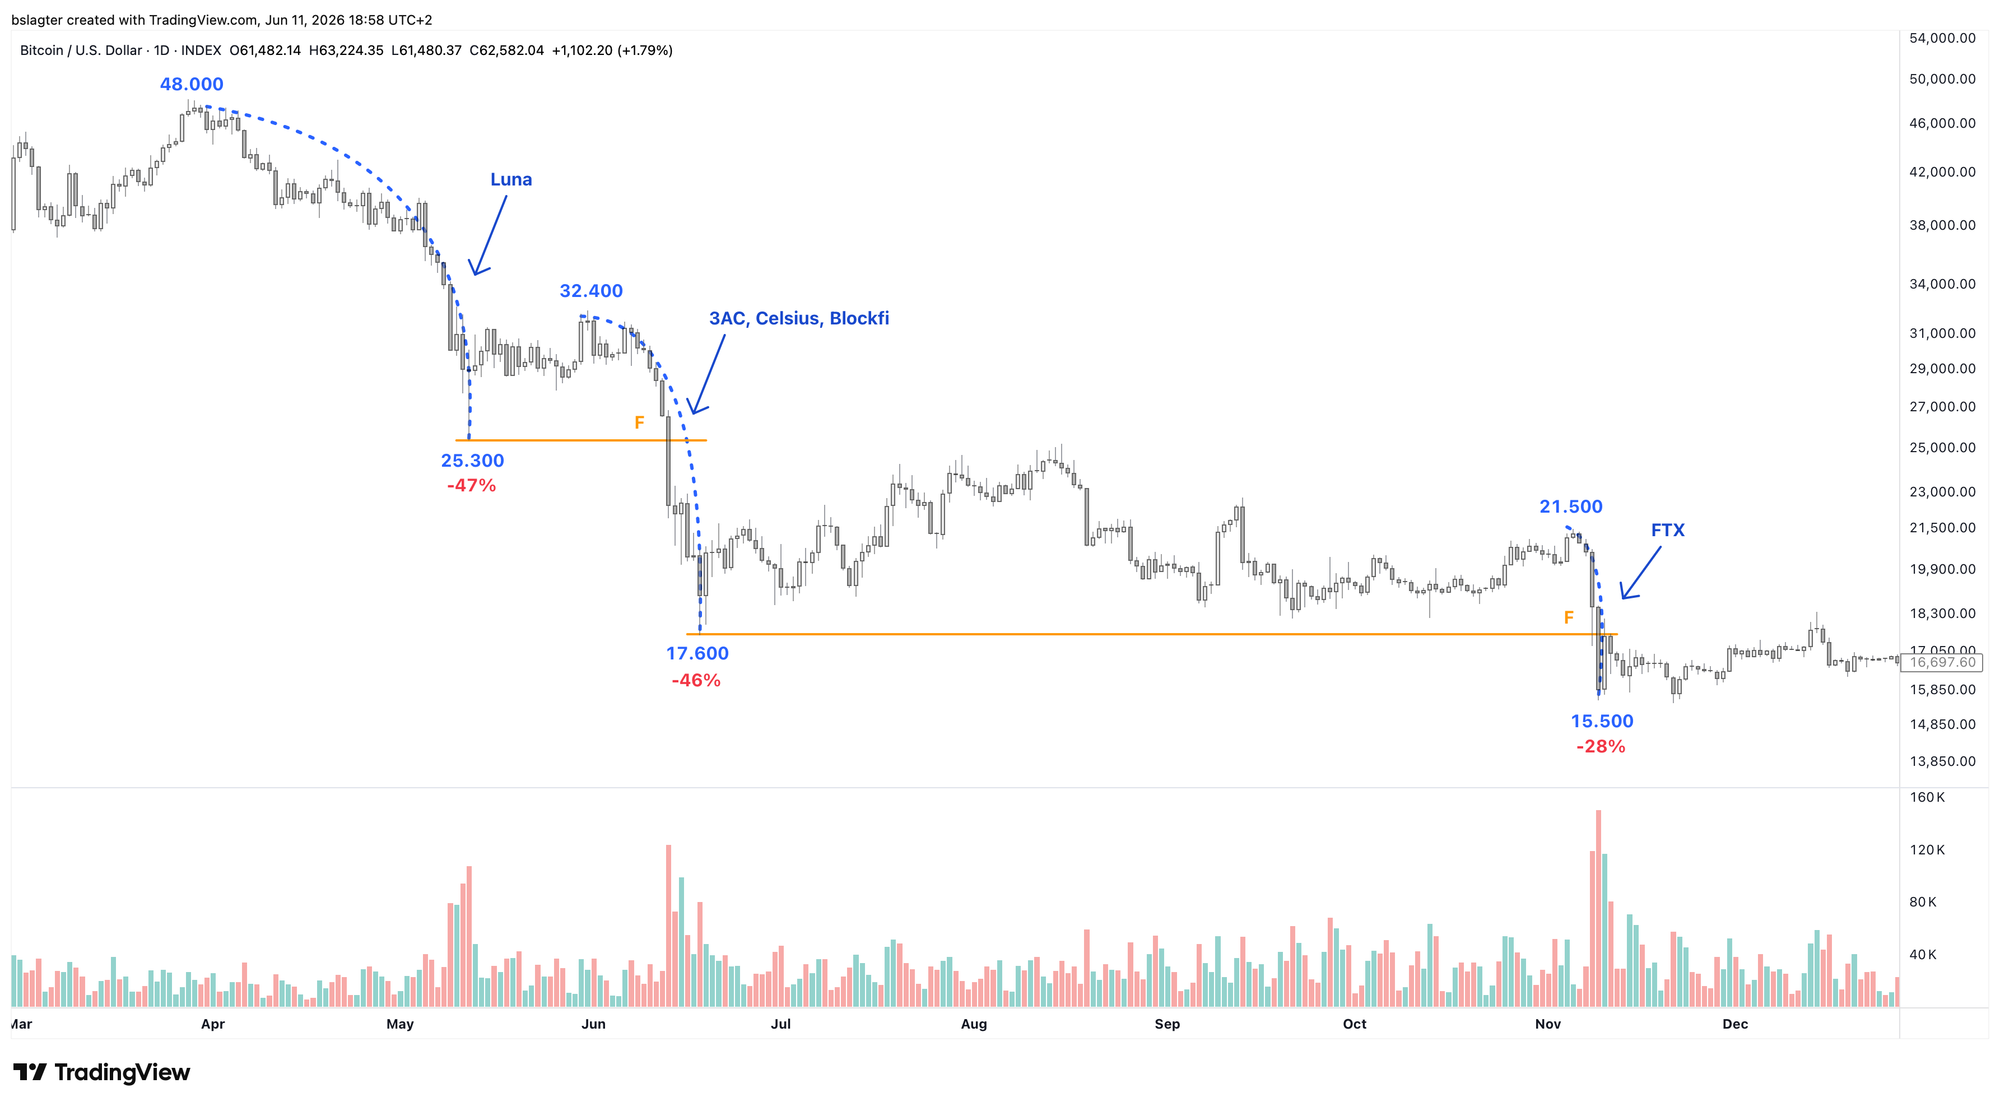
In the previous bear market, we saw a similar series of capitulations—just look at the chart below.
Back then, each capitulation coincided with a high-profile event. In May, Terra imploded—the platform behind stablecoin UST and the Luna token—wiping out tens of billions of dollars in investor capital. In June, Three Arrows Capital, BlockFi, and Celsius buckled under the aftershocks of that implosion. And in November, FTX was exposed: customer funds, it turned out, weren't safely locked away in the vault.
We haven't given names to the capitulations of this bear market yet. For last Friday's event, you could point to Strategy or Michael Saylor, as we discussed in last week's Markets edition. But the connection isn't particularly strong.
Frustrated investors love to point fingers. In the previous bear market, we blamed collapsing companies; now we're looking at capital flowing to other markets. First to gold and silver, then to AI.
In reality, it's simply the bear market unfolding. Roughly three years of strength, then a year of weakness.
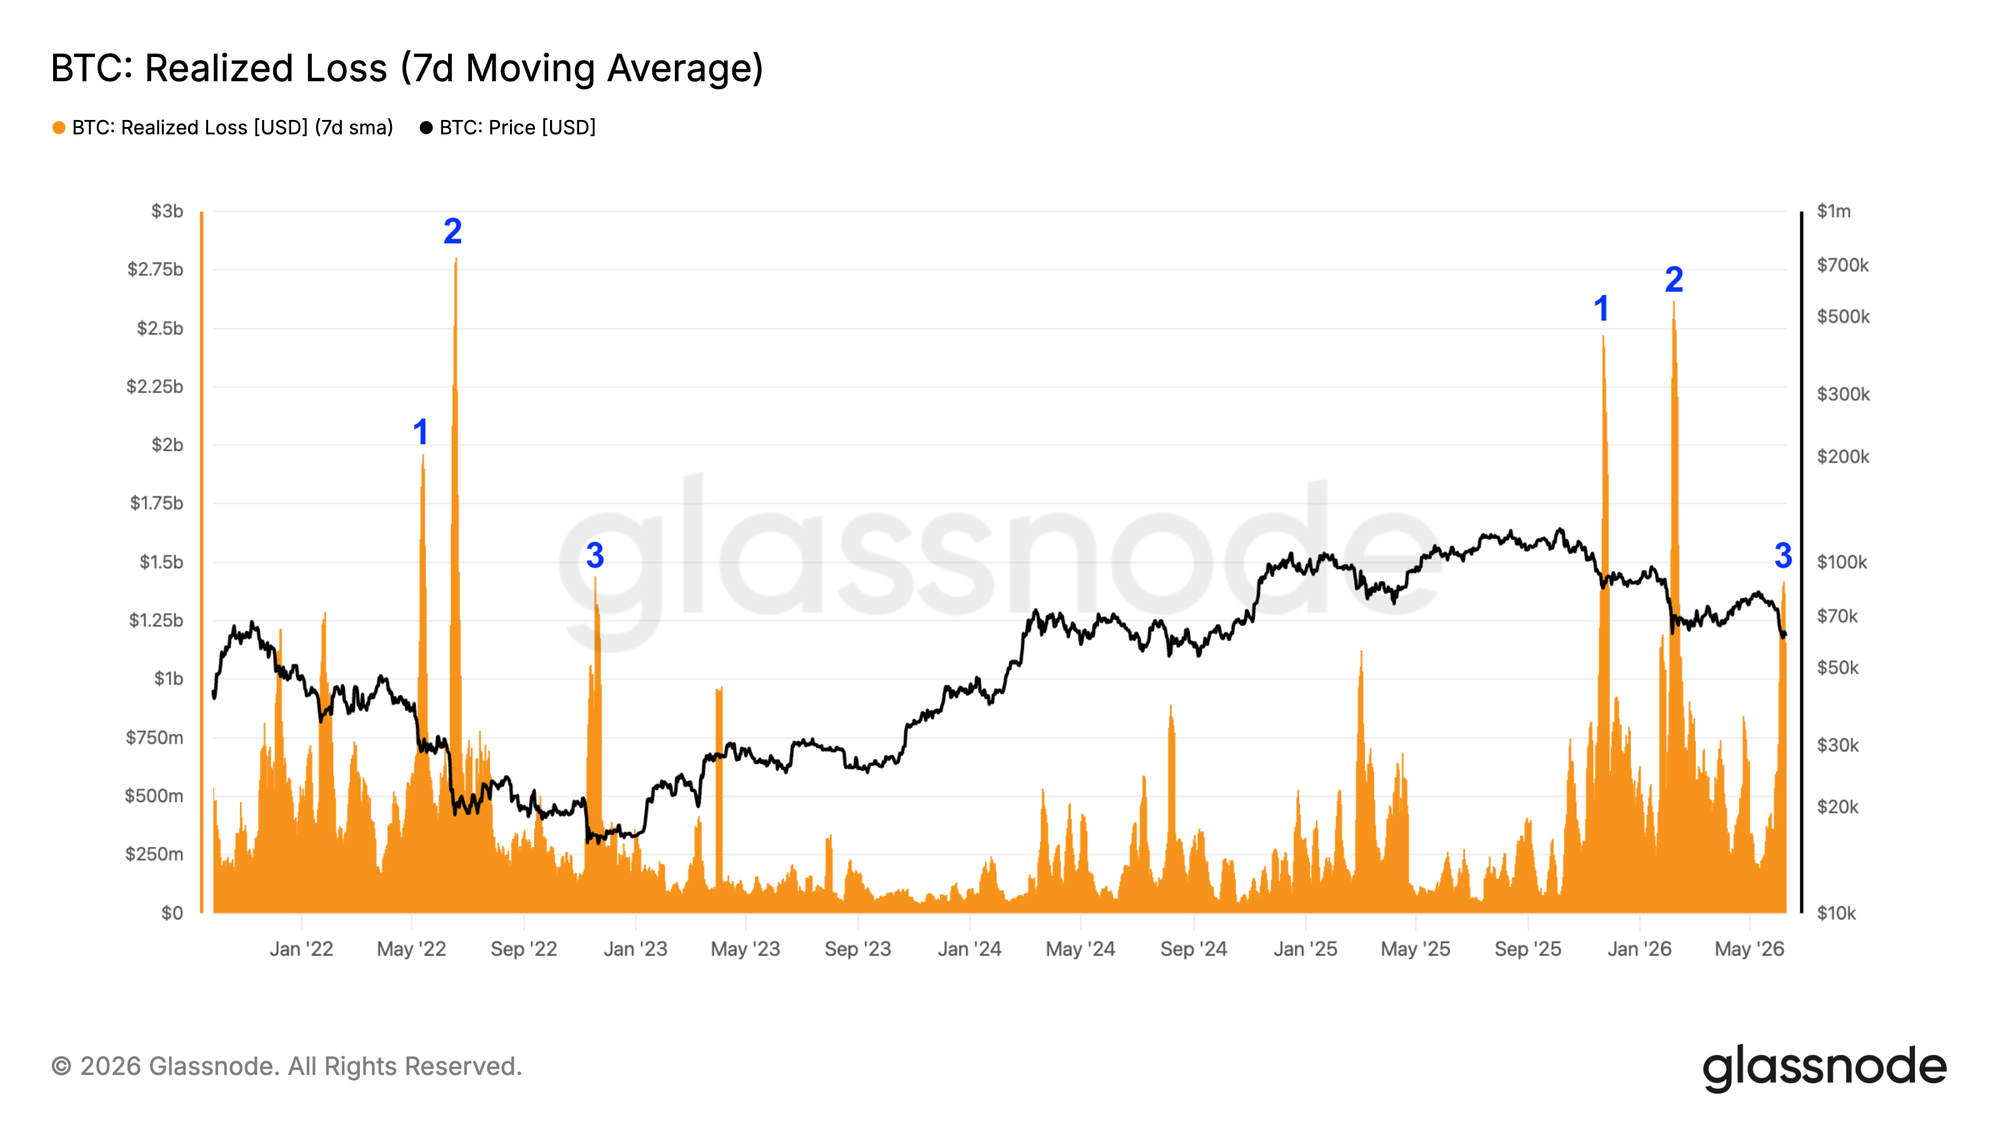
The capitulations are also clearly visible in on-chain data. The chart below shows the realized loss—the sum of all losses investors took on a given day. We use the 7-day moving average to compare the magnitude of different capitulations.
On Friday and Saturday, we saw prices slightly below $60,000. We're now six days later, and there's been little recovery. We continue to hover around $62,000.
Loss-taking has almost completely stopped. That's understandable. If you didn't exit during the turbulent plunge of a capitulation, why would you in the weeks or months after?
Significantly lower prices would be needed to entice investors to realize large losses again. If we keep hovering around these levels, this is where the bottom forms.
We're seeing signs of accumulation in the data. Determined investors are patiently buying small amounts around these prices. Until there's too little left to buy at this price, and the price rises to unlock more supply.
Capitulation is also about people leaving the market and the ecosystem, searching for greener pastures. That exodus has peaked as well. Where else is there to go? Gold and silver haven't exactly been a party for several months. And AI increasingly feels like a late trade for more and more investors.
All things considered, the picture is emerging that the bottom could form over the coming months.
Some will argue that October is more likely, pointing to the four-year cycle variant where the top consistently falls in month 35 and the bottom in month 47.
There's no explanation for the existence of such a metronomically precise cycle, other than the self-fulfilling prophecy. If enough people believe in it and trade accordingly, it happens.
That's possible. But there will come a time when this regularity breaks. And this could very well be it. Waiting until October is, in any case, not a necessity.
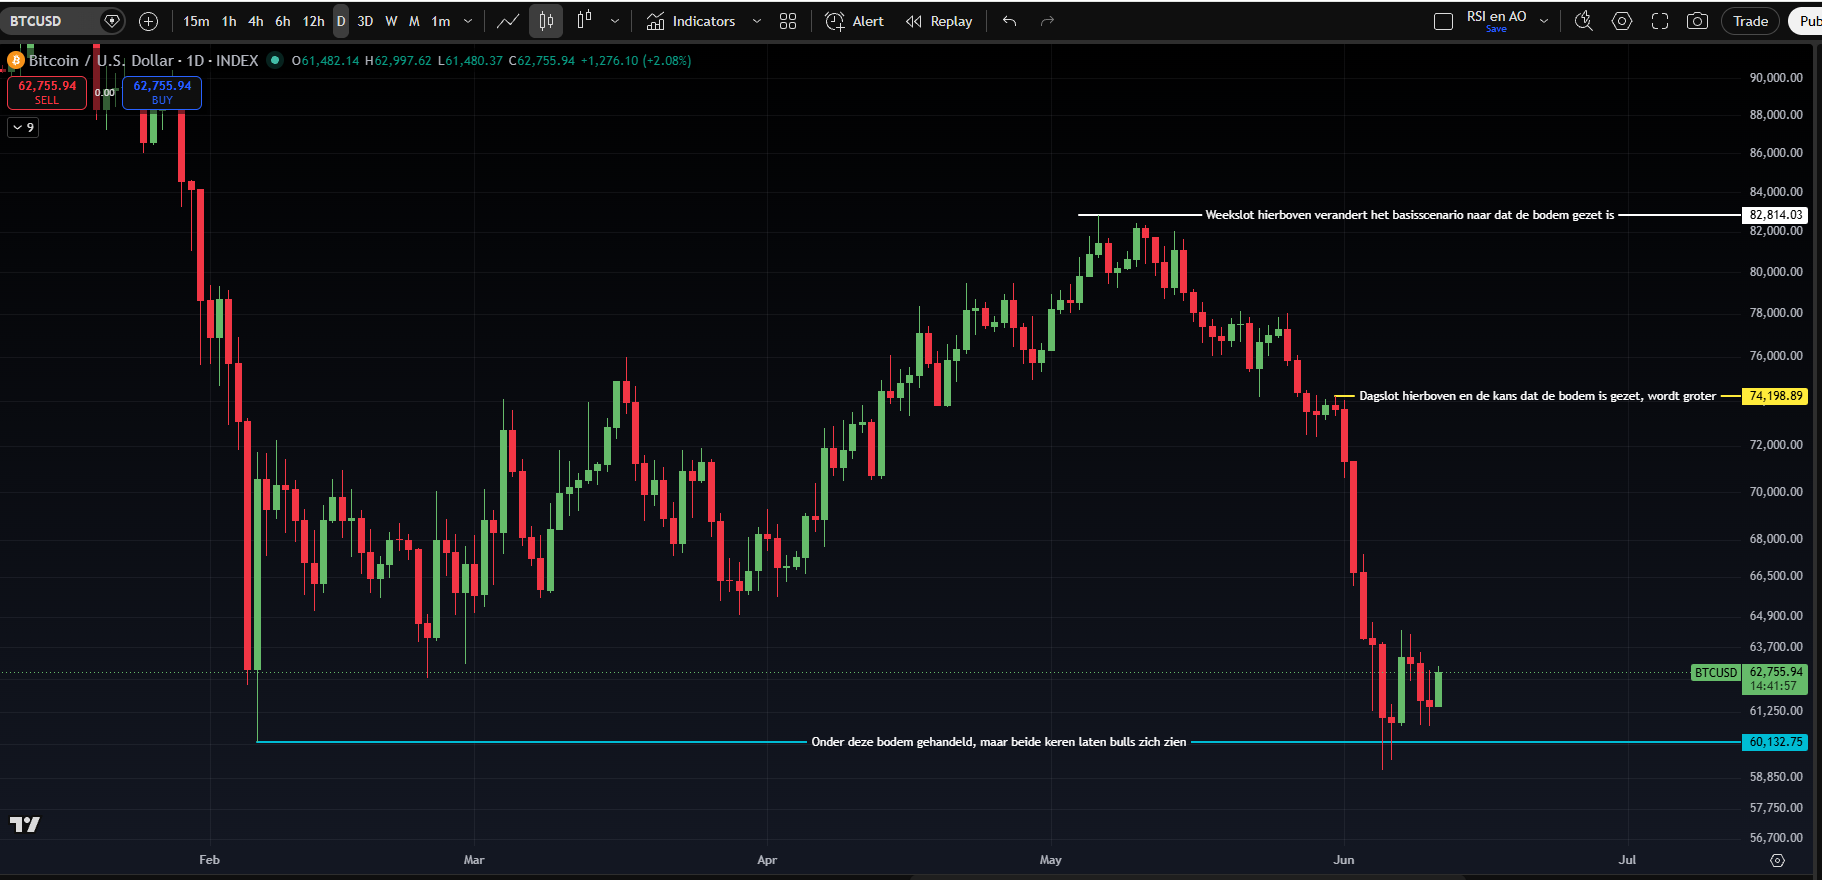
That brings us to the chart of our base scenario: the mild bear market. The $59,000 price confirms the downtrend is still intact. The $83,000 top was a lower high (LH), and we're now in the process of establishing a lower low (LL).
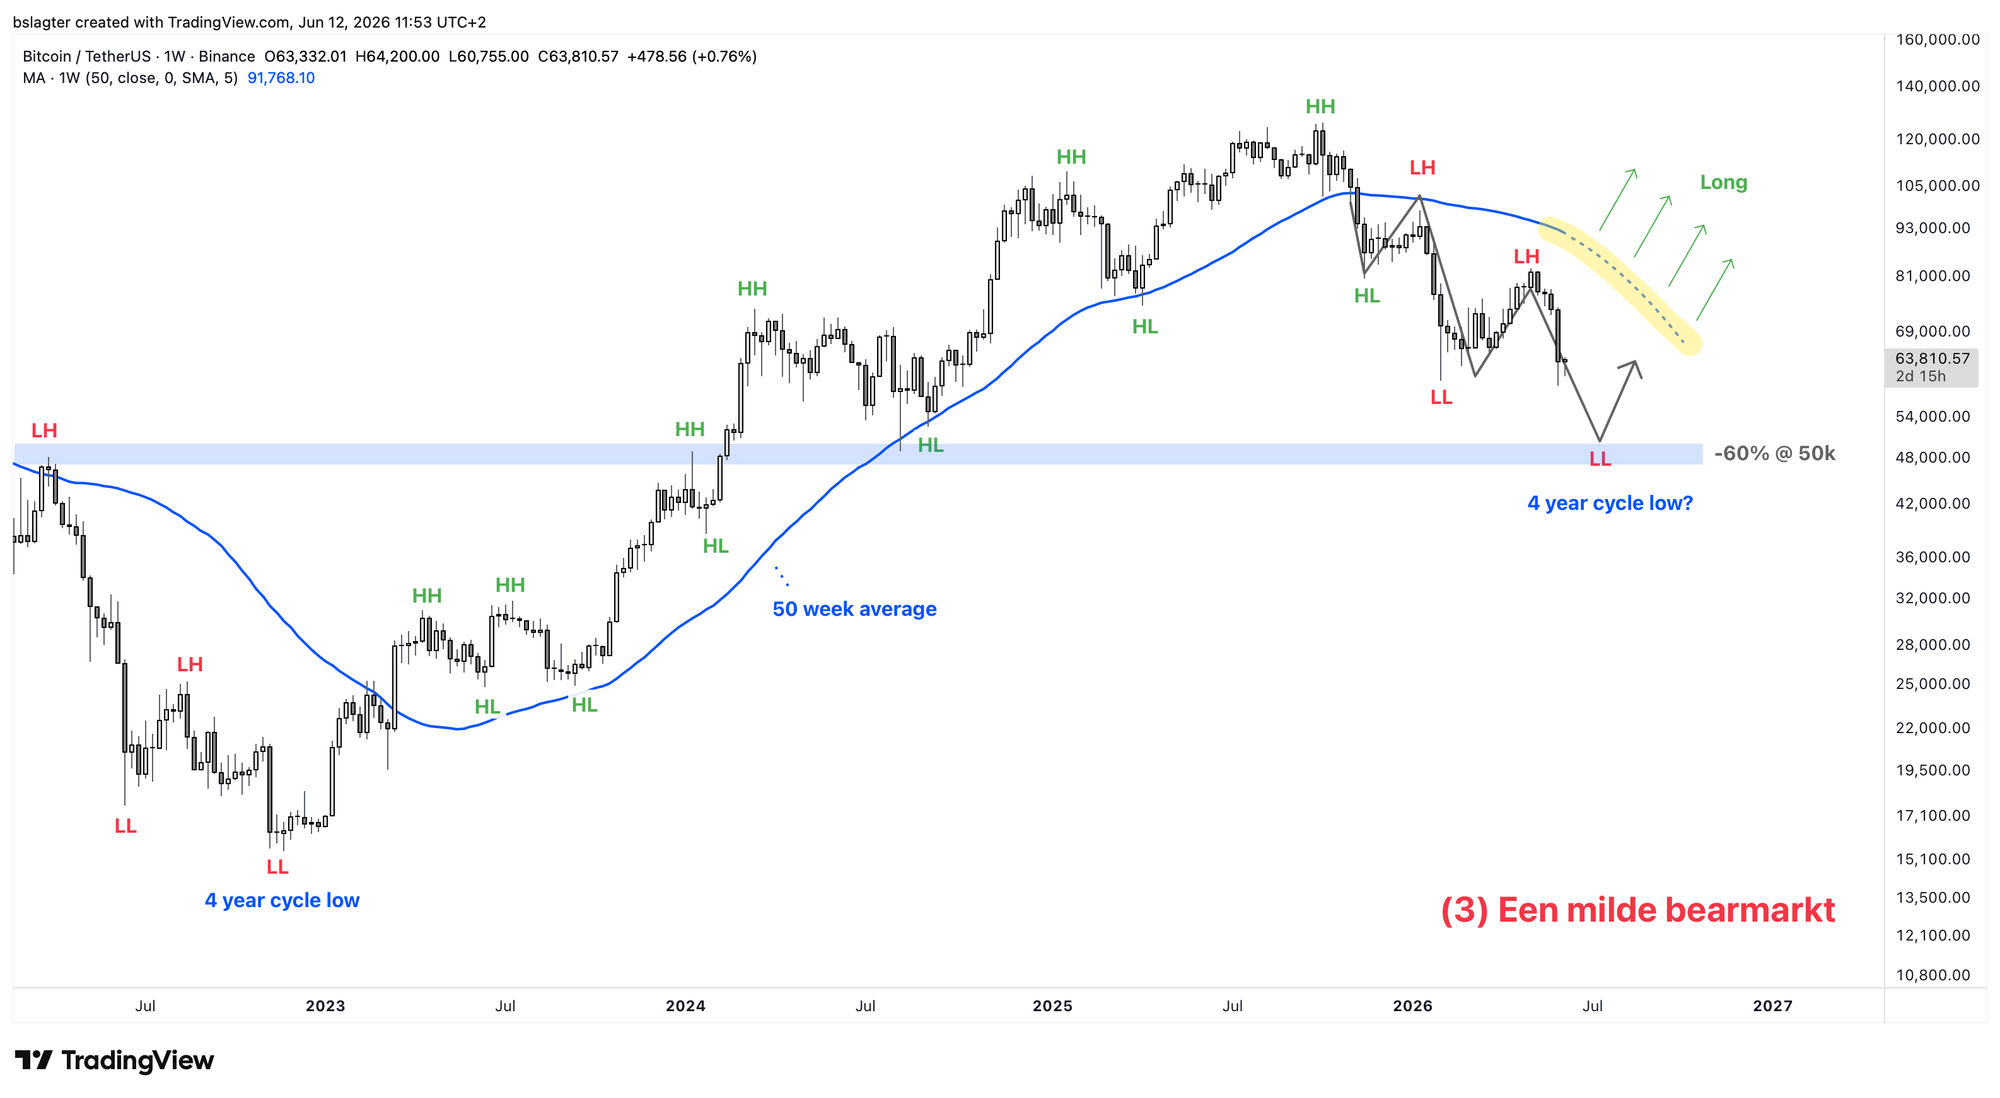
In last week's Markets edition, we outlined what needs to happen to gain more confidence that a new bull market is beginning. Here's the updated checklist:
⏹️ A higher low (HL) above the $59,000 level from June 5
⏹️ A higher high (HH) above the $83,000 level from May 6
⏹️ A weekly close above the 50-week moving average at $91,700
⏹️ A directional change of that moving average from declining to rising
We can't check off a single box yet. However, we are seeing the first early signals that we might be developing bullish divergence on the weekly chart. See last week's Markets edition for more details.
This is emphatically potential bullish divergence. Further decline in price and the indicator could invalidate the divergence. Only if that decline fails to materialize and the divergence persists do we consider bullish divergence a valid signal.
We continue with the following topics for our Alpha Plus members:
- Who sold during the capitulation?
- Is it time to buy gold yet?
- A lower low with hope
- Rising rates warn the market, but AI remains king for now
- Inflation surprise gives bitcoin breathing room, but solves little
1️⃣ Who sold during the capitulation?
Bert
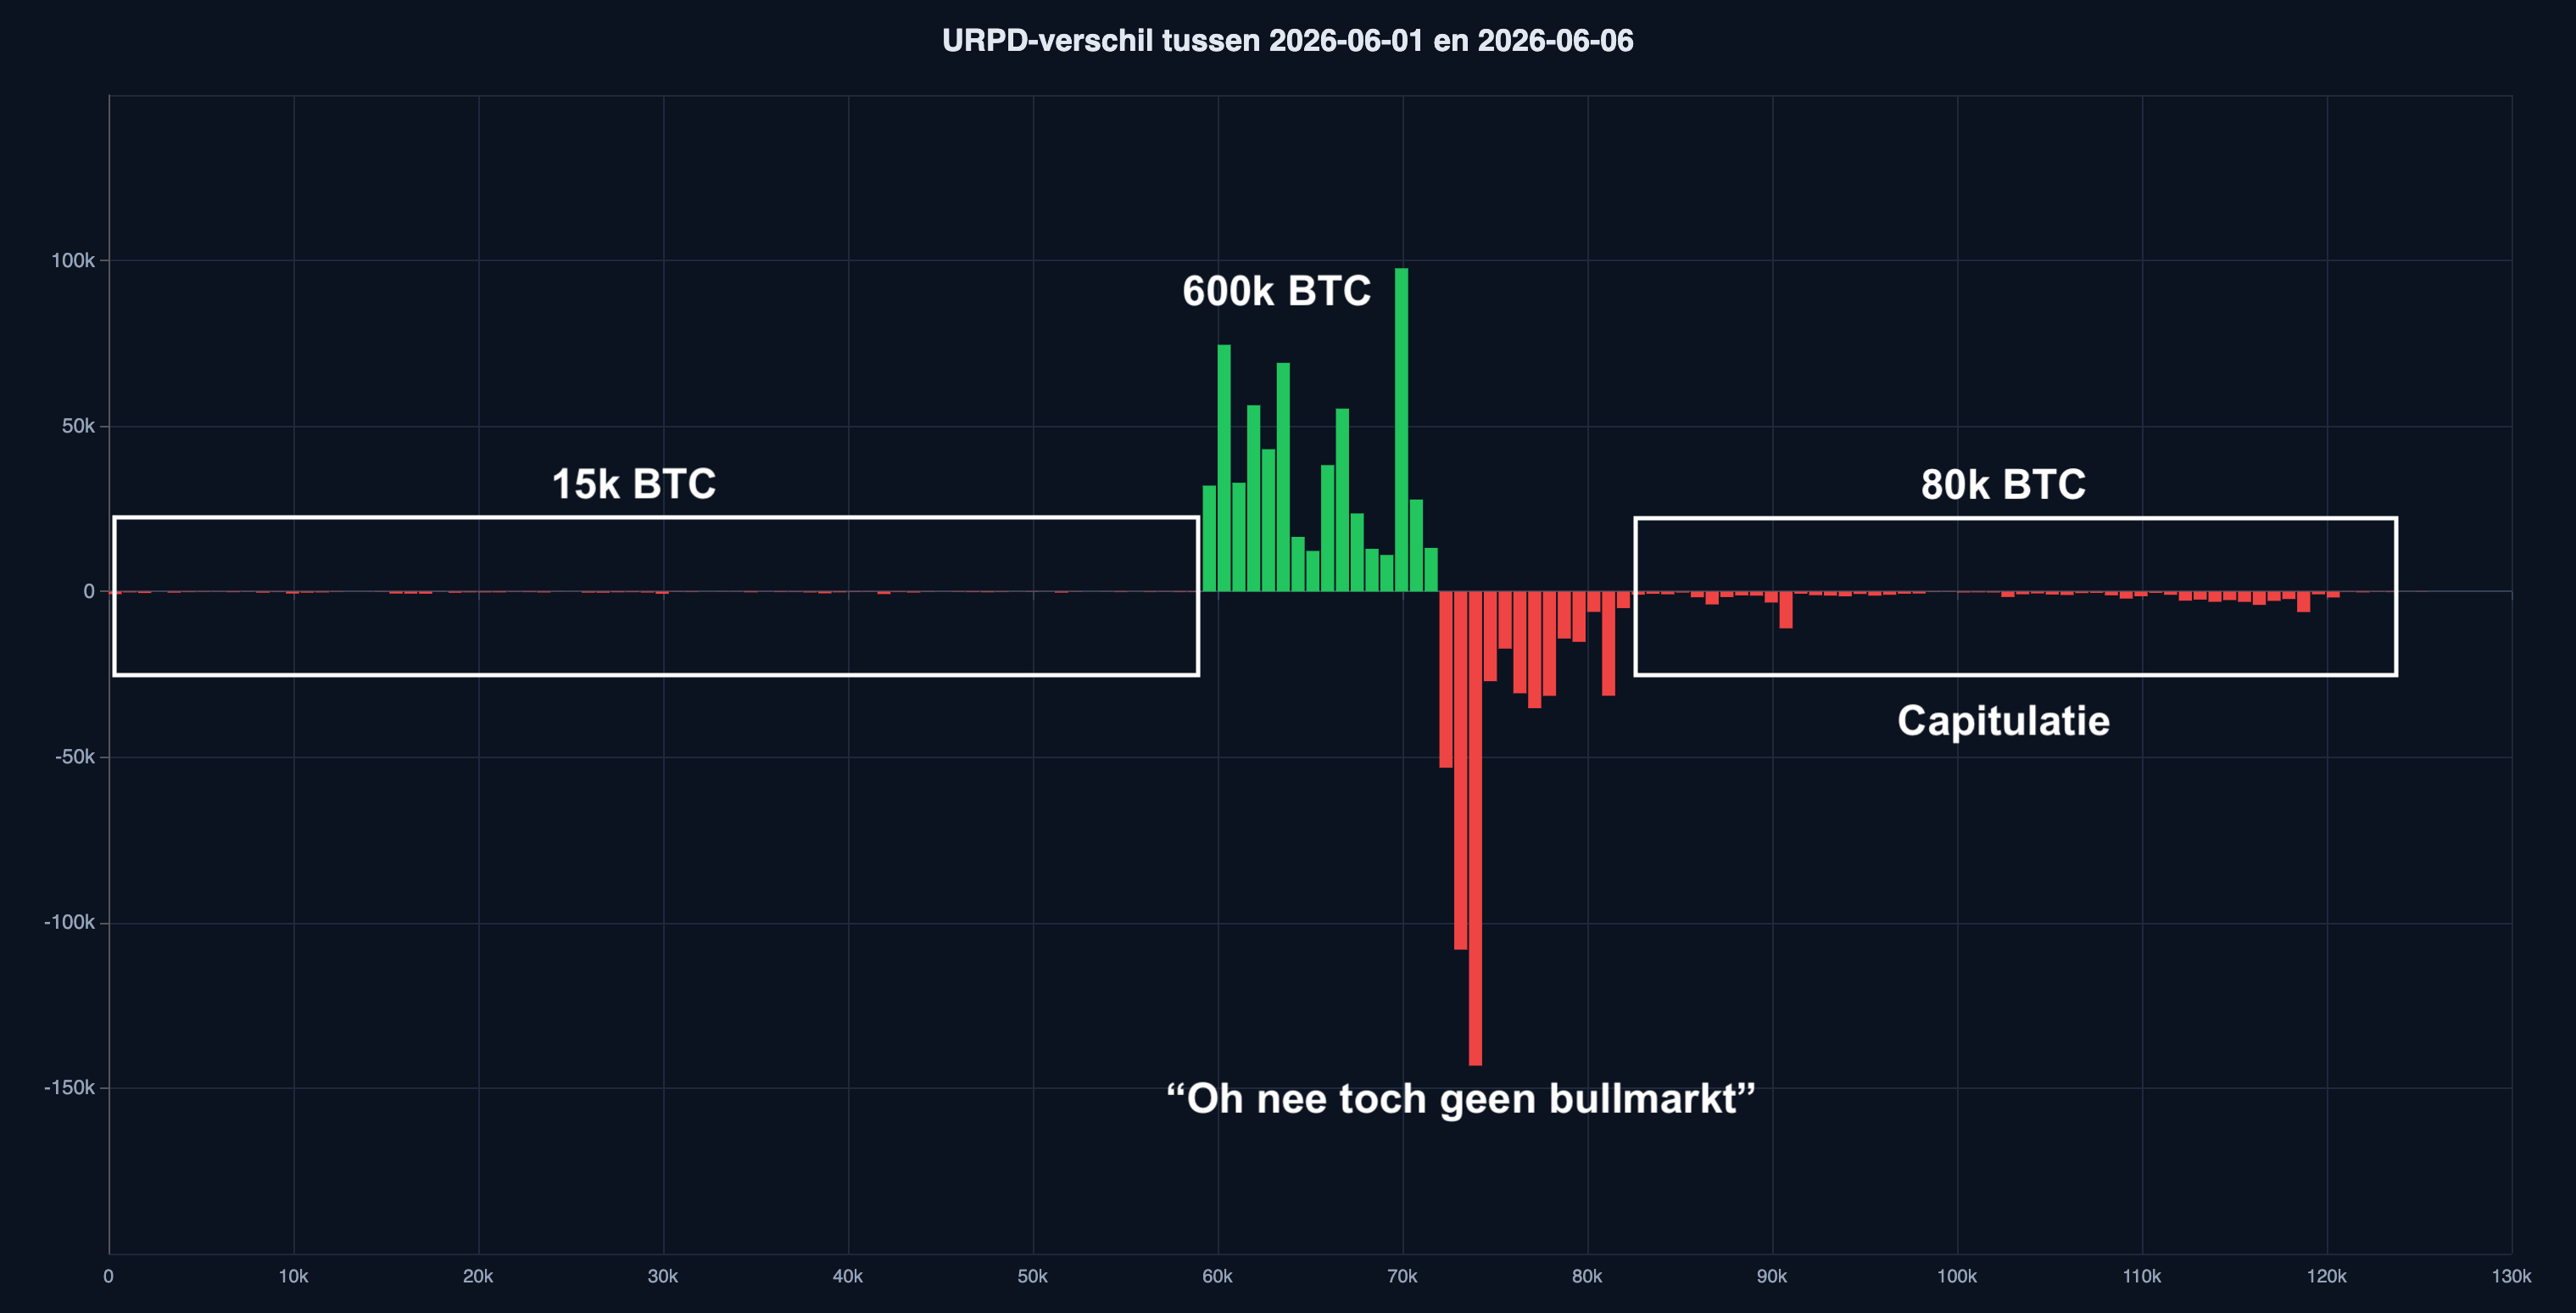
Between Monday, June 1 and Saturday, June 6, 80,000 BTC were sold by holders with a cost basis above $83,000. That's capitulation: bought near the top, and exiting at a loss in a panic-driven selloff.
Of the 600,000 BTC that moved on-chain in a transaction, the majority was short-term trading. That's a lot of bitcoin, but the per-coin losses are small. They contribute relatively little to realized losses.
And the OGs? They barely moved—only 15,000 BTC sold.
All in all, the picture that emerges is perfectly normal for this phase of the bear market.
2️⃣ Is it time to buy gold yet?
Bert
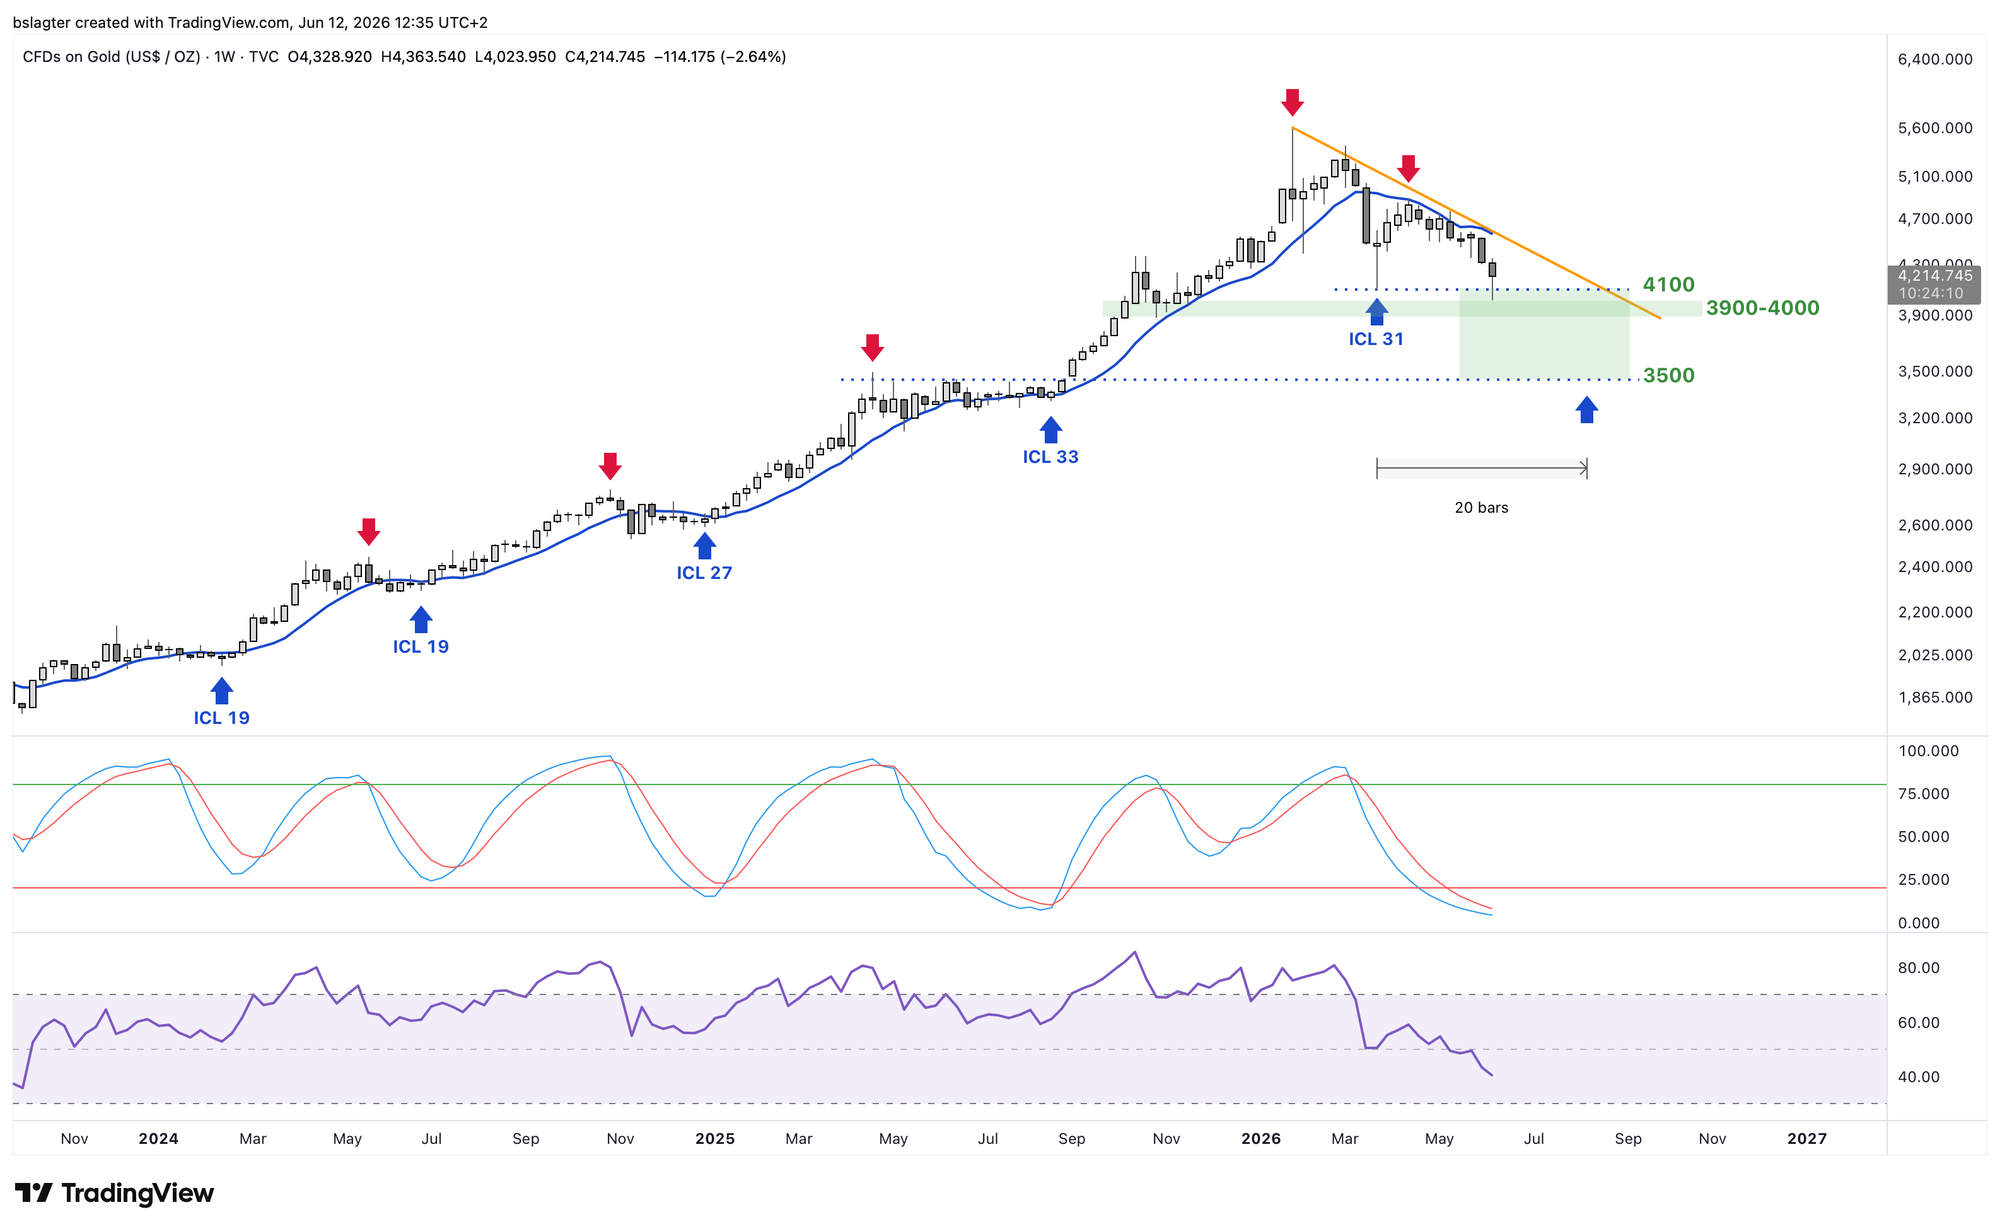
Many of us expect gold to be in a multi-year bull market, of which we've only seen the first leg in 2025. The price doubled in twelve months from $2,600 in January 2025 to above $5,500 in January 2026. Since then, the precious metals market has been cooling off.
There's nothing wrong with that. After a series of rising weekly cycles, we're now seeing a declining weekly cycle. It wouldn't be surprising if we see the bottom in the third quarter, somewhere between $3,500 and $4,100. We got the first dip into that zone this week.
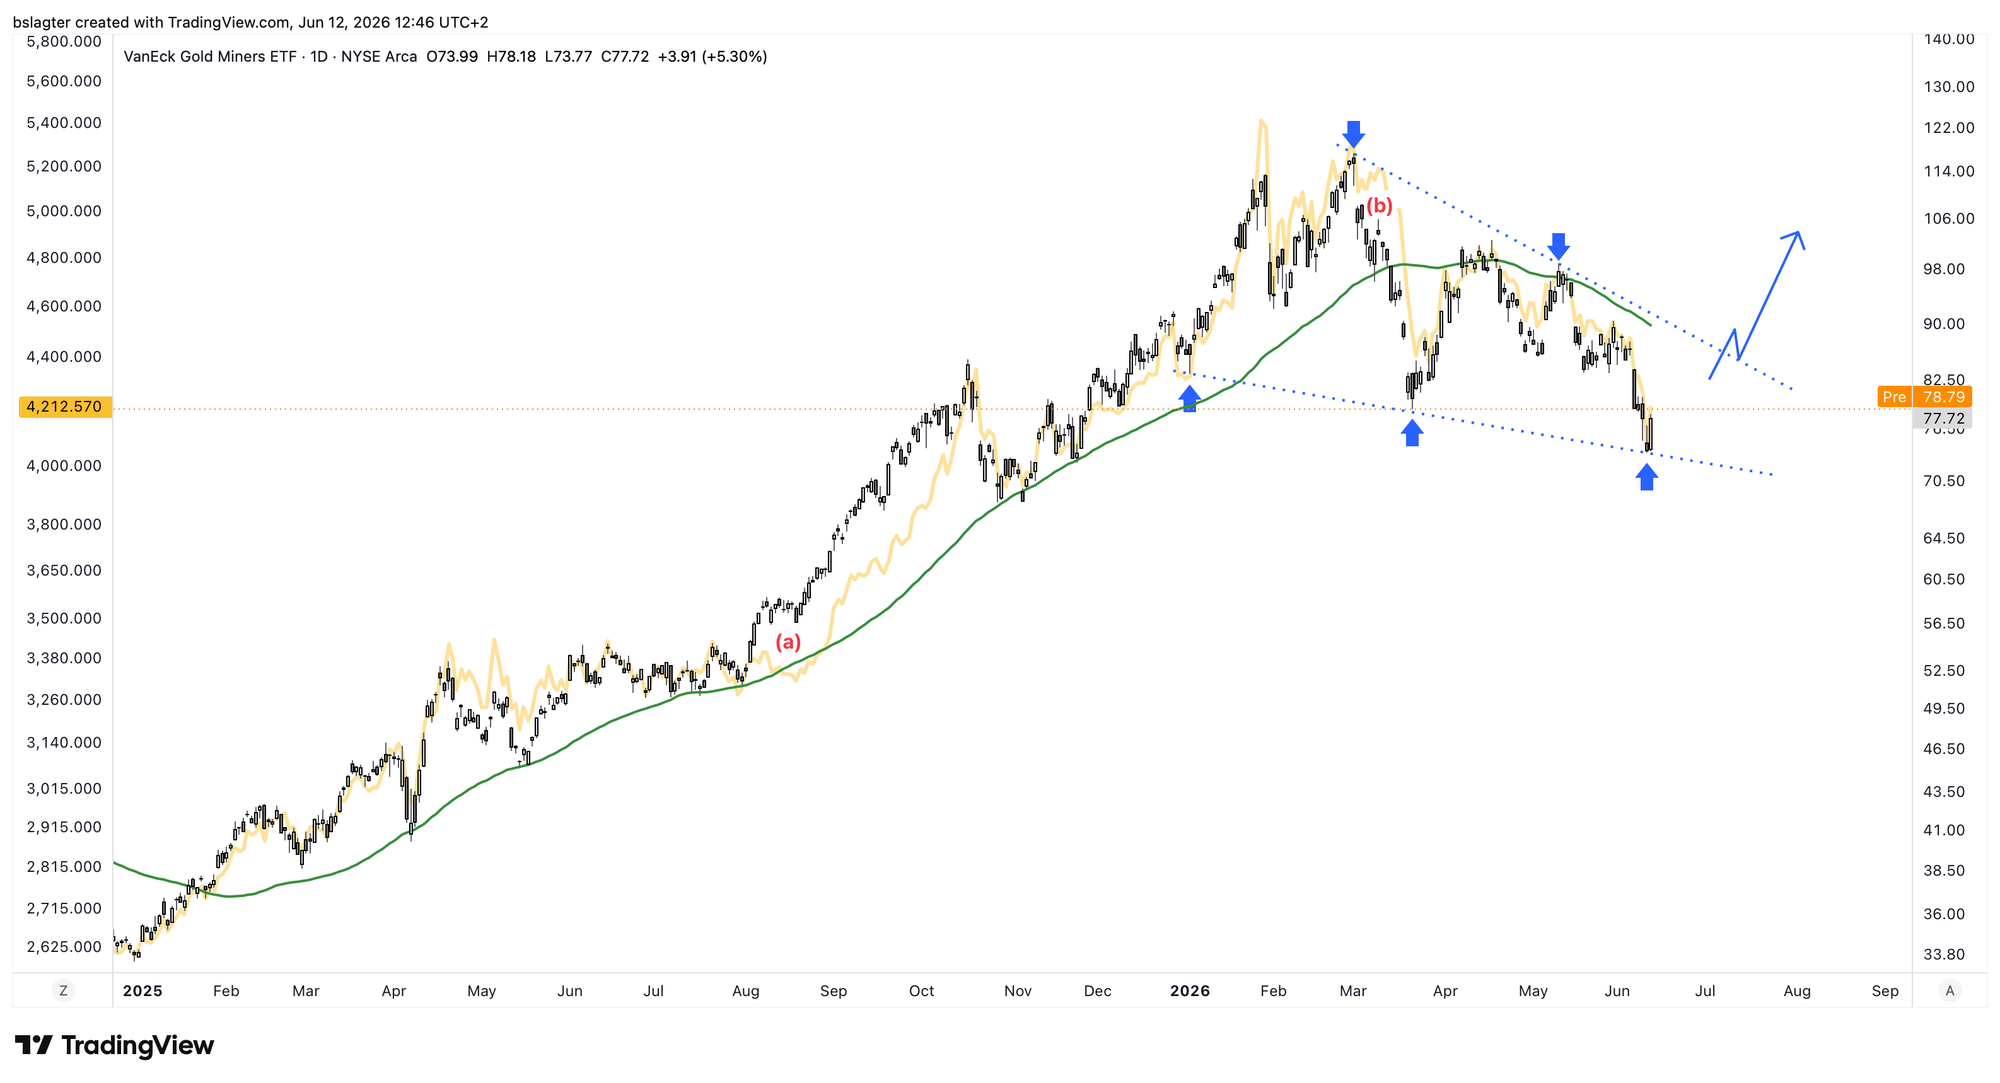
An interesting way to express bullish sentiment on gold is through a gold miners ETF. The chart below shows the price of GDX, Van Eck's gold miners ETF.
The dark yellow line is the gold price. You can see that miners sometimes lead the metal itself, as in August 2025 (a) and March 2026 (b).
GDX may be forming a falling wedge pattern here. The five touch points that give it validity are there. The pattern only generates a signal upon a breakout. If that breakout is to the upside, it could provide a solid entry point.
3️⃣ A lower low with hope
Sam
Last week, in the section "The critical hurdle at $74,000" of Alpha Markets, we discussed the significance of that price level. The premise was that we had seen the bottom in February. Although that premise could be tossed in the bin on the very day of publication due to the lower low of approximately $59,000, $74,000 remains the most important price level.
Because price plummeted to $59,000 without any meaningful bounce, a daily close above $74,000 is still needed to establish a higher high on the daily chart. In the current environment—with a weak crypto market and corrections in precious metals and equities—that's a tall order.
Yet the recent bottom has also offered some cautious signs of hope. For the first time since the brakes were pulled, bitcoin traded below a "swing low" (a low with higher lows on both the preceding and following candles) on the weekly chart, but managed to close above it.
Additionally, sellers once again tried to break the $60,000 level, and the bulls managed to defend it yet again. Finally, equity indices are still setting lower lows compared to last Friday, while bitcoin is—for now—printing a higher low.
The caveat here is that equities are coming off a strong rally with successive all-time highs, while bitcoin has been in a months-long bear market. Still, this relative strength is noteworthy.
The coming weeks will have to reveal whether $60,000 continues to find buyers if equities extend their correction. It's important to keep in mind that market structure across all significant time frames remains bearish, which is why the base case remains that the recent low will be retested. The reaction that follows will provide more clarity.
4️⃣ Rising rates warn the market, but AI remains king for now
Thom
Last Friday, the stock market took a sudden hit after a strong U.S. jobs report pushed bond yields higher and sent the dollar surging. While it wouldn't necessarily be bad for bitcoin if the euphoria around AI stocks cooled off a bit, I don't expect this development to be the catalyst for that.
Bubbles typically burst only when investors lose faith in the underlying narrative and exit en masse. As long as they still believe the story but are temporarily hedging against risk, it's more about defensive positioning than the end of a bull market.
In my view, that's what we saw last Friday. No sudden loss of confidence in the AI revolution, but a market that had swung too far in one direction and was temporarily checked by rising rates.
At the same time, we're gradually approaching a point where government bond yields start competing with equity earnings yields.
You can think of it as two forces beginning to collide. On one side, we have rapidly rising corporate earnings, profit margins at record highs, and low credit spreads that still make it relatively cheap to raise capital.
On the other side, longer-term rates are climbing, real yields are rising alongside them, and inflation is once again becoming an increasingly visible problem. In that regard, Friday felt like a warning shot—but probably not yet the moment when the market fully shifts its attention to this side of the equation.
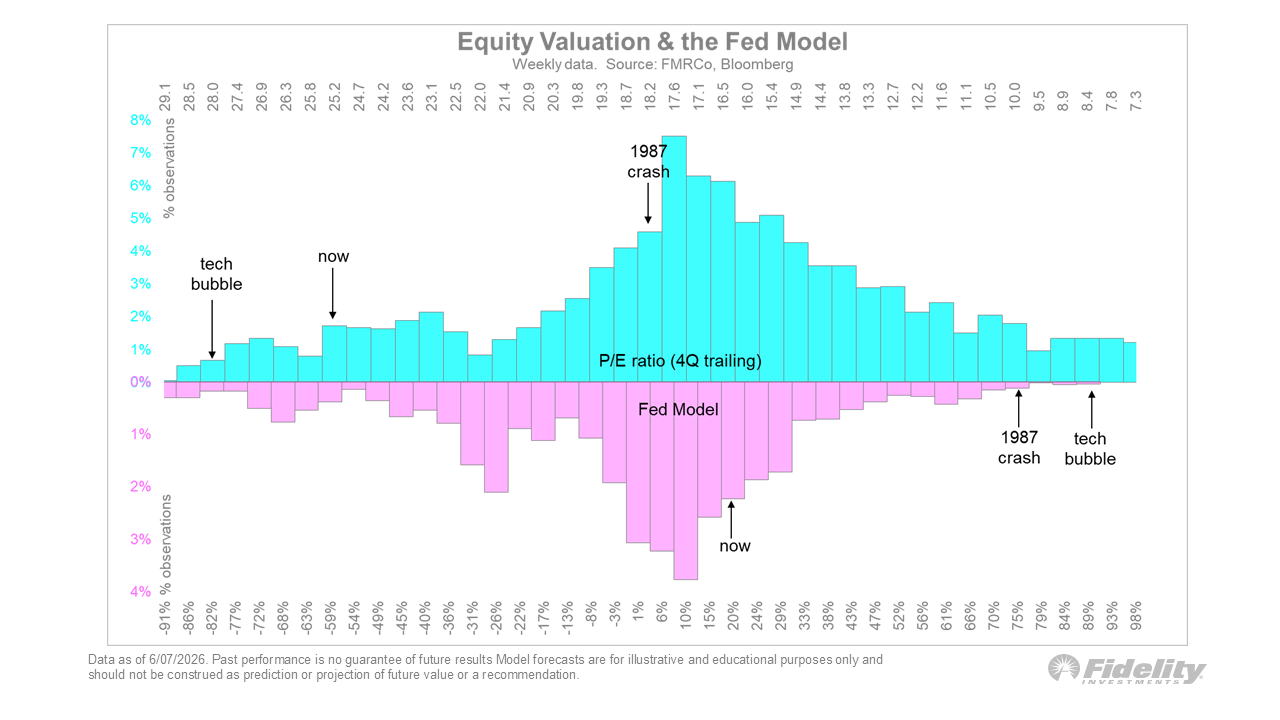
We can see this narrative reflected in Jurrien Timmer's chart. Stocks are expensive, but not yet as extremely valued as during the dot-com bubble. At the same time, the "Fed Model" shows that bonds have become relatively more attractive compared to equities, though that ratio isn't as extreme as it was around the 1987 crash or the dot-com bubble either.
So stocks are relatively expensive and bonds offer more competition than in the zero-rate years, but according to this chart, we're not yet in the extreme valuation zone of previous major market peaks.
In the meantime, bitcoin's primary task is to build a solid bottom and hopefully develop some momentum. That way, it will be better positioned for the moment when investors take profits en masse on AI stocks and decide to deploy that capital elsewhere.
Ultimately, momentum in financial markets often shifts from one asset class to another. During the gold and silver frenzy of January, many investors probably didn't expect that just a few months later, all eyes would be back on AI stocks.
5️⃣ Inflation surprise gives bitcoin breathing room, but solves little
Thom
From a macroeconomic perspective, this week was dominated by inflation data. Most attention was focused on Wednesday's Consumer Price Index (CPI), and specifically on core inflation (Core CPI). That's the variant that excludes energy prices, making it a better gauge of how much higher oil prices are feeding through to the rest of the economy.
It was on precisely that front that the inflation report delivered the biggest upside surprise. Core inflation came in at 2.9%, as expected. But the month-over-month increase of 0.21% was lower than the 0.30% economists had penciled in. Moreover, it was well below April's 0.40%.
For bitcoin and other risk assets, this was a favorable outcome. Lower core inflation reduces the need for the central bank to raise rates further. At the same time, inflation remains too high. To return to the 2.0% annual target, an average monthly increase of roughly 0.17% is needed.
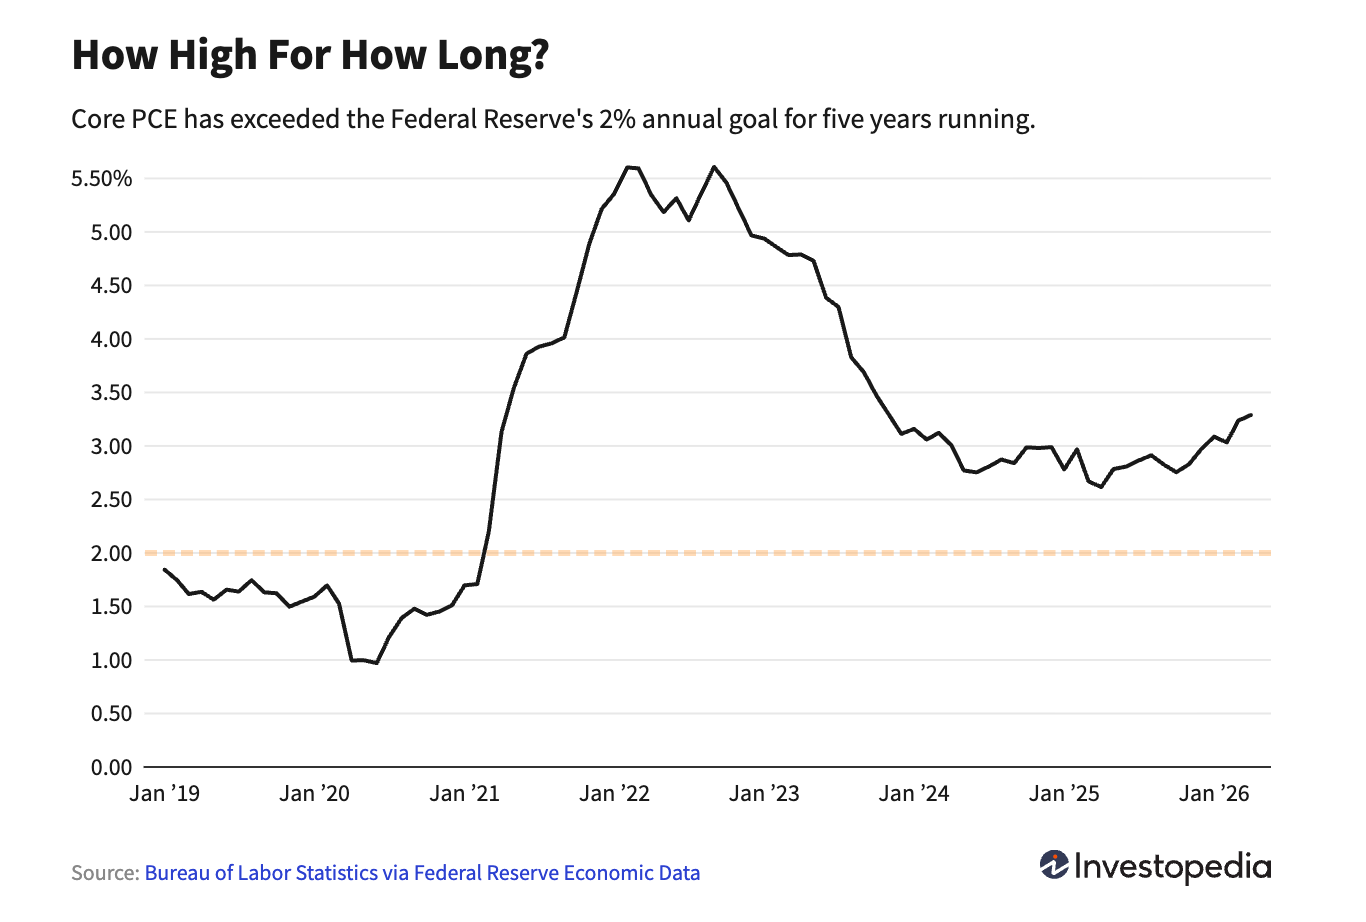
A striking statistic in the context of inflation is that Core PCE—the Federal Reserve's preferred inflation gauge—has now been above the 2.0% target for more than five years. Based on Wednesday's CPI figures, there's a high probability that Core PCE for May rose again.
Yields did dip slightly after the inflation report, but there was no fundamental shift. For 2026, the market now prices in 25 basis points of rate hikes, compared to 28 basis points before the inflation data was released.
The main consequence of this small upside surprise is that bitcoin was likely spared a deeper bottom. But that's about it. For now, a definitive resolution to the Iran conflict still appears unlikely, while demand for commodities remains high due to AI infrastructure buildout.
As a result, the chances of inflation dropping to the desired 2.0% in the near term are slim. For now, the upside risks appear dominant.
In closing
All previous editions of Alpha Markets can be found in the archive. Questions, comments, and suggestions are always welcome in the community.
Thank you for reading!
To stay informed about the latest market developments and insights, follow our team members on X:
- Bart Mol (@Bart_Mol)
- Peter Slagter (@pesla)
- Bert Slagter (@bslagter)
- Mike Lelieveld (@mlelieveld)
We appreciate your continued support and look forward to bringing you more comprehensive analysis in our next edition.
Until then!