Bitcoin Holds Its Own Amid Tariff Turmoil
Trump’s new tariffs are stirring chaos—recession risks, falling stocks, and a weaker dollar. Yet, Bitcoin holds strong at $84K. Can it break free from the stock market’s grip, or is a plunge on the horizon? The market’s at a crossroads—get ready for a bumpy ride!
On Wednesday evening at 10:00 PM, Donald Trump unveiled the much-anticipated American import tariffs. Each country received a specific rate based on its trade balance. Those that export more to the US than they import will be penalized, while the others pay a base rate of 10%.
There’s nothing inherently wrong with differentiating tariff levels. However, basing them primarily on trade balance is akin to hacking with a blunt axe.
In many cases, trying to fix a trade deficit is futile. Few Americans are likely to be willing to stitch together sneakers and dye T-shirts. Alternatively, there might be a triangular trade relationship where imports and exports essentially cancel each other out. For example, Country A imports from the US, processes the goods, sends them to Country B, and then Country B exports them back to the US.
The real question is whether this approach will truly balance America's trade. One thing is certain, though: this strategy comes with harmful side effects—primarily for Americans.
It is likely that the current figures will soon be adjusted through negotiated exceptions or deals serving other political interests, which might help mitigate long-term damage.
In the short term, this tariff system is actually producing several effects desired by the US government:
- slower economic growth (possibly below 0%, triggering a recession)
- reduced risk appetite
- lower stock prices
- higher bond prices
- lower long-term interest rates
- a weaker dollar
- higher unemployment (also due to DOGE)
- lower energy prices
- lower home prices
- higher inflation (incidental)
- lower inflation (structural)
These conditions enable the central bank to lower interest rates and stimulate the economy through quantitative easing.
Then it’s the government’s turn:
- tax cuts
- deregulation
- government support and incentives
This aligns with the economic strategy we outlined under “Donald Trump’s Popcorn” and in “Are We Facing a Mini Bear Market?”.
Whether all this will work remains to be seen. The desired short-term effects must persist while long-term damage is prevented. If not, a deep recession, an escalating currency war, and a rapid shift in the global order are all possibilities. Play stupid games, win stupid prizes.
Financial markets weren’t too happy with the rising turmoil and uncertainty. Thursday’s drop in the S&P 500 was comparable to those seen during major financial crises. Today, once again, promises to be a dark red day.
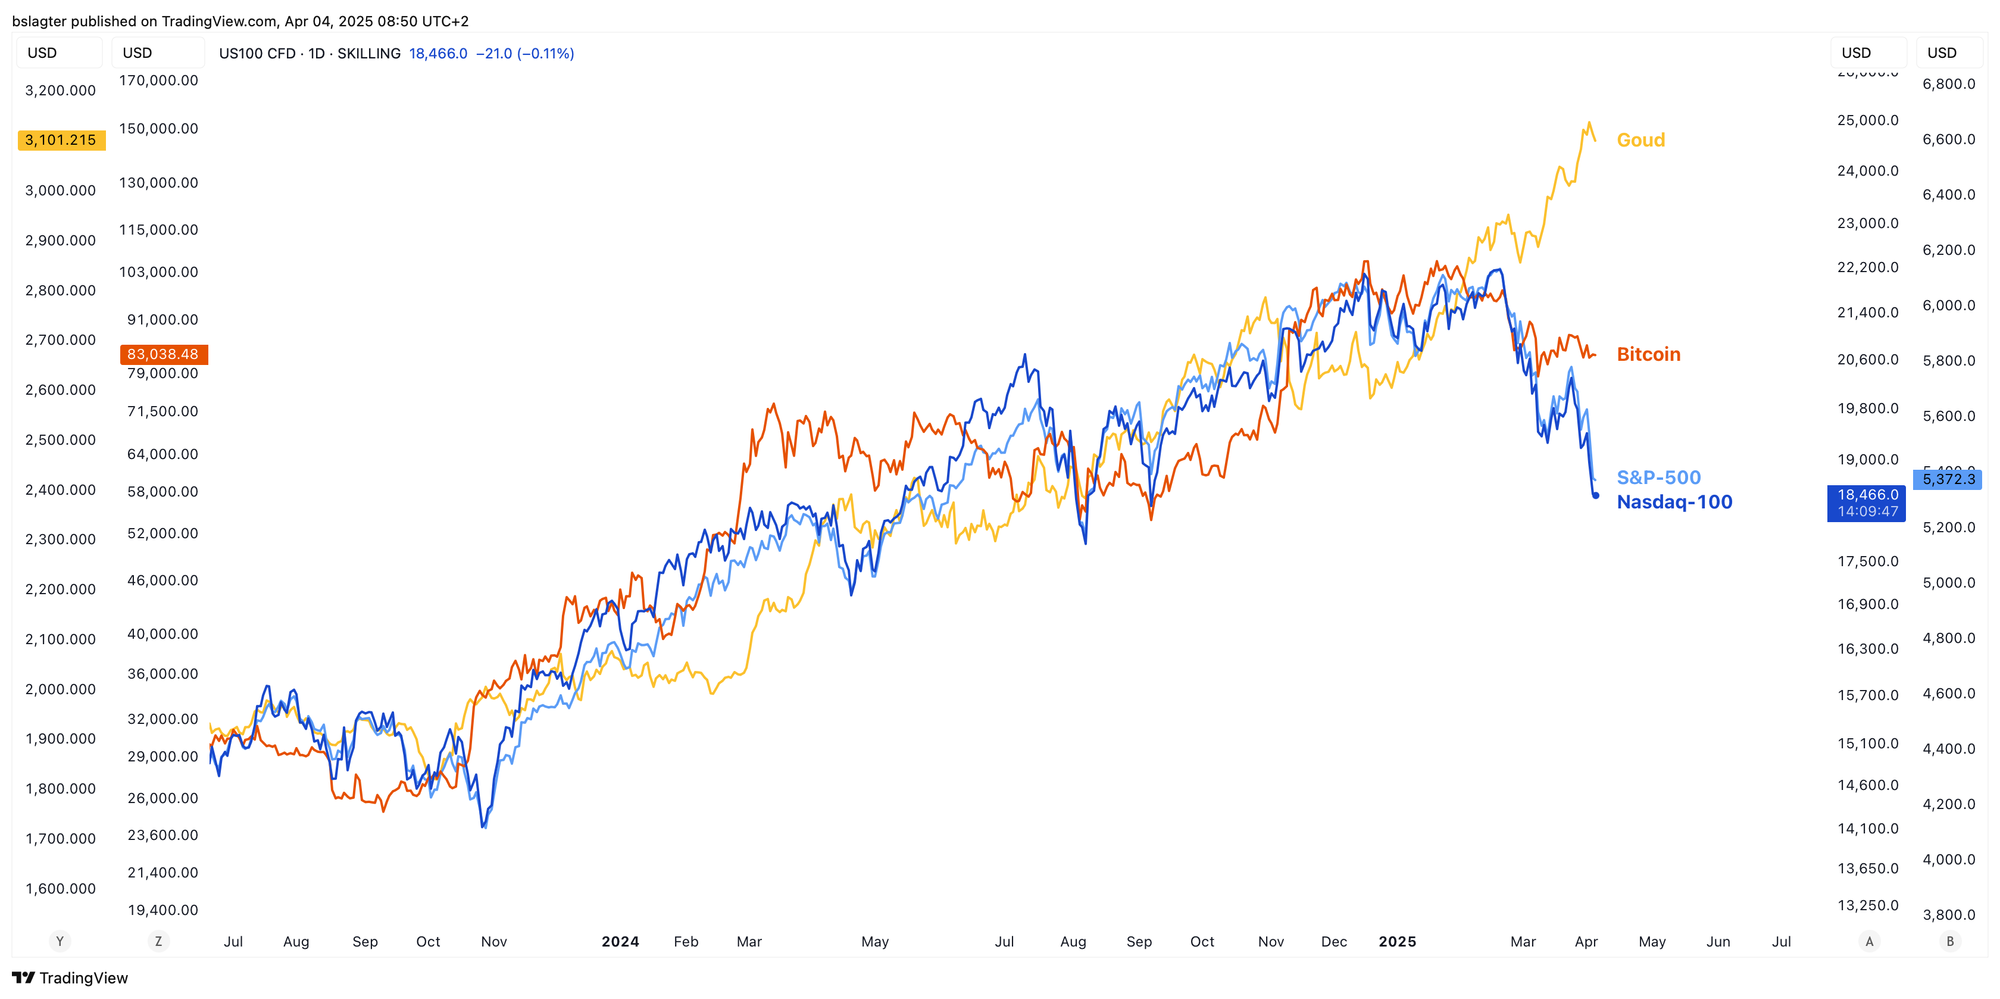
Against this backdrop, Bitcoin is actually performing quite well. At the time of writing, its price is $84,000 – roughly as high as it has been over the past three Fridays. While stocks have seen much lower levels in the first quarter, Bitcoin remains considerably higher.
Could Bitcoin chart its own course from here? Will investors start seeing it more as “digital gold” than as “Nasdaq on steroids”? Or might its price be temporarily supported by substantial Bitcoin purchases from Strategy and GameStop, only to soon drop in tandem with stocks to new lows?
It’s unlikely that Bitcoin will ever completely shed its classification as a risk asset. Therefore, we brace ourselves for a few challenging days ahead. If a decoupling occurs, it will be highly significant. We’ll know in a week!
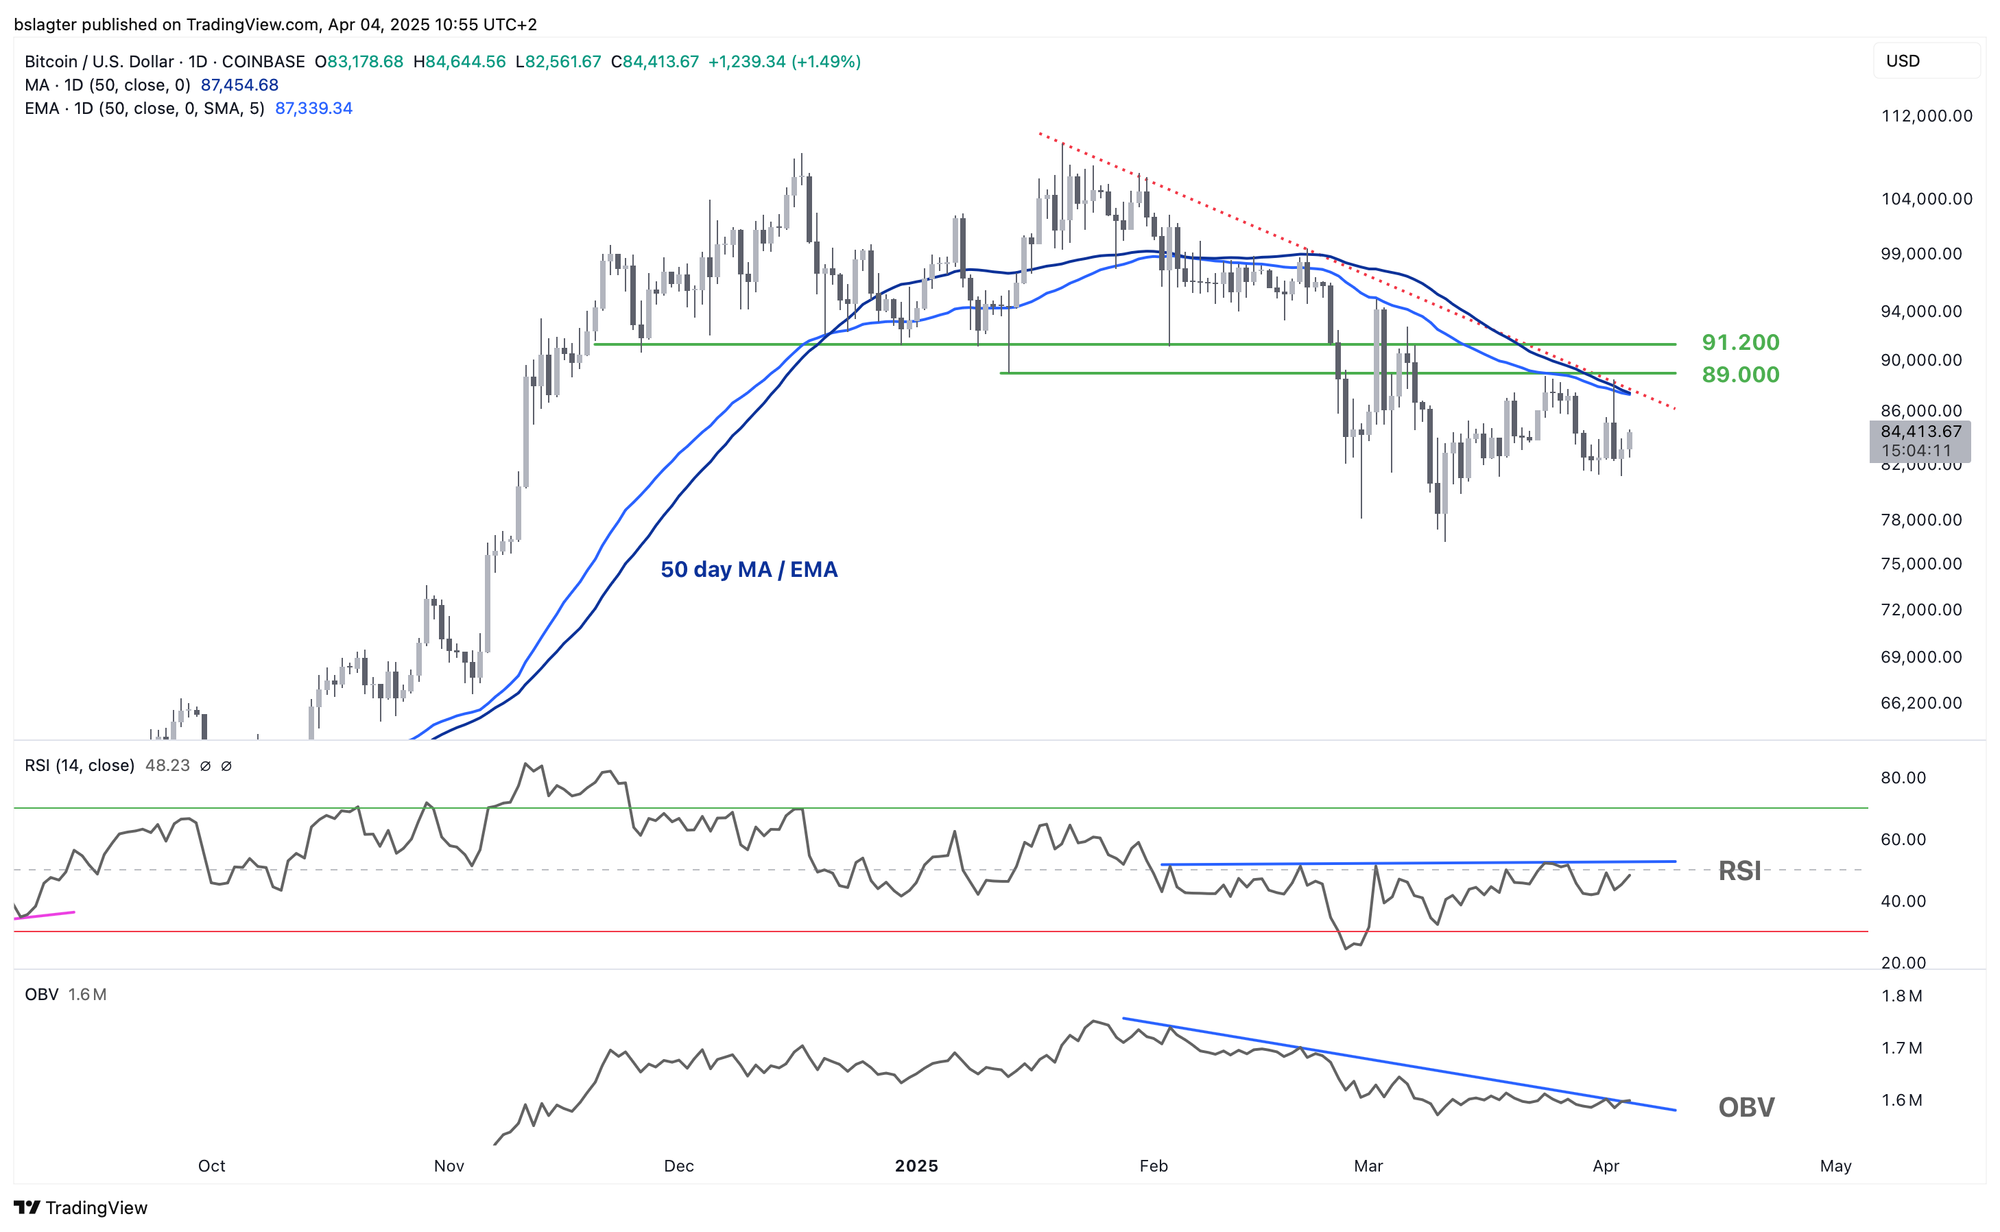
By the way, for Bitcoin to continue climbing, its price will soon encounter significant resistance. Last week, we mapped out the steep upward path—and little has changed:
- At $87,500, it meets the descending trendline and the 50-day moving average, with the 200-day moving average now also converging at that level.
- At $92,200, there is a key horizontal resistance level. Holding above this level would return the price to the range seen from November through February.
We often talk about “acceptance” above a certain price. By that, we mean that a price move isn’t just a temporary deviation but becomes established as the new norm once confirmed by the market.
In abstract terms, this happens when there is “high trading activity” at the new price level. We refer to this acceptance after a breakout or after passing any significant threshold—upward or downward.
For example, we consider:
- a daily close above/below a certain level
- a weekly close above/below that level
- testing the level as support/resistance
- the continuation of the movement above/below that level
- high trading volume during a breakout
The more of these factors are met, the greater the confidence in market acceptance. Waiting for confirmation helps avoid being misled by a strong upward move that soon reverses.
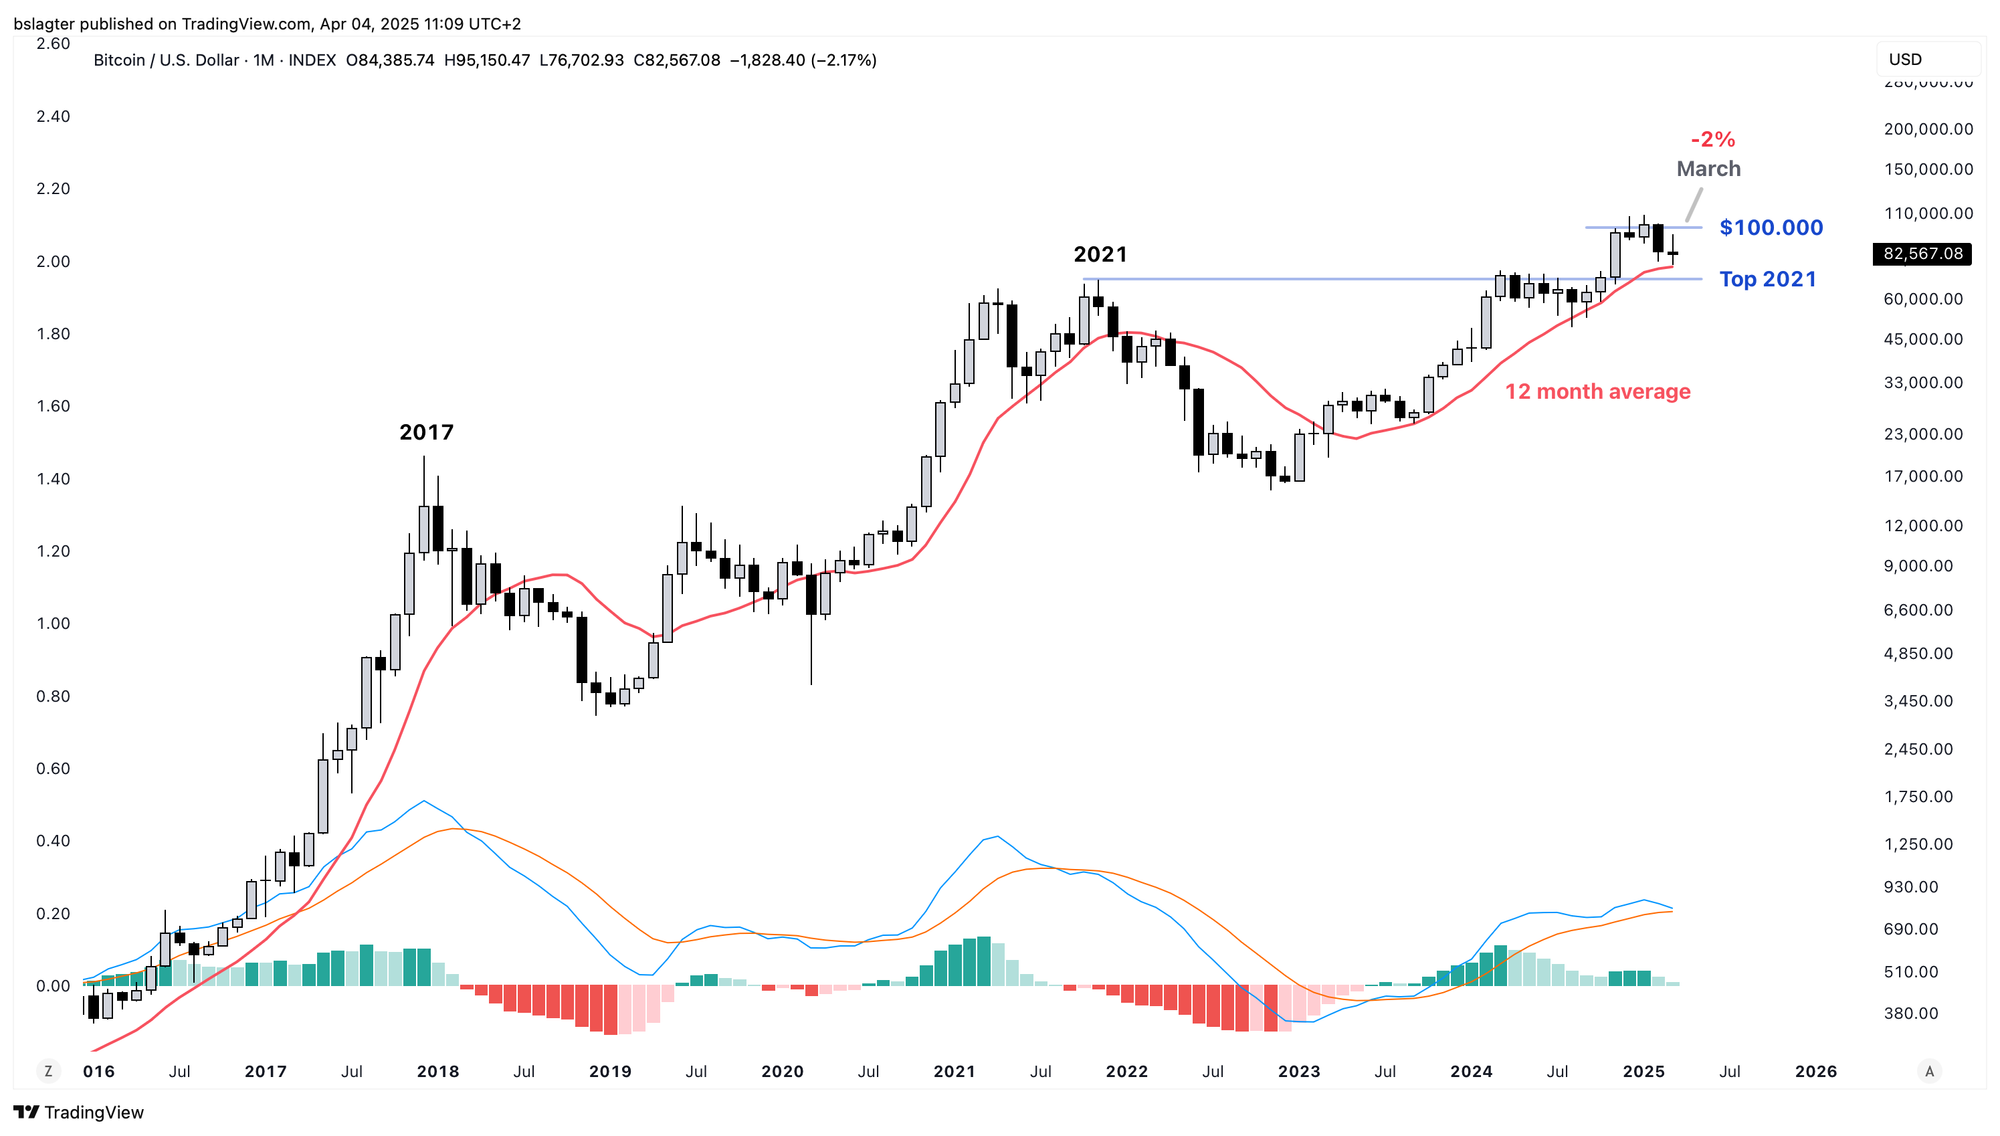
Finally, let's examine Bitcoin’s monthly chart—we just completed March’s session this week.
It doesn’t look great, but it isn’t disastrous either. In March, the 12-month moving average was tested, yet the close ended above it. The momentum indicator (MACD) at the bottom remains green, though a strong April will be needed to maintain that momentum. In short, there’s work to be done!
We will continue with the following topics for our Alpha Plus members:
- Can It Get Any More Pessimistic?
- At a Crossroads: Dip, Correction, or Bear Market?
- Risk Appetite Takes a Big Hit