
What Every Investor Needs to Know About Parabolic Rallies
Right when prices are climbing fastest, that's when you need to pay attention. Using three examples, learn how investors should handle parabolic rallies, and why the biggest paper gains often appear just before they evaporate.

 Contribution by
 Sam
The parabolic rally is the most beautiful phase of a bull market, but also the most dangerous. A price that climbs a little faster than it falls back for weeks or months gradually attracts buyers, which makes it more sustainable over time. Sometimes, however, a compelling narrative emerges during this upward trend, causing an almost vertical line to appear on the chart. That's the moment a healthy trend turns into a parabola. The move is no longer driven by patient buyers, but by emotions like the fear of missing out (FOMO) and greed.
Anyone who got in early on the trend can sit back and enjoy the rapid gains. The more attention the narrative gets on social media, for example, along with the success stories that come with it, the more new investors want to buy the dip. But the dips keep getting smaller, creating ever more urgency among buyers to jump in at almost any price.
That's also what makes these explosive moves unsustainable. FOMO buyers have often bought in on borrowed conviction. They start to believe the exaggerated tales of supercycles and outlandish price targets. As soon as the sharp, swift correction follows and their purchases plunge deep into the red, doubt and panic set in. This triggers a massive wave of selling, resulting in a deep crash.
Bitcoin's price action at the end of 2017 is a textbook example. In the final months of that year, the price accelerated from $3,000 to $20,000. Bitcoin reached the mainstream and everyone was talking about it. That's telling, because the steepest phase almost always coincides with the greatest public attention.
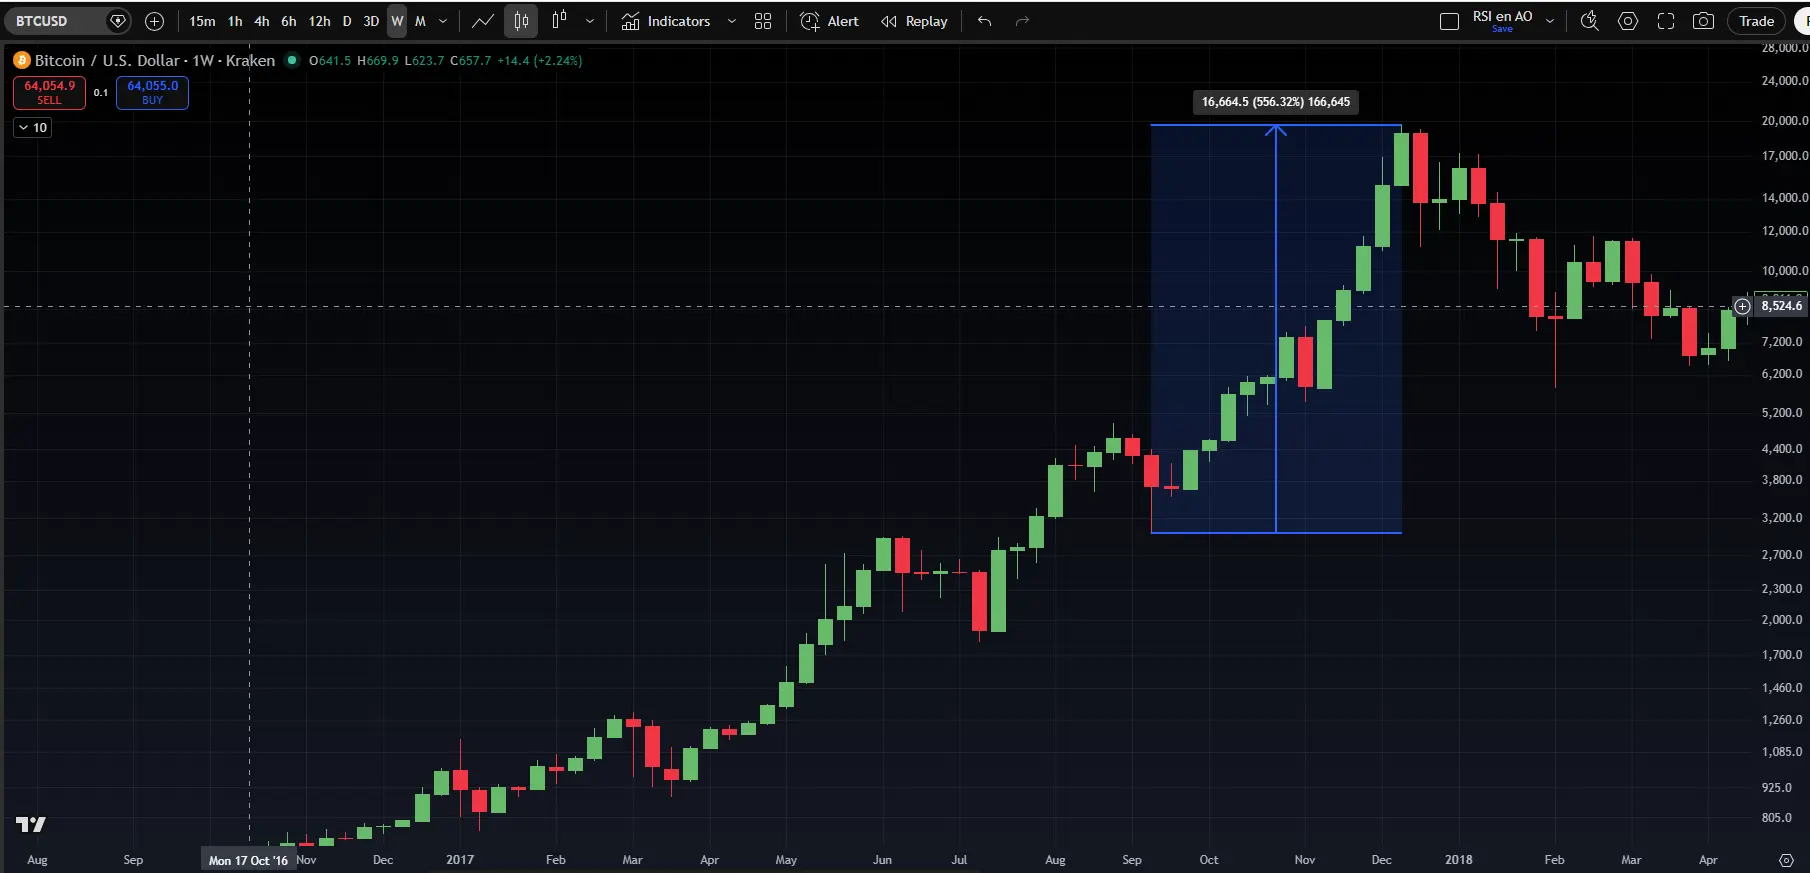
What followed was no small dip. The following year, bitcoin lost some 80 percent of its value and fell back to just above $3,000 by December 2018. Anyone who bought around the top of the mania, or just below it, had to wait years just to break even.
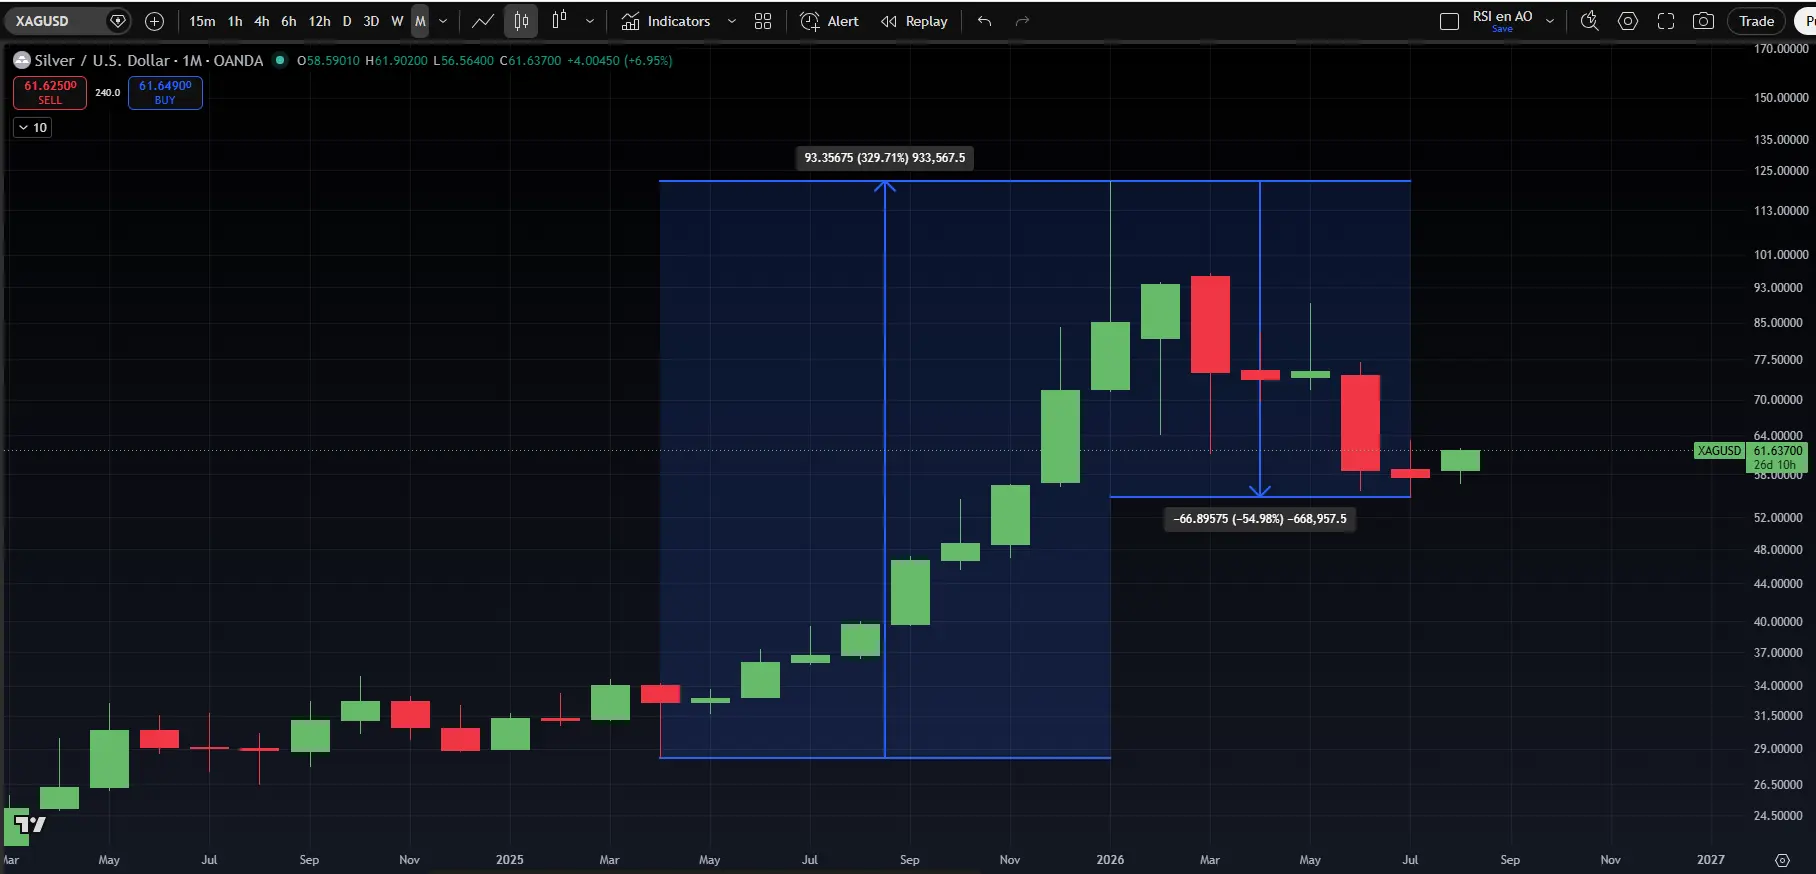
And while bitcoin and altcoins are notorious for this, it happens in other and larger markets too. A more recent example can be seen in silver. In April 2025, the precious metal was still trading below $30, and then it rose more than 300 percent in 10 months. That's already a strong trend, but in January 2026 things really took off. In just a few weeks, silver shot up from around $70 to above $120 on January 29, 2026. A classic vertical blow-off phase.
The reckoning came practically overnight. On January 30, 2026, silver lost over 30% in roughly a single day. During this decline, long positions were forcibly liquidated, triggering an avalanche of selling. Exactly as you'd expect with a parabola: once the first stone falls, there's no support to break the fall. Silver now trades around $60, about 50 percent below the January peak.
Finally, the most current example: the memory stocks. In an earlier piece we described how the upward momentum in names like Micron and SanDisk seemed to be fading. What preceded that was one of the most extreme rallies of 2026. Riding the wave of AI demand for memory, the price of a SanDisk share rose more than 850 percent this year and a Micron share more than 300 percent. The valuations of companies with billions in revenue behaved like altcoins.
Here too, the familiar ending followed. Around the end of June, Micron and SanDisk set their peaks, after which more than 40 percent was surrendered in less than 2 months. The triggers? Profit-taking after a historic run, the IPO of a Chinese memory producer that fanned fears of competition, and investors exiting the most crowded AI positions. None of those reasons on its own explains the scale of the decline. That scale was determined by the fuel left behind by the steep rally that preceded it.
Ironically, the (temporary?) bottom formed after it emerged that hedge fund Situational Awareness was forced to sell its positions in this sector. Time will tell whether prices head straight back to new highs. History teaches us that these sharp declines often need time to recover.
What these three examples share is more important than how they differ. In all cases, the fundamental backing was actually strong: bitcoin had its adoption story, silver its structural shortages, and the memory stocks their genuinely explosive revenue growth. Yet a strong story says little about whether a price move is sustainable in the short term. A parabola prices in the good news, and a good chunk of a rosy future, all at once.
In practical terms, this means two things. First: the steeper the angle of the climb, the more cautious you should become, precisely at the moment the dopamine is flowing freely. The biggest paper gains often appear just before they evaporate.
Second: after a crash, the first bounce is rarely the real recovery. It's often the strongest bounce, though. That's how dip buyers get sucked back into the market one last time, before the decline continues.
After such a crash, the burden of proof lies emphatically with the buyers. Wait for signs of stabilization instead of trying to catch a falling knife. Missing the bottom costs a bit of return, but getting in too early on a downward trend costs more and takes longer to get back to your purchase price.
We continue with the following topics:
- Bitcoin: The calm before the storm... in a teacup
- Rising long-term rates threaten the financial markets
- The Hormuz question: is a solution finally on the way?
- Maybe this was the bottom already
1️⃣ Bitcoin: The calm before the storm... in a teacup
Contribution by Sam
Bitcoin has been drifting a bit sideways in recent weeks, with a price of $64,000 seemingly acting as an anchor. Sometimes a brief dip below it, toward $62,000, and sometimes a peek up around $66,000.
It's not particularly unusual for the holiday season to be a little less volatile. Normally that goes for the financial market as a whole. That's why it's striking that other markets have actually been quite volatile. Bitcoin stayed out of the malaise when stock markets corrected sharply, and it's staying out of their recovery too.
Still, this fits the character bitcoin has shown since the bottom of late 2022. A short, forceful impulse followed by weeks or months of sideways price action. Since early June, bitcoin has been in a price range of roughly 15 percent, with about 70 percent of the volume falling in the range between $61,300 and $65,300.
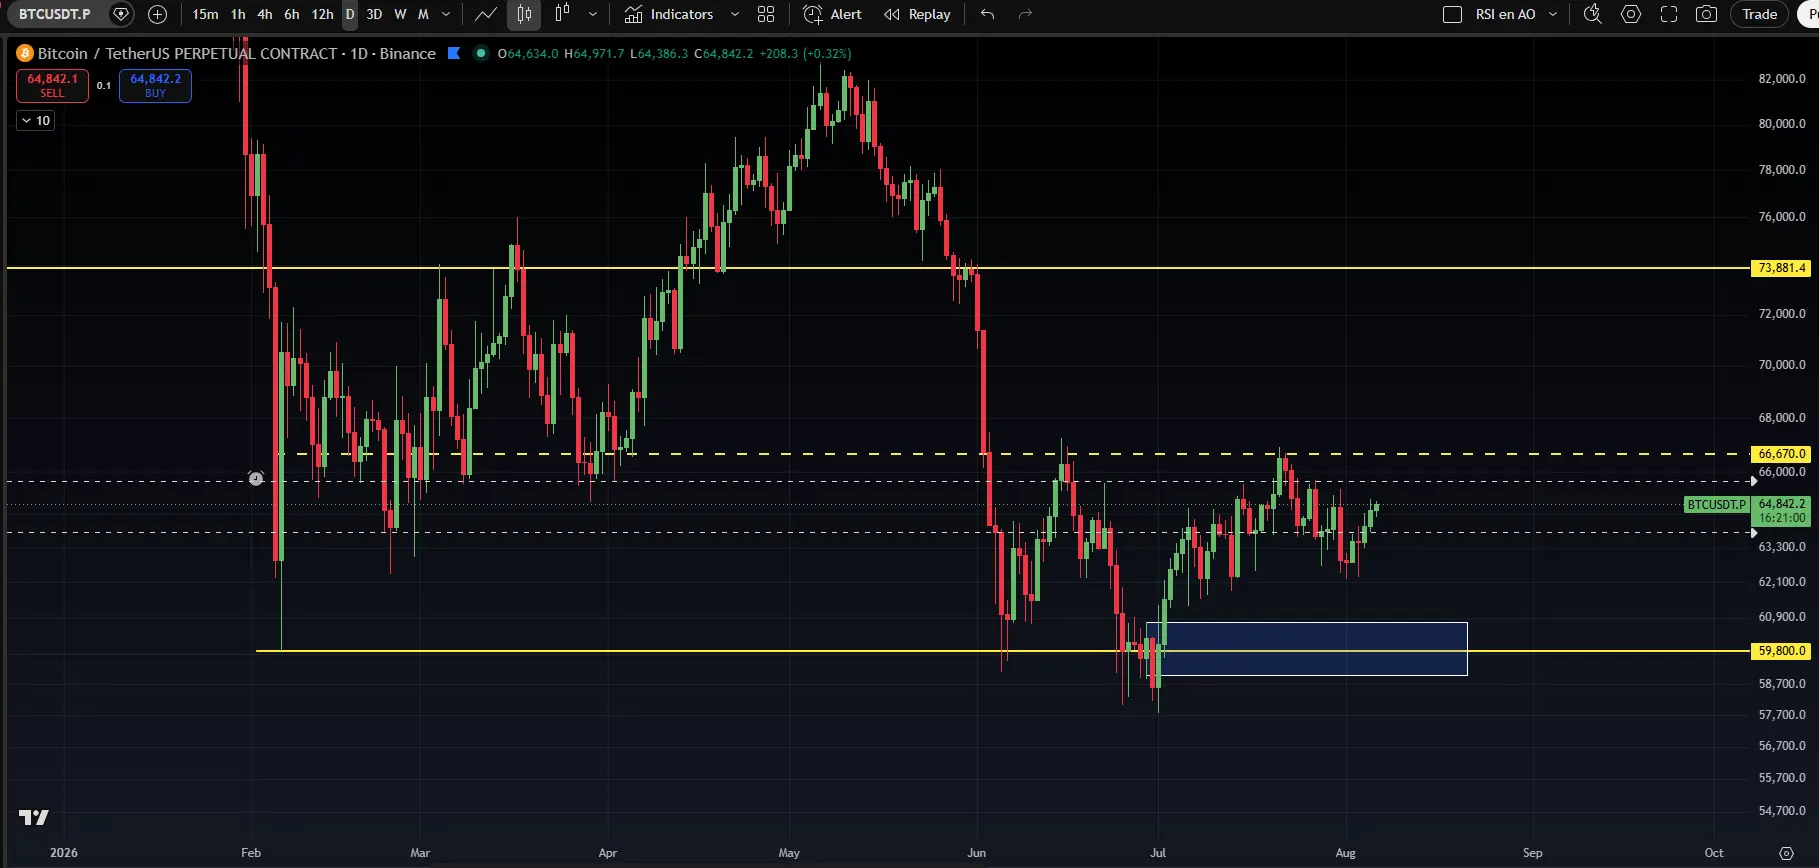
Not much happened at the start of the week compared to other asset classes; the calm before the storm. Now the resistance at $64,250 seems to have finally broken, bringing price targets of $66,000 to $67,500 into view. It's important here that $64,000 serves as support on the way there.
As you can tell from the rather uninspiring price targets, for now it's a storm in a teacup. Zoomed out, the direction on the higher timeframes is still downward, and looking further up only becomes useful once we see strength above $67,500.
The image below shows the interesting levels with yellow lines. At the lower yellow line, the price range that falls within the blue box, we're optimistic about the support to be expected. If the bitcoin price finds acceptance above the dotted yellow line, room opens up to move toward the upper yellow line. So far, however, that has formed strong resistance, so caution around this level (~$67,000) is advisable.
2️⃣ Rising long-term rates threaten the financial markets
 Contribution by
 Thom
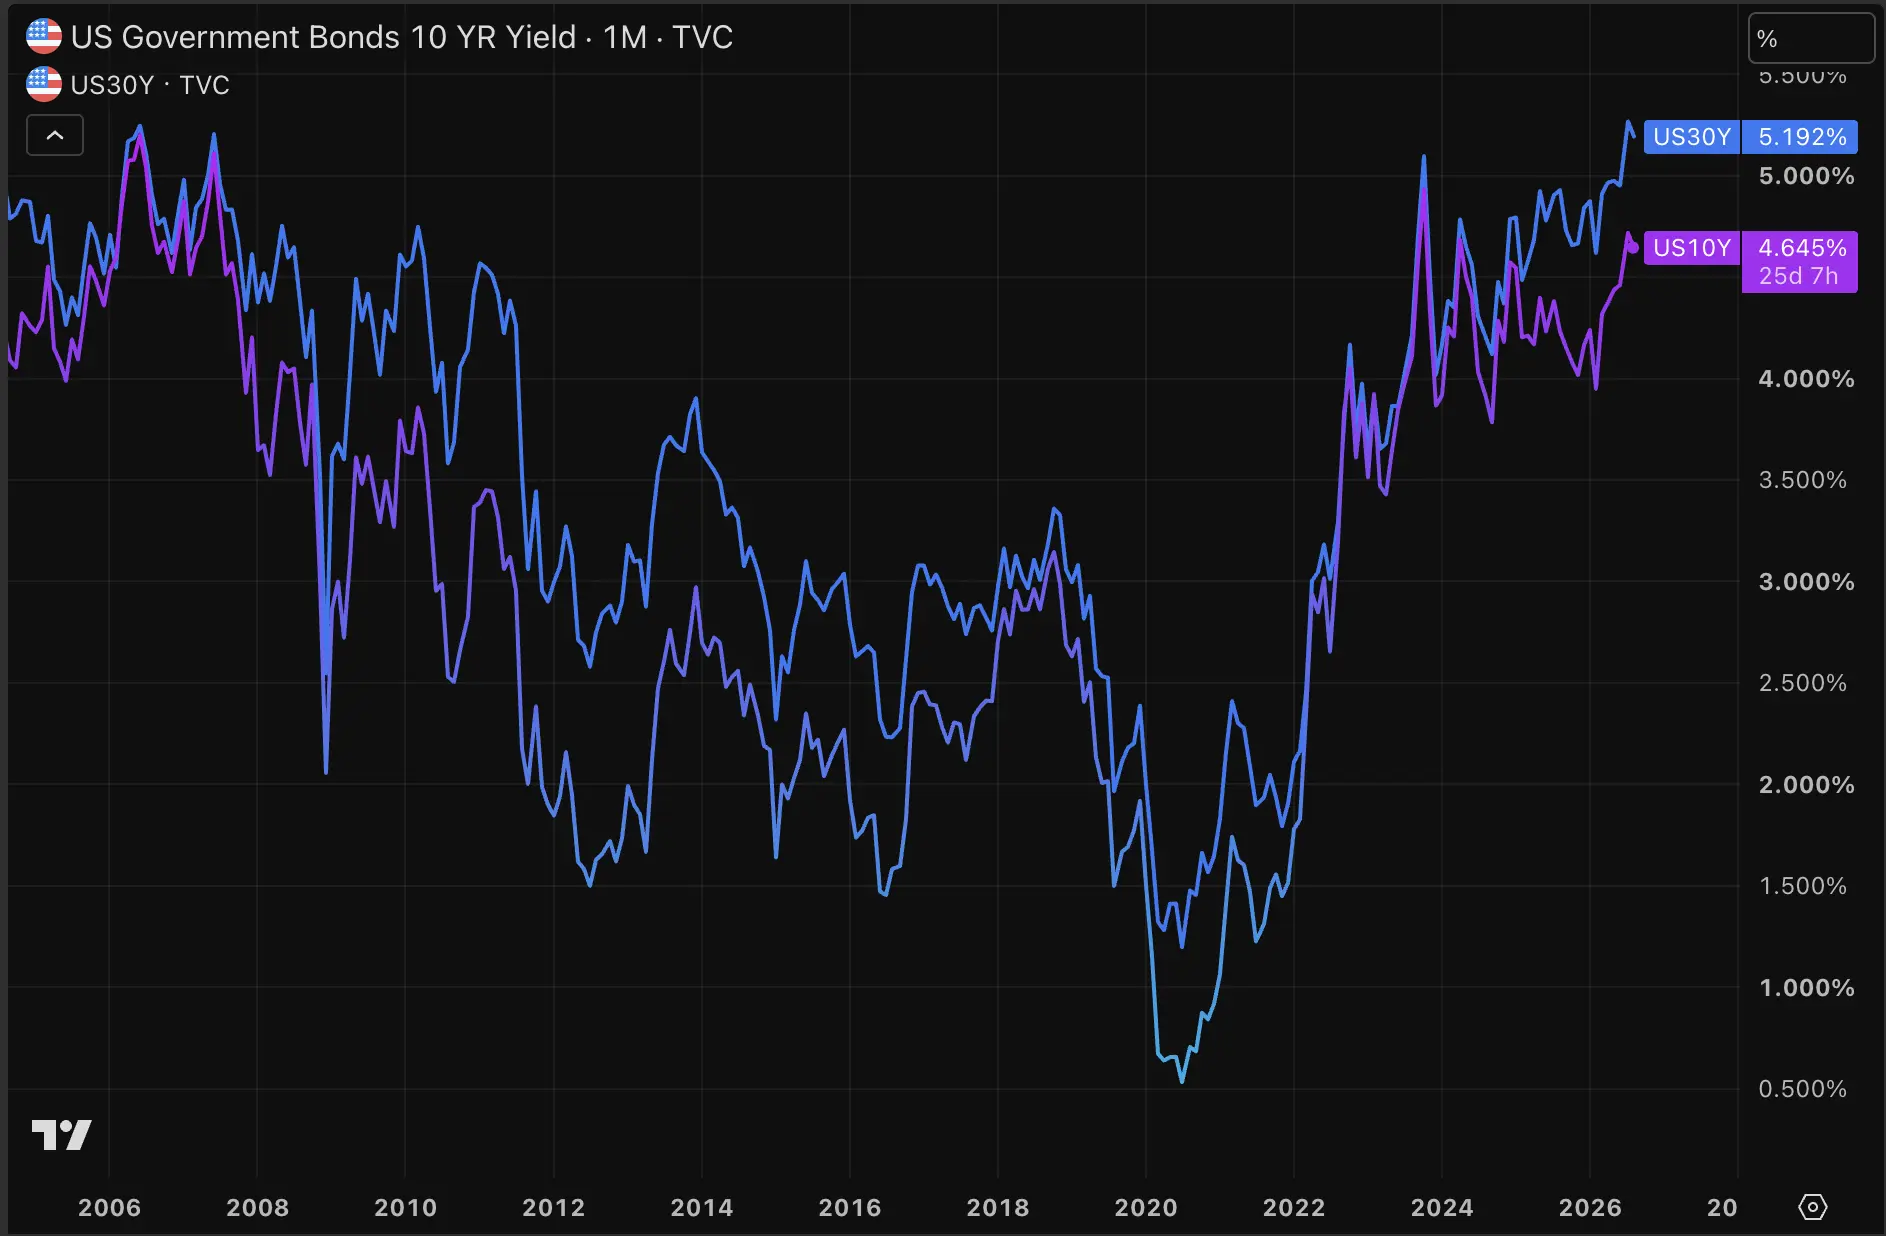
While Wall Street is mainly talking about the Iran war, oil prices and AI stocks, in the background we're seeing long-term US rates climbing toward historically dangerous levels. After the Brent oil price fell back to $80, the 10- and 30-year yields responded with a small decline, but remain relatively high.
There are several possible explanations for the rise in long-term rates:
- The enormous capital needs of AI companies increase the demand for money and drive up yields on US government bonds.
- Investors fear that the tough-talking US central bank won't translate its words into actual rate hikes. For that reason, they have to protect themselves against potential inflation and therefore demand a higher yield.
- Less transparency from the central bank may play a role. Increased ambiguity creates more uncertainty, causing investors to demand a higher risk premium and thus a higher yield.
The key point is that long-term rates are rising, which means stocks, bitcoin and other assets have to compete with a higher risk-free rate. For stocks, there's a clear correlation between bond yields and valuations, as the chart below from Jurrien Timmer shows.
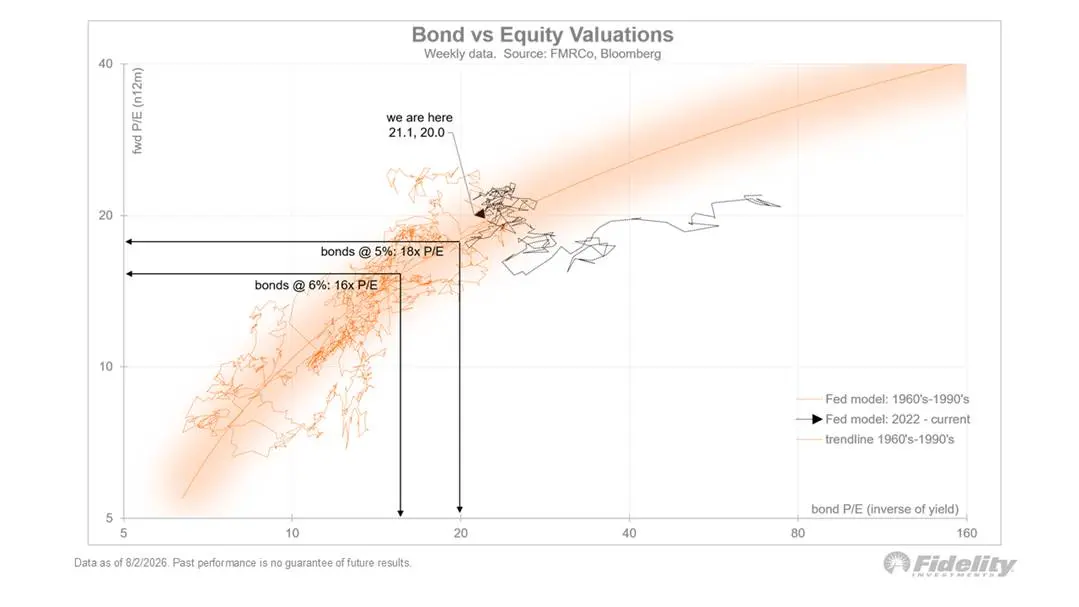
For bitcoin, there will be a similar relationship. After all, bond yields are simply competition for the digital currency. Right now, investors can collect over 5 percent on US 30-year bonds. Those are yields that are starting to become attractive, because they actually beat inflation.
On top of that, the elevated rates act as a brake on economic growth. After all, investments have to beat a relatively high return. Right now there's plenty of enthusiasm around artificial intelligence, and investors still believe in that technology's ability to pull it off.
Personally, though, I don't believe rates will stay at these elevated levels for long. That would at the very least make the United States' national debt a bigger problem, but over time the enthusiasm about AI will also fade again, causing investments and inflation to decline.
For now, however, this is what we have to work with, and long-term rates are in an upward trend, as opposed to the downward trend we saw during bitcoin's previous bull markets.
3️⃣ The Hormuz question: is a solution finally on the way?
Contribution by Thom
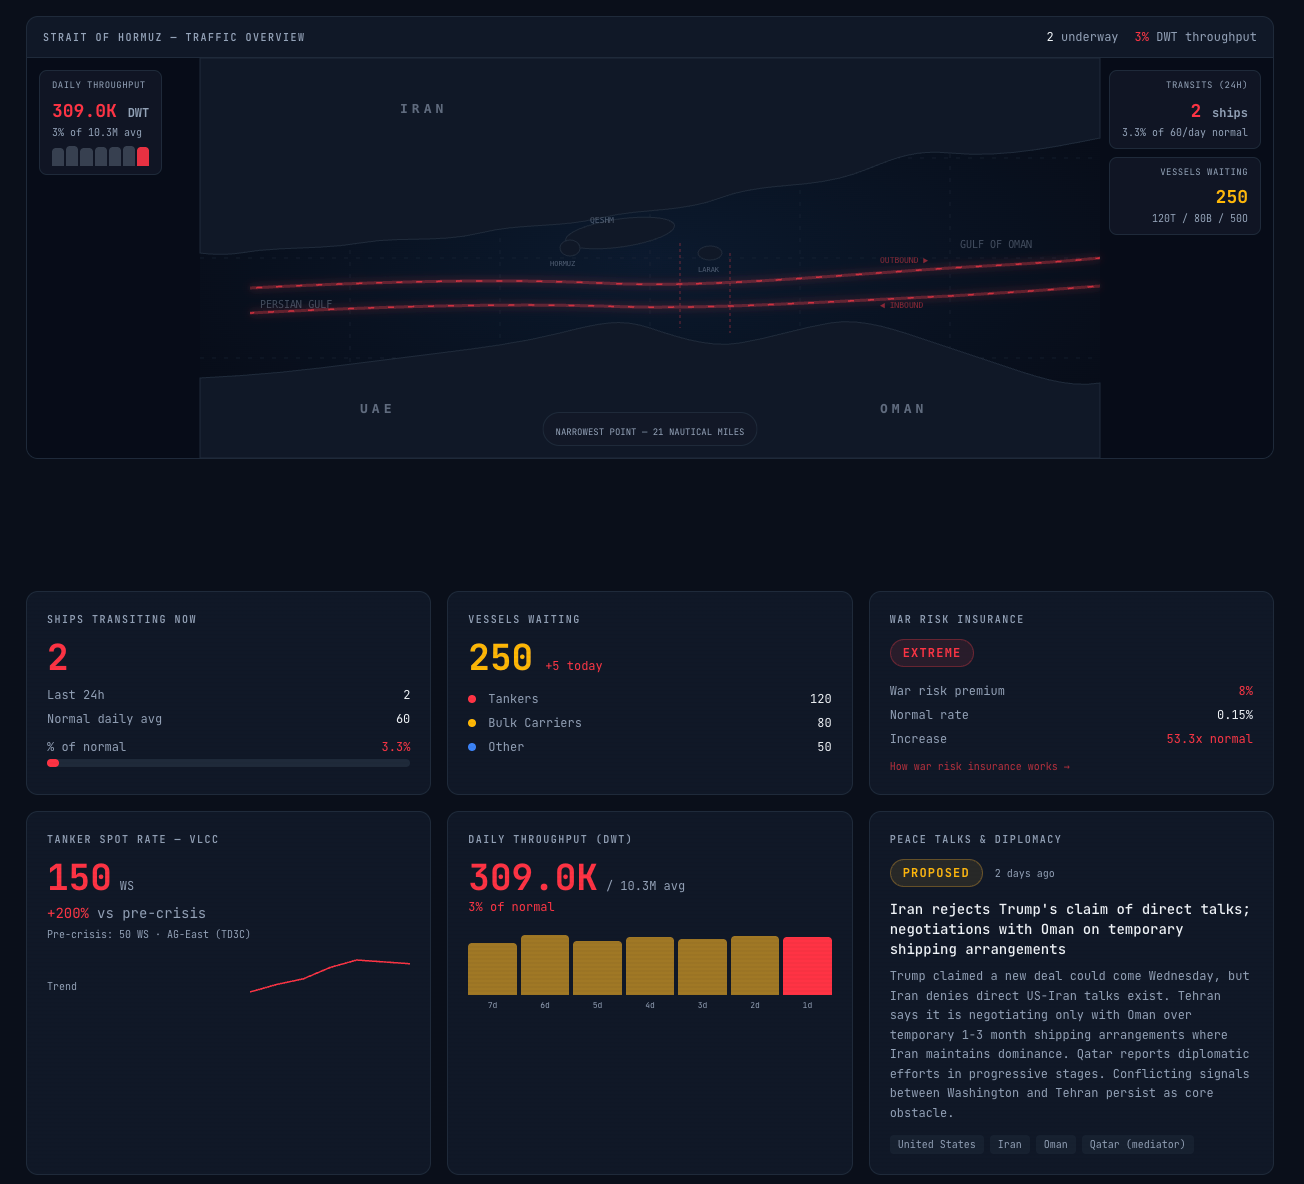
This week was once again dominated, old-school style, by the Strait of Hormuz. From both camps we're hearing positive reports about an approaching agreement on a 60-day arrangement to normalize shipping traffic in the strait. While those are positive signals and pushed the Brent oil price down to roughly $80 per barrel, the physical reality remains unchanged for now.
At the time of writing, exactly two ships are sailing through the Strait of Hormuz, whereas there are normally around 60.
For bitcoin, a reopening of the Strait of Hormuz would be a welcome development. It would push oil prices down further, ease inflationary pressure, make central banks less hawkish, bring rates down and weaken the US dollar. Every one of those is a reason for bitcoin to rise.
In terms of timing, it would also come at a good moment for bitcoin, since the digital currency has been holding up strongly for some time around the $60,000 level. This despite the fundamental developments around Iran and oil taking another unfavorable turn from July onward.
On top of that, the situation around Michael Saylor's Strategy has been poor for a while now. And the bitcoin ETFs have seen better days too.
There's little enthusiasm around bitcoin, on the fundamentals we're mainly seeing headwinds, and yet the price manages to hold its ground here. In theory, that's a very powerful signal. If the Hormuz situation is genuinely resolved soon, it could suddenly put wind back in bitcoin's sails.
So an interesting period could well be dawning for bitcoin. For that, though, there has to be a definitive solution to the war in the Middle East. Although the reporting is positive at the moment, we've of course seen that plenty of times over the past few months. On that front, all we can do is wait and see.
4️⃣ Maybe this was the bottom already
 Contribution by
 Bert
There's plenty going on to make you nervous. Japan and the United States intervened together last week to support the yen. Elsewhere in the financial markets there was renewed turmoil over AI stocks, leverage and forced selling. And within the bitcoin world, the COLDCARD hack landed like a bombshell.
Bitcoin itself seems barely interested in any of it.
The price has been moving roughly between $60,000 and $70,000 for weeks now. There's no sign of panic, and the wild swings and capitulation that come with it are nowhere to be seen. That's interesting in itself, because when we bring in our cycle analysis, we see that we're right in the middle of the window in which a new bottom would be logical.
We place the previous clear daily cycle low on June 5. Bitcoin had just come off a steep decline at that point, from roughly $82,000 to $59,000. Since then, more than sixty days have passed. That's long enough to be on the lookout for a next daily cycle low.
Only... where is it?
Since July 21, bitcoin has fallen from around $66,000 to $62,000. That's a correction, sure. But hardly the blow you'd expect at a bottom that may also coincide with a weekly cycle low and the low point of a bear market.
Still, the data is starting to cautiously suggest that the bottom might already be behind us. Because the weekly chart, too, shows indicators sitting in the zone where a weekly cycle low would be logical. At the same time, bitcoin is moving around the 10-week average. If the price manages to stay convincingly above it, that fits less and less with the tail end of an old weekly cycle and much better with the start of a new one.
That leaves two scenarios.
The first is simple: the real bottom is still to come. In that case, we still get that clear final move down that wraps up the current cycle.
The second scenario is stranger. Maybe that was it. A shallow bottom that only becomes clearly recognizable on the chart in hindsight. That happens more often. With gold, we saw something similar earlier: the expected clear bottom never came, after which the market simply took off and printed a series of higher highs and higher lows.
For bitcoin, that confirmation isn't there yet. The market is still in a bear market, and a convincing structure of higher highs and higher lows is missing. Sometimes a bottom only looks like a bottom when you view it in the rearview mirror.
Want to hear more about Bert's cycle analysis? Then listen to the latest episode of Satoshi Radio. You'll get the update live, from Norway. The video above starts at the right moment.
In closing
All previous editions of Alpha Markets can be read back in the archive. Questions, comments and suggestions are very welcome in the community.
Thank you for reading!
To stay informed about the latest market developments and insights, follow our team members on X:
- Bart Mol (@Bart_Mol)
- Peter Slagter (@pesla)
- Bert Slagter (@bslagter)
- Mike Lelieveld (@mlelieveld)
We appreciate your continued support and look forward to bringing you more comprehensive analysis in our next edition.
Until then!