
We're Right on Schedule
Bitcoin dropped 10% to $73k over two weeks while stocks are exploding to all-time highs. This bear market isn't driven by collapsing companies — investors are leaving because the grass looks greener on the other side.

This week, the broad S&P 500 stock index, the Nasdaq 100 tech index, and the Russell 2000 mid-cap index all reached new all-time highs again. The driving force is optimism about AI, which could significantly boost economic growth and corporate earnings.
That doesn't mean, however, that the gains are concentrated in just a handful of AI companies. The S&P 500 Equal Weight, where each company carries the same weight, is also at an all-time high. All S&P sector ETFs are higher than a year ago. And the STOXX Europe 600, a broad European index, also hit an all-time high this week.
Bitcoin wasn't invited to this party. The price dropped 10% over the past two weeks from $82,000 to $73,000, and now sits roughly 42% below its all-time high of $126,000.
Bitcoin is in a bear market. Virtually all the data we look at points in that direction.
In yesterday's Satoshi Radio market update, we discussed a few observations consistent with capitulation. Businessman and TV billionaire Mark Cuban says he sold his bitcoin. Bitcoin miner TeraWulf is pivoting to AI and claims they were never really a bitcoin miner in the first place. Projects are shutting down, people are walking away, and companies are rewriting their history.
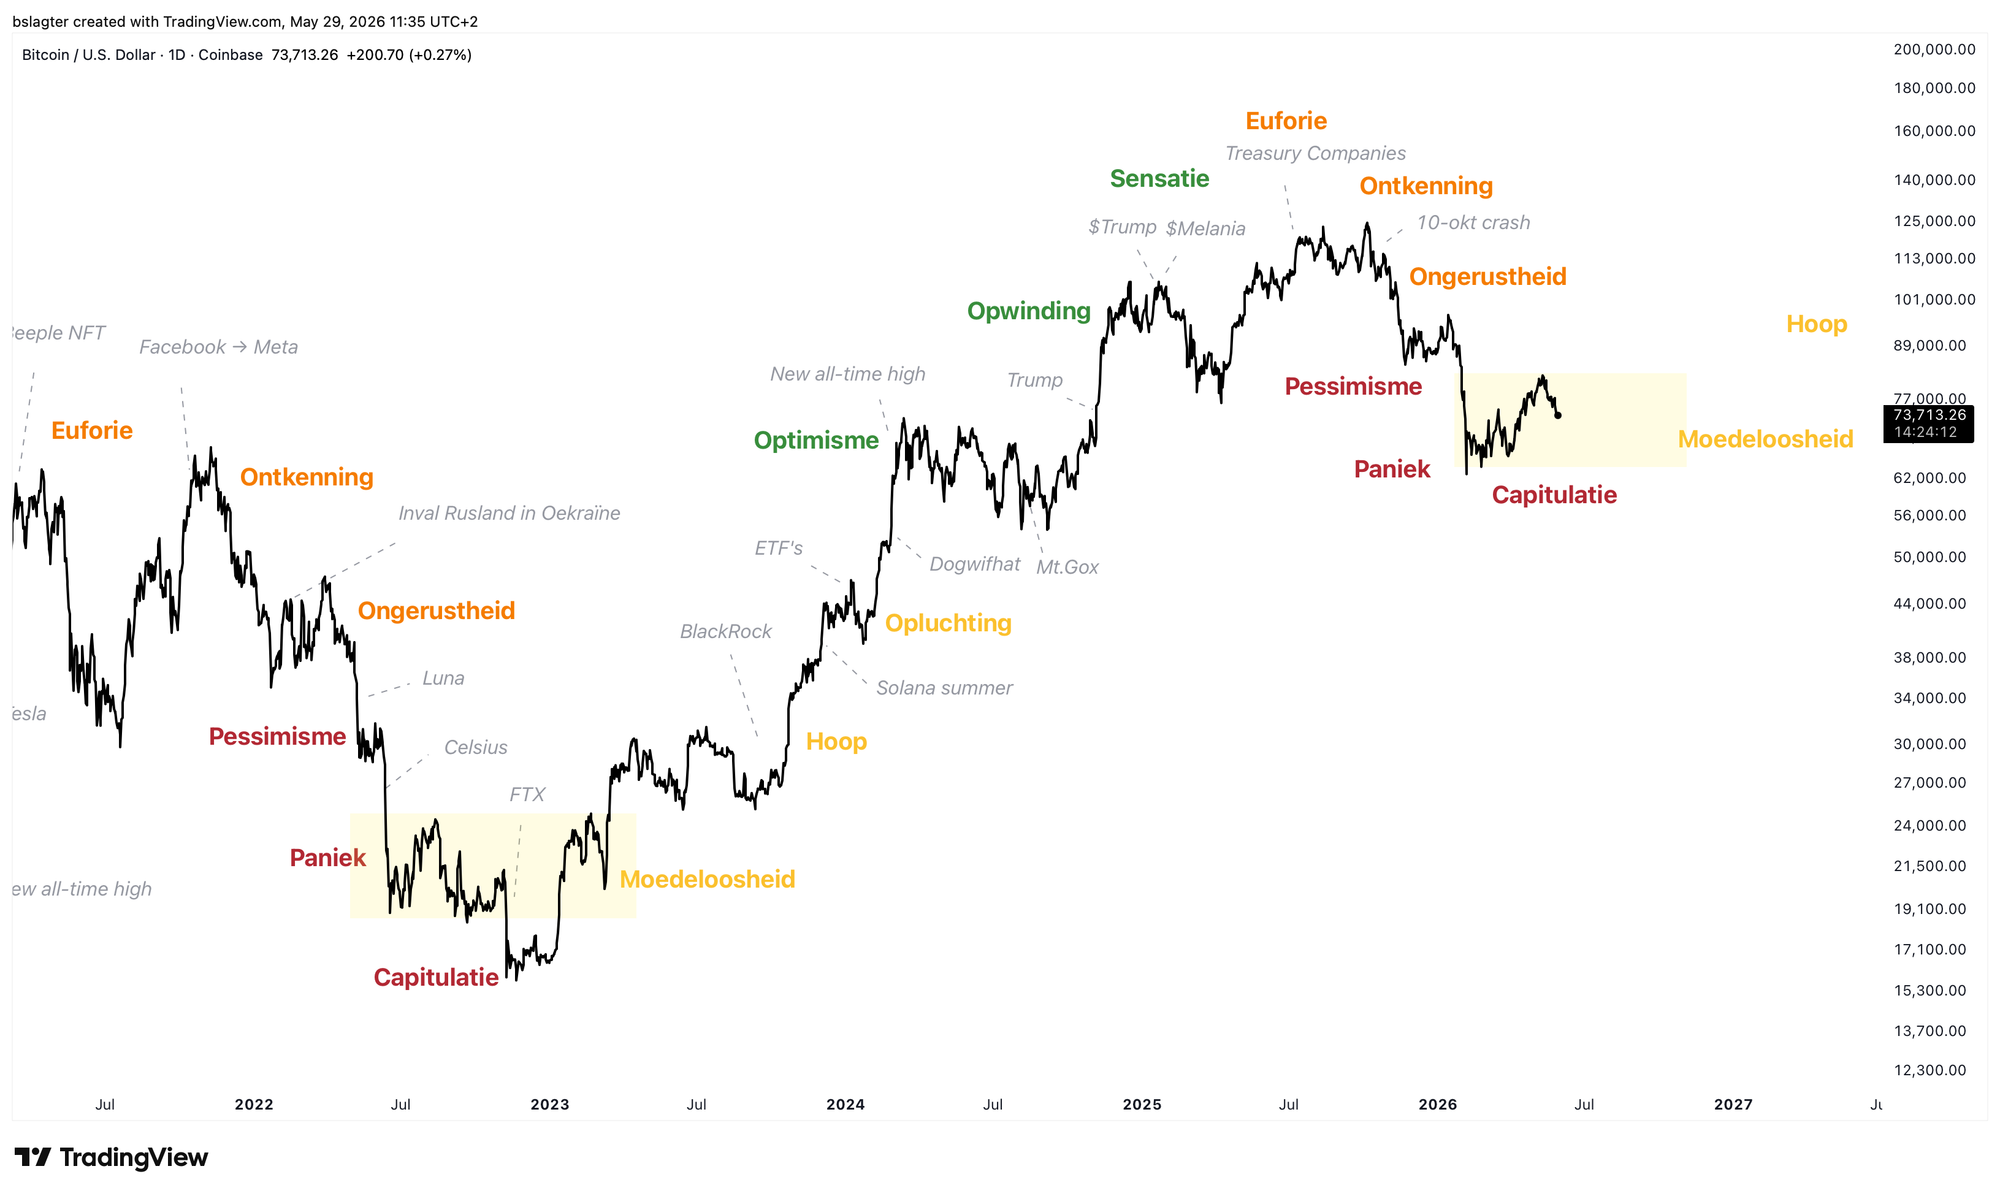
Every market has its own rhythm of alternating strength and weakness, remarkably often with a duration of 4 to 5 years. Using the market cycle, you can't predict exactly to the day, week, or even month where tops and bottoms will land. But it does help determine where you are in the sequence of events.
Bottoms and tops are a process. Sure, ultimately there is one single highest point and one single lowest point on the chart. But the transition from a downtrend with its accompanying dynamics to a new uptrend — the formation of the bottom — is not a point, but a process.
Let's look, for example, at investors who bought in above $100,000. During the bottom formation process, we see that their willingness to sell at a loss gradually decreases. Control slowly shifts from capitulating speculators to accumulating long-term investors.
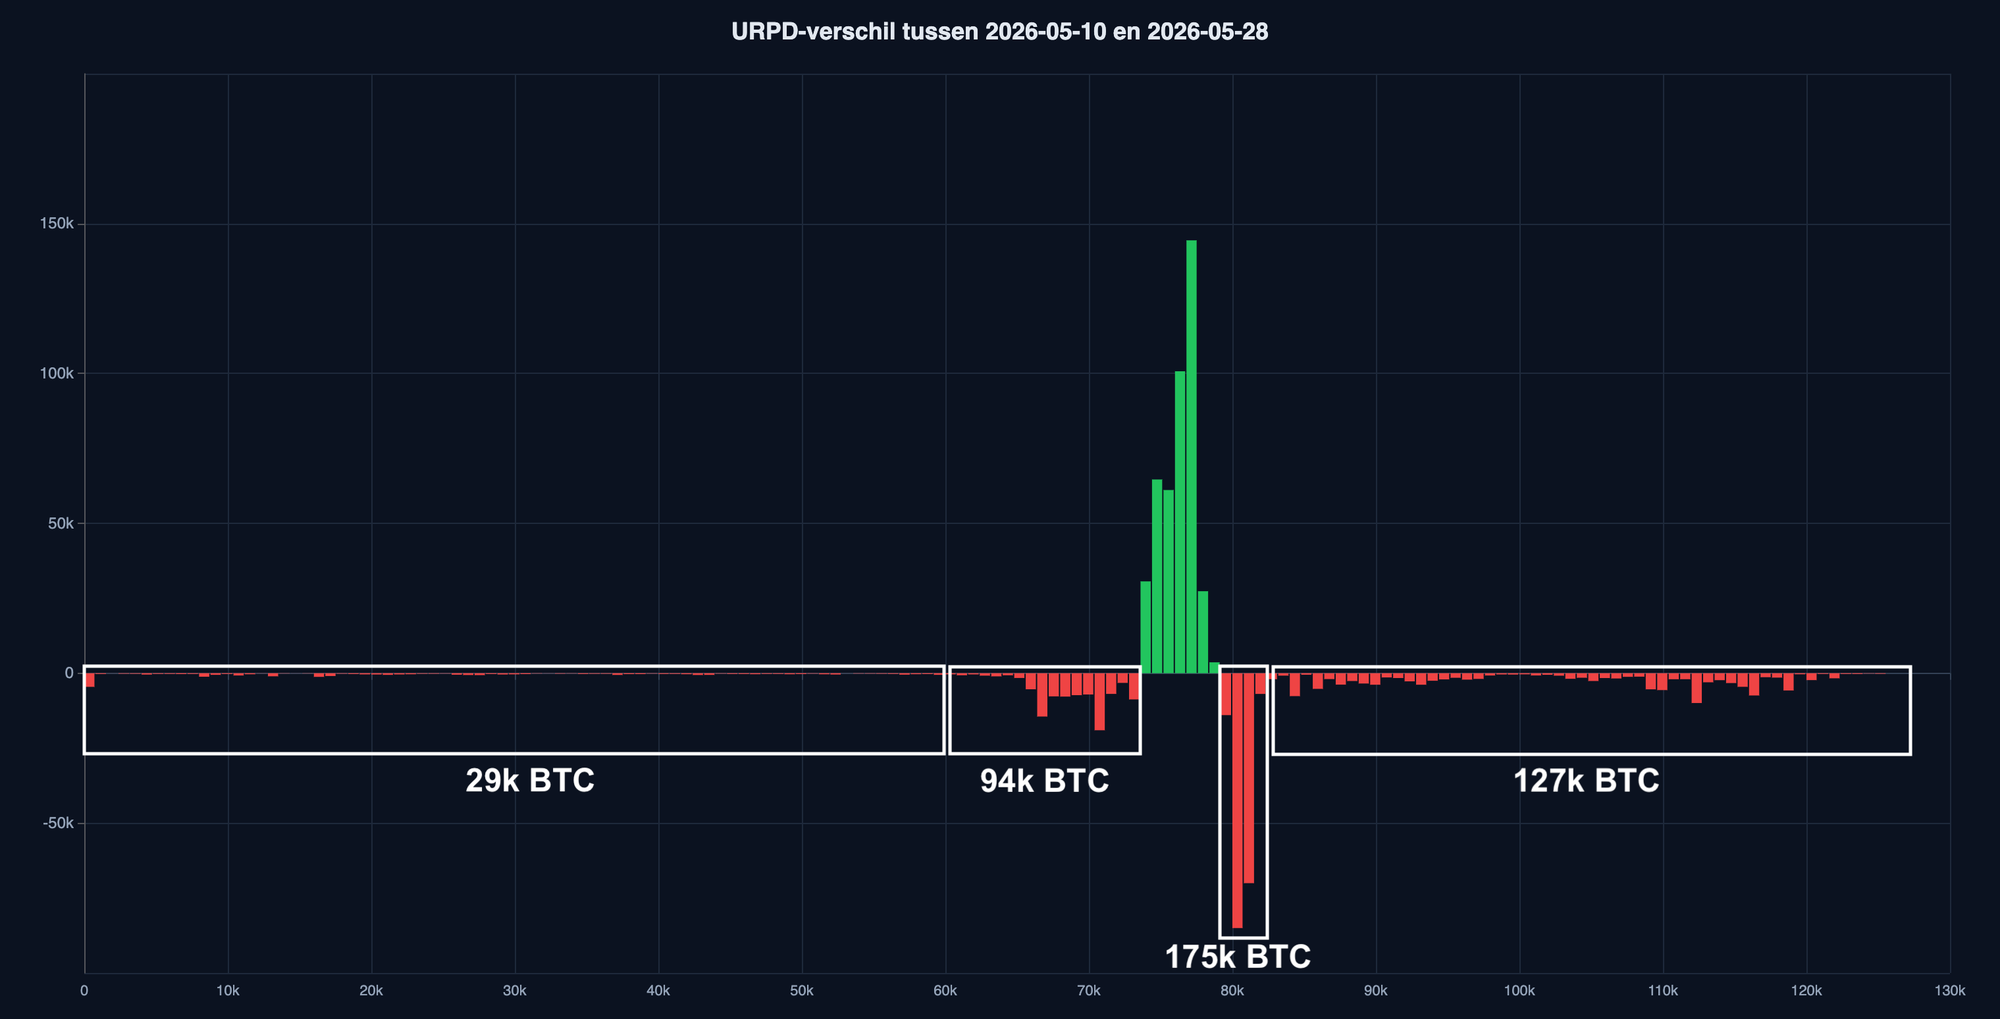
The chart below shows the difference between the distribution of purchase prices on May 10 and May 28. It reveals who sold as the price dropped from $82k to $73k:
- 175,000 BTC was sold by investors who bought between $78k and $82k, presumably assuming the new bull market had begun.
- 94,000 BTC was sold by investors who bought between $60k and $73k — traders who entered after the February bottom and are now taking profits.
- 127,000 BTC was sold at a significant loss by investors who bought above $82k, during the previous bull market.
- 29,000 BTC was sold by investors who purchased below $60k — the long-term holders and OGs.
You could view the first two groups as the traders and opportunists. They're always present, and they amplify trends in both directions.
The other two groups are more interesting. Long-standing investors taking profits are no longer contributing much to the supply side. Loss-takers who entered during the previous bull market are still very much present. This fits where we are on the sentiment chart: capitulation.
The narrative here may be that the AI stock hype is simply too attractive, and people are taking their losses to jump on the AI train.
One piece of supporting evidence is the deeply negative Coinbase premium, which suggests American investors are selling bitcoin at an above-average rate. The chart below shows that the premium is currently around the level seen during the rapid price decline in January and February.
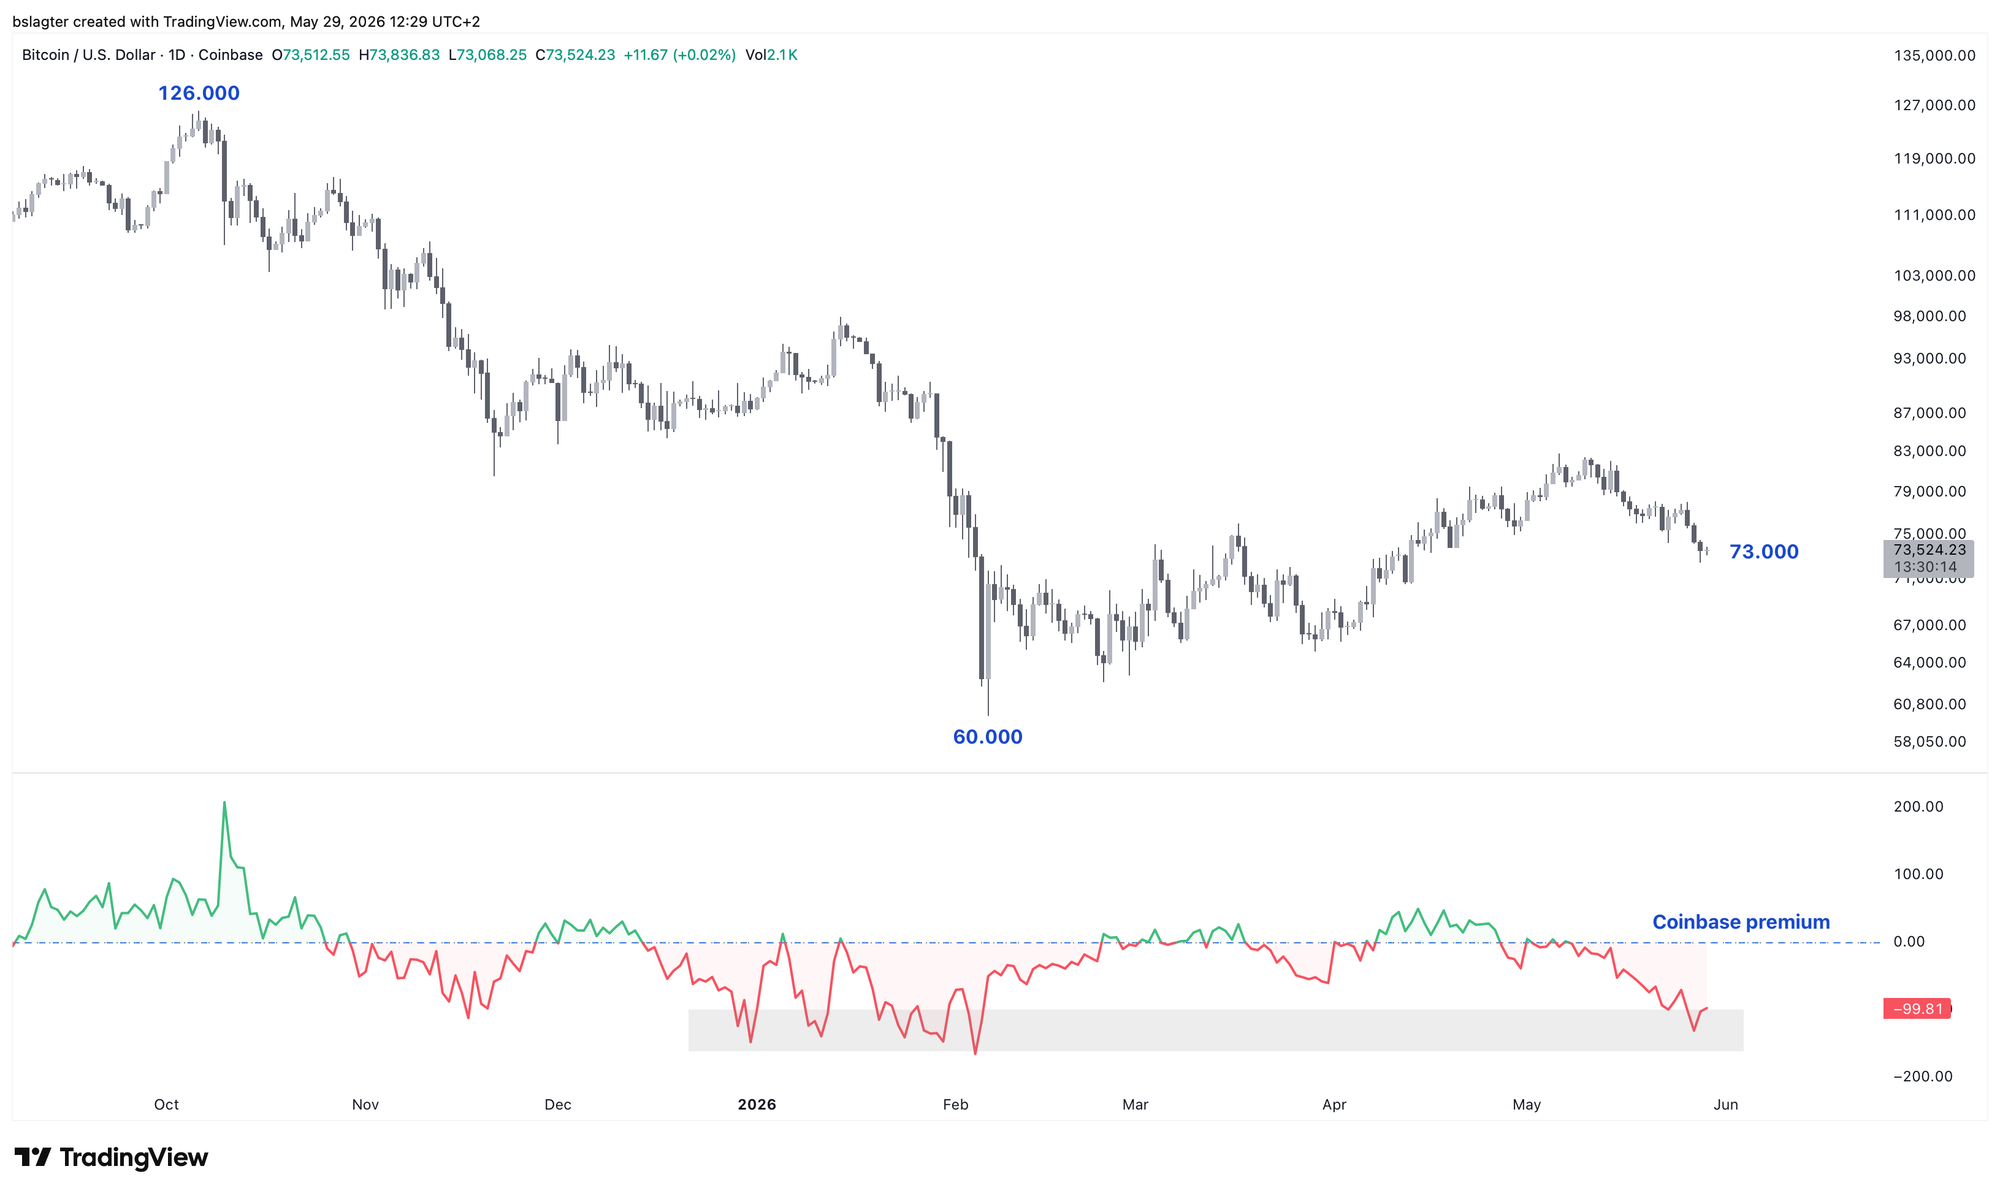
Investors aren't fleeing because they're afraid of more crypto companies collapsing, as in 2022 — they're leaving because the grass looks greener on the other side. A different motive, the same result: a textbook bear market.
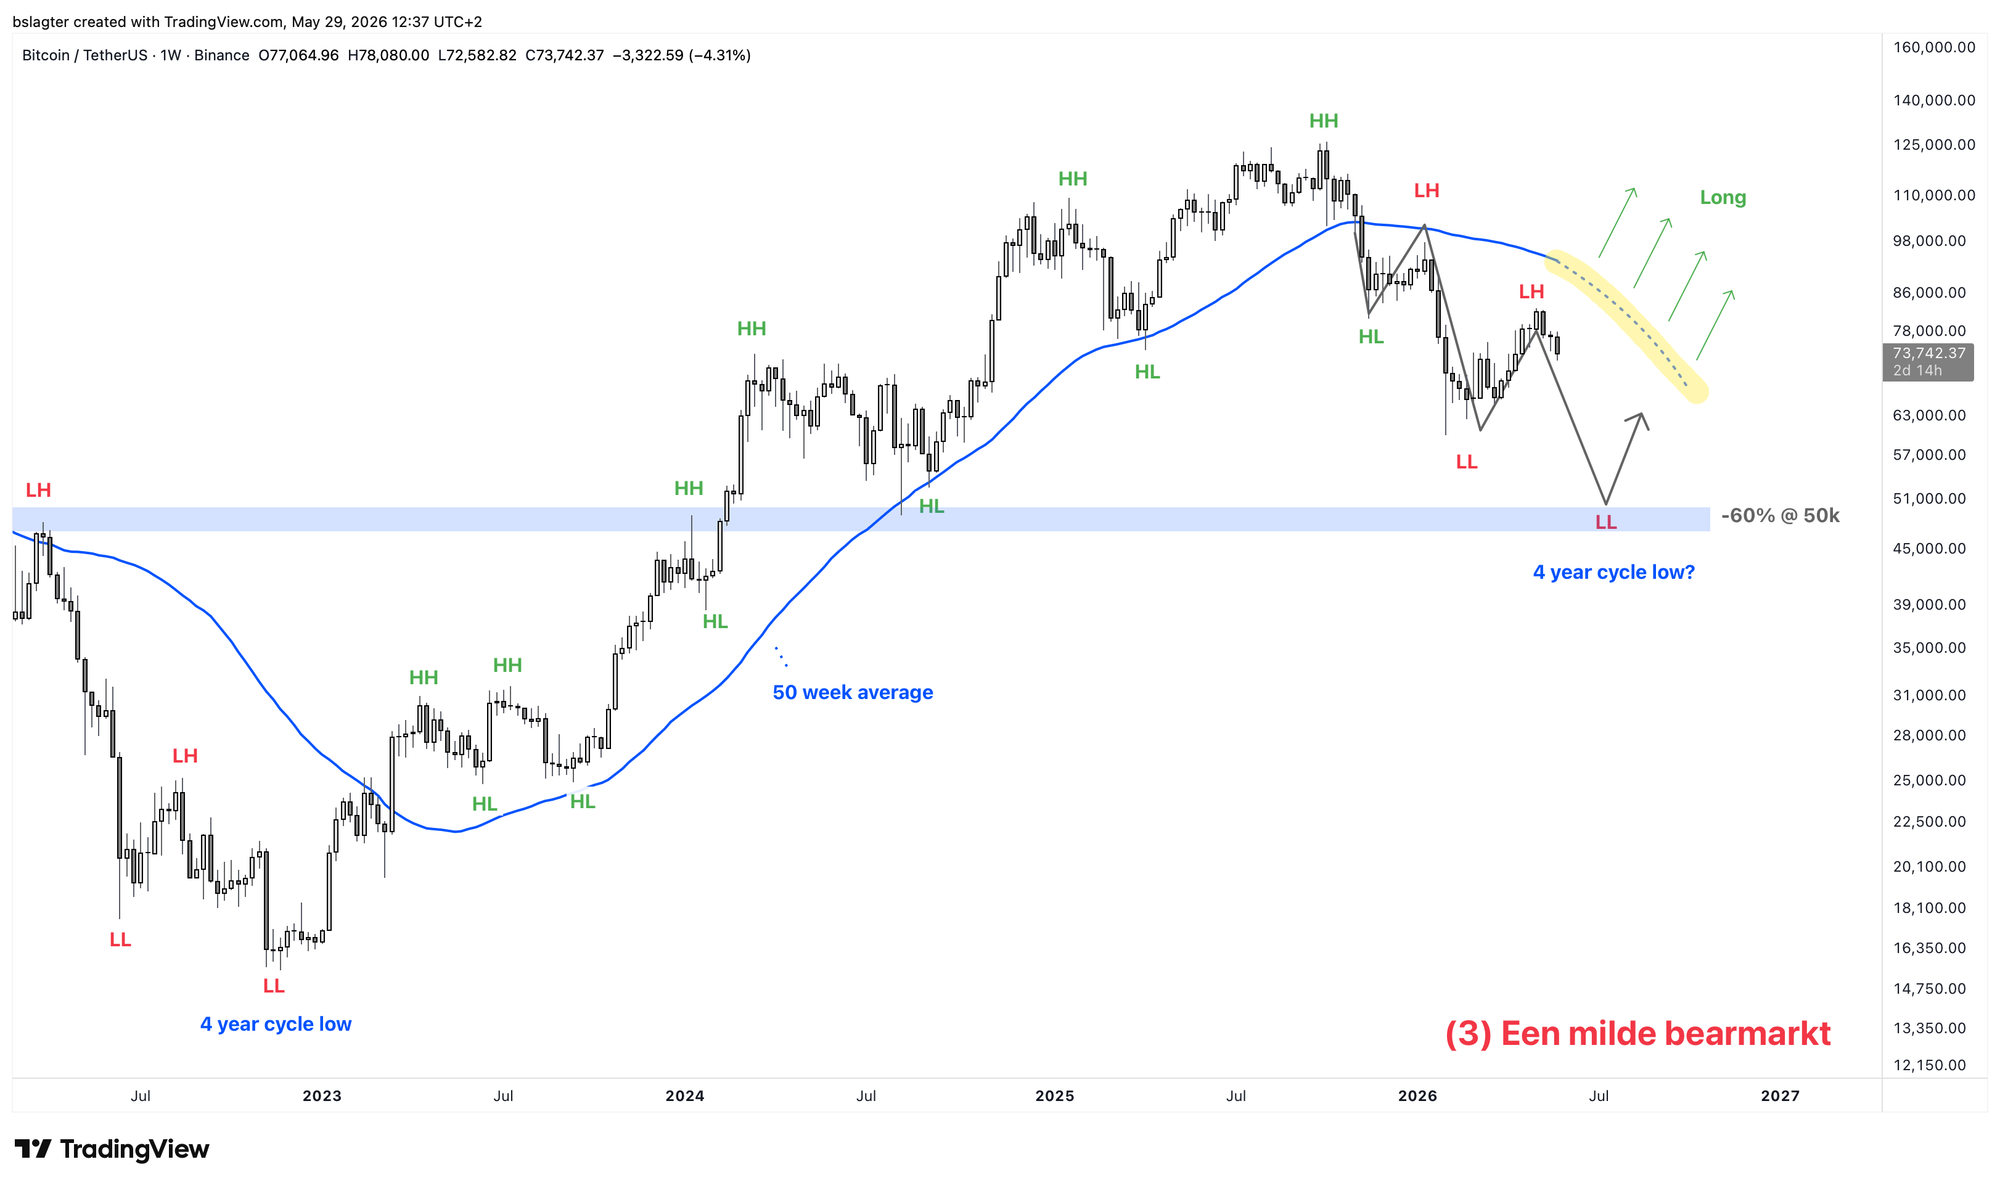
The price is still tracking our base scenario from November quite nicely.
Based on that, we continue to expect a lower bottom below $60,000 in the coming period. However, should the weekly cycle low come in above $60k, that would be a signal that this bear market may be forming more of a "bottom through time" rather than a "bottom through price." We'll see!
We continue with the following topics for our Alpha Plus members:
- Bitcoin's yearly & weekly cycle
- Bitcoin compared to other markets
- A handful of gems in a sea of weakness
- U.S. inflation slightly lower than expected after all
- Weak consumer puts central banks in a bind
1️⃣ Bitcoin's yearly & weekly cycle
 Contribution by
 Bert
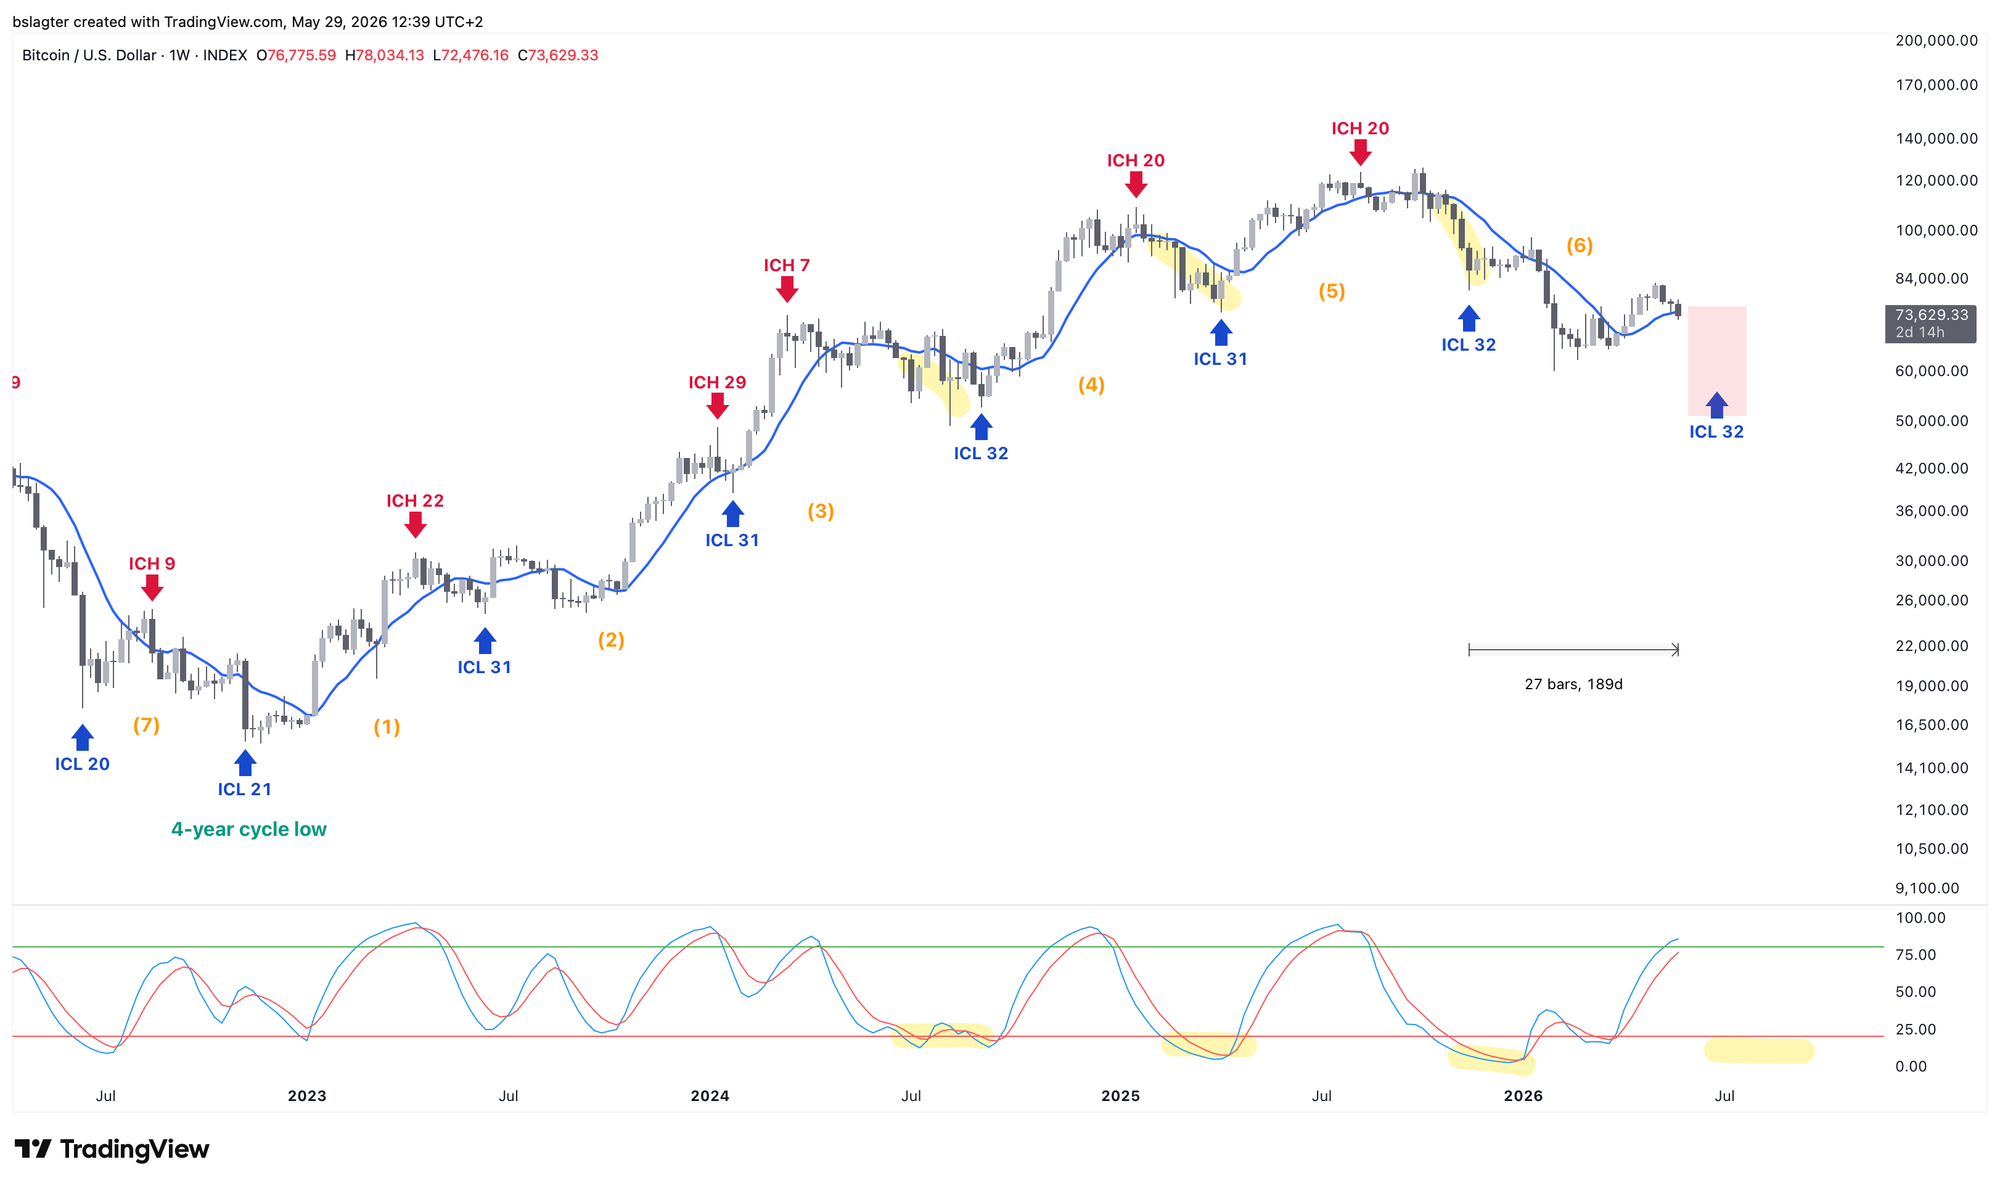
If we assume this weekly cycle started on November 21, we're now in week 27 of the average 32 weeks. That would mean this or the next daily cycle brings us to the weekly cycle low (ICL), somewhere in June or July.
An alternative reading is that we had a very short weekly cycle between November 21 and February 6 — in which case we're only in week 16 now, and may need a bit more time.
In all scenarios, we can see this weekly cycle is starting to run out of steam. The price could close this week below the 10-week moving average, currently at $74,600. And the momentum oscillator at the bottom is also heading toward a peak.
The next ICL is going to tell us a lot. If the ICL comes in above $60,000, we have our first higher low (HL) — and thus a potential trend reversal. If the ICL comes in below $60,000, we'll be watching for bullish divergences that can develop with indicators like RSI, MVRV, and the Fear & Greed Index.
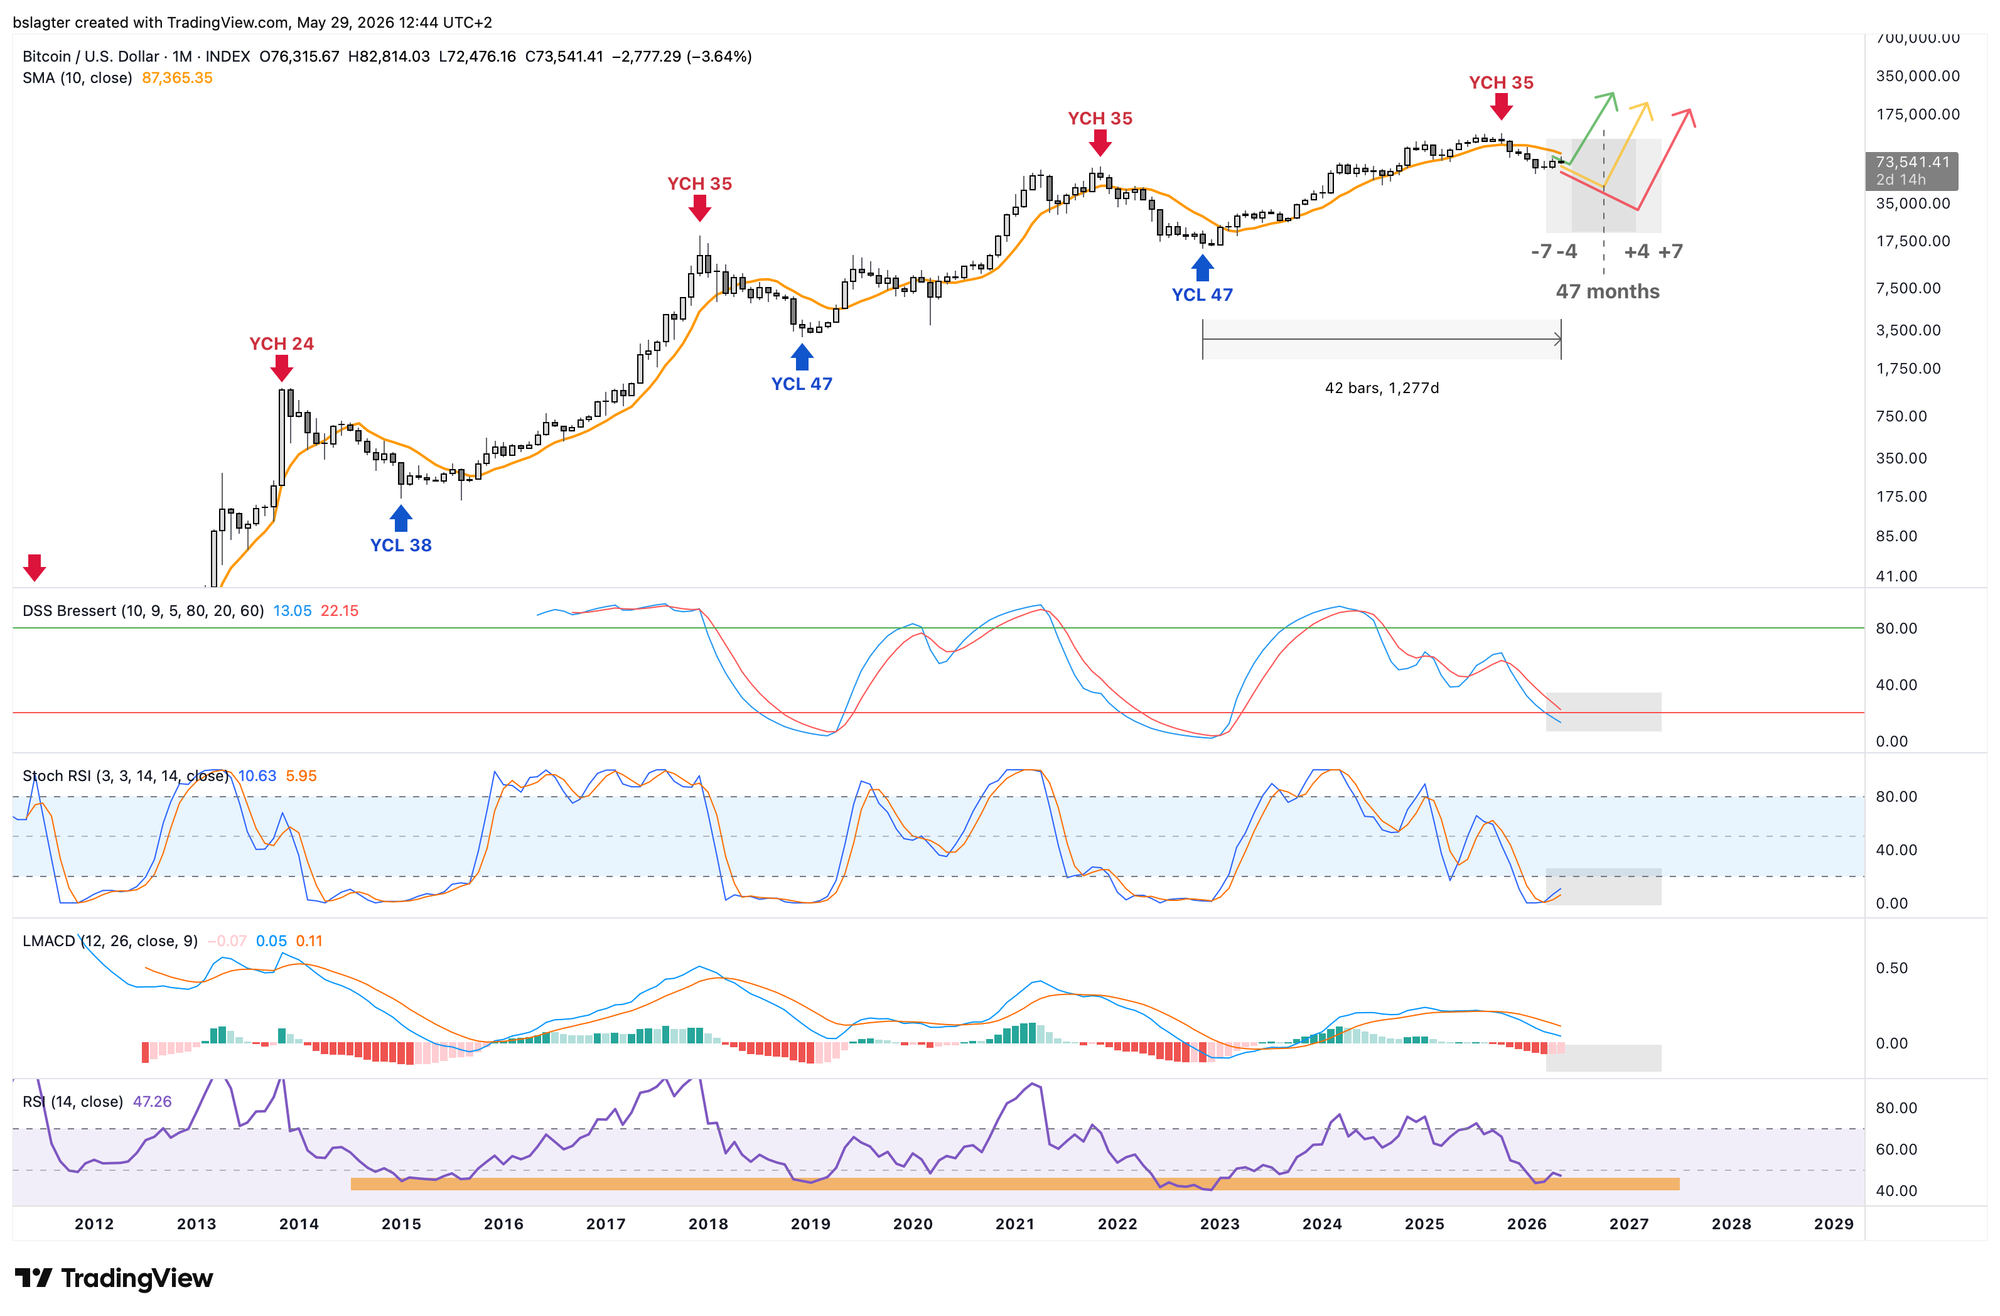
In a few days, the May monthly candle will close. It opened at $76,300 and is currently at a slight loss. If it closes in the red, that gives indicators room to reset further.
June is the first month that falls within the 10% spread around the average cycle length of 47 months. Exactly 47 months would be October. That would fuel the myth of the precise four-year cycle once again. There's no argument for such a metronomic rhythm other than the self-fulfilling prophecy. But maybe that's enough.
In more and more ways, we're approaching the time window where you can expect the bear market bottom. Right now, there may be few reasons to expect much lower prices, but that can change quickly. Perhaps a stock market correction in the coming months spills over into bitcoin? We'll wait and see!
2️⃣ Bitcoin compared to other markets
Contribution by Bert
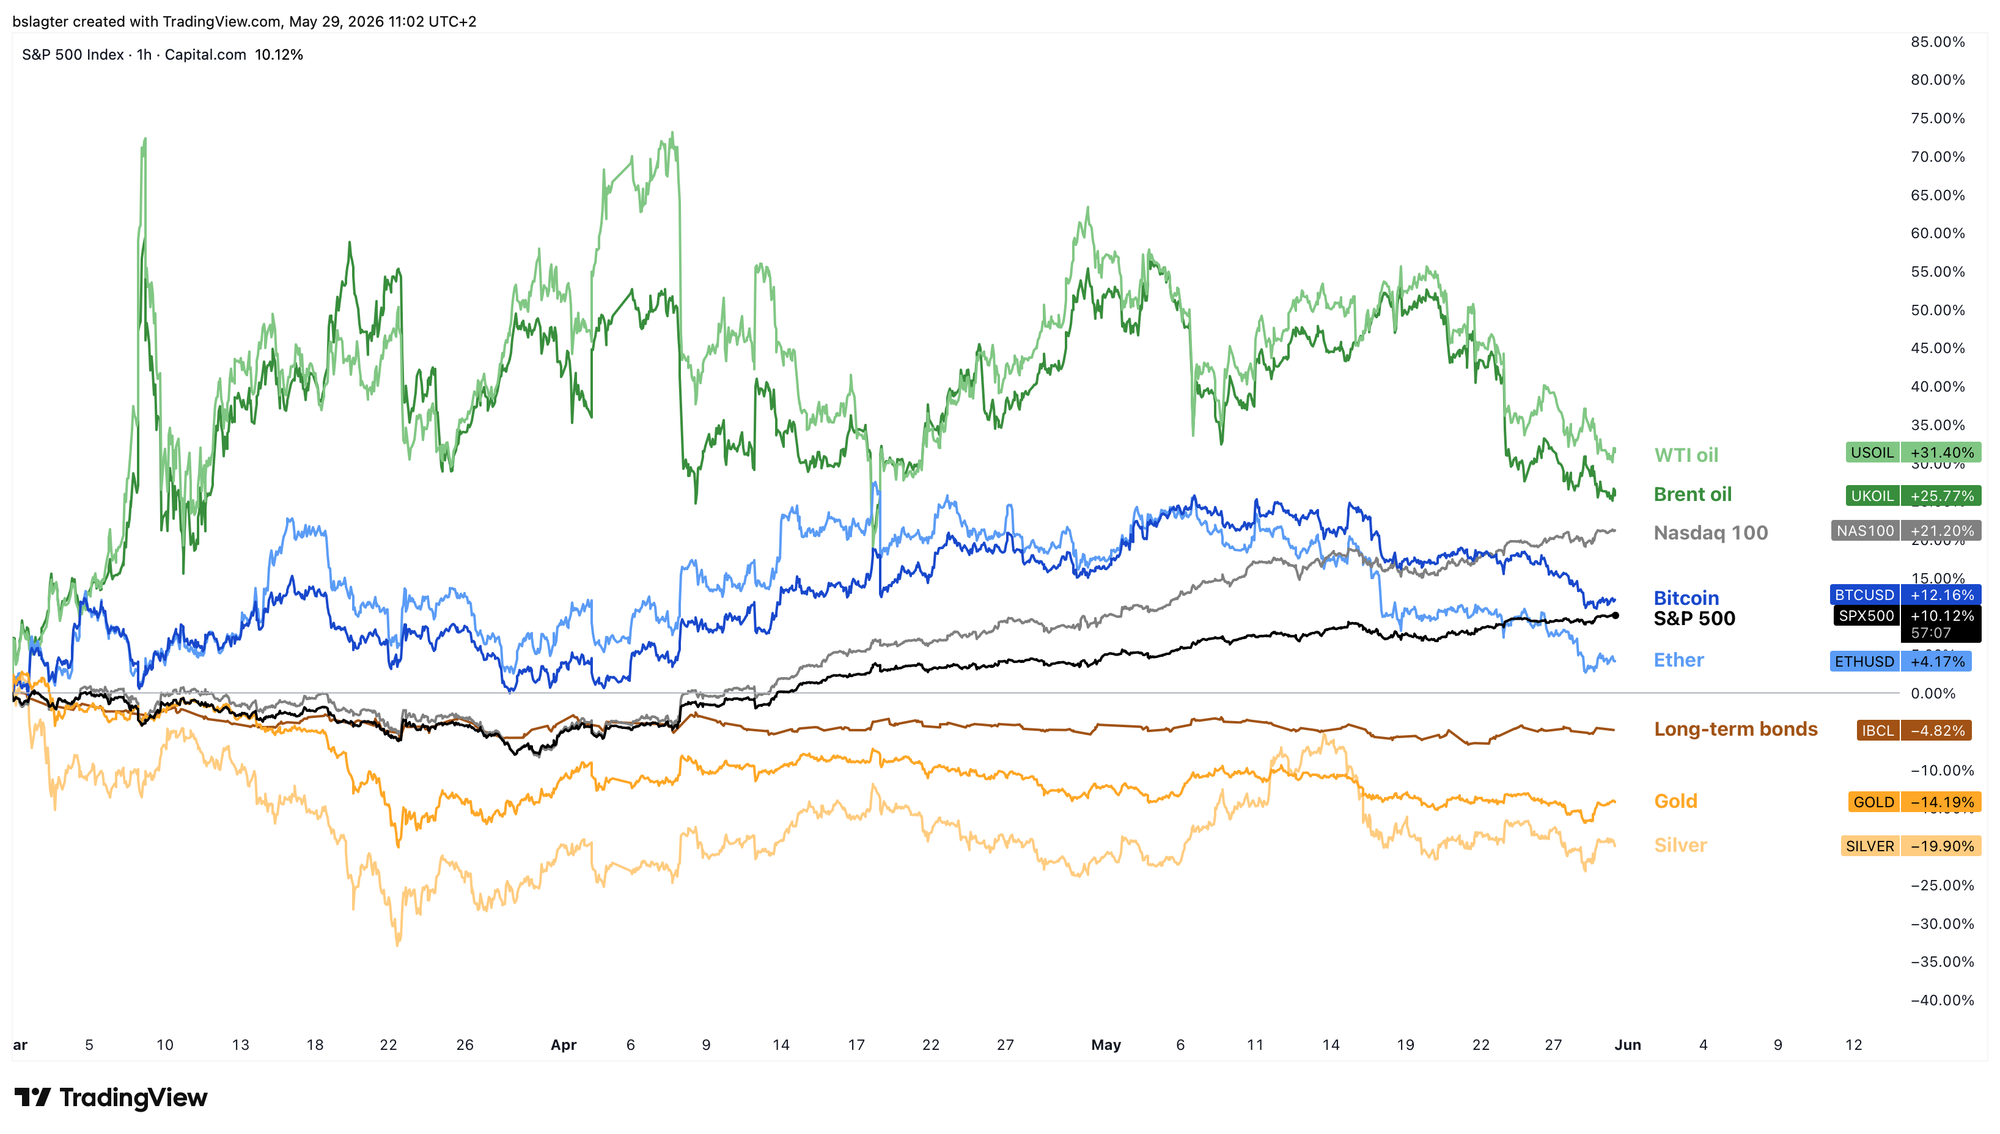
Earlier I created two charts comparing various financial markets — one from the start of this year and one from the start of the Iran war. I thought it would be interesting to share the updated versions of those charts here.
First, the chart from the start of the war on February 28. In the initial phase, bitcoin surprised many with its relatively strong performance. Bitcoin has often done well in these kinds of conflict situations. But it certainly also helped that just before the war, the bitcoin price had dropped 30% in a short period.
By now, bitcoin and ether have given up their lead over the Nasdaq stock index.
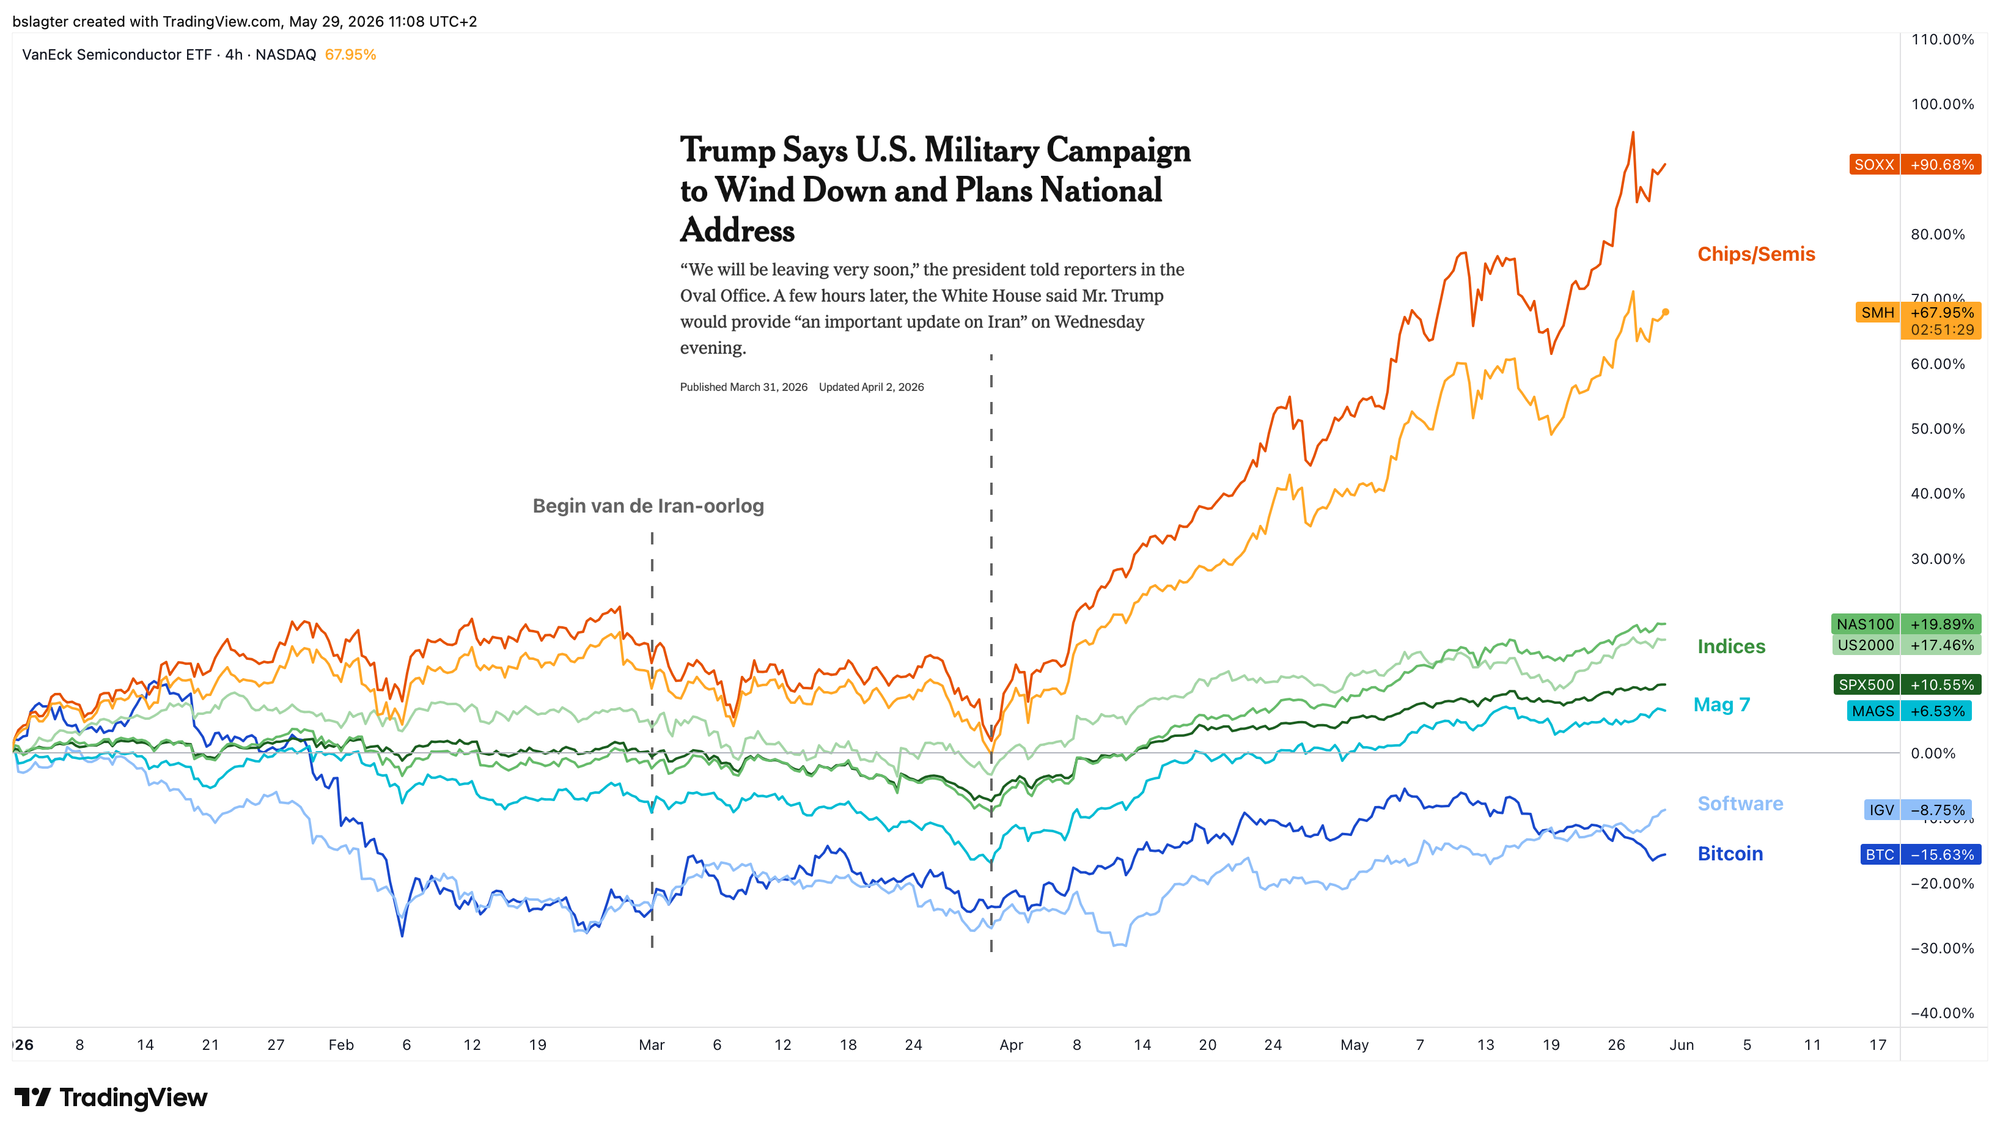
The other chart looked at performance since the start of the year, with AI as the theme. At the top are the chip ETFs, in the middle the major indices and the Magnificent Seven ETF, and at the bottom software ETF IGV and bitcoin.
On March 31, concern about the Iran war gave way to enthusiasm about AI — that shift is clearly visible. Software initially languished below bitcoin but is now recovering somewhat. That's the difference between a bull market (for stocks) and a bear market (for bitcoin).
3️⃣ A handful of gems in a sea of weakness
 Contribution by
 Sam
After the rapid decline from $98,000 on January 14 to $60,000 on February 6, bitcoin entered a months-long period of slow recovery. At the time of writing, we're 25% above the bottom, but progress has been sluggish. So why focus on crypto when other markets are surging and stealing all the attention?
For the vast majority of the crypto market, that's a fair question — but there are exceptions. Today we'll look at two of these rare gems.
Hyperliquid (HYPE)
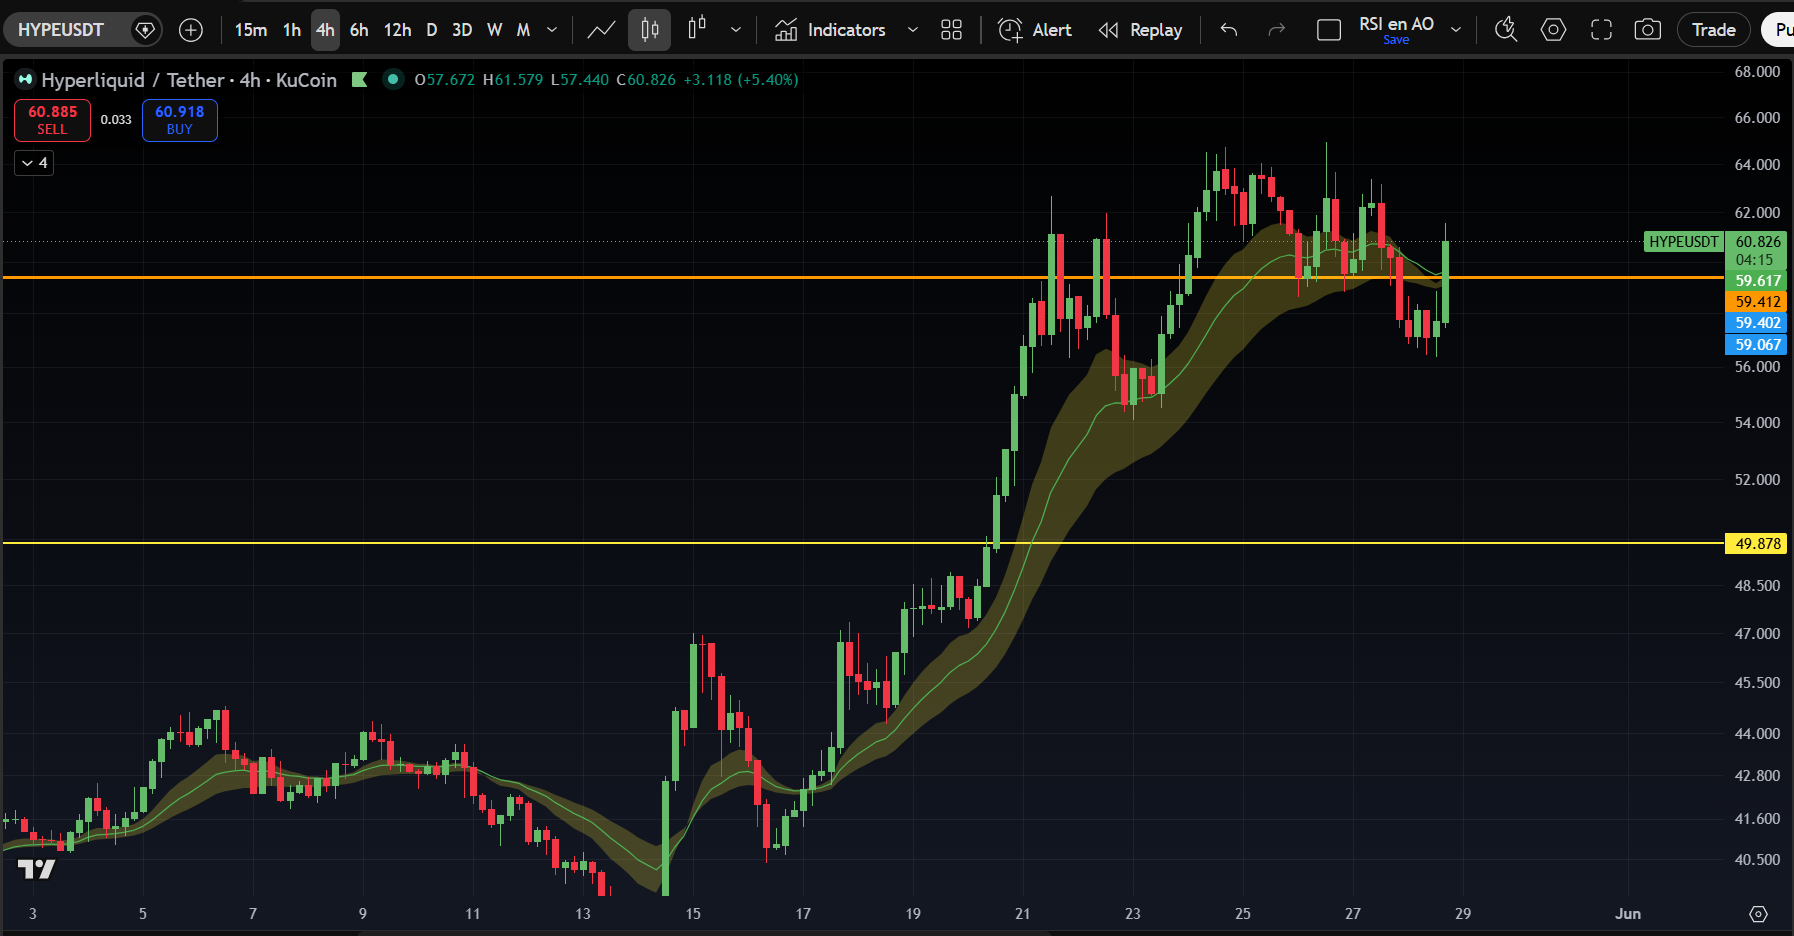
HYPE recently set a new all-time high above its September 2025 peak. On May 14, a partnership between Hyperliquid and Coinbase was announced. In the following days, a significant portion of the rally on this news was given back, before a strong rally of more than 50% to a new high kicked off on May 16.
As shown in the chart below, this rally was supported by the green EMA cloud on the 4-hour chart. Additionally, the September high (orange line) was regularly tested as support.
Regular tests of this old high combined with the flattening green cloud turned out to be signals of weakening momentum. In the early hours of Thursday, HYPE fell sharply below $59. This gave us a close below the green cloud combined with a lower low.
This is a change in behavior and therefore a warning. Although HYPE managed to climb back above $60 on Thursday evening, the bulls want to see the price set a higher high above $63.50. Until then, there's a strong chance that a lower high is being formed and the strong momentum has (temporarily) disappeared.
Zcash (ZEC)
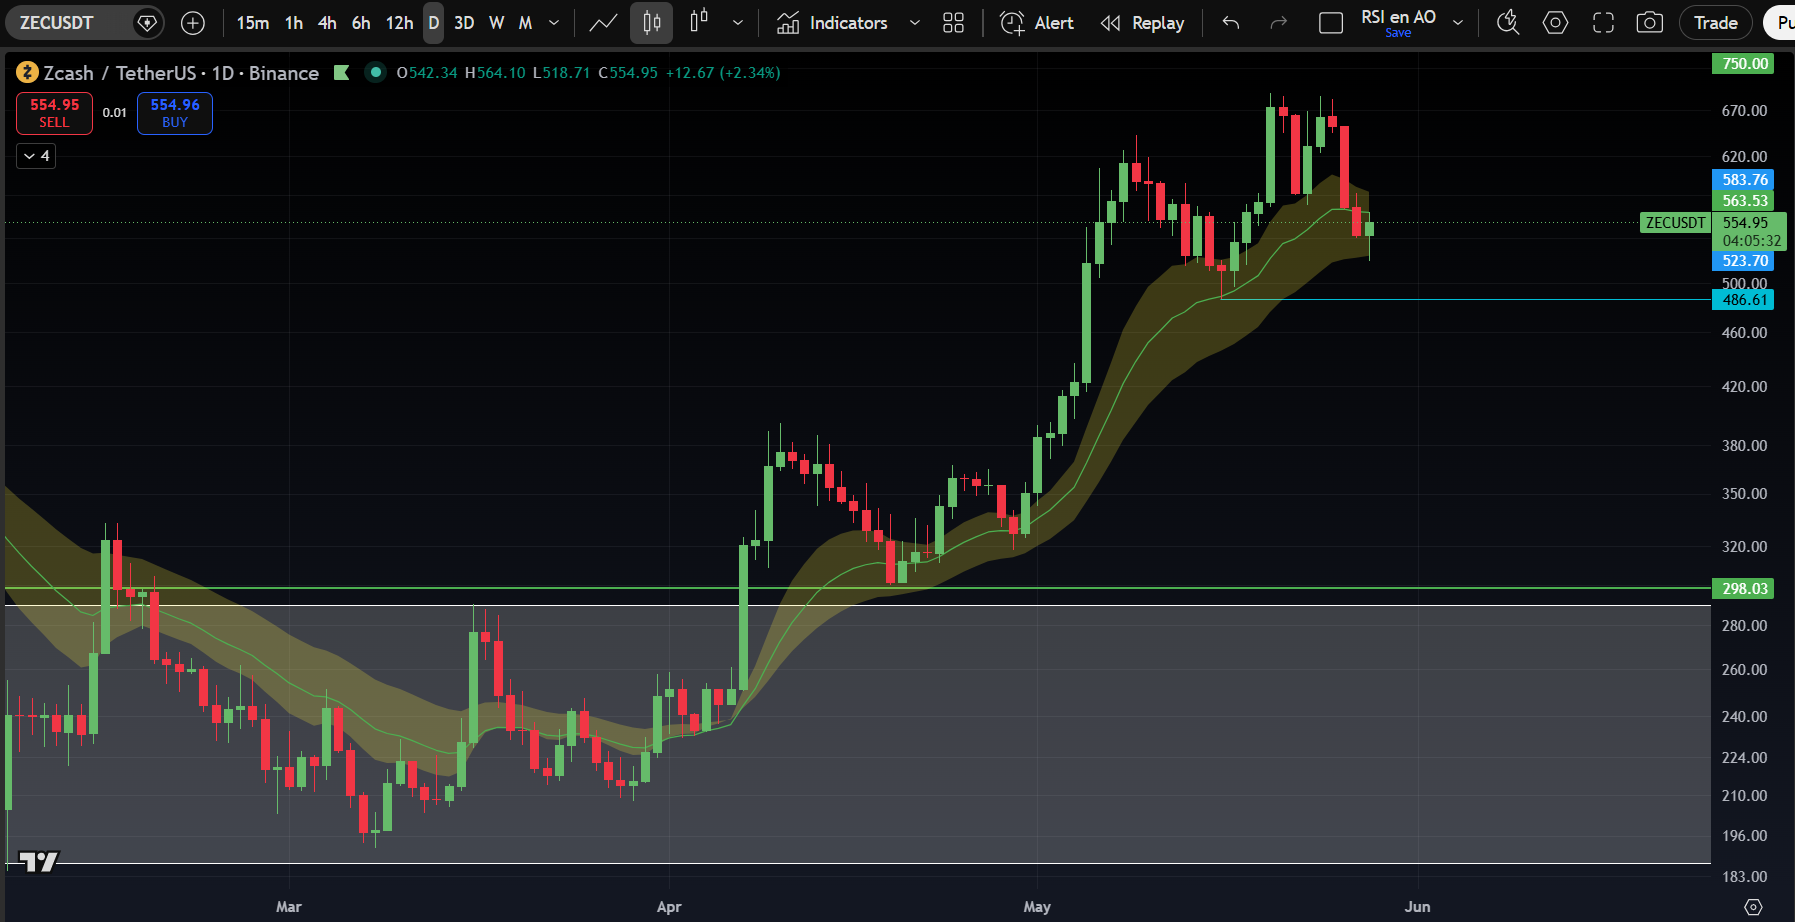
ZEC has shown strong respect for the green EMA cloud throughout 2026, particularly on the daily chart. Where it previously served as resistance multiple times, it has found support there on several occasions since April. The upward market structure of higher highs and higher lows is also clearly identifiable on the daily chart.
Combining these two observations, we can conclude that a daily close below $485 would mean both a lower low has been set and the green cloud has been lost as support. That would be an important signal that the (local) top has likely been put in. Until then, we assume the uptrend remains intact.
If a new higher high is set above $690, the warning levels will move higher as well.
4️⃣ U.S. inflation slightly lower than expected after all
 Contribution by
 Thom
The Federal Reserve's preferred inflation gauge, the core PCE deflator, came in slightly lower than expected this week. Prices rose 0.2 percent on a monthly basis, versus the market's expectation of 0.3 percent. That sounds positive at first glance, but the figure is still above the pace needed to convincingly bring inflation back toward the 2 percent target.
Perhaps more importantly, the data reveals something about the previously discussed American consumer. Economic growth for the first quarter was revised downward from 2.0 to 1.6 percent.
This was partly due to consumer spending being weaker than initially estimated. In April, real household spending then rose by just 0.1 percent on a monthly basis. That points to a weak start to the second quarter, while the U.S. economy runs on consumer spending for roughly 70 percent.
This makes it clear that higher energy prices are not just an inflation problem — they're also directly weighing on economic activity. After adjusting for inflation, households have less income left to spend. Real disposable income of American households has now declined for three consecutive months and sits at its lowest level since February 2025.
That's an important signal, because it's precisely this income that forms the foundation of consumer purchasing power.
To maintain their spending levels, households then have to dip into savings or wealth. That appears to be exactly what's happening. The savings rate fell to 2.6 percent in April, down from 3.2 percent in March and a long-term average of about 6 percent.
That makes current consumption growth vulnerable. As long as households can only maintain their lifestyle by saving less, the odds increase that spending will eventually come under pressure.
The labor market remains reasonably stable for now. Initial jobless claims came in at 215,000, roughly in line with expectations.
Yet that does little to change the picture we've outlined. Inflation remains a problem, while growth and purchasing power are showing signs of fatigue. That's precisely the combination that could become decisive for Federal Reserve policy in the coming months.
5️⃣ Weak consumer puts central banks in a bind
Contribution by Thom
Last week in Markets, I wrote about the weak price action in U.S. consumer stocks. That pattern bears a striking resemblance to bitcoin's trajectory over the past few months.
While bitcoin is increasingly being embraced by Wall Street, the retail investor still plays a crucial role at this point. In this piece, I want to show how that same consumer is putting the Federal Reserve in a difficult position — and why, in theory, that could actually end up supporting bitcoin.
Due to the Iran war, inflationary pressures are rising globally. The result is that prices in the Western world are rising faster than wages, further squeezing consumer purchasing power.
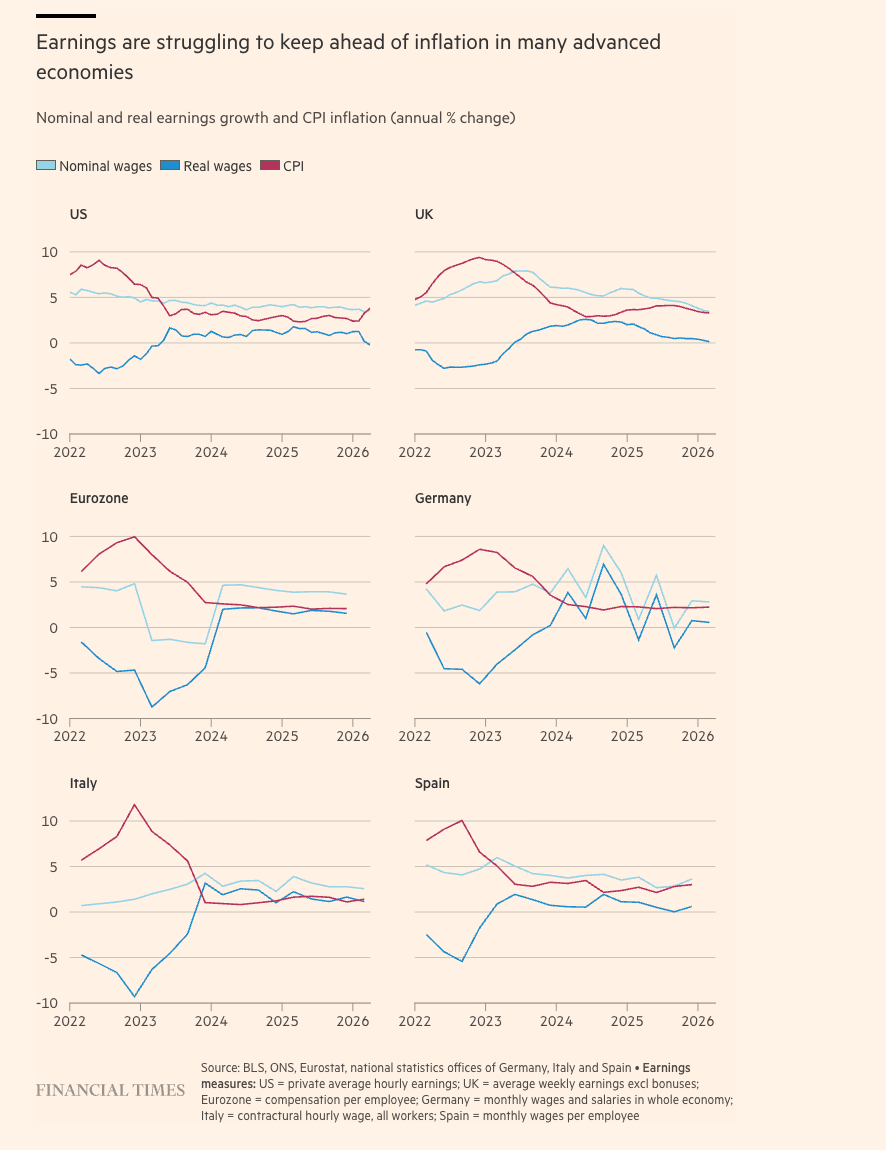
Evidence of a K-shaped economy in the United States can be seen in stocks like Nike and Lululemon, which have declined 27.34 percent and 37.84 percent respectively in 2026.
While the AI segment of the economy is thriving, other sectors are genuinely struggling with rising inflation and interest rates.
This makes it harder for the Federal Reserve to intervene with rate hikes. In Europe too, where incoming economic data already looks somewhat weaker, the room for ECB rate hikes is narrowing.
While the market is still pricing in a few rate hikes from the ECB, ING expects just one rate hike for 2026.
When central banks have to choose between taming inflation or saving the economy, they'll obviously choose the latter. I therefore consider it unlikely that we'll see rate hikes from the Federal Reserve.
A swift end to the Iran war and a reopening of the Strait of Hormuz would relieve the pressure to raise rates. In that case, hawkish rhetoric alone would suffice.
There's an element of relief in this for bitcoin as well. If inflation rises while rates stay flat, real rates decline. That makes financial conditions more favorable for risk assets like bitcoin.
Still, it would be better for bitcoin if the American consumer — and really consumers worldwide — were in stronger financial shape. Especially because right now, attention within the financial world is clearly shifting to other sectors.
In closing
All previous editions of Alpha Markets can be found in the archive. Questions, comments, and suggestions are always welcome in the community.
Thank you for reading!
To stay informed about the latest market developments and insights, follow our team members on X:
- Bart Mol (@Bart_Mol)
- Peter Slagter (@pesla)
- Bert Slagter (@bslagter)
- Mike Lelieveld (@mlelieveld)
We appreciate your continued support and look forward to bringing you more comprehensive analysis in our next edition.
Until then!