Weak U.S. Trade Drags Bitcoin to 114K
Bitcoin's stuck in a tight $117k-$120k range for 20 days. Will bulls break free or will bears hold? A dip to $114k hints at a cycle low—could this be the calm before a surge to $150k+? Uncover the signals that might redefine Bitcoin’s next move.
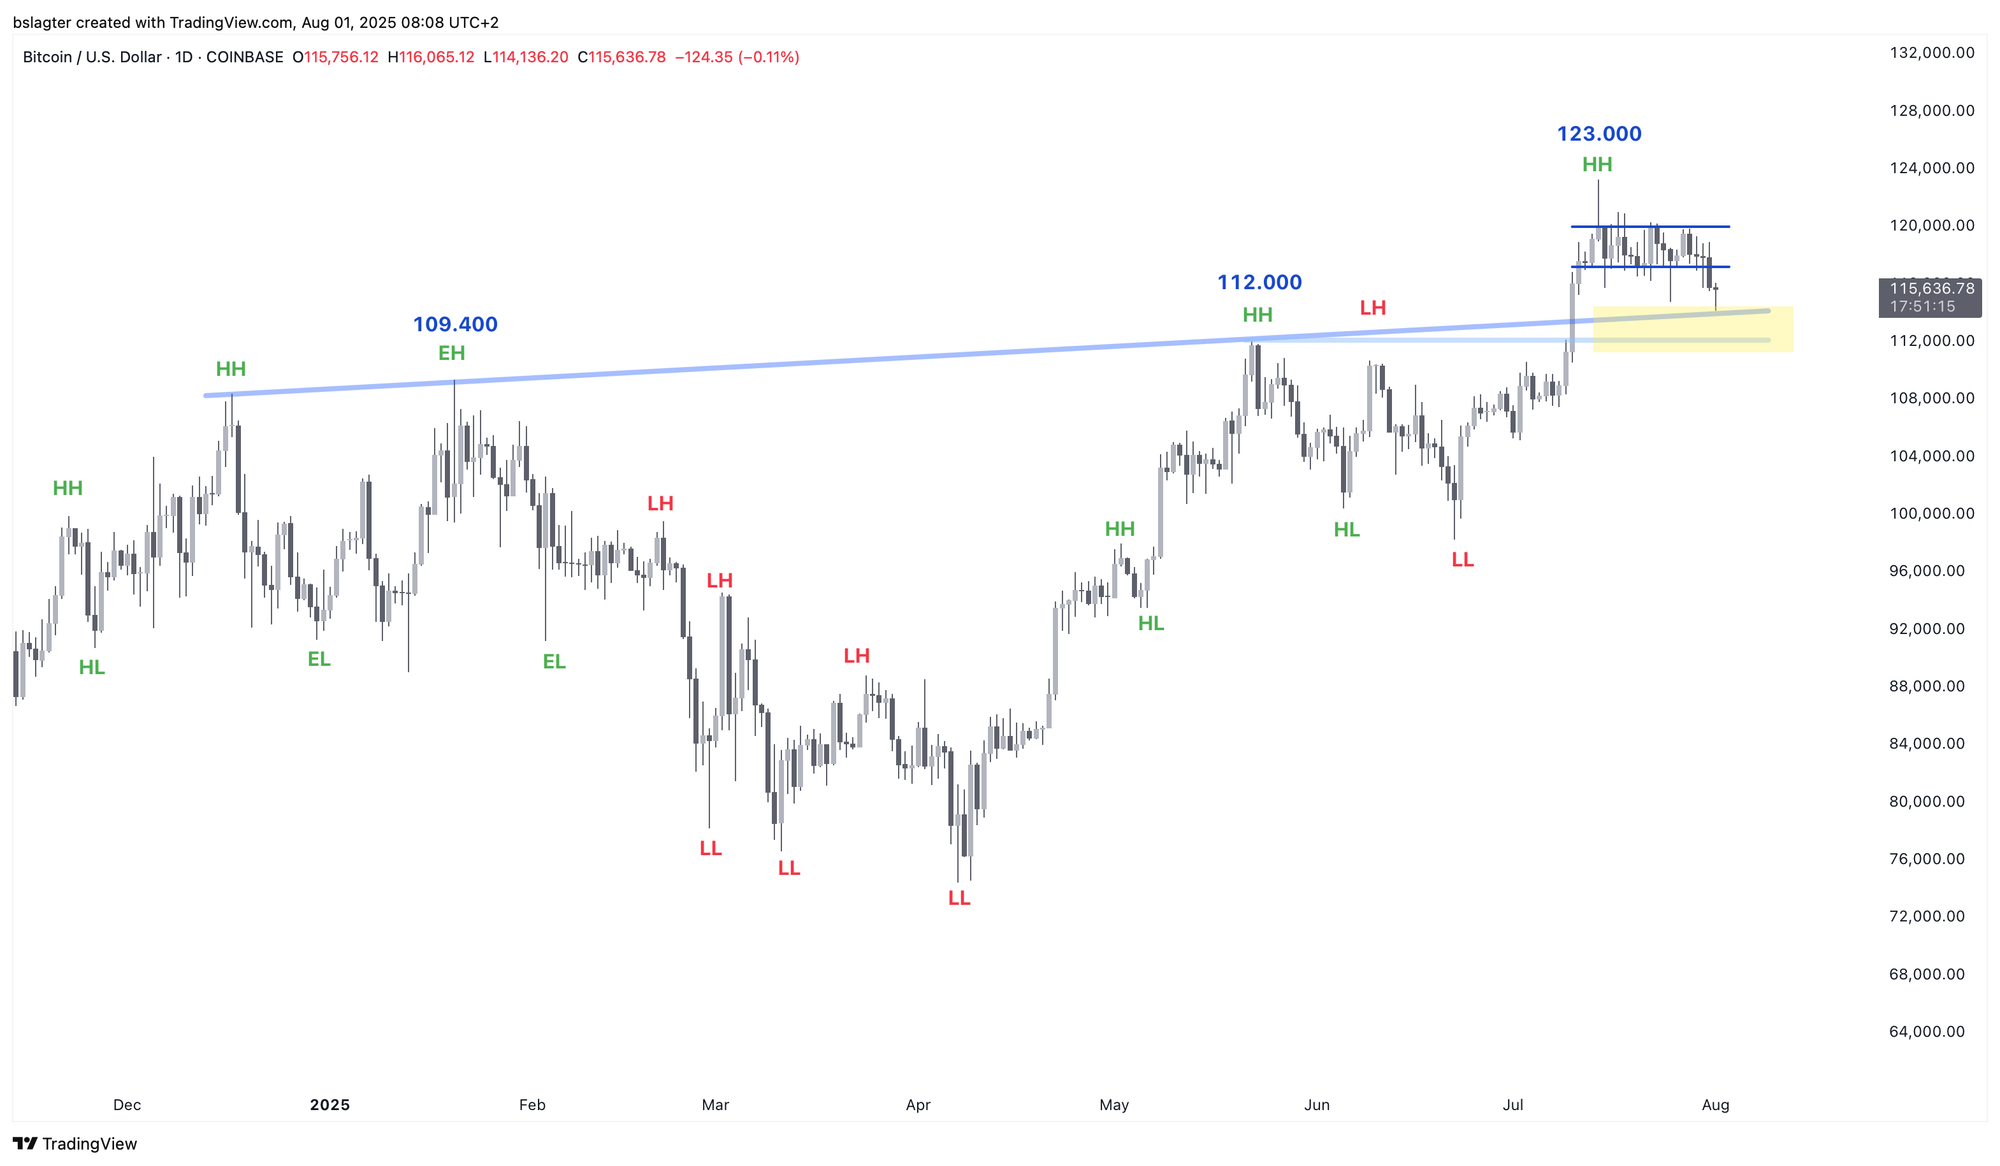
The market is holding its breath. For twenty consecutive days, Bitcoin’s daily close has stayed confined within a narrow range between $117,200 and $120,000—a mere 2.3% band. Ultimately, the question remains: will the bulls or the bears prevail?
A sustained upward movement would be highly significant. Once Bitcoin passes $132,000, it not only matches previous all-time highs of 108k, 109k, and 112k in dollar terms, but also in euros and gold. That would finally put the battle over the 100k mark behind us.
After breaking out above $112,000 on July 10, the price quickly climbed to $115,000, with very little trading taking place between 112k and 115k. Thinly traded zones like these are often revisited, and even now there’s a call to test the breakout level again.
Last night, we saw a mild test when the price on Coinbase fell to $114,100, just brushing against the neckline from the July 10 breakout. Although the previous all-time high of $112,000 hasn’t yet acted as support, that test could come in the coming days.
If this test holds, it will signal the start of a new uptrend. Once buyers overwhelm the market, the price should bounce back above 117k, paving the way for new all-time highs. At that point, the price target range of 150k to 165k, as outlined by Alpha Markets on July 11, will come into play.
Alternatively, the battle around the 100k mark might not be over yet. Many current investors have already booked profits at this historic level. According to Alpha Markets on July 18, roughly 5.4 million Bitcoins traded at around the 100k mark.
It’s also possible that this capital rotation isn’t finished. The price may need to linger in the $90,000 to $120,000 range a bit longer to allow new investors to absorb the supply.
While this isn’t our primary scenario, if evidence begins to suggest that prices above $120,000 are unsustainable, we will adjust our forecast probabilities accordingly.
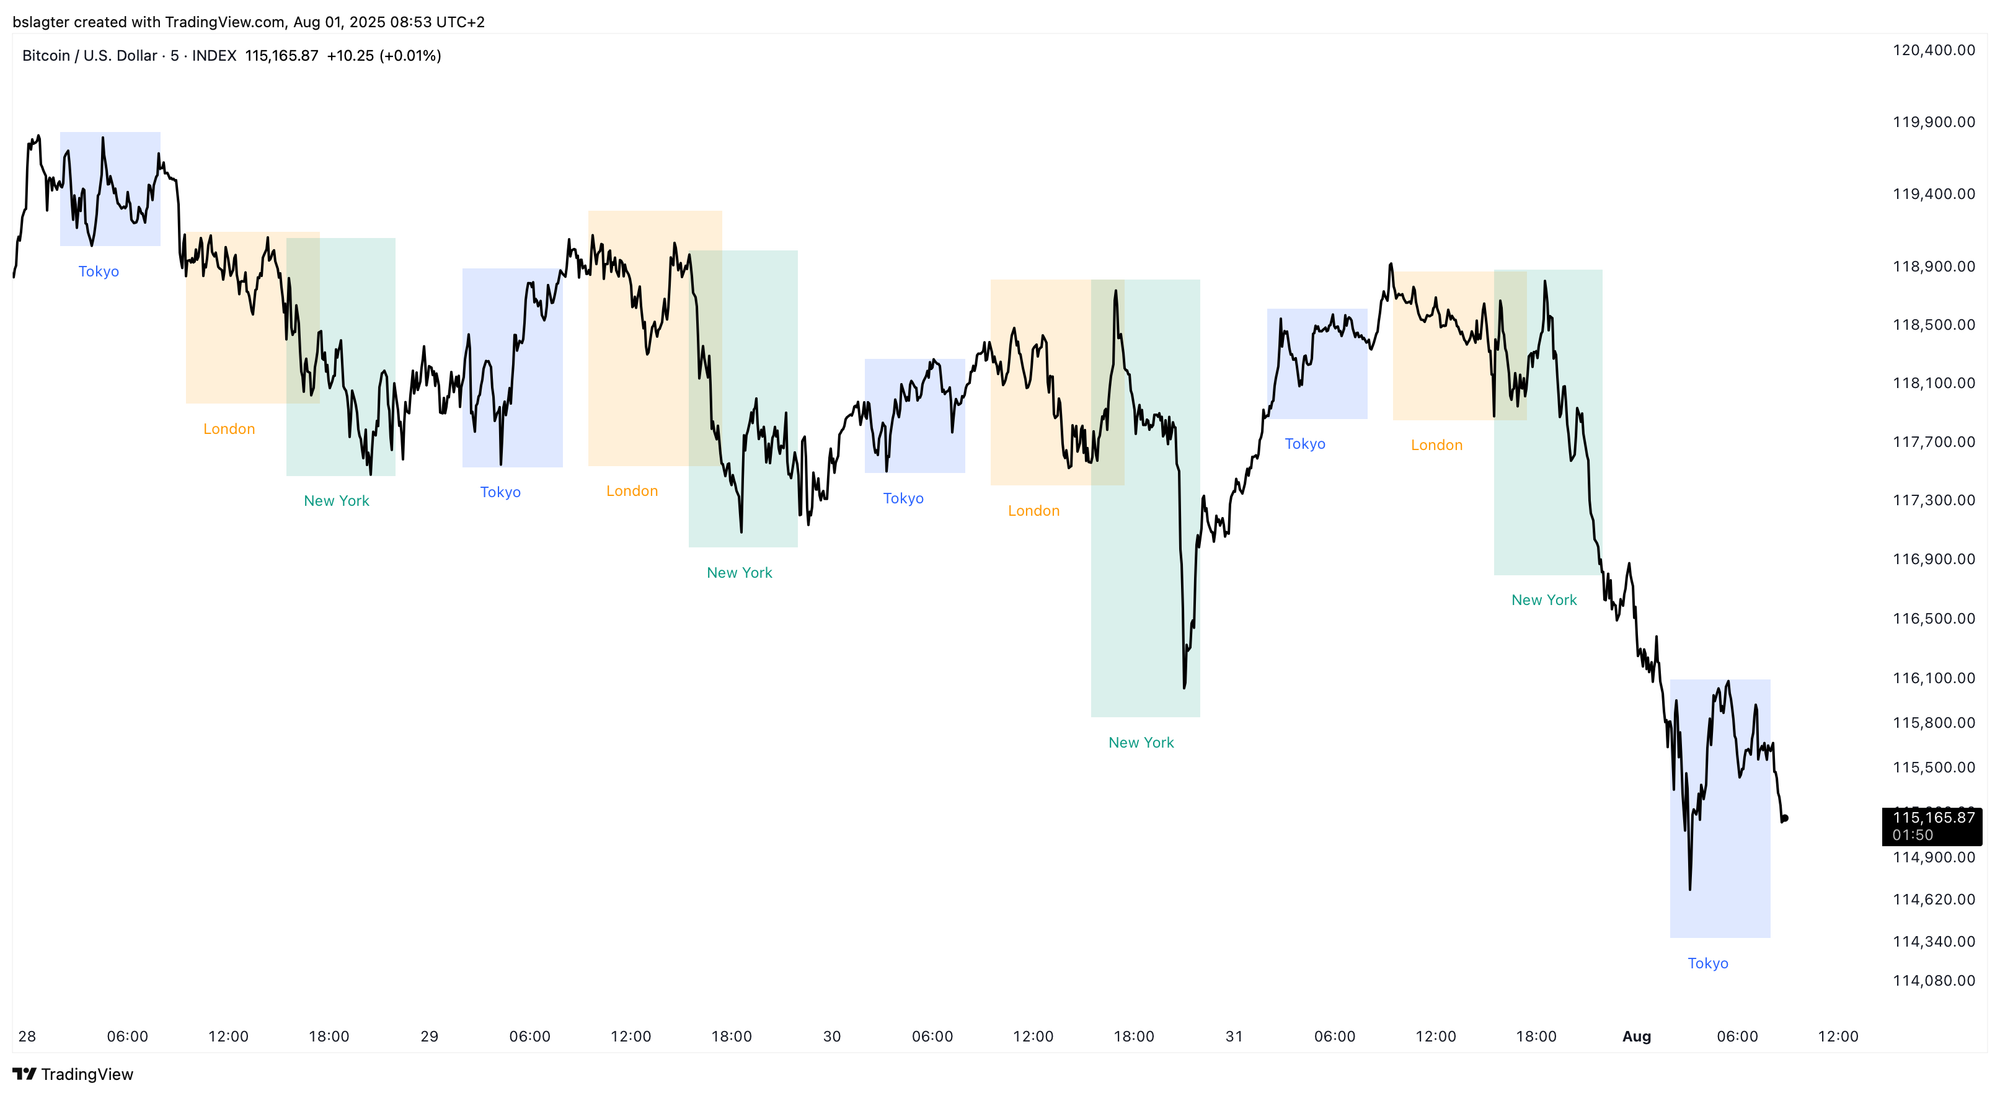
Last week’s trading was weak, especially during U.S. market hours. This is hardly surprising given that U.S. markets are “priced for perfection”—even a small concern can cause prices to falter. This was evident in Jerome Powell’s rather stern speech on Wednesday and Donald Trump’s announcement of a new round of tariffs on Thursday.
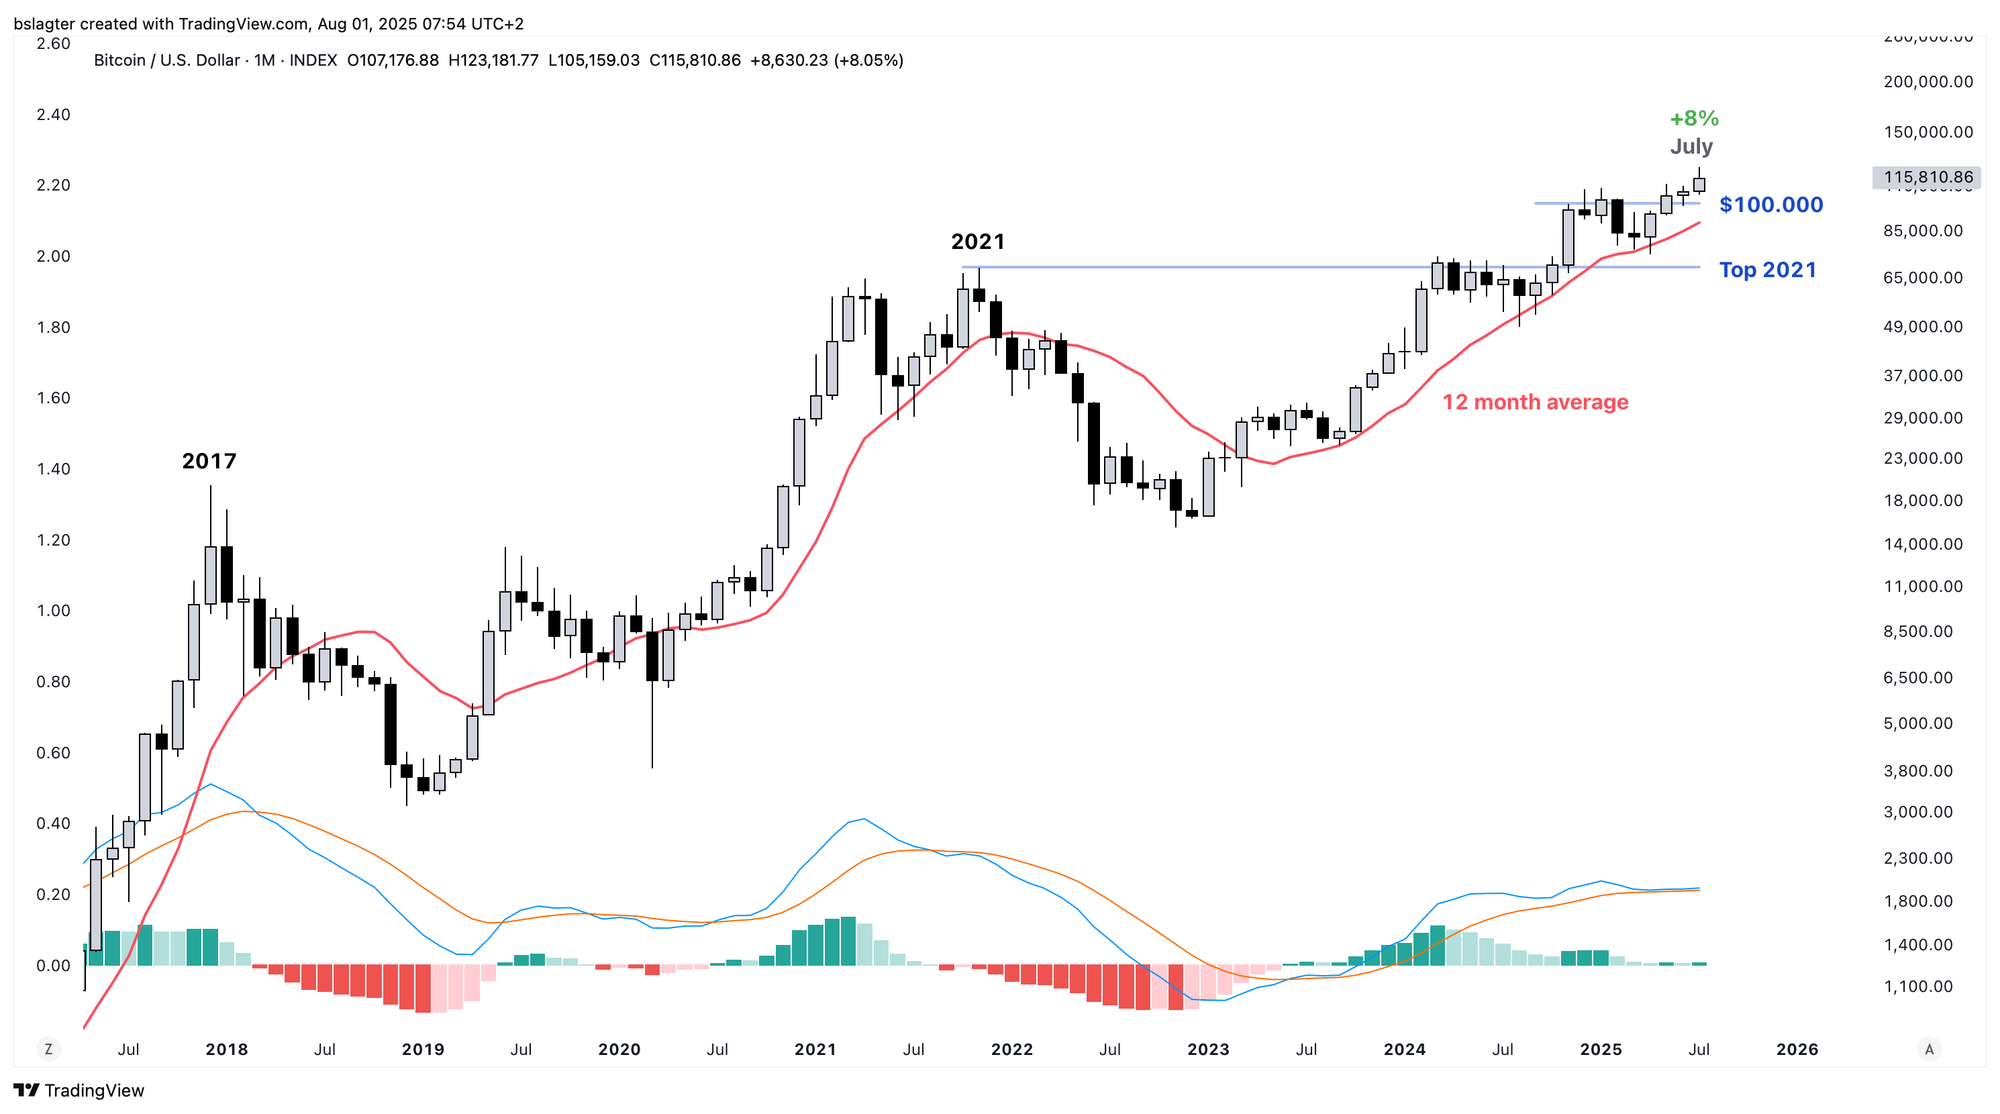
In the long run, these fluctuations are merely noise that will eventually subside. That’s why it’s useful to look at the monthly chart, which filters out daily fluctuations and reveals the broader trend.
Last night marked the close of July on the monthly chart, with a robust 8% gain that comfortably surpassed the 12-month average—a key dividing line between bull and bear markets on the monthly scale. It’s the first time the monthly close has clearly stayed above $100,000, signaling long-term upward momentum in the market.
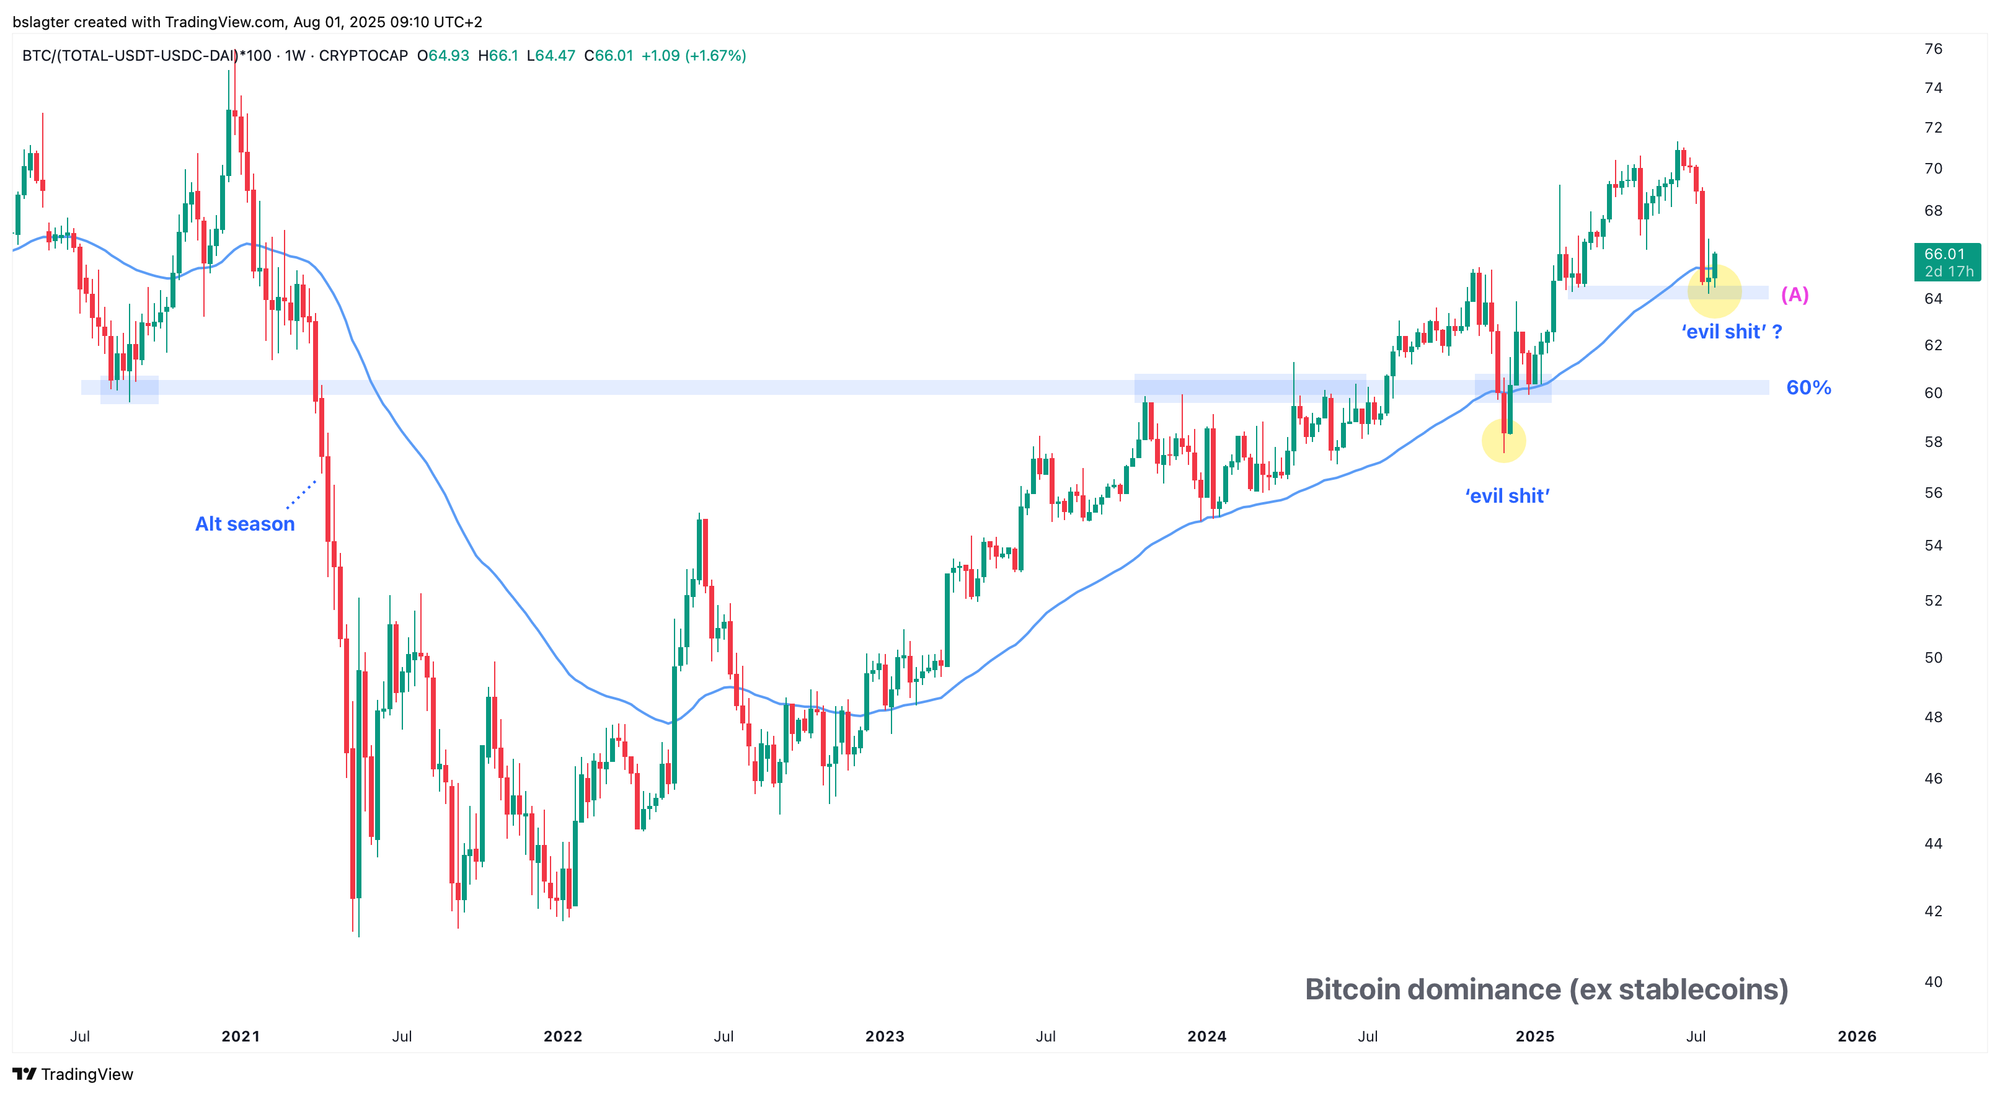
Bitcoin’s recent weakness is mirrored across the broader cryptocurrency market. While ETH has held its ground relatively well, most altcoins have declined significantly in comparison, a trend reflected in the rising Bitcoin dominance observed this week.
In the July 18 Alpha Markets update, we examined whether a new alt season had begun. At that time, we noted the following:
The chart below shows Bitcoin’s market share excluding stablecoins. On the right, you can see the significant drop over the past week. Is this another trap? Or really the start of a new alt season?
We have reached a critical point (A), where a horizontal level that once acted as both resistance and support converges with the dominant average. If we break below here, it indicates that Bitcoin’s dominance will continue to decline, entering a regime where holding altcoins is advantageous.
The updated chart below, which now includes the last two weekly candles, still shows no breakdown below either the dominant average or the horizontal level. Therefore, a new alt season does not appear imminent.
Overall, the picture is mixed. Both the daily and weekly charts are in an uptrend. A drop below $98,000 would be required to disrupt the daily chart, while the weekly chart would need to fall below $74,000 to form a lower bottom.
However, the trend remains tenuous. The bulls have yet to decisively conquer the $100,000 zone. From a cycle analysis perspective, the recent weakness might be explained by a move toward a daily cycle low. We’ll dive into that after the break!
Topics for our Alpha Plus members:
- On the way to a daily cycle low?
- There’s always something negative to point out
- A longer bull run for Bitcoin remains the most likely scenario
- Low volatility for Bitcoin
- The Accumulation Trend Score
1️⃣ On the way to a daily cycle low?
Bert
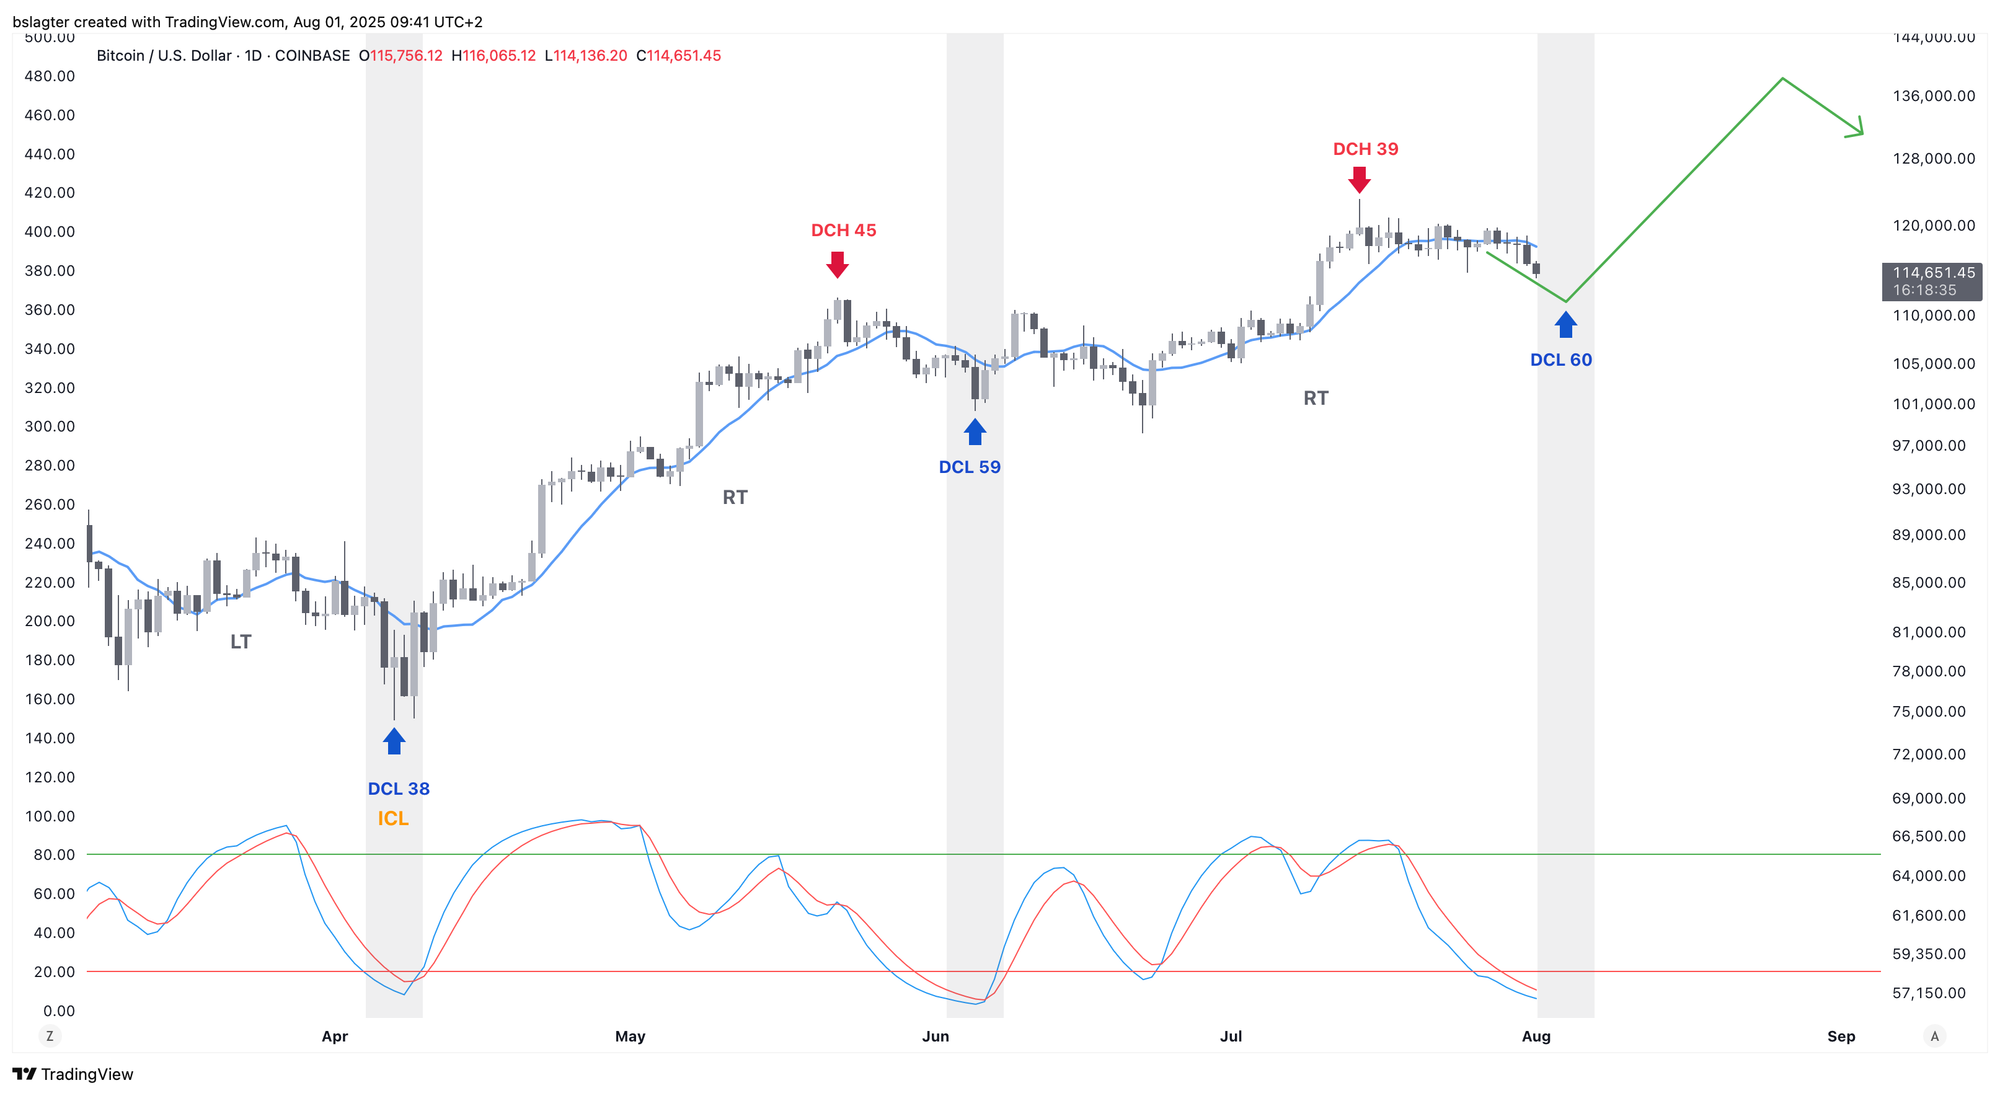
In last week’s Markets update, we discussed the ambiguity surrounding the daily cycle chart. There are two possible interpretations, and the recent drop to 114k lends strong support to one of them.
In the first scenario, we consider June 5 to be the start of the current daily cycle. Today marks day 57, which falls within the expected window for the next daily cycle low (DCL).
Under the second scenario, we take June 22 as the starting point. In that case, day 40 would have passed, suggesting that an upward move toward the daily cycle high (DCH) should be imminent.
After twenty consecutive days with daily closes between 117k and 120k, last night’s close fell to 115k. This strongly supports the first interpretation, although it is the less favorable one.
The next question is how much further the price needs to drop to reach the expected DCL. Not by much, since it already meets all the following criteria:
- It’s below the $114,750 level from July 25
- It’s trading below the 10-day moving average
- The 10-day moving average is trending downward
- The momentum indicator is at its lowest point
- It’s day 57 in the timing band
The price doesn’t have to fall much further—anything above $110,000 would still qualify as a typical, albeit mild, DCL.
From a cycle analysis standpoint, it’s important that this cycle ends above its starting point of $100,300 and that we don’t see a weekly close falling below the 10-week moving average, which is currently around $110,600.
Confirmation that the DCL is behind us can be found in the following checklist:
- A strong reaction at the bottom
- A daily close above the 10-day moving average, which is now at $117,500
- An upwardly curving 10-day moving average
- A new all-time high
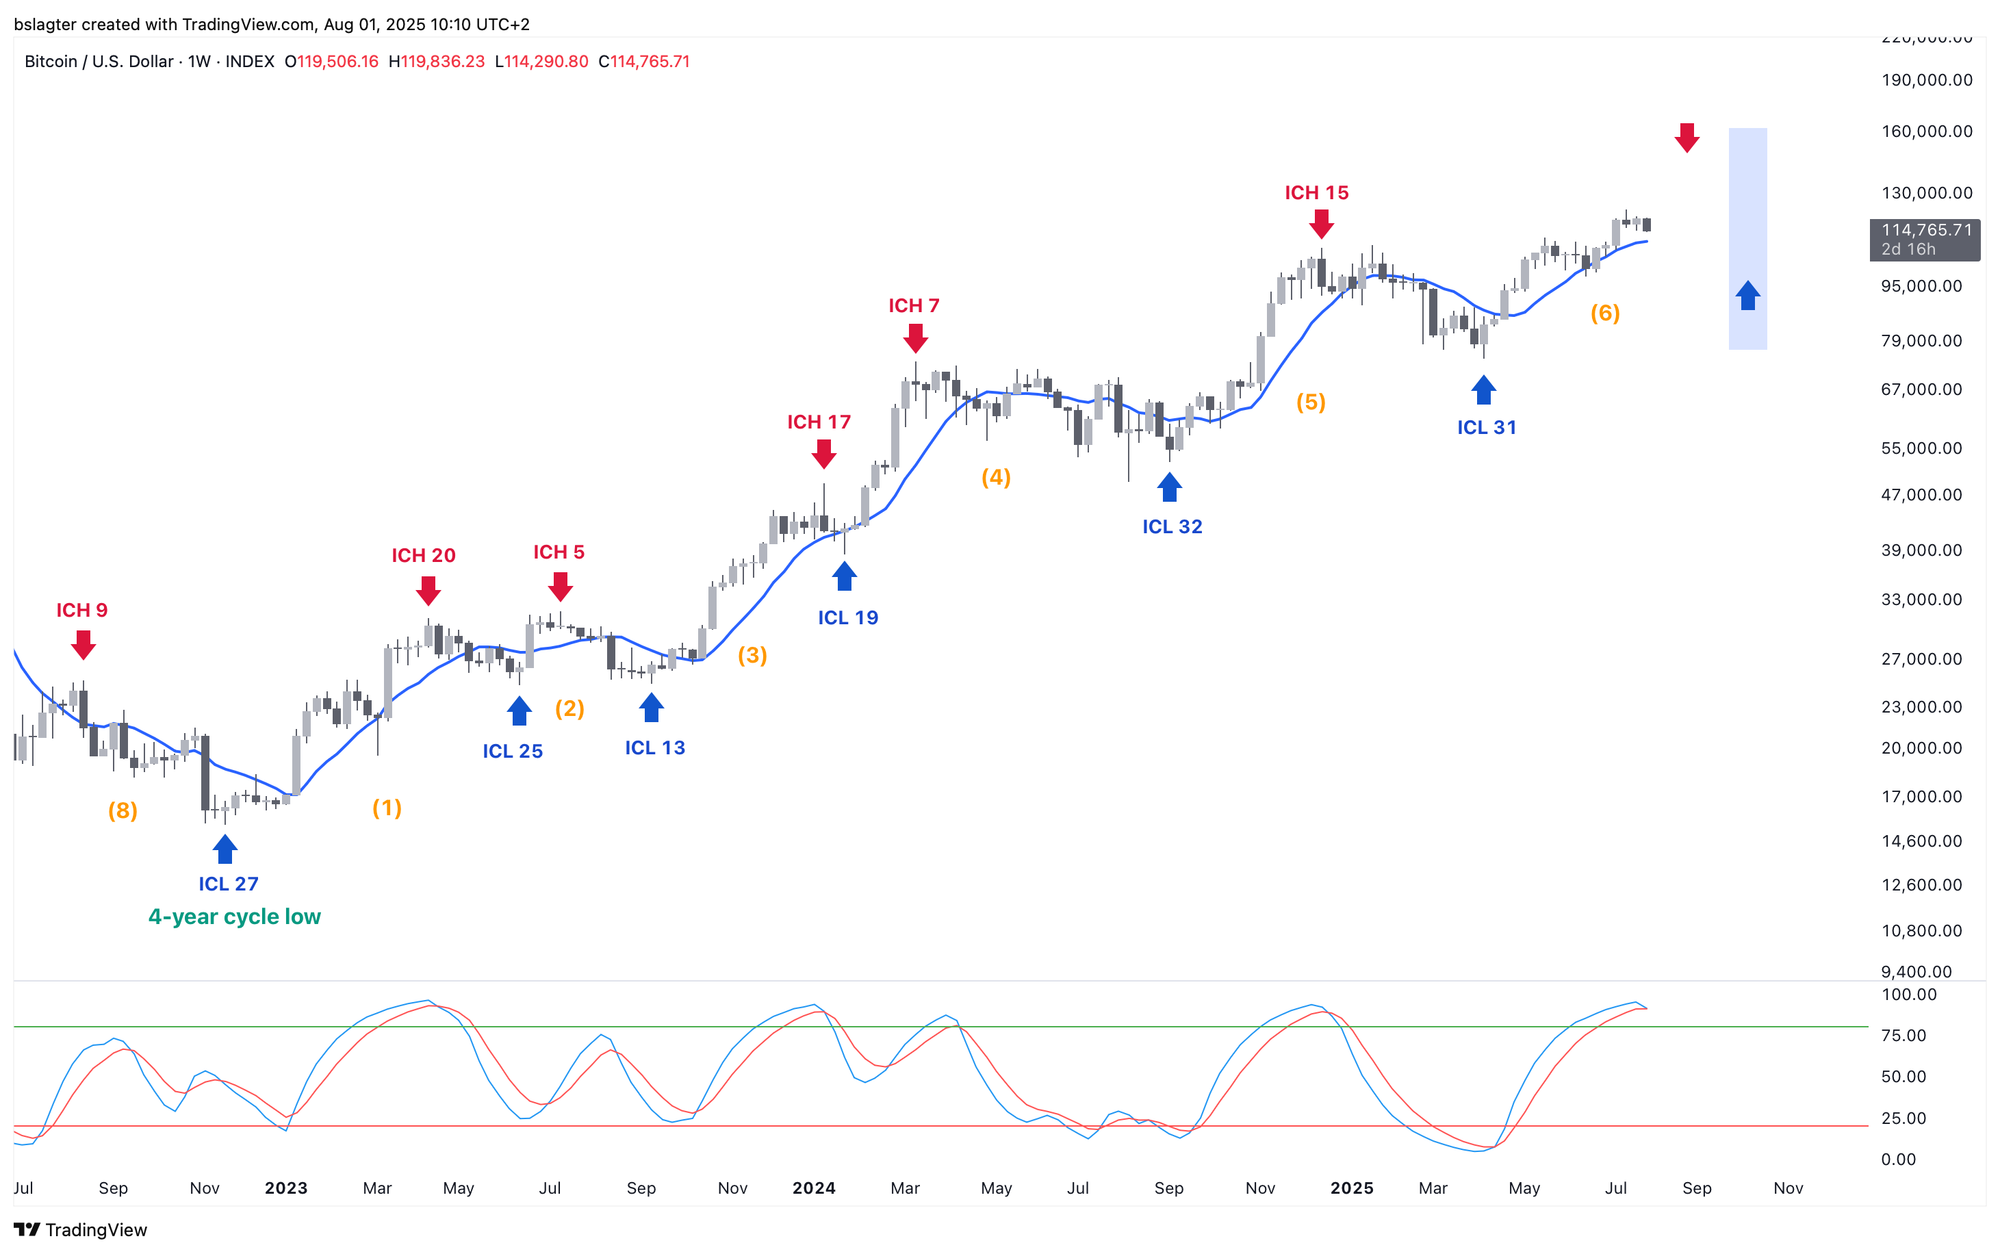
Next week will be week 17 of the current weekly cycle, which is already showing signs of fatigue. While weekly cycles can vary more than daily ones, reaching a weekly cycle high (ICH) beyond week 22 is rare.
Often, the third daily cycle aligns with the final phase of the weekly cycle and typically only sees a brief surge, followed by a prolonged decline toward the weekly cycle low (ICL).
From a cycle analyst’s perspective, last week’s weakness has made the outlook slightly less promising. The earlier price target of 150k to 165k for the weekly cycle peak, derived from previous cycles, now appears a bit less likely.
2️⃣ There’s always something negative to point out
Thom
Macroeconomic analysis often highlights negative data because it's easy to craft a convincing narrative around it. Even though the overall picture is positive—and Q2’s economic growth came in at 3.0% this week—Bloomberg still sees signs that the economy is slowing down.
Despite that robust quarter, Bloomberg points out that the average growth for the first half of 2025 was only 1.25%, a full percentage point lower than the pace seen in 2024.
Because fluctuations in trade and inventories have distorted GDP figures this year, economists are looking at a narrower measure of domestic demand: the so-called “final sales to private domestic purchasers.” This grew by only 1.2% in Q2, the slowest increase since the end of 2022.
This measure reflects how much households and businesses are actually spending domestically, excluding the impacts of:
- Government spending
- Net exports (i.e., trade)
- Inventory changes
In other words, it shows the strength of underlying domestic demand without being skewed by temporary factors like accidental inventory build-ups or one-off trade anomalies.
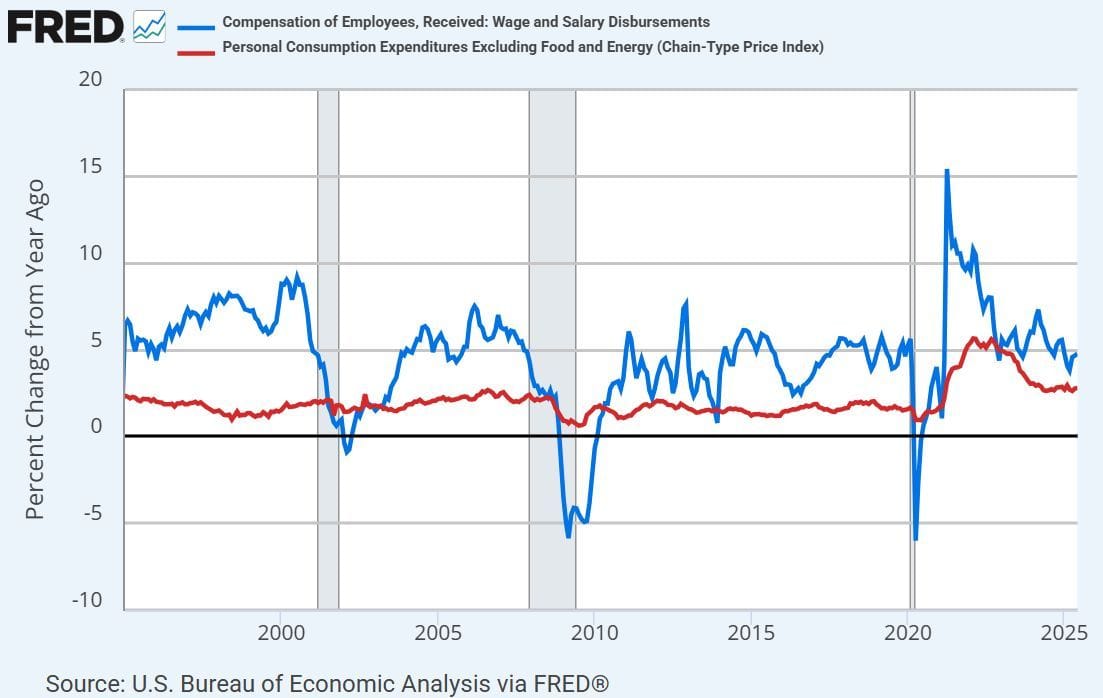
Economist Bob Elliott also foresees potential challenges for American consumers, citing higher inflation (in red) and slowing wage growth (in blue). You can read more about his outlook here.
It’s easy to compile various figures and opinions to paint a more negative picture. While the economy does seem to be growing somewhat slower than in 2023 and 2024, I believe we are still far from facing any serious issues—especially with a president like Donald Trump in the United States, who has made it clear he won’t let a recession define his legacy.
3️⃣ A longer bull run for Bitcoin remains the most likely scenario
Thom
Although Bitcoin is currently struggling to regain upward momentum, the stock market continues to inch higher. Bitcoin’s sluggish price action suggests it’s consolidating for the next upmove, and the overall macroeconomic environment still appears to offer a solid foundation for a prolonged bull run:
- Risk appetite remains high, with investors moving further up the risk spectrum.
- The Trump administration has secured trade deals with Japan and Europe.
- The fiscal boost from the One Big Beautiful Bill is expected to gradually impact the economy.
- The U.S. stock market’s earnings season has been encouraging.
- This week’s economic data does little to detract from the strong U.S. economic outlook.
The overall circumstances appear to set the stage for a parabolic phase within the bull market. Liquidity is abundant—the only missing element is the U.S. central bank stepping on the gas. Given the robust economy and higher-than-expected PCE inflation this week, it makes sense that Chairman Jerome Powell sees little reason to accelerate further.
While Powell is not inclined to heed Trump’s calls for rate cuts, the impact of such measures remains to be seen. Moreover, the market is aware that Powell will be replaced as chairman of the U.S. central bank in May 2026, a change that could usher in a looser, more “Trumpian” monetary policy.
In such a scenario, the flight to assets with inherent scarcity—that is, those the government cannot easily finance—will likely accelerate.
If the U.S. central bank were to cut rates when it isn’t necessary, the bond market might react by reducing demand for long-term government bonds, causing their yields to rise.
The most direct way to counteract this would be for the U.S. central bank to purchase long-term treasuries. In a more extreme scenario, the Trump administration could even mandate that financial institutions allocate a larger portion of their portfolios to long-term government bonds—essentially imposing capital controls.
However, such measures would likely do little to boost confidence in the U.S. dollar. If the U.S. takes this approach, other major economies like the EU and China would probably follow suit—not only to prevent rapid divergence in exchange rates, which could destabilize economies, but also to remain competitive with U.S. economic growth.
In theory, this creates the ideal environment for an asset marked by scarcity, such as Bitcoin.
4️⃣ Low volatility for Bitcoin
Bert
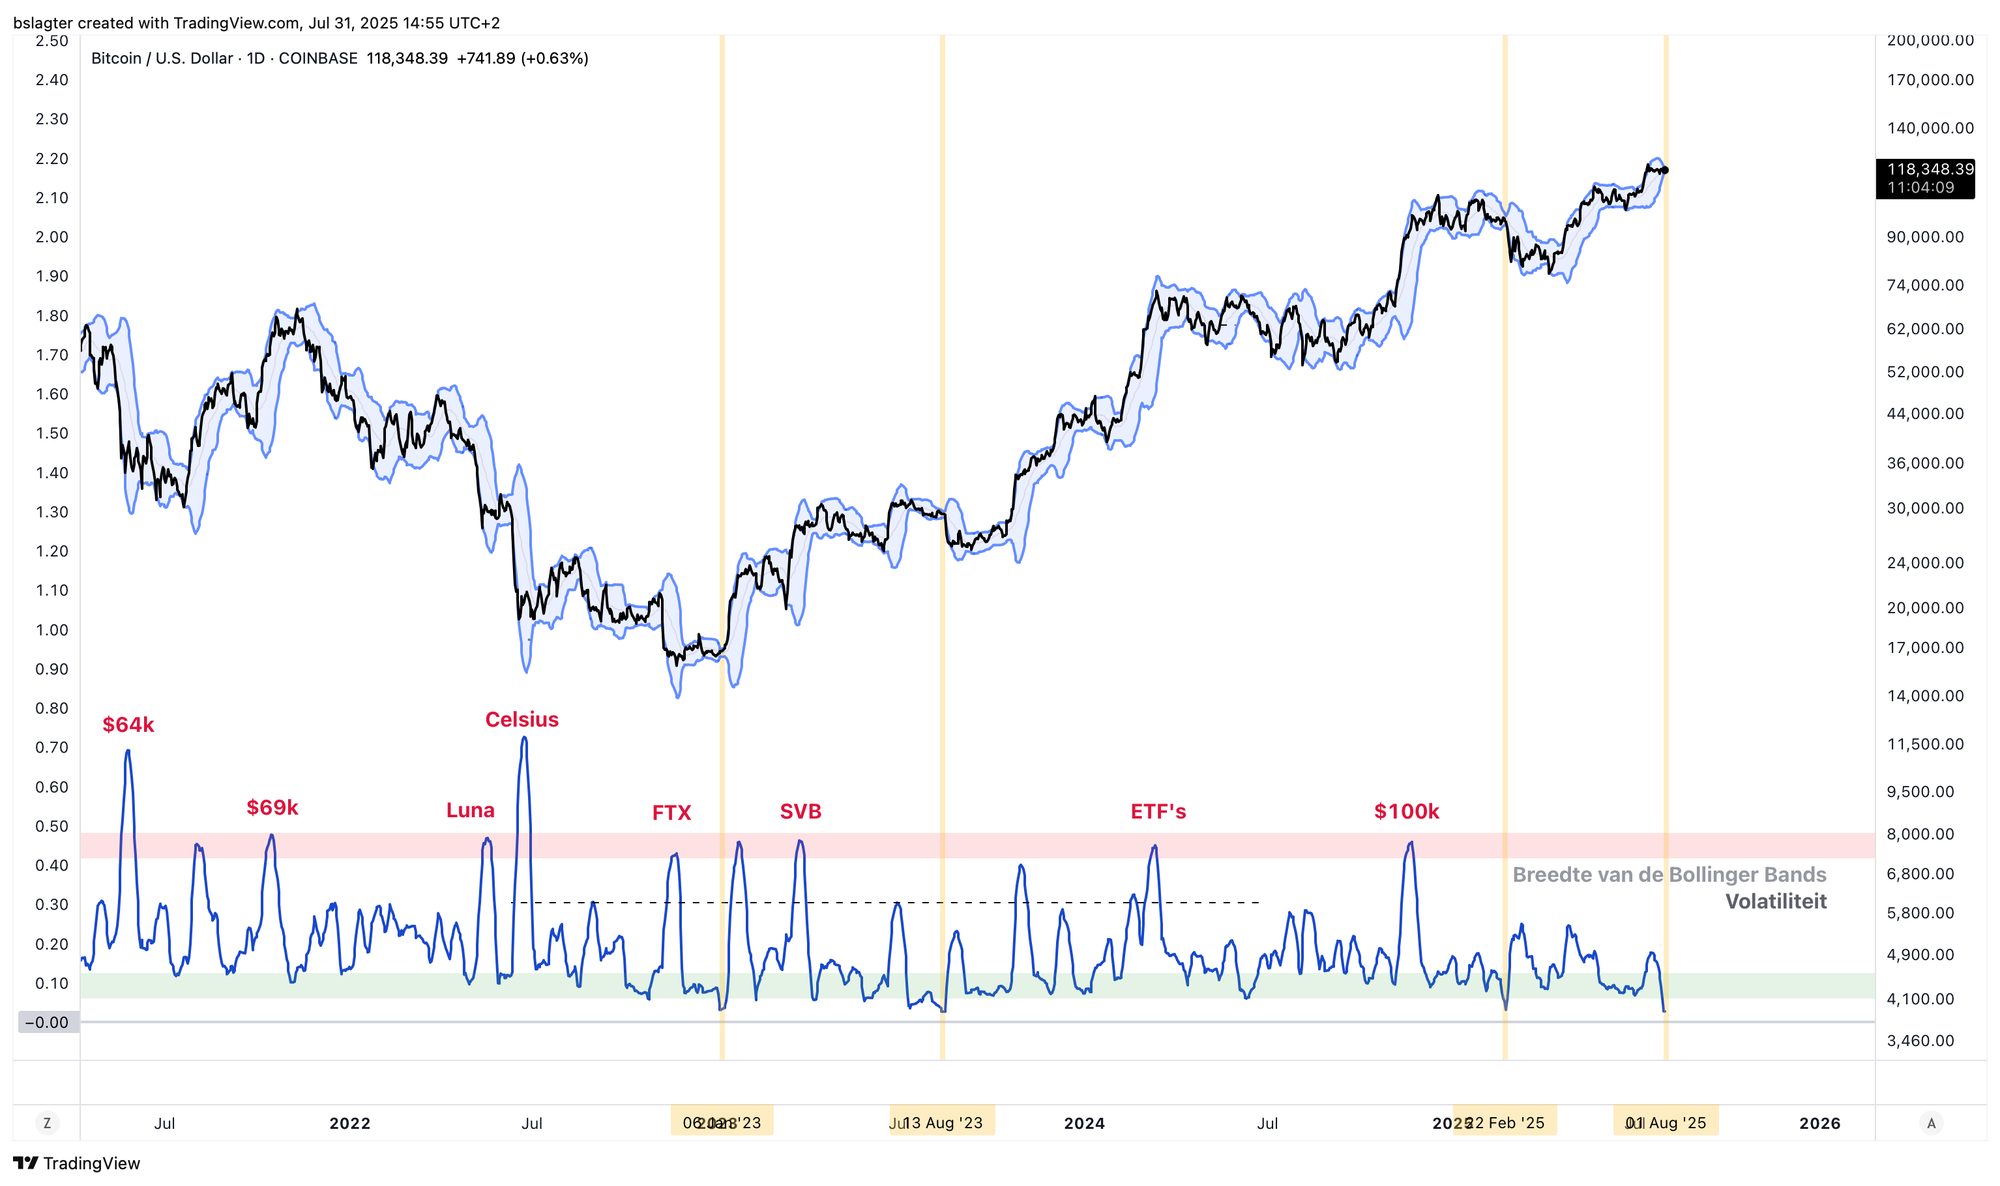
The chart below displays Bollinger Bands drawn around the price, with the band width reflecting market volatility—a narrower band indicates less movement.
The standard setting uses the past 20 days, which coincides with the period of steady sideways movement we’ve recently seen. It’s no surprise, then, that the Bollinger Bands have tightened considerably.
Below the chart, the current width of the Bollinger Bands is shown. Historical periods of similarly low volatility are highlighted in yellow. Although some on social media claim that low volatility always precedes an explosive upward move, that isn’t necessarily the case.
Nonetheless, following an extended period of low volatility, some turbulence is generally expected as traders adjust their positions around a narrow price range. This turbulence could push the price either upward or downward—or even see it move first one way, then the other.
5️⃣ The Accumulation Trend Score
Bert
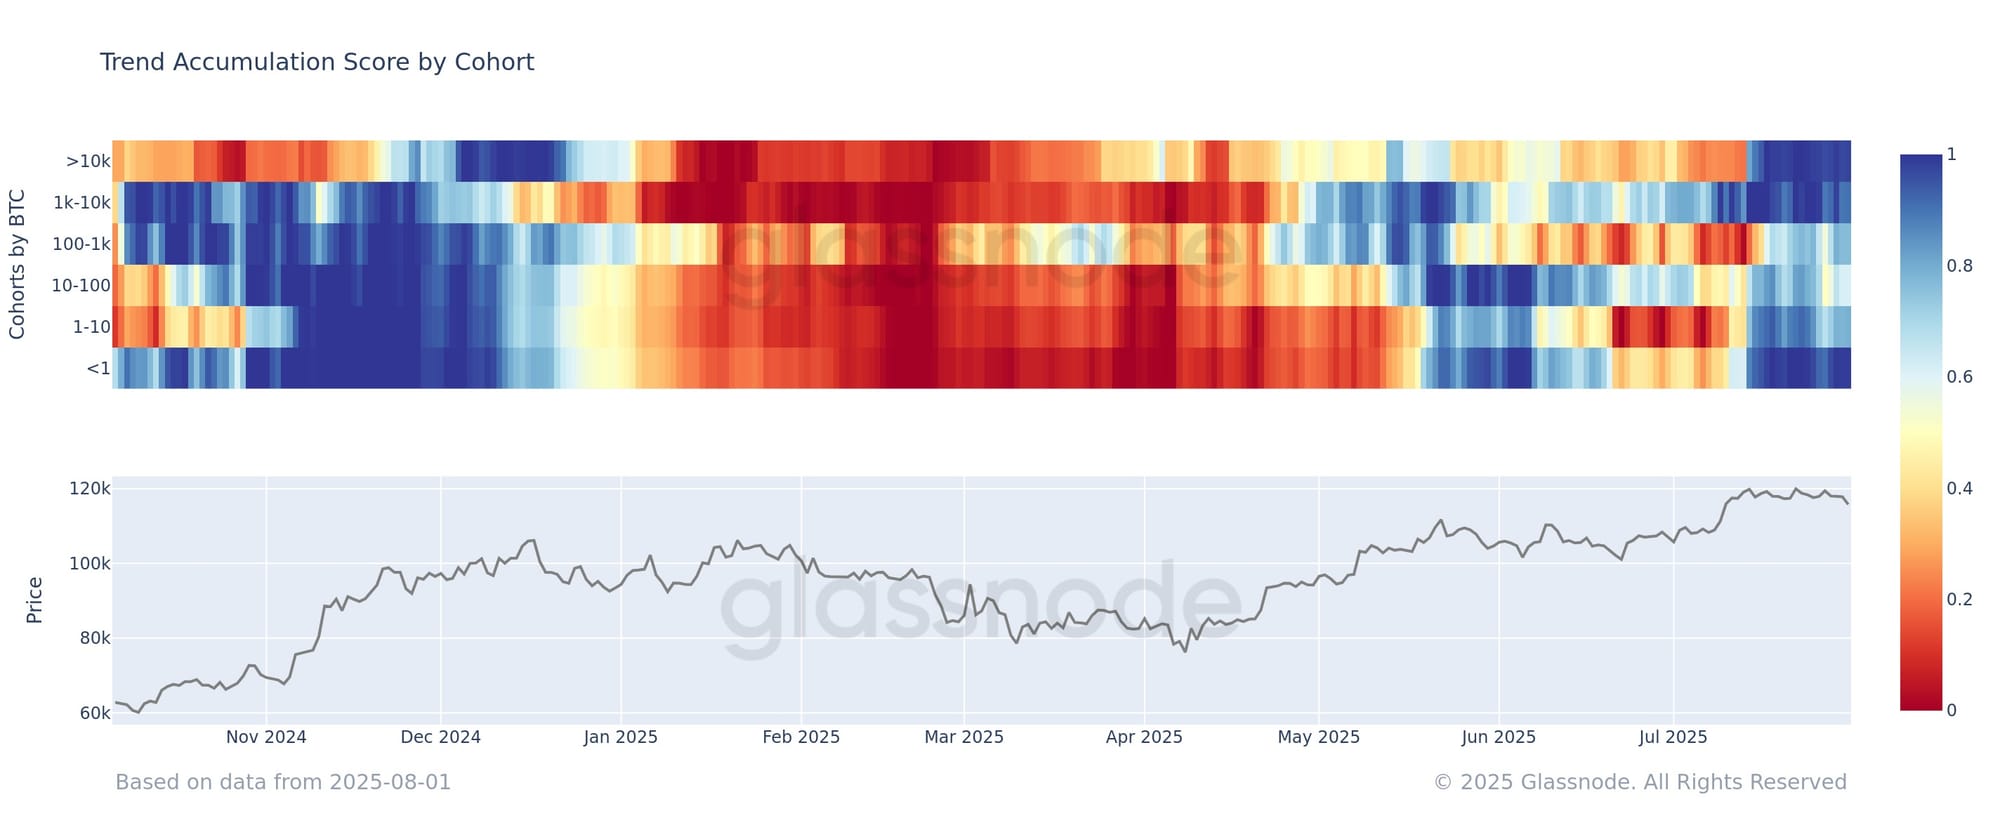
In last Sunday’s YouTube video, I discussed the Accumulation Trend Score along with its well-known blue-red heatmap. You can watch the video here:
With that explanation in mind, let’s examine today’s heatmap. Despite last week’s weakness, all investor cohorts continue to expand their positions.
This suggests that a significant shift in investor behavior is needed before last night’s drop can be seen as the beginning of a prolonged downturn. While we haven’t observed such a change yet, it’s worth noting that the Accumulation Trend Score is trending downward. We’ll be monitoring the situation closely over the coming week!
Thank you for reading!
To stay informed about the latest market developments and insights, you can follow our team members on X:
- Bart Mol (@Bart_Mol)
- Peter Slagter (@pesla)
- Bert Slagter (@bslagter)
- Mike Lelieveld (@mlelieveld)
We appreciate your continued support and look forward to bringing you more comprehensive analysis in our next edition.
Until then!