Trump, Musk and the Daily Cycle Low
Musk and Trump’s Twitter feud sent shockwaves: Tesla shares plunged 15.6% while Bitcoin dipped to $100,300 before rebounding. Is this the elusive daily cycle low, or just a prelude to the next bull run? Dive in for bold insights and market signals!

There are all kinds of X accounts that report events almost in real time, events that could significantly impact the financial markets. They aren’t always accurate, and each has its own biases. Still, it’s both useful and sometimes entertaining to follow them.
One of these is Walter Bloomberg (@DeItaone). Just to clarify, this account is not affiliated with the media and data company Bloomberg, which was founded in the 1980s by Michael Bloomberg, who later became the mayor of New York.
Last night, @DeItaone’s timeline offered an interesting account of the exchange between Musk and Trump:
17:59 - TRUMP ON MUSK: BILL IS INCREDIBLE
17:59 - TRUMP ON MUSK: HE'S UPSET BECAUSE WE TOOK AWAY THE EV MANDATE
18:01 - TRUMP ON MUSK: DON'T KNOW IF WE'LL HAVE A GREAT RELATIONSHIP ANYMORE
18:08 - TRUMP: I'M VERY DISAPPOINTED IN ELON, I HELPED HIM A LOT
18:20 - MUSK: EITHER YOU GET A BIG AND UGLY BILL OR A SLIM AND BEAUTIFUL BILL
18:23 - MUSK FOLLOWING TRUMP CRITICISM: 'WHATEVER'
19:45 - MUSK: THE BIG UGLY BILL WILL INCREASE THE DEFICIT TO $2.5 TRILLION
20:40 - TRUMP SAYS ELON MUSK JUST WENT CRAZY
21:17 - TESLA SHARES FALL 15.6% IN WORST DAY SINCE SEPTEMBER 2020
22:14 - ELON SAYS "YES" TO TWEET SAYING TRUMP SHOULD BE IMPEACHED
22:28 - MUSK: THE TRUMP TARIFFS WILL CAUSE A RECESSION IN 2ND HALF OF THIS YEAR
22:42 - MUSK CALLS FOR TRUMP'S IMPEACHMENT: AXIOS
22:49 - STEVE BANNON CALLS FOR ELON MUSK TO BE DEPORTED: NYT
It’s not surprising that Tesla’s stock took a significant hit. Bitcoin also dropped considerably throughout the evening—we hit an initial low of $100,300 around 11:00 pm, and since then, the price has recovered to $103,700.
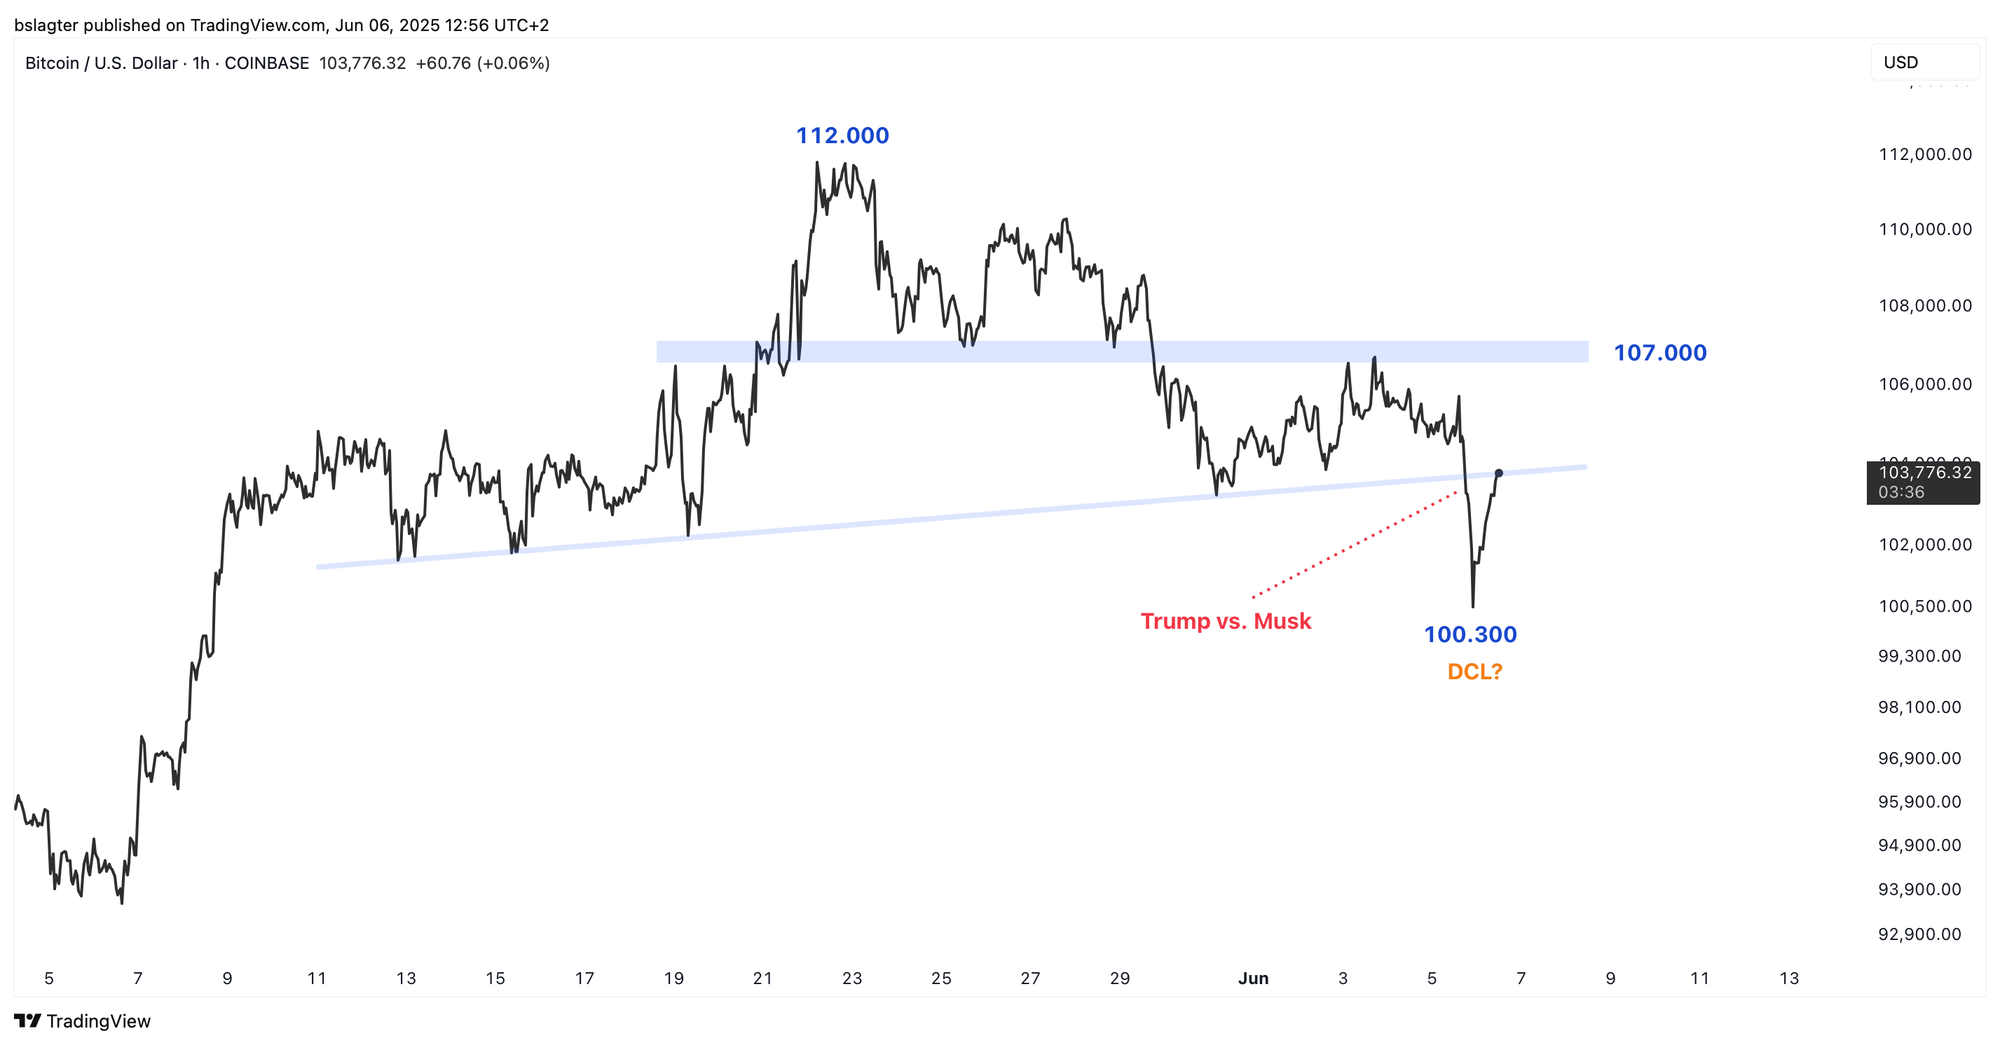
In last week’s Alpha Markets, we discussed the approach toward the daily cycle low (DCL) for this cycle:
In our view, that’s a strong signal to first look for a DCL before this weekly cycle’s rally continues.
We’re currently at a [correction of] 7%. It could still dip a bit further. The zone between $98,000 and $102,000 is a logical area for a bottom. In the graph below, we’ve marked it with a blue rectangle. The 50-day moving average also runs through this area.
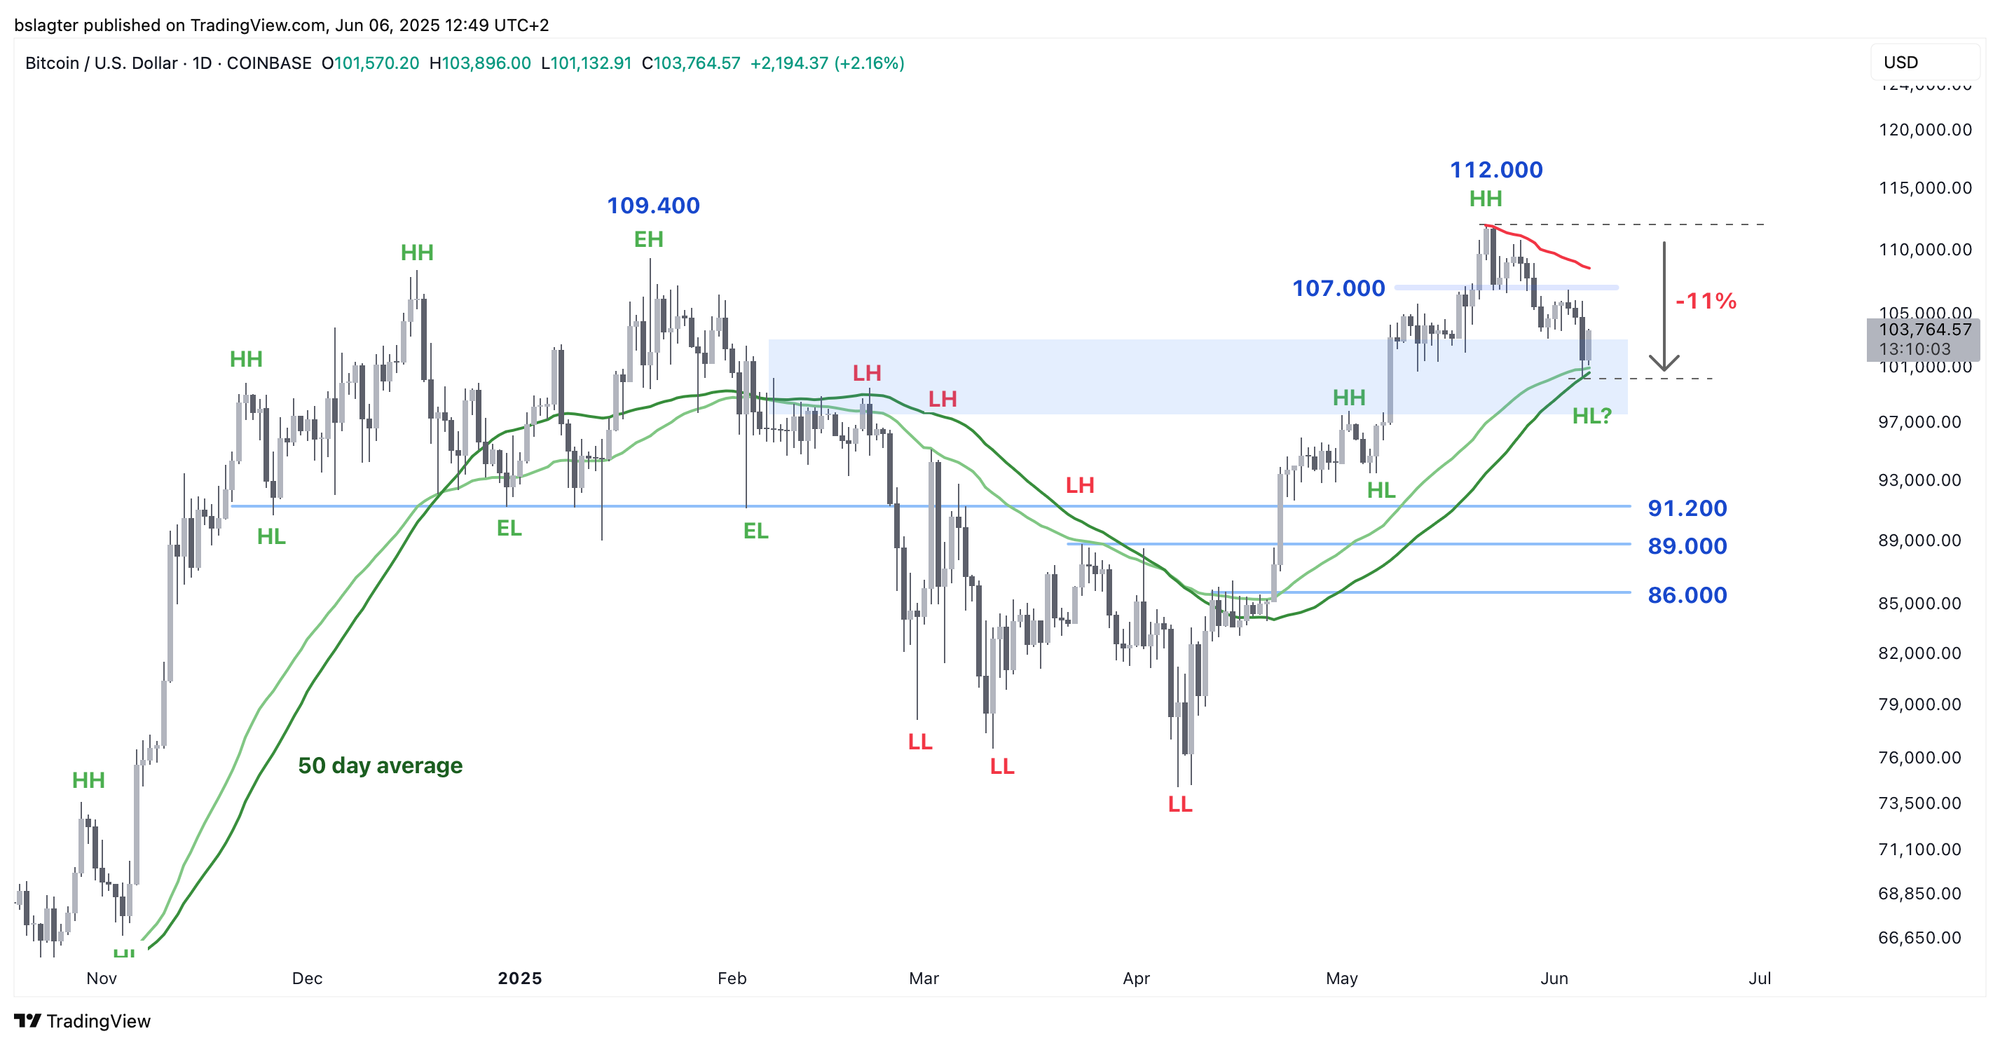
Last night’s $100,300 is exactly in the zone we were targeting, and it coincides with the 50-day moving average. This marks an 11% correction from the May 22 peak of $112,000 – more than enough for a DCL. But have we really seen the bottom?
A bottom is more of a process than a single moment. Sure, you can later pinpoint the exact time the lowest price was recorded, but at that moment, it might not have been obvious. As more data comes in over time, you become increasingly certain that it truly was the bottom.
At this point, there isn’t enough evidence to confirm we’ve reached the lowest point. In the chart below, we’ve added a question mark next to “HL” (higher low).
Does the price break out of the downtrend – for example, by exceeding a trendline or a VWAP from the peak (red line)? If the price climbs above $107,000, the odds will significantly improve.
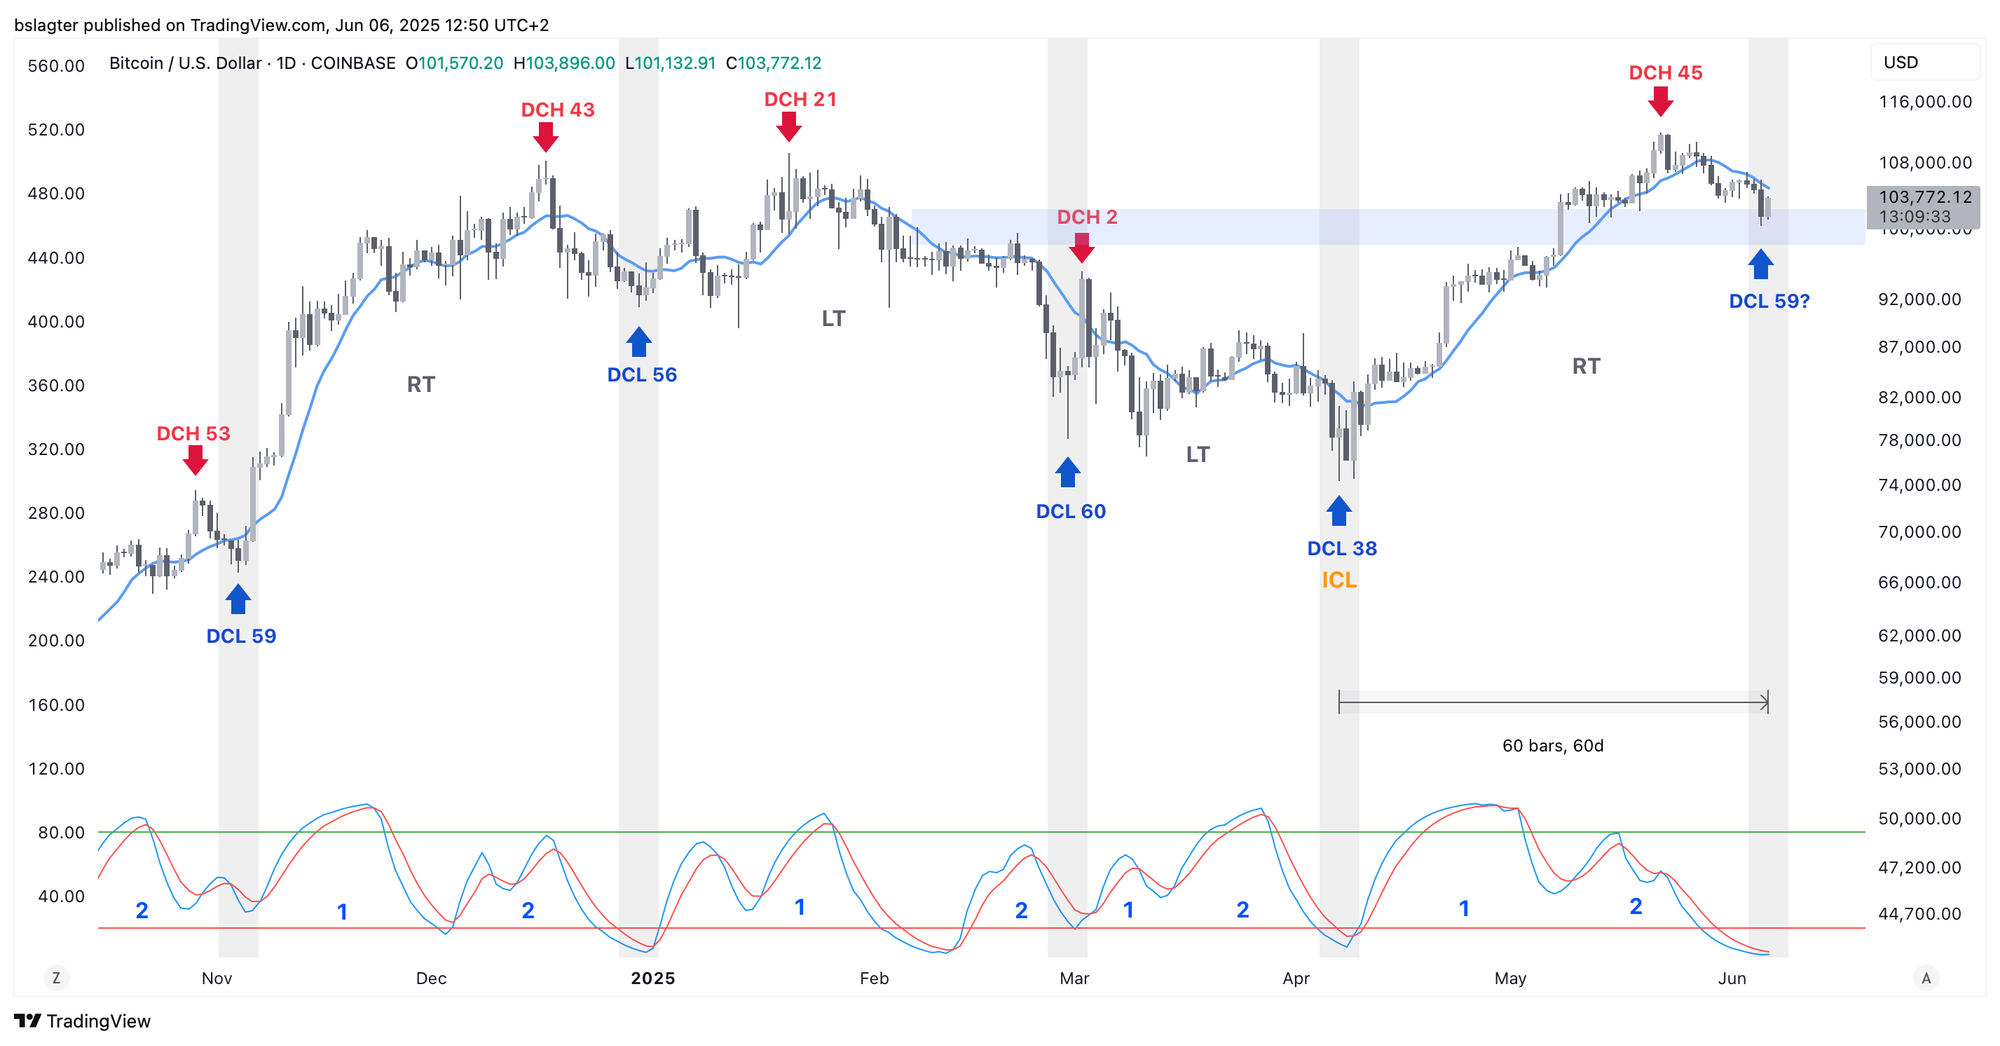
Cycle analysts don’t focus on absolute prices; they look at relative prices and trends. For instance, is the current price higher or lower than a previous peak? Are we below or above a certain average?
For the journey from before to after a daily cycle low, you might observe the following sequence:
✅ A daily close below the 10-day moving average
✅ A daily close below an upward trendline
✅ The 10-day moving average shifts from rising to falling
✅ A momentum indicator dips into oversold territory
➡️ (This is where the DCL occurs)
➡️ A daily close above the 10-day moving average
➡️ A daily close above a downward trendline
➡️ The 10-day moving average shifts from falling to rising
➡️ A daily close above the previous swing high (currently at $109,000)
We haven’t yet seen any of the events that normally follow the DCL. The 10-day moving average is currently at $104,900, which marks an initial milestone.
If this indeed was the DCL, it would be a tremendous boon for the bulls. We’d then be entering the second daily cycle of this weekly cycle with an excellent starting point – and historically, that phase tends to be quite bullish.
We continue with the following topics for our Alpha Plus members:
- From 60/40 to 60/20/20: The New Way of Investing
- Where's the Recession?
- Bitcoin Price Since the Last Bull Market Peak
1️⃣ From 60/40 to 60/20/20: The New Way of Investing
Thom
For the average investor, this might sound like magic, but in the world of big money, portfolio construction has become an exact science. Investors not only focus on expected returns but also carefully assess the associated risks. The really wealthy aren’t chasing extra buying power – they primarily aim to protect their wealth.
Jurrien Timmer, head of macro analysis at Fidelity, works in this arena. He speaks the language of these investors and is a fan of bitcoin.
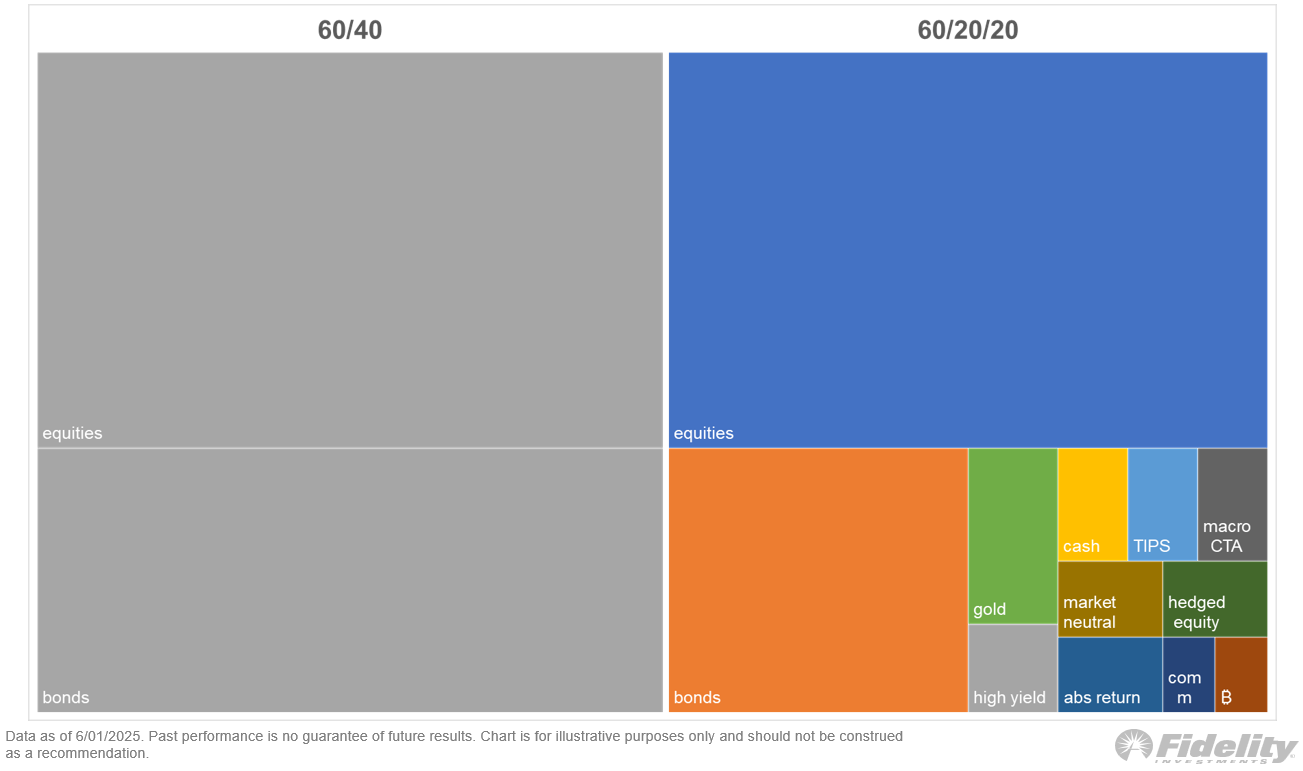
For asset managers, the 60/40 portfolio has been considered the gold standard for decades. This strategy allocates 60% to stocks – the growth engine – and 40% to bonds, which act as a defensive cushion providing stability.
Timmer envisions a scenario where the 60/40 model is abandoned. In particular, bonds (the 40% component) could become problematic in a new market reality – and that’s where bitcoin might eventually play a role, among other things.
What does he foresee?
- Deglobalization (trade war): supply chains become more localized, reducing competition, lowering efficiency, leading to higher inflation, rising interest rates, and ultimately, lower stock valuations.
- Secular mean reversion: a prolonged return to historical averages for the U.S. market, which could see both stocks and bonds retreat to lower valuations.
- Fiscal dominance: government spending overwhelms monetary policy, making it harder for central banks to tighten (due to unsustainable interest burdens and political pressure), thereby raising inflation expectations.
- Less beta: if markets don’t experience broad gains (less tailwind), simply “following the market” yields less.
- More alpha required: investors must actively seek opportunities (through stock picking, strategic niches, etc.) to achieve above-average returns.
In short, U.S. stocks and bonds face pressure from deglobalization and high government spending (fiscal dominance). This creates an environment with less beta (market-driven gains), which in turn makes generating alpha (identifying opportunities) even more critical.
In such a regime, it’s vital to produce alpha that isn’t correlated with the core components of the portfolio. “We are therefore looking for investments with a high Sharpe ratio and low correlation with both core components,” says Timmer.
High Sharpe Ratio
An asset with a high Sharpe ratio delivers relatively high returns for each unit of risk. The formula is (return - risk-free rate) / volatility. In short, a high Sharpe ratio means you’re well compensated for the risk you take.
Low Correlation with Core Components
By combining assets that move independently, you reduce overall portfolio volatility. If one asset falls, another might remain stable or even rise, resulting in:
- Better diversified risk;
- More stable returns;
- A higher overall Sharpe ratio for the portfolio.
The good news is that bitcoin meets these criteria very well, making it an attractive option for investors with this mindset.
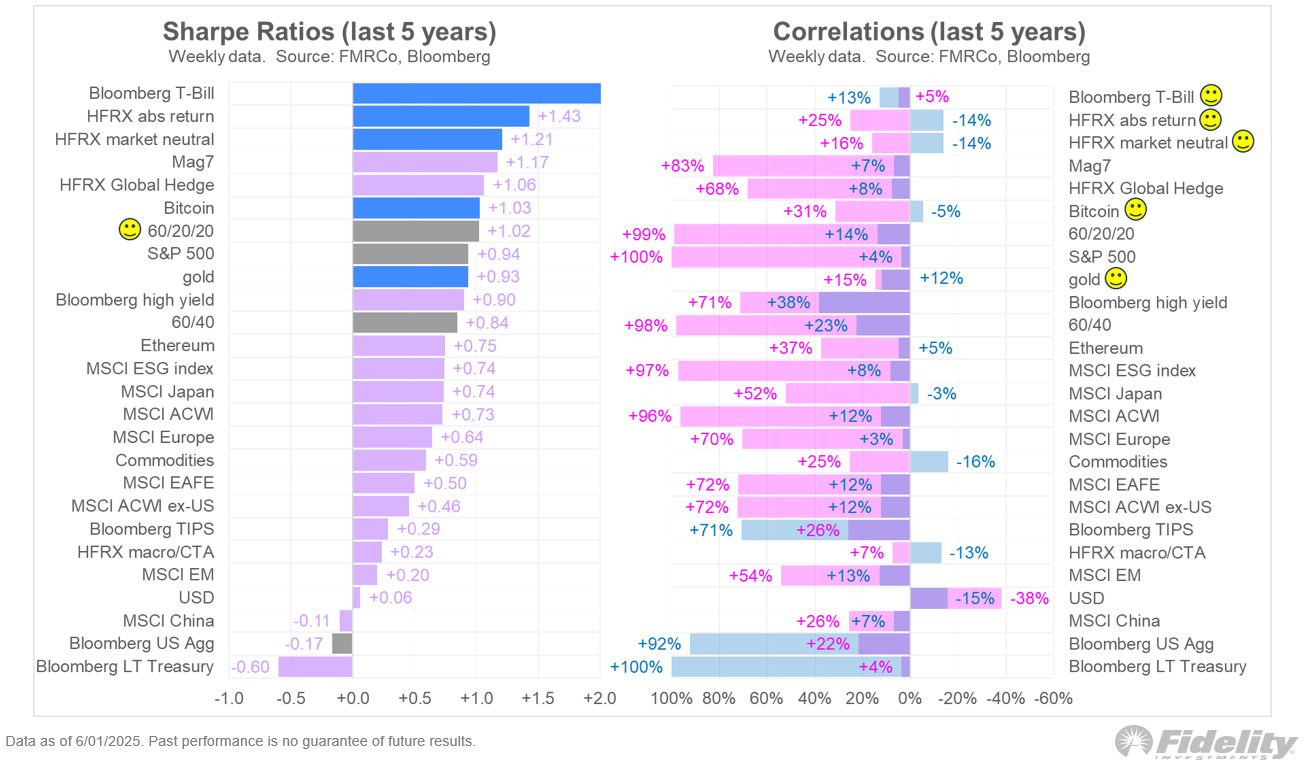
For example, Timmer outlines the portfolio below, where bitcoin plays a modest role—a setup that would have been unthinkable just a few years ago.
2️⃣ Where's the Recession?
Thom
Many people strongly dislike Donald Trump, and over recent months, that sentiment has influenced the financial markets. His trade war was widely predicted to eventually trigger a global recession.
Although Trump has only been in office for a few months, the market’s emotional reaction had already set in—triggering sell-offs. We saw the absolute low after “Liberation Day,” when panic briefly surged.
Now, nearly two months later, bitcoin has reached a new all-time high while the S&P 500 and Nasdaq 100 remain a few percent below their records. Meanwhile, robust economic data has been indicating for weeks that a recession is not the most likely scenario.
This week was no different. The number of job vacancies in the United States came in higher than expected, and even chipmakers are starting to perform well in the stock market again. Enthusiasm for artificial intelligence is growing – or rather, the recognition of its strategic importance for both the US and China is rising rapidly.
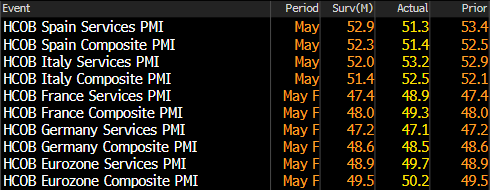
Additionally, the PMIs for the Eurozone were strong. Even a weakened Europe isn’t currently sending any alarming signals.
For now, a global recession does not seem imminent. At the same time, I’d be surprised if bitcoin and other risk assets kick off a sustained bull market right now, as significant risks still loom over the market.
- Trade War: While the initial recession fears may have been exaggerated, uncertainty still lingers. Trump remains unpredictable, although midterm elections and the AI arms race with China suggest that the US cannot afford a recession.
- Rising long-term rates: Globally, long-term rates are on the rise. This makes bonds more attractive compared to bitcoin and stocks, and these higher rates also slow down economic growth.
Overall, my main view remains that we will see a new bull market, in which bitcoin will hopefully surge to at least $150,000.
3️⃣ Bitcoin Price Since the Last Bull Market Peak
Bert
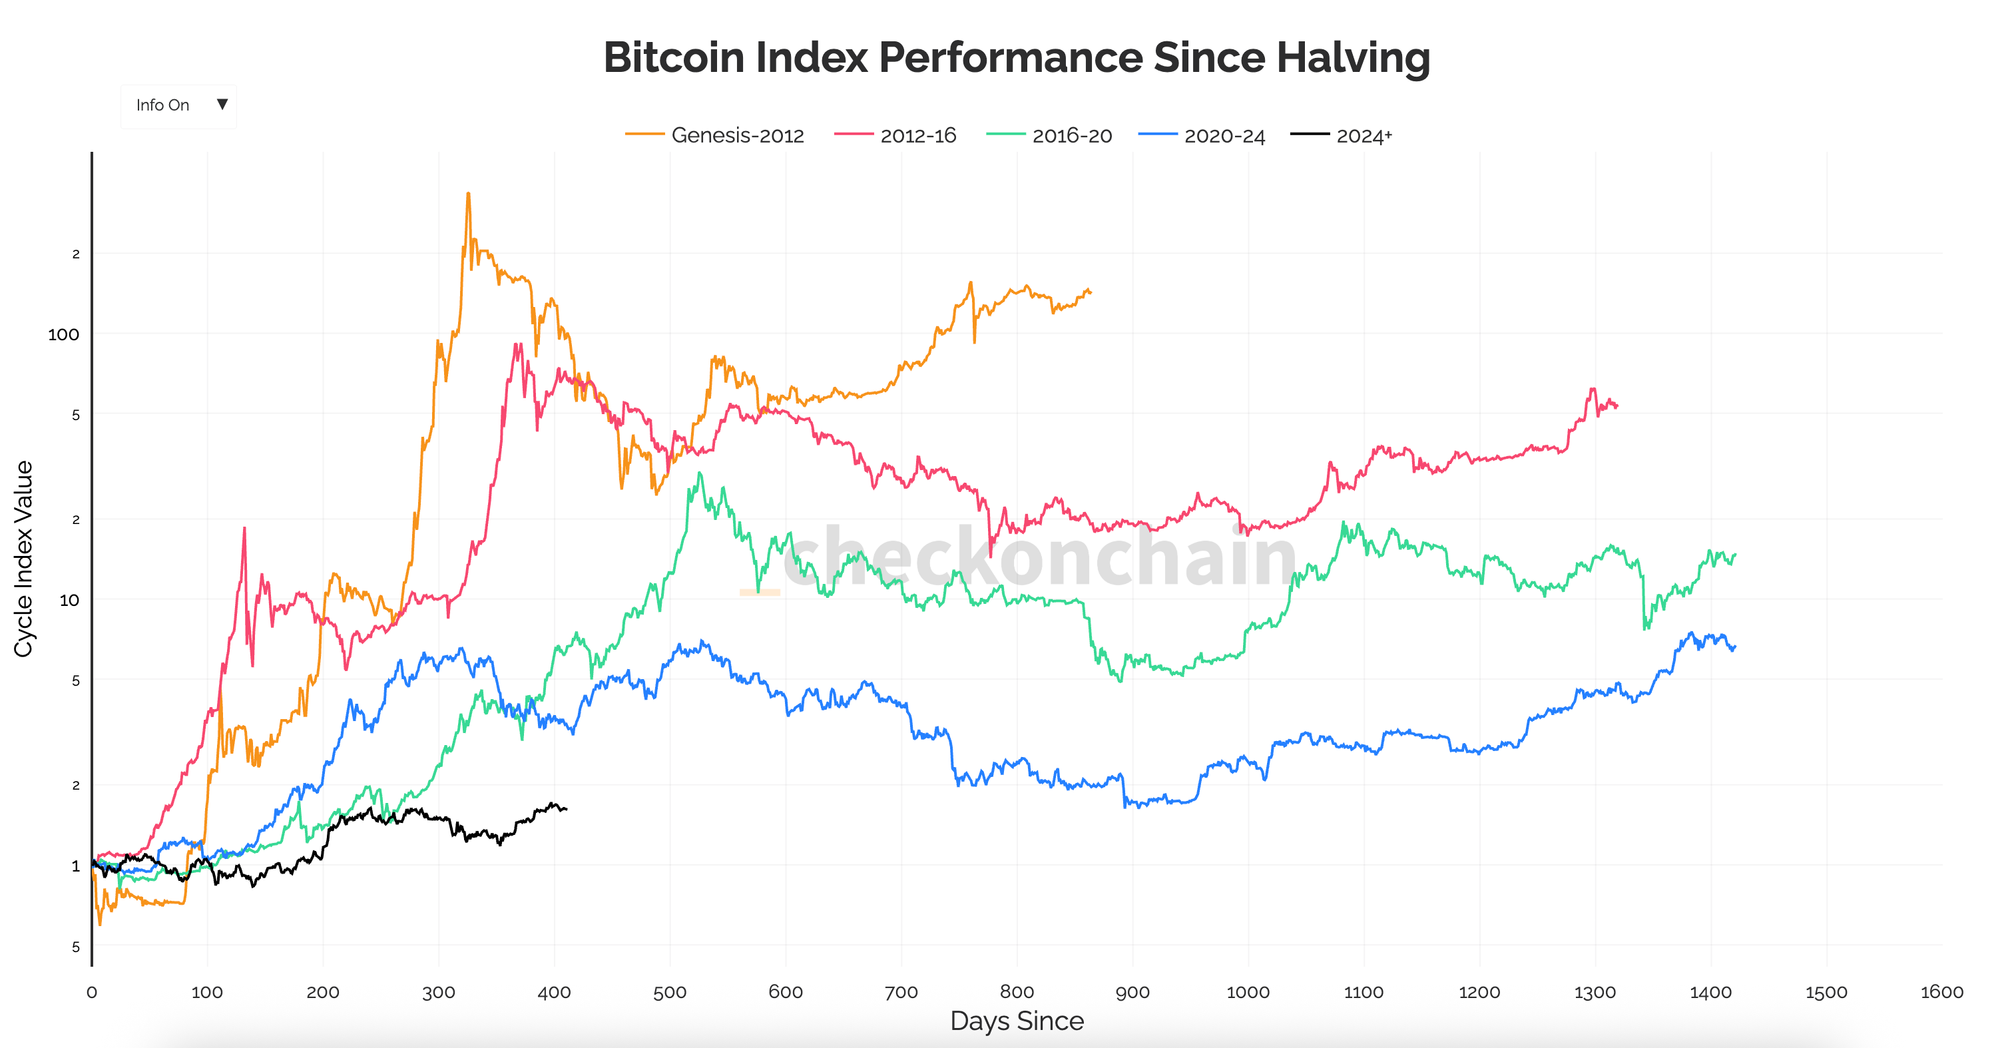
We often see comparisons of bitcoin bull markets by overlaying charts, whether aligning the bottoms or the halving events.
In both cases, each new line ends up lower than those from previous cycles. For example, check out the performance of bitcoin since the halving. From top to bottom, you can observe that each new cycle has delivered lower returns than the previous one.
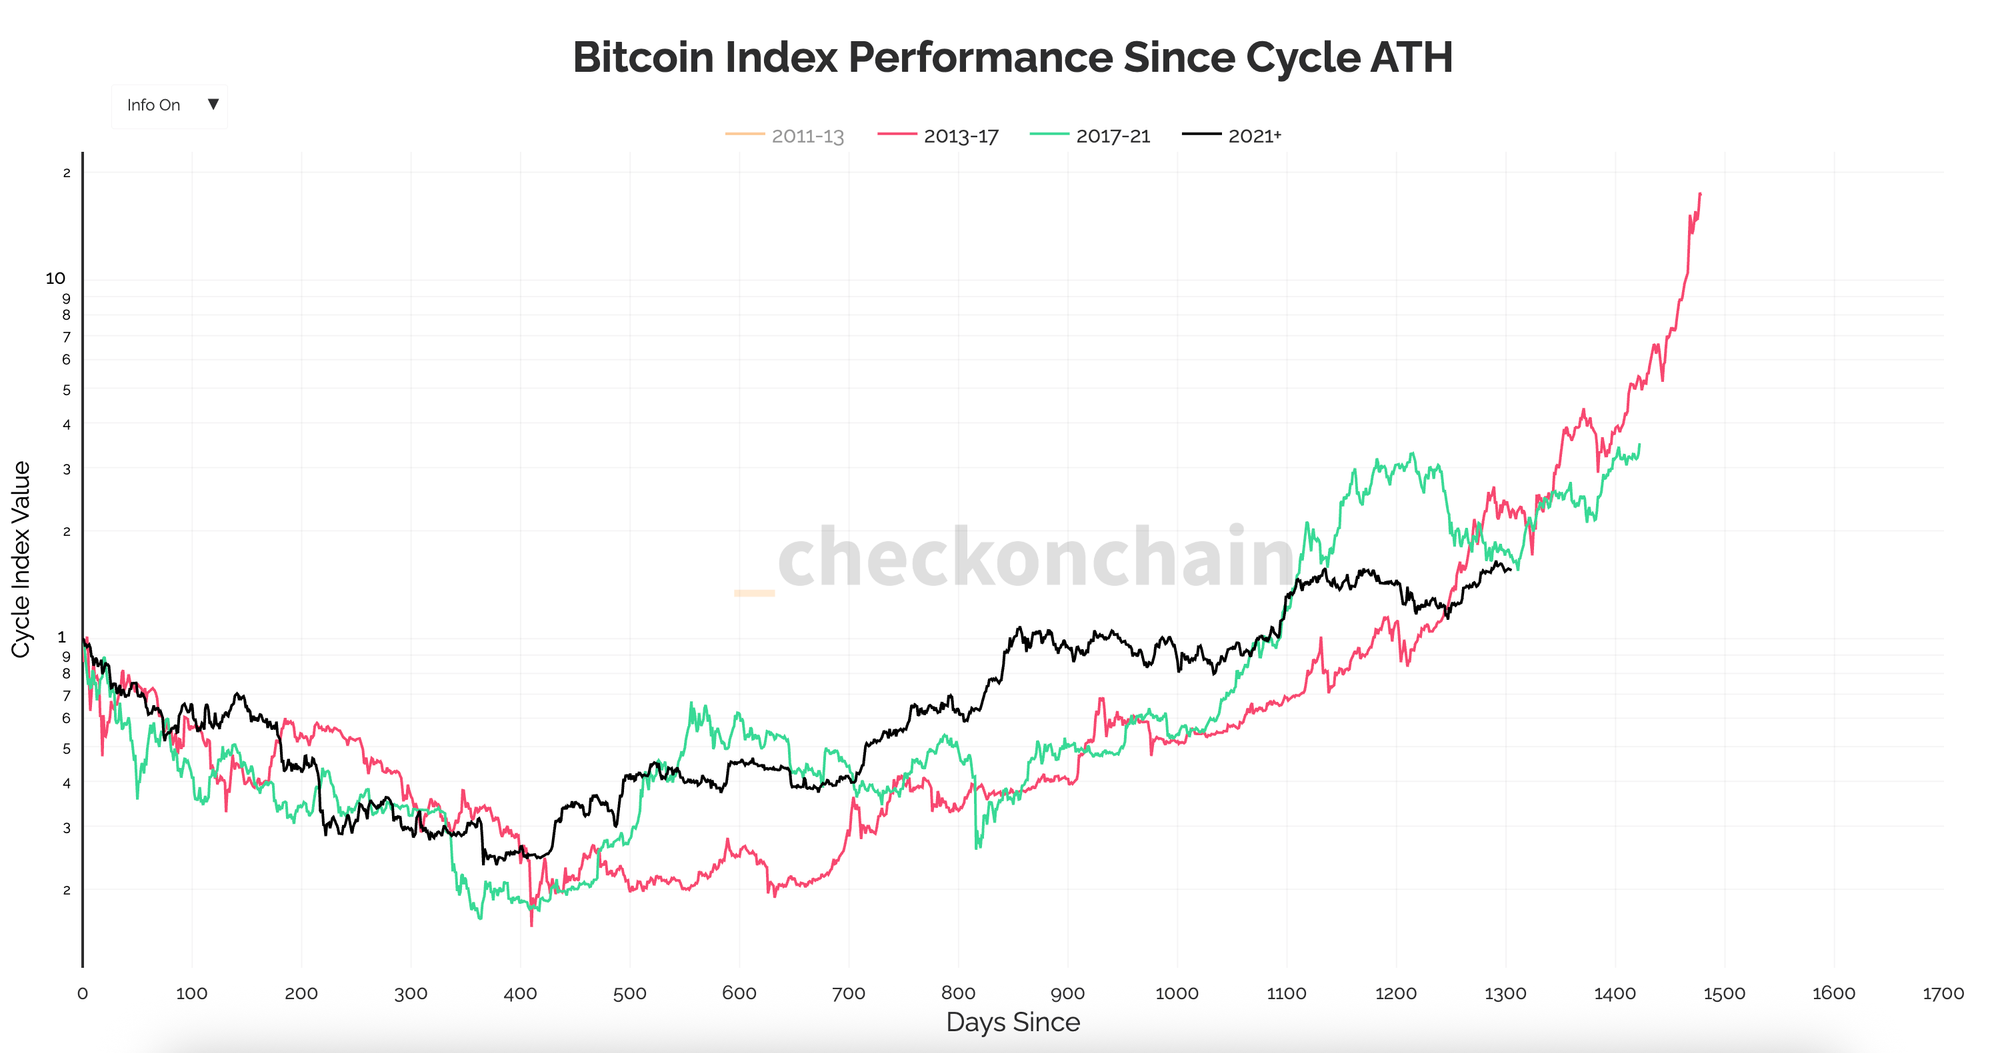
You can also overlay the peaks on top of each other. Interestingly, the performance depends not only on the rise from the bottom but also on the fall from the top. After all, if you don’t lose anything, there’s nothing to recover.
This reveals a different picture. When measured from the previous bull market’s peak, this bull market is quite similar to the two before it. The rise from the bottom has been much smaller, but the drop from the top was also considerably less.
For this similarity to continue, a period of strong gains must follow. The trajectory of the previous two bull markets (2017 and 2021) roughly doubled every 100 days.
If we see a peak in 100 days – say, on September 14 – that would represent another doubling to around $200,000. If this bull market stretches to 200 days, concluding on December 23, that would amount to two doublings, roughly $400,000.
This is by no means a prediction or a target price; it’s simply the outcome if this bull market follows the same pattern as the previous two.
Thank you for reading!
To stay informed about the latest market developments and insights, you can follow our team members on X:
- Bart Mol (@Bart_Mol)
- Peter Slagter (@pesla)
- Bert Slagter (@bslagter)
- Mike Lelieveld (@mlelieveld)
We appreciate your continued support and look forward to bringing you more comprehensive analysis in our next edition.
Until then!