
The Dividing Line Between Bear and Bull
The price climbed this week to its highest level since early May—just below the $83,000 needed for a 'higher high.' Acceptance above that would be meaningful!

This past Tuesday, bitcoin closed out a month constructively for the first time in this bear market.
In August, the price climbed 25 percent from $62,800 to $78,600. A nice mirror image of June, when the price dropped 20 percent. After all, following a 20 percent decline you need a 25 percent rise to get back to the starting point: 100 * 0.8 * 1.25 = 100.
It's the highest monthly close in seven months—only January was marginally higher. In previous market cycles, that consistently meant the bear market bottom was behind us. The same goes for the RSI climbing from below 50 to above 50 on the monthly chart.
All constructive, but not yet fully bullish. For that, we want to see two more levels cleared on the monthly chart: the May 2026 top at $82,800 and the 12-month moving average at $80,400.
If July does indeed turn out to be the bear market bottom, it'll make for a stunning monthly chart. The zone around $60,000 would then catch the bull market tops of 2021, the summer 2024 consolidation, and the 2026 bear market bottom. A beautiful sequence of resistance, breakout, and test as support. A solid launchpad for a bull market!
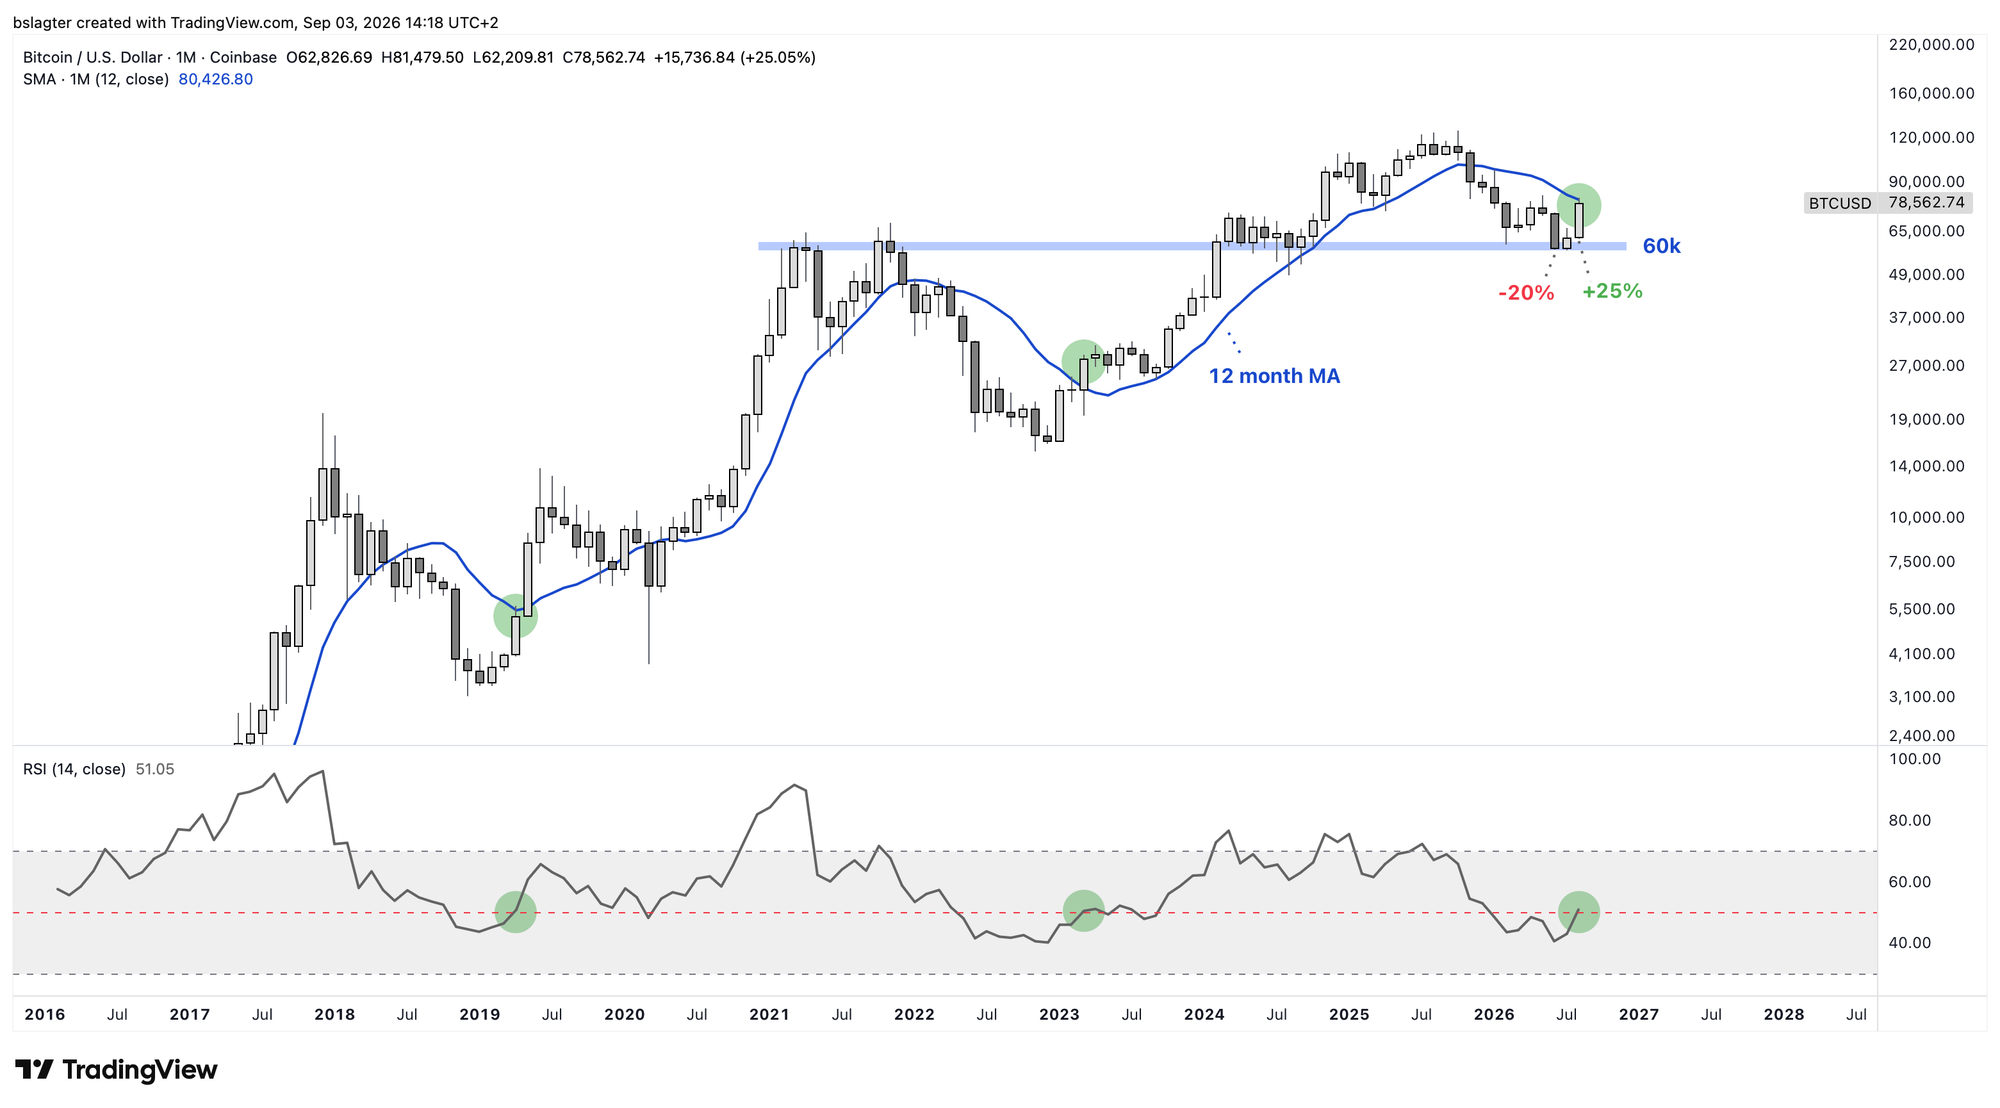
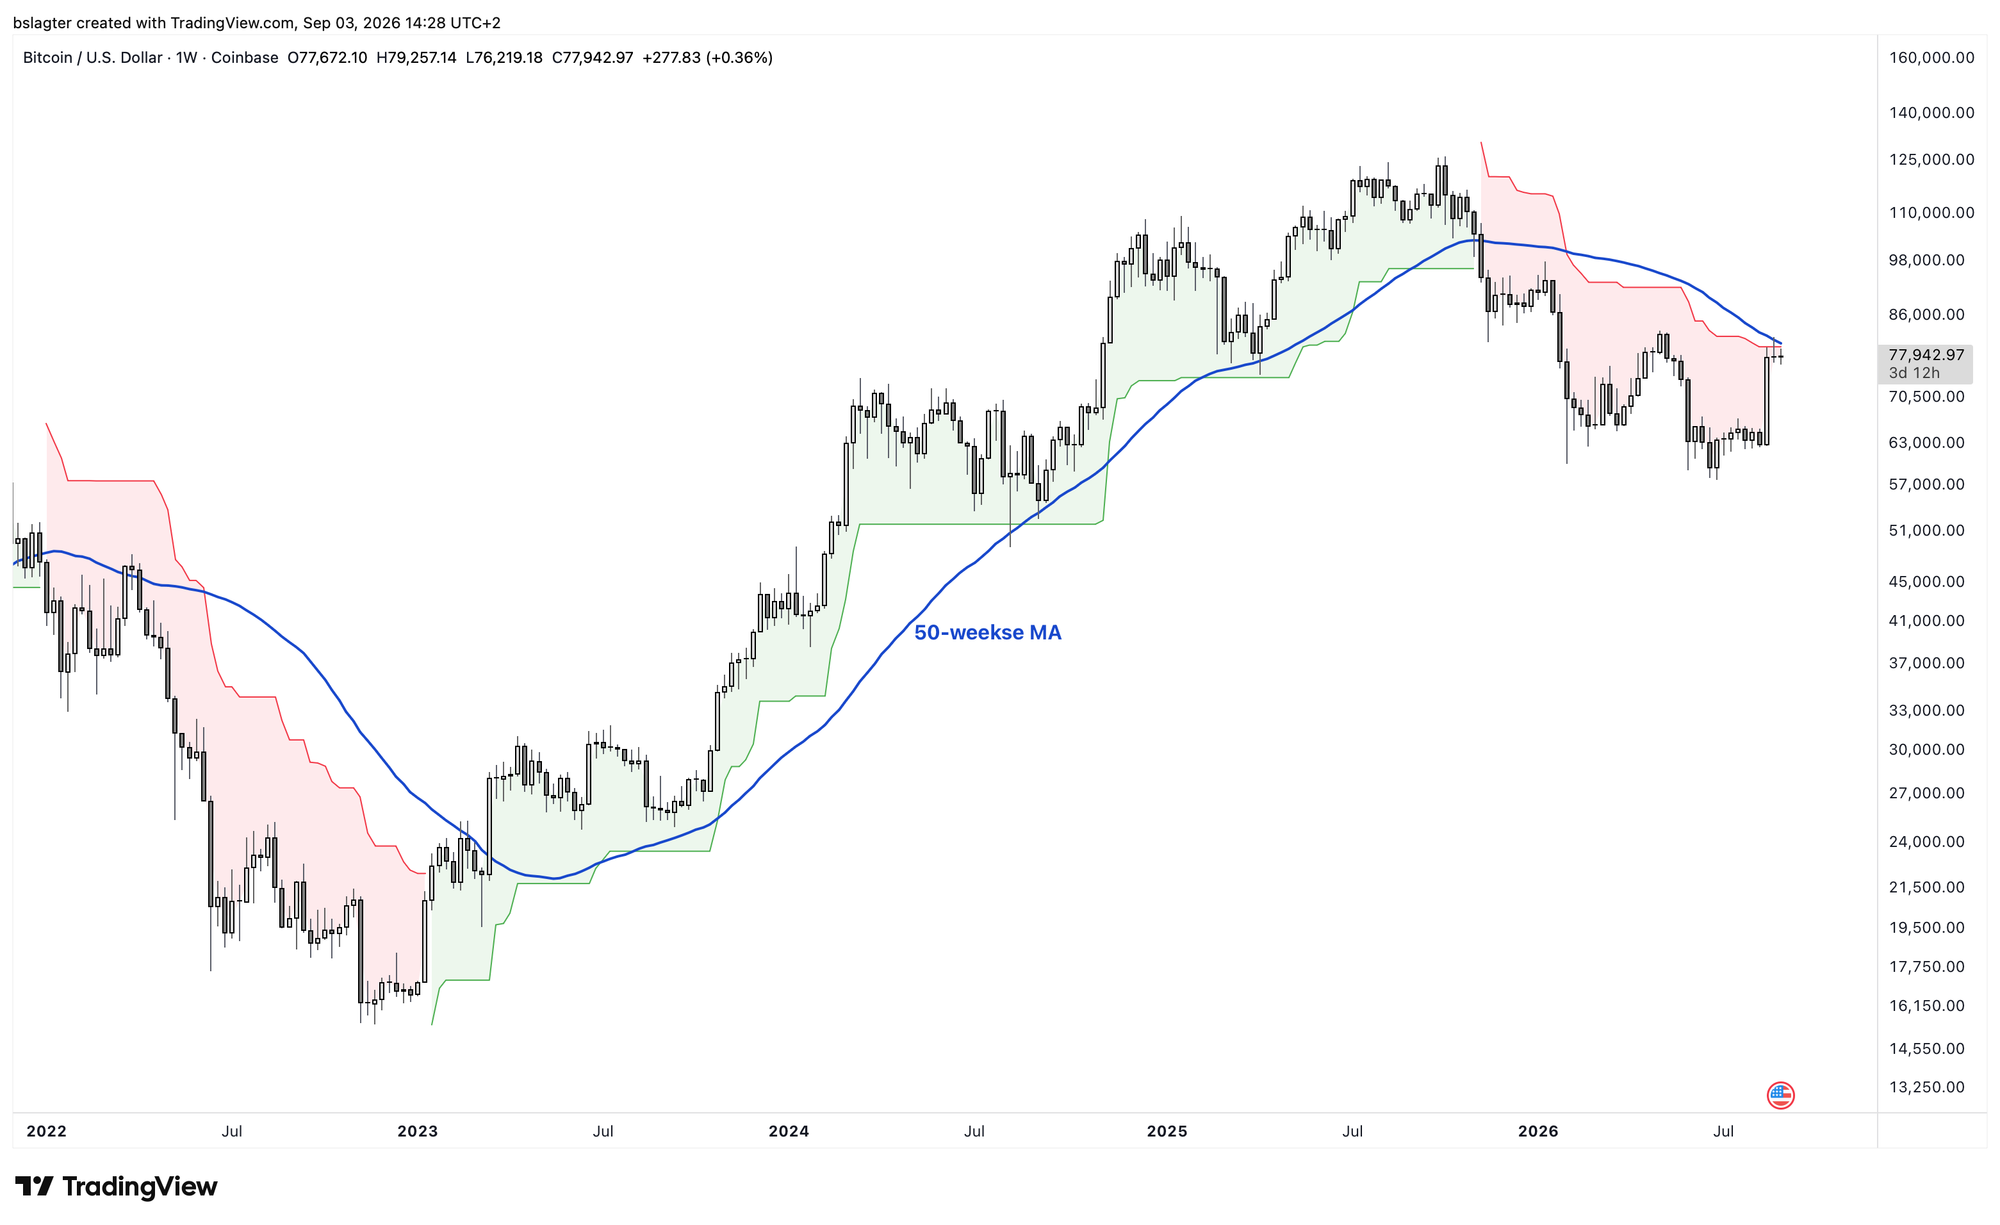
On the monthly chart, the dividing line sits around $80–83k. Those kinds of numbers pop up in practically every analysis. Take the weekly chart, for example, with the 50-week moving average and the Supertrend indicator on it:
- The Supertrend flips from red to green on a weekly close above $79,600.
- The 50-week moving average gives a signal on a weekly close above $80,400.
But I also want to let two other analysts weigh in on why they see this zone as decisive.
Checkmate wrote this in his newsletter:
We have net capital inflows returning to the Realised Cap, and above $82.5k we will confirm a new technical uptrend. MVRV Momentum will flip bullish on a close above $80k, and realised profit (capital inflows) is already back to dominant over realised losses. This is all a tail-wind for sentiment.
Bitcoin Vector wrote this on X:
Why is $80K–$82.5K the key pivot?
It concentrates Grayscale, BlackRock and aggregate ETF cost bases, making it a source of selling pressure, as seen in April–May.
Acceptance above it would confirm that demand can absorb this supply and sustain the expansion.
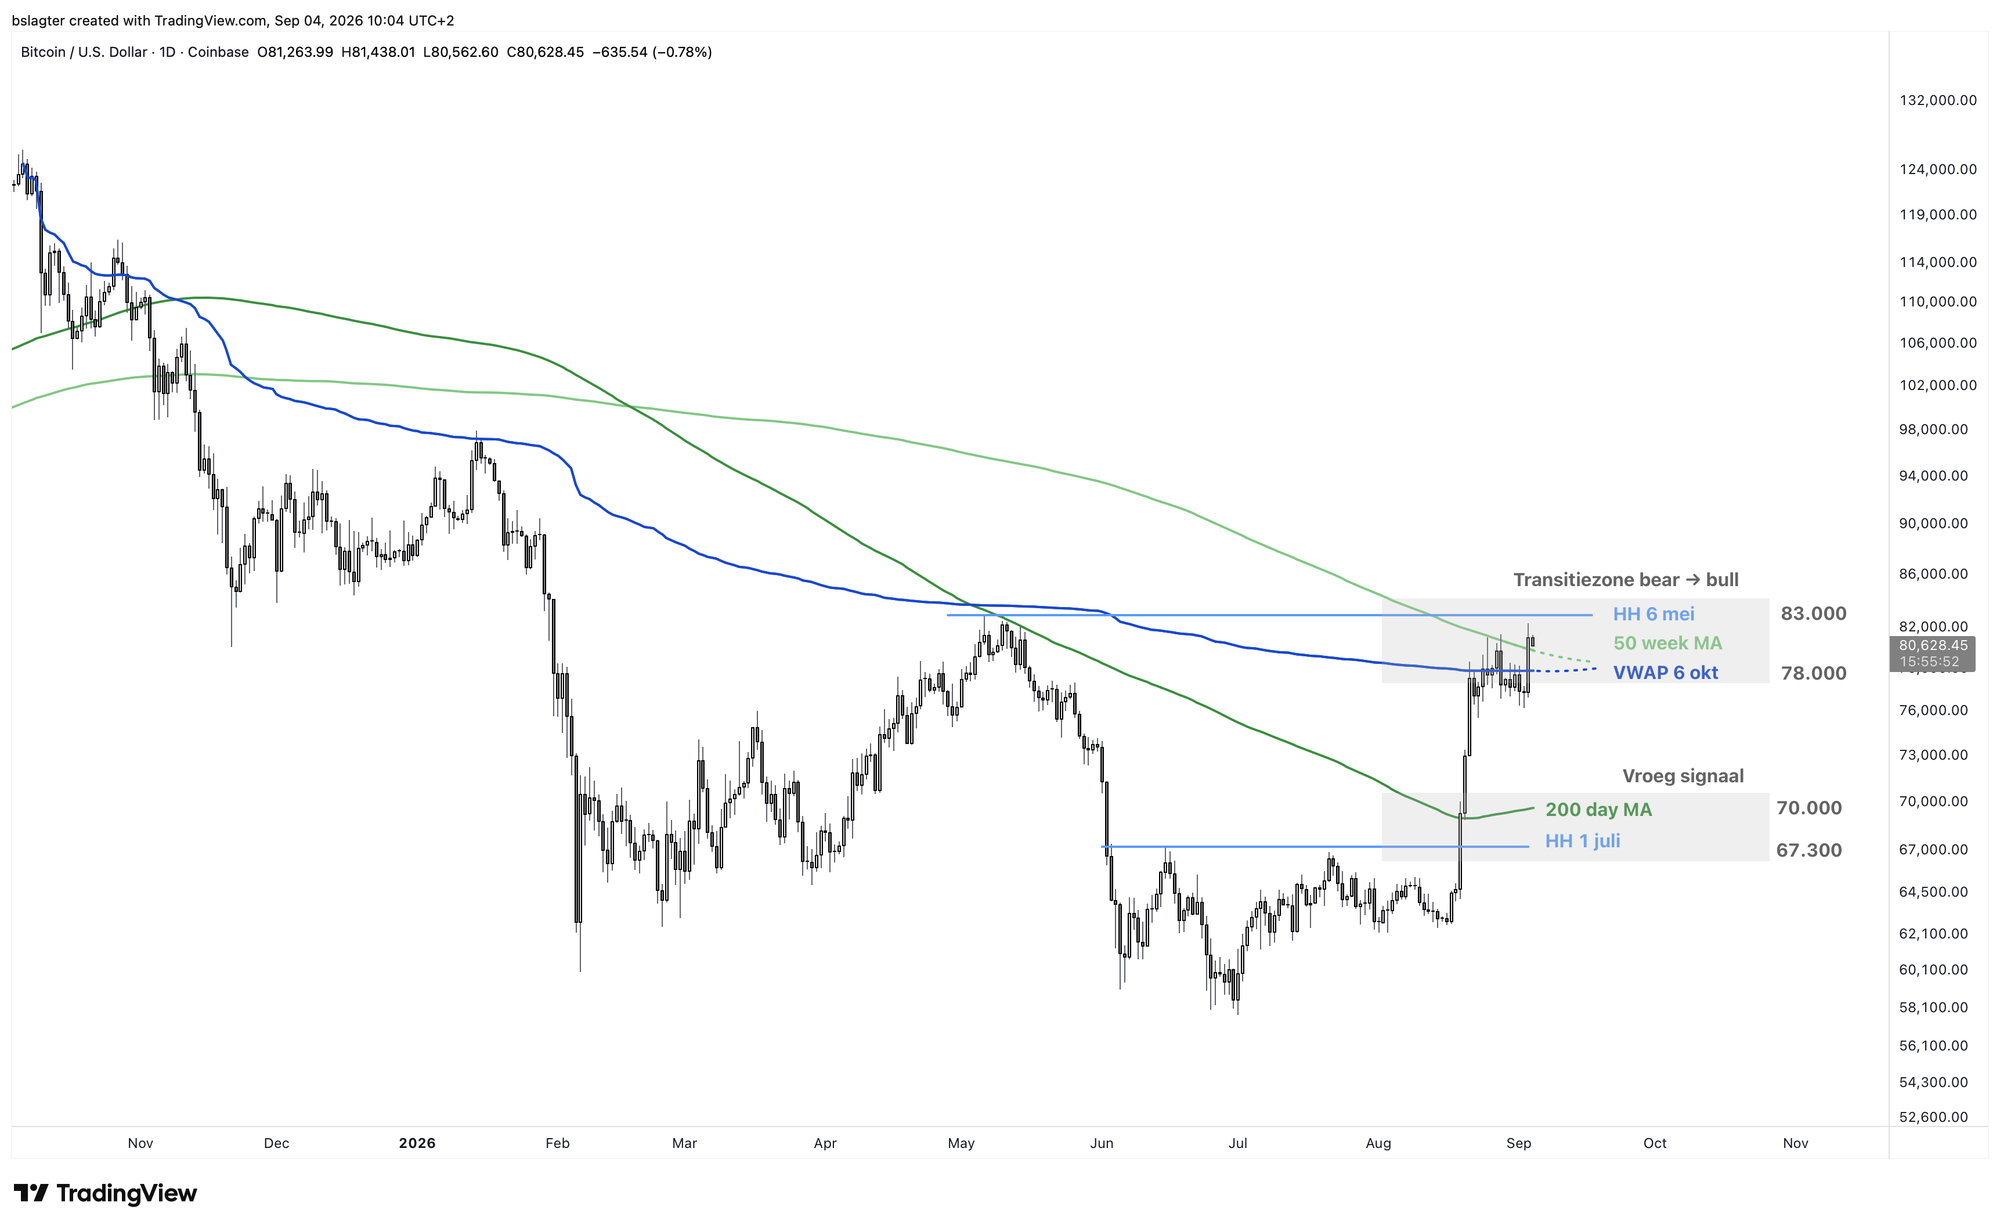
Two months ago, we mapped out the zone where bitcoin makes the transition from bear market to bull market between $78,000 and $83,000. That's where all those lines converge. The final boss? The dividing line between bear and bull? That's the May 6 top at $83,000.
With acceptance above $83,000, practically every investor and analyst will adopt as their new base case that the bear market is over, and that we've begun a new bull market.
It could well happen that we dip back below $80,000 afterward, but from that new base case the expectation will be that we're then headed toward a higher low above the $57,700 from July 1. Higher high, higher low, prices above the dominant moving average: an uptrend.
We continue with the following topics for our Alpha Plus members:
- Yearly, weekly & daily cycle
- Sentiment: the shift from bear to bull
- Altcoins give a clearer signal than bitcoin
- Key economic data heading into September's rate decision
- Rate storm slowly builds a narrative for bitcoin heading into the 2028 halving
1️⃣ Yearly, weekly & daily cycle
 Contribution by
 Bert
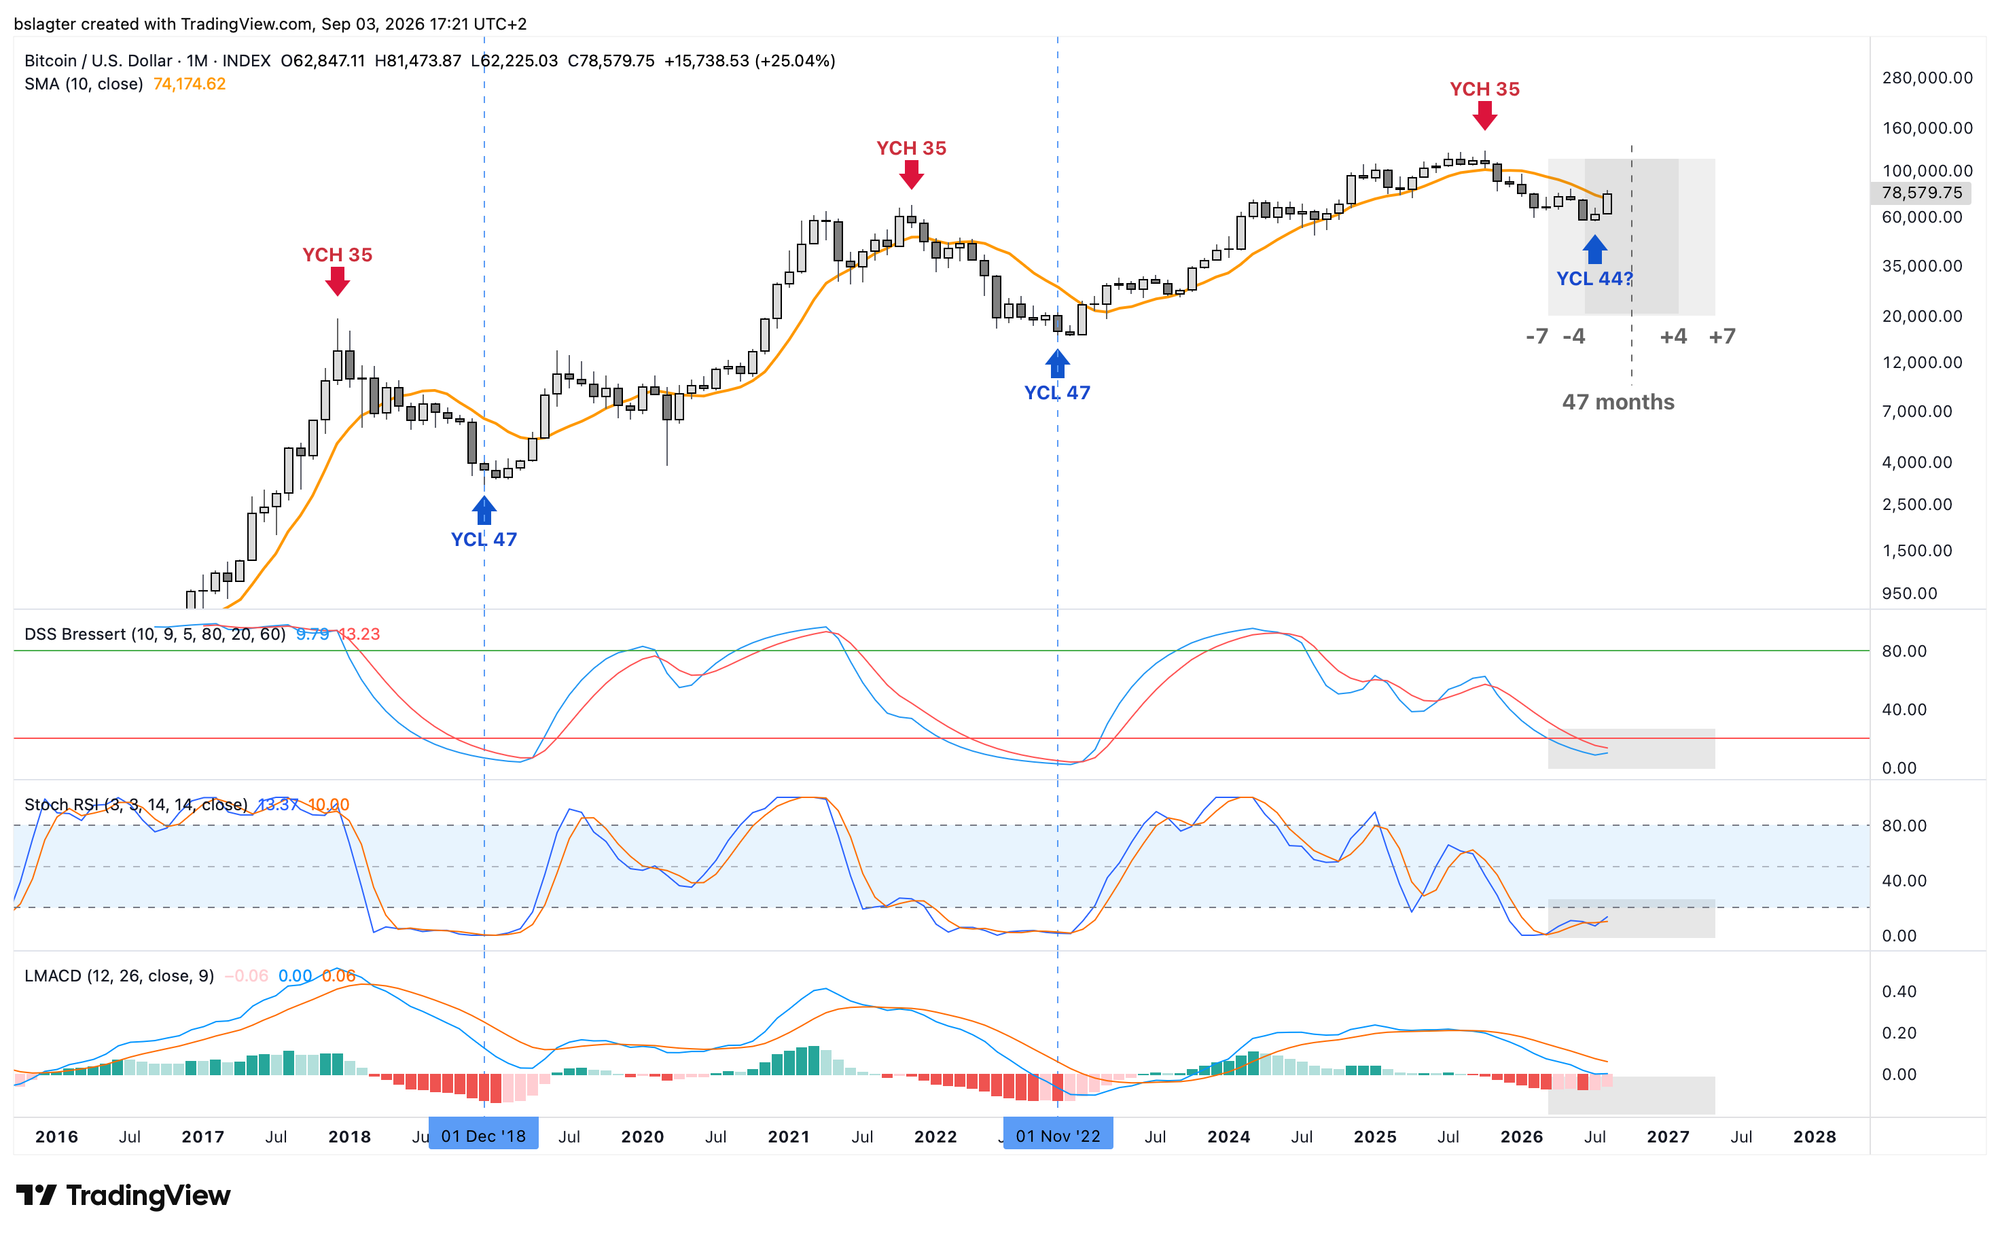
Cycle analysts often use a 10-period moving average as one of their criteria for determining whether a new cycle has begun:
- For the daily cycle, they look at the 10-day moving average.
- For the weekly cycle, they look at the 10-week moving average.
- For the yearly cycle (the market cycle), they look at the 10-month moving average.
The monthly close of $78,600 sits above the $74,200 of the 10-month moving average. That's an argument for pinning July 1 as the yearly cycle low (YCL), and therefore as the start of a new bull market.
July sits right on the edge of the 'timing band,' the window within which 90% of bottoms fall. On that front, it's plausible. We'd then have a YCL in month 44, three months earlier than in the previous two cycles.
The momentum indicators at the bottom of the chart aren't showing a very clear launch just yet. A solidly green September would change that, and remove any doubt.
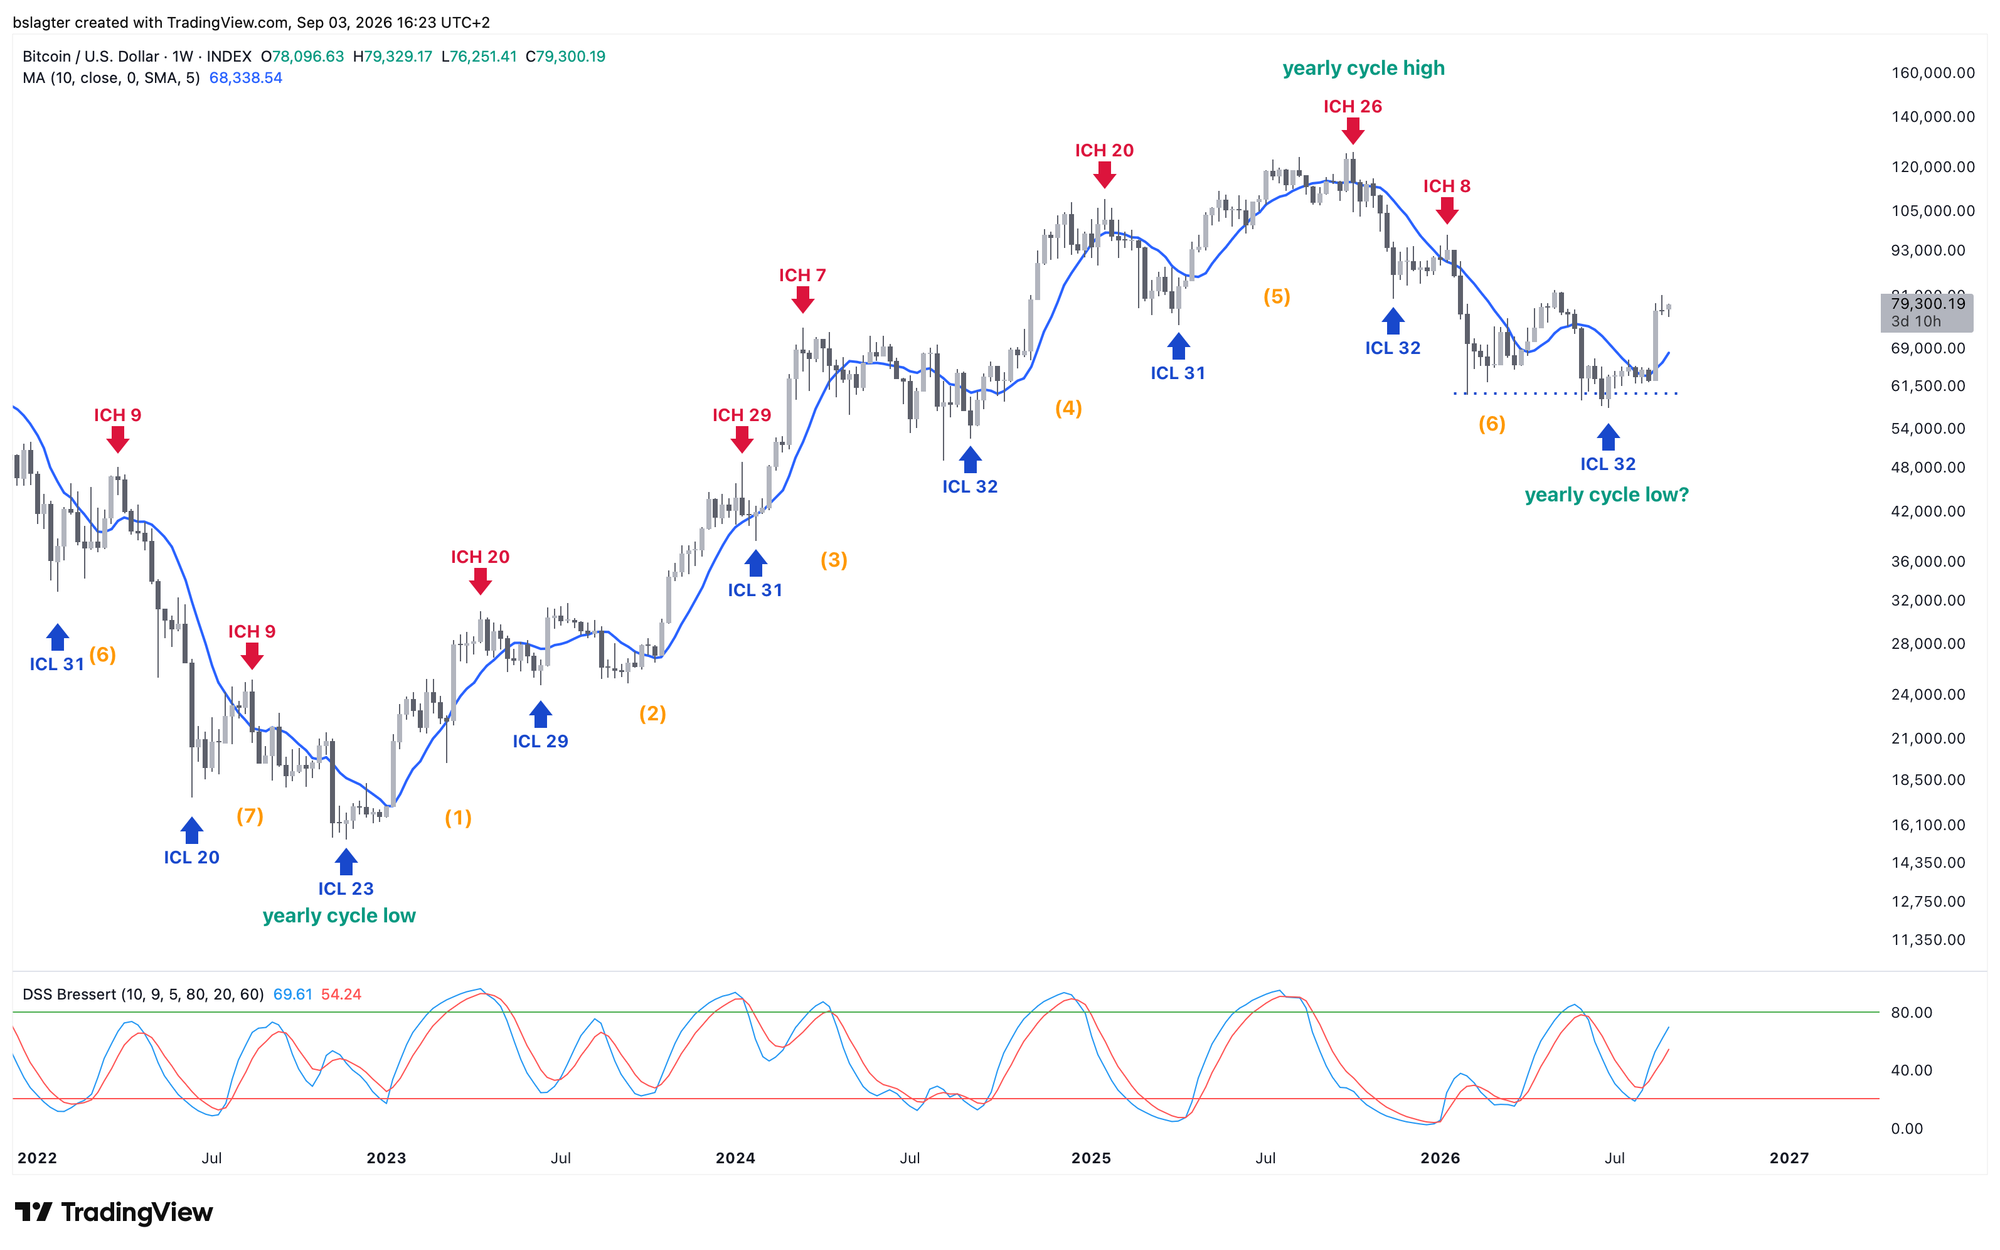
With this in mind, let's pull up the weekly chart. The rise from two weeks ago is clear: this is a new weekly cycle. The evidence: a weekly close well above the 10-week moving average and a sharply rebounding oscillator.
The most obvious move is to then pin July 1 as the weekly cycle low (ICL); that fits nicely within the rhythm of cycles of roughly 31–32 weeks.
This market cycle counts six weekly cycles so far. The previous one had seven. Could we get a seventh weekly cycle now too, with the yearly cycle low only coming after that? It's possible—we just saw that the yearly cycle left some room for doubt.
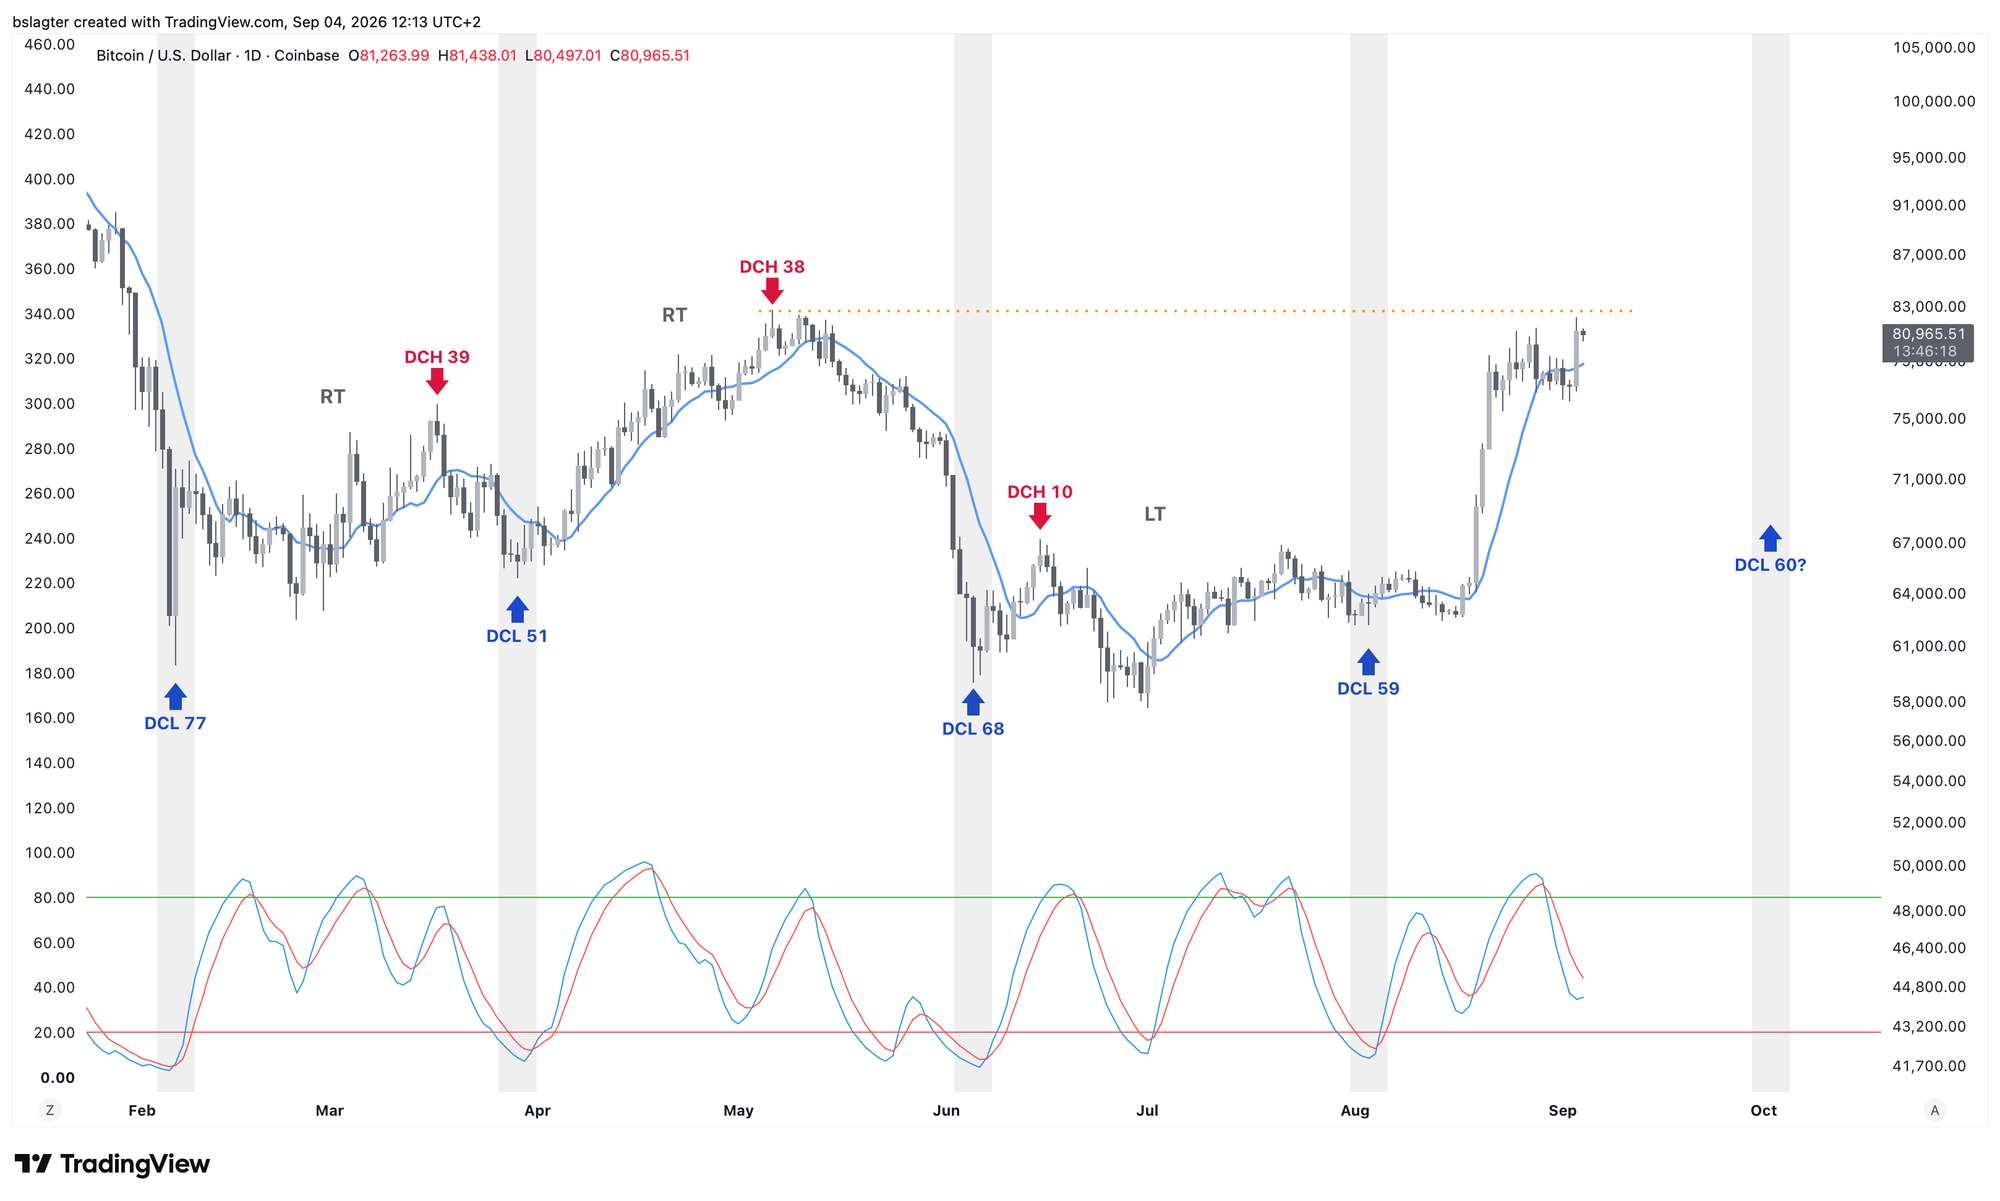
That brings us to the daily cycle. It's been messy and hard to read lately. So right now I place little weight on it. It's just not a very useful tool at the moment.
The chart is shown below with the interpretation that has seemed most obvious so far. But I don't find it very compelling. The July 1 bottom at $57,700 sits right in the middle of a cycle, for one. That really shouldn't happen. But then again, what's the alternative? A very short cycle? An inverted cycle?
The cycle theorists have come up with all sorts of solutions. I'm pragmatic: we'll leave it as is for now until the more important higher-level cycles (weekly, yearly) give us clarity on the rhythm.
2️⃣ Sentiment: the shift from bear to bull
Contribution by Bert
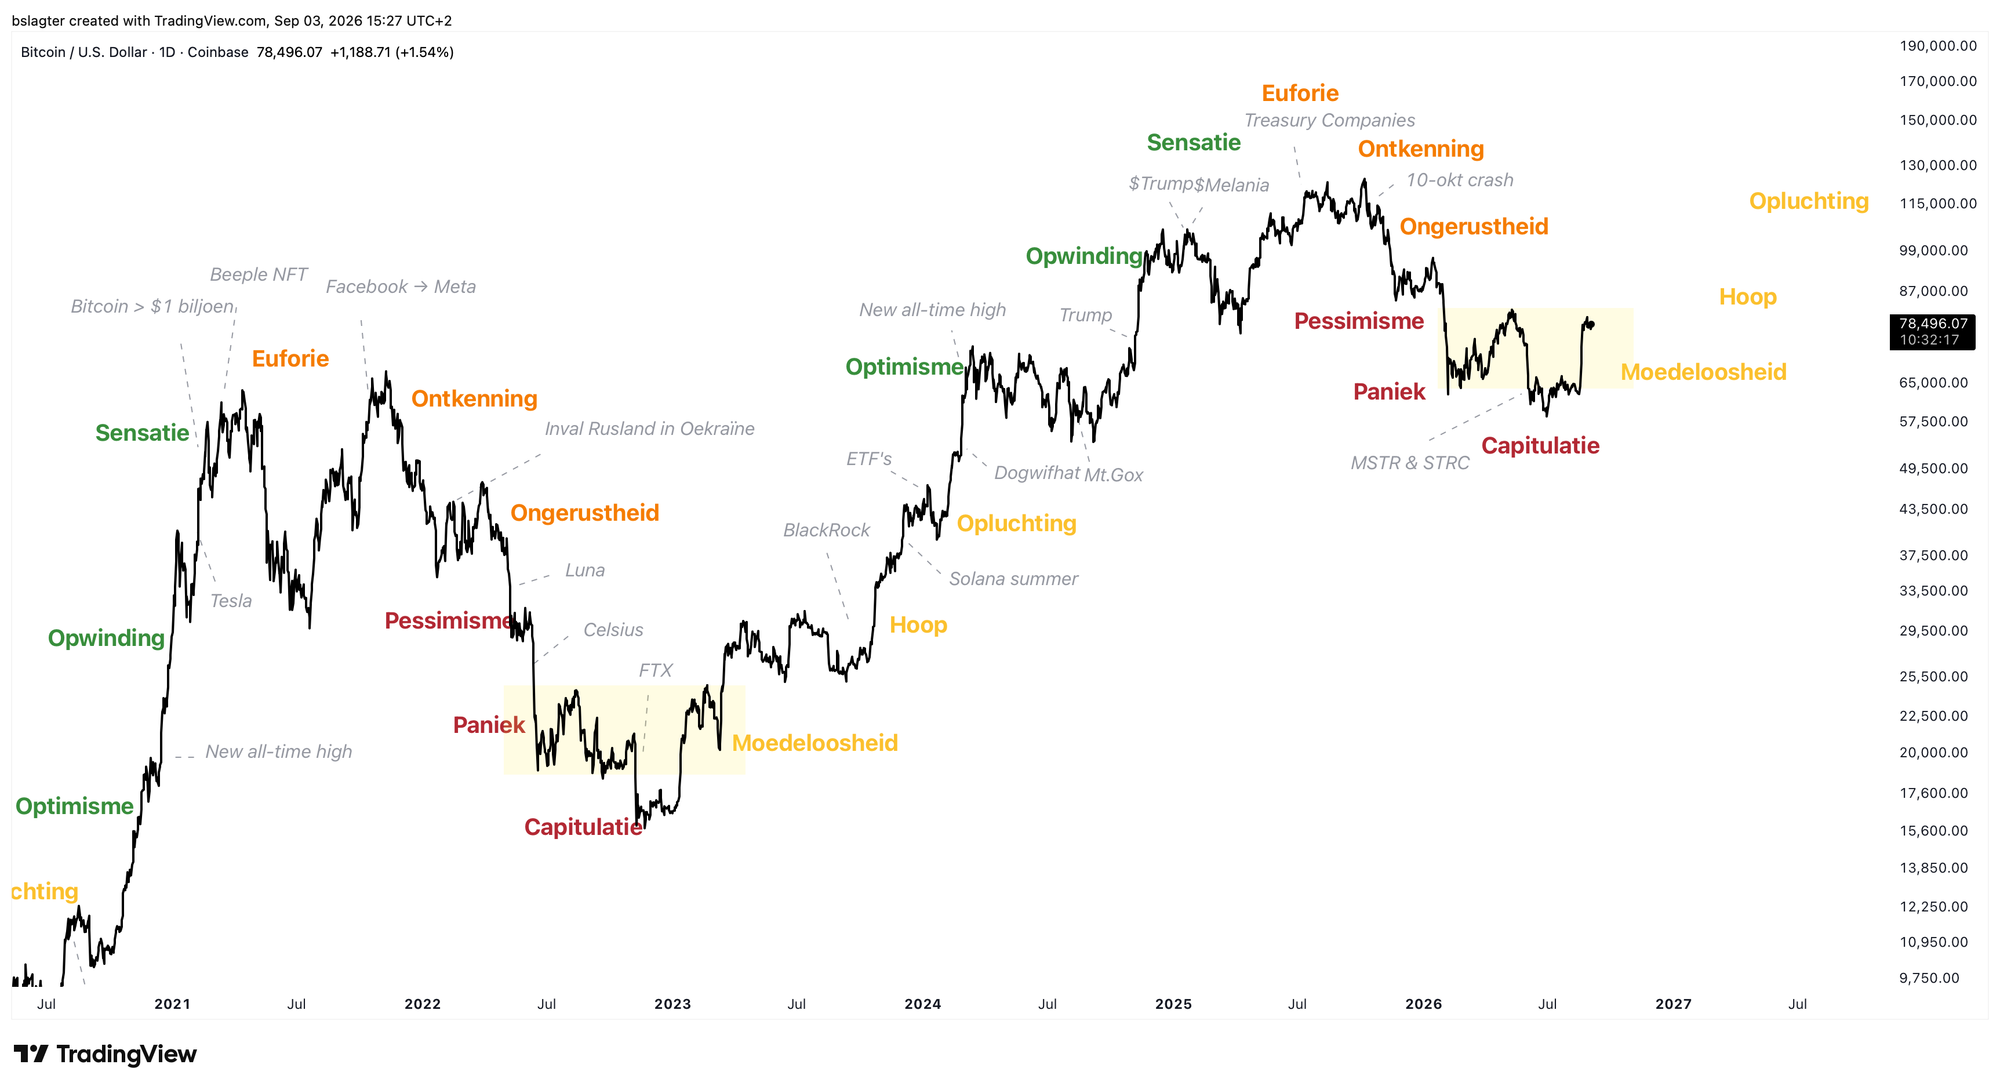
After all these years, I still find it striking how well the sequence of sentiments describes the market cycle:
- The denial in October, when the falling price was seen as a correction within a bull market.
- The unease in November, when things got moving rather hard and some investors (like us) hit the brakes.
- Then pessimism and panic, occasionally punctuated by those all-too-characteristic capitulations.
- The summer was dull. The price simply wouldn't budge. Indifference and despondency reared their heads.
- The rise from 60k to 80k in August was the first time I really saw hope again. This was genuinely different from the 80k in May.
It's wonderful to feel some optimism again for the first time in a year: we're so back, and fire up aggr.trade for the green candles. But history teaches us that this phase can last a long time. Forewarned is forearmed!
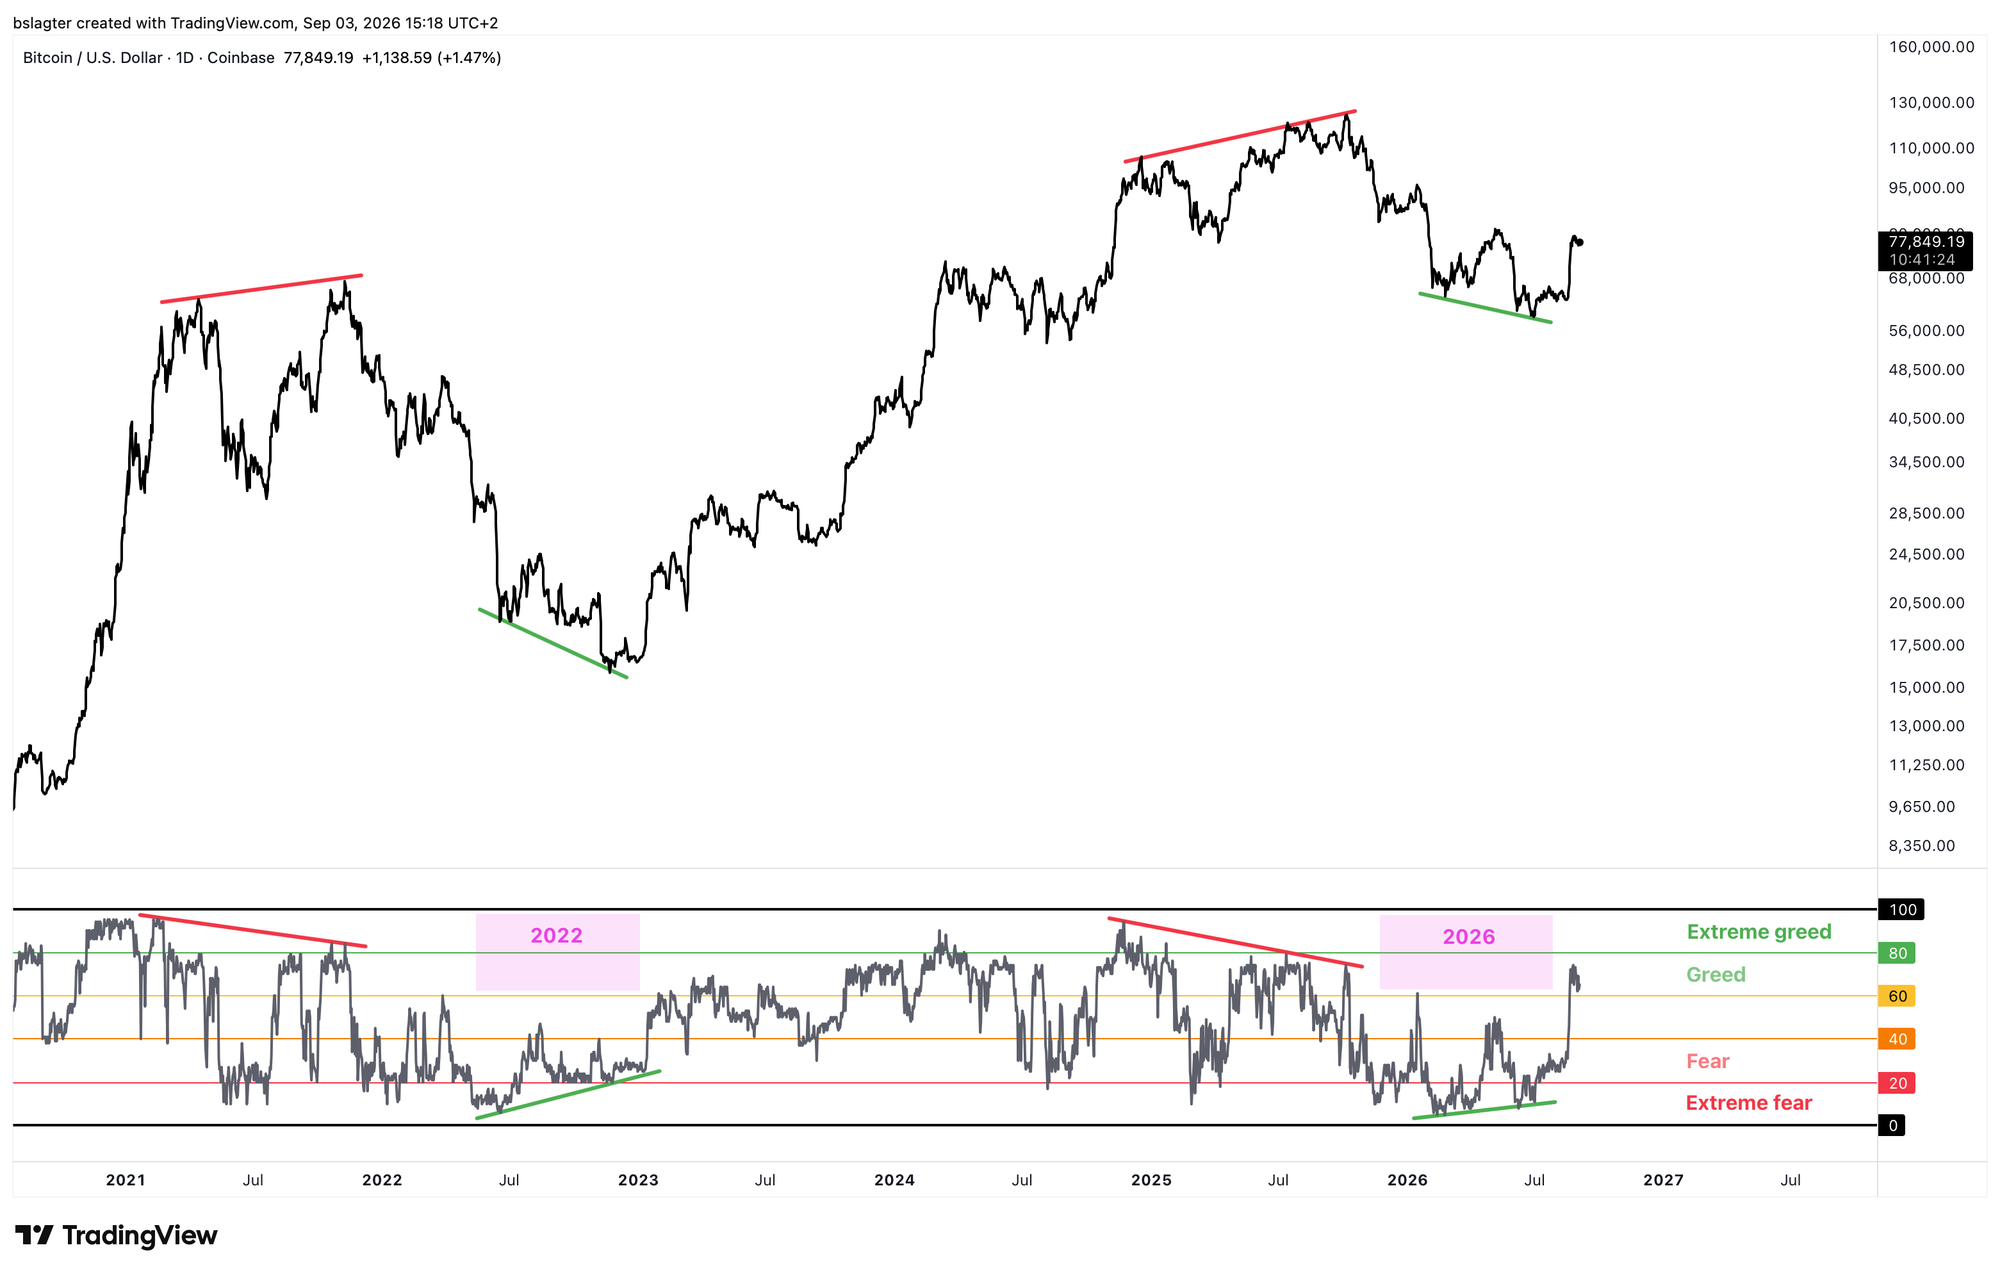
We see the improved sentiment reflected in the data too. The Fear & Greed index climbed well into the greed zone for the first time since October 2025. After previous bear markets, that only happened once the bottom was already behind us. It's not strong evidence, but it's a solid supporting argument.
3️⃣ Altcoins give a clearer signal than bitcoin
 Contribution by
 Sam
In our checklist, the higher high on the weekly chart stood as the most important condition. With bitcoin, analysts are divided on when we can speak of a higher high. Some look at the $67,500 from June 15, others take the $83,000 from May 6. The price stalled just below $83,000, and we certainly haven't seen a weekly close above it yet.
For a number of major altcoins, the situation is fundamentally different. Solana posted a weekly close above $98.50 last week, marking a clear higher high on the weekly chart. Hyperliquid went a step further, even setting a new all-time high with a weekly close above $82.
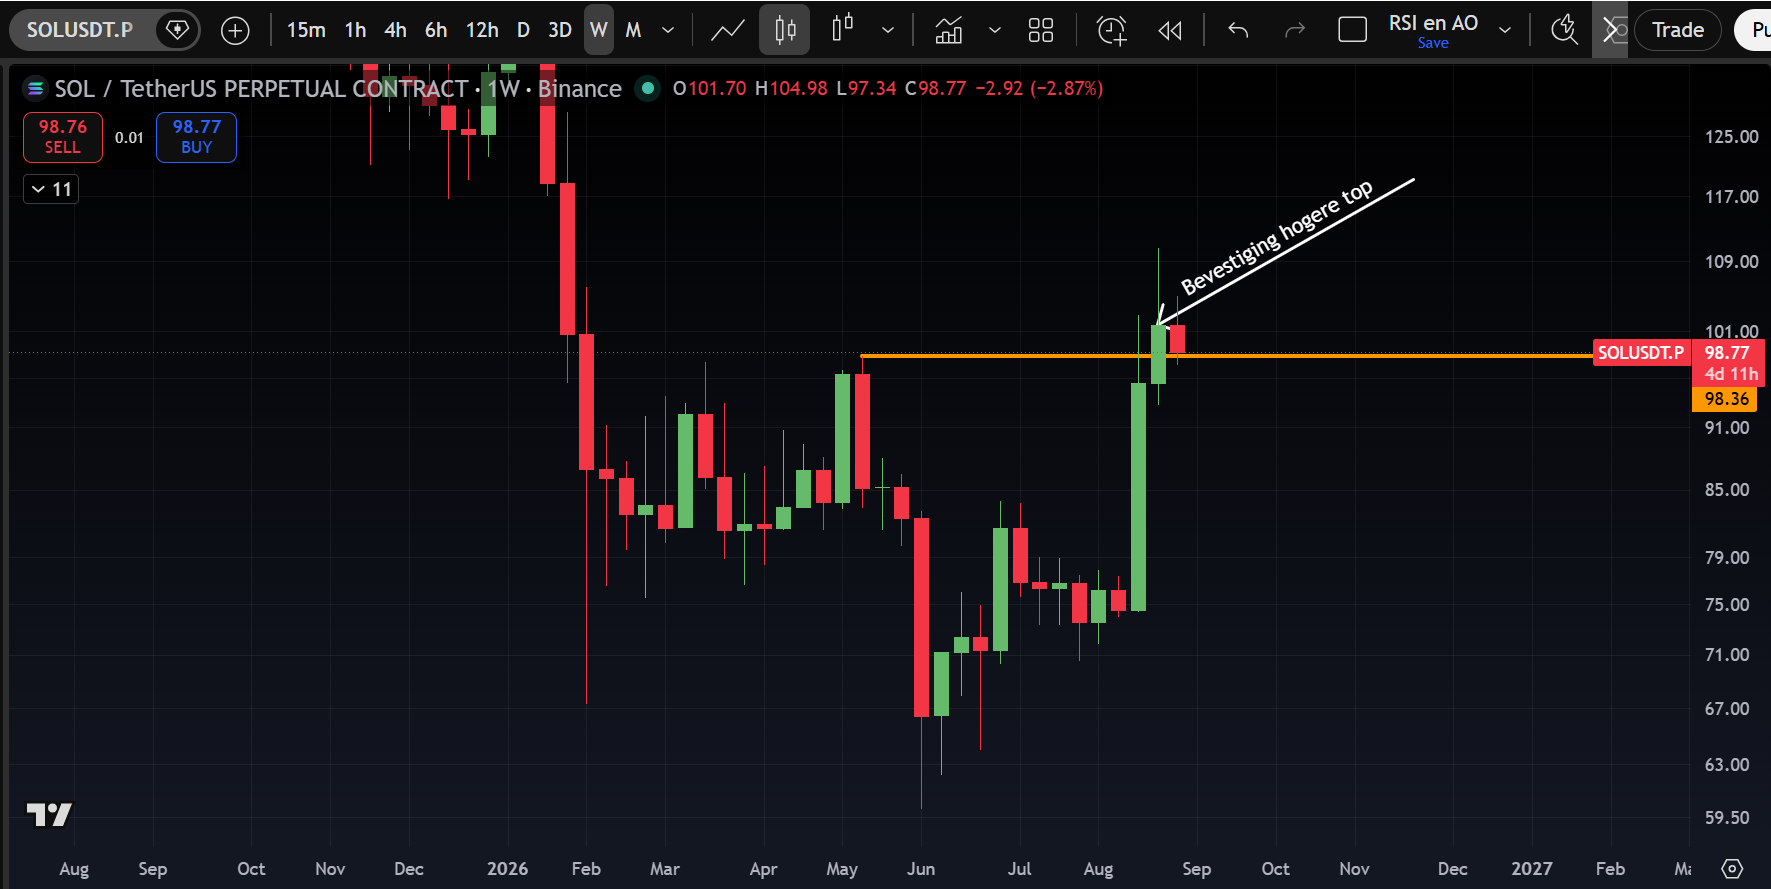
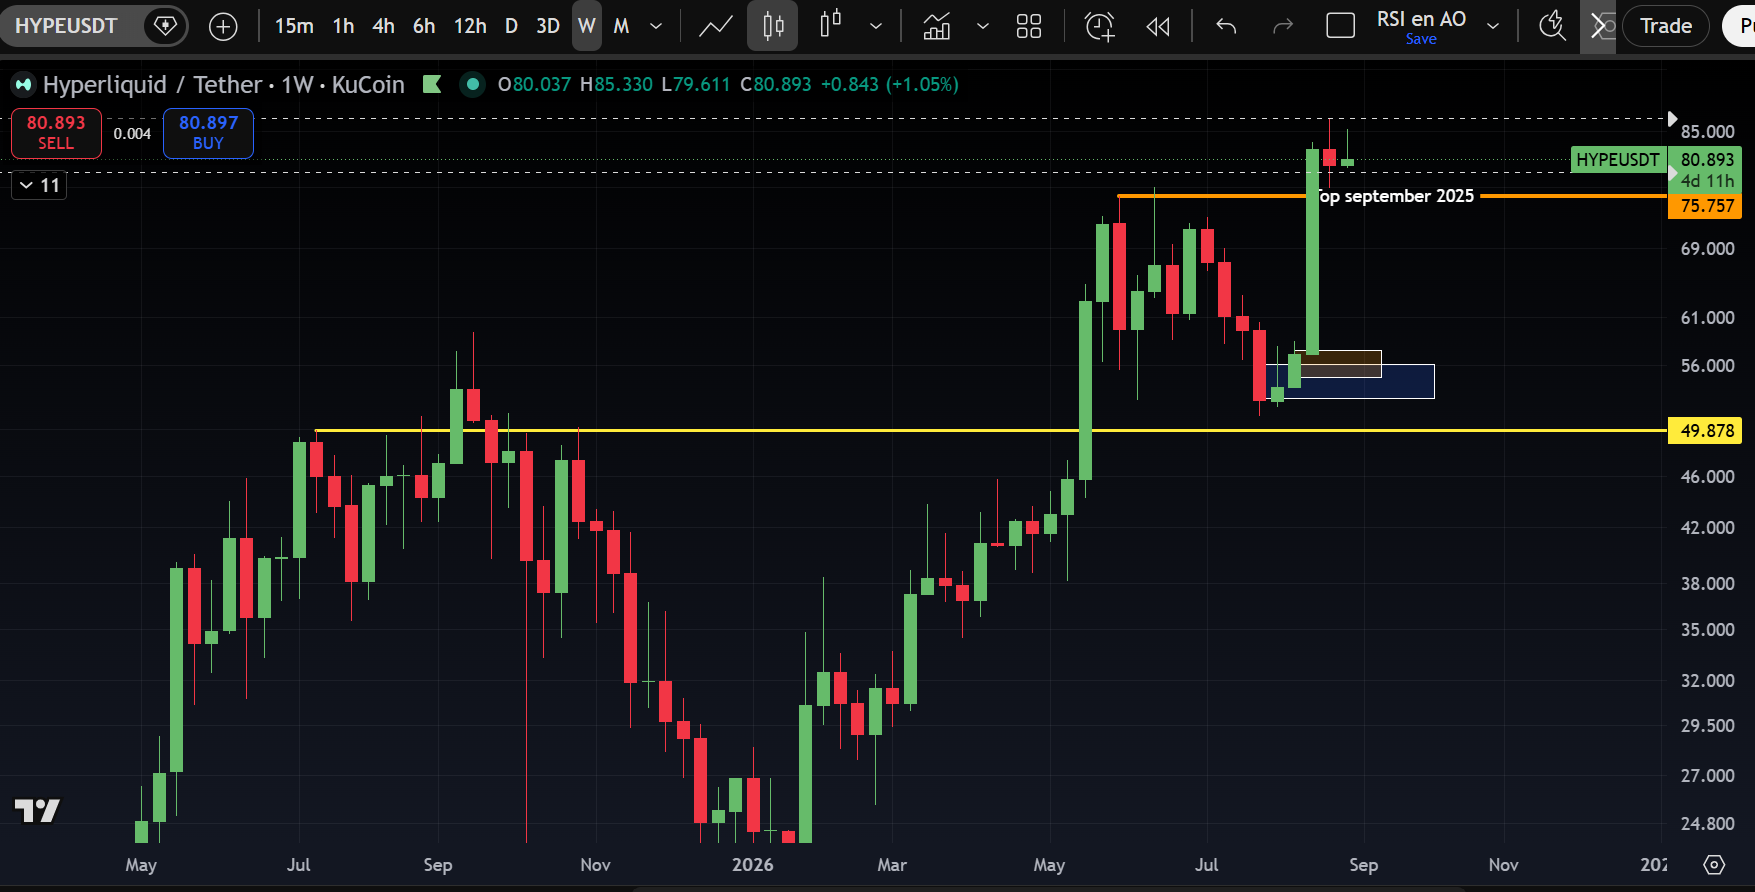
That's exactly the kind of divergence we wrote about earlier in the Markets edition of July 31, 2026, titled 'Making money with altcoins: what's the right moment?' It was about altcoins putting in a higher low while bitcoin was still making a lower low.
In practical terms, this means that if bitcoin turns out to have made a lower high below $83,000, and—in line with that market structure—subsequently posts a lower low below $57,700, there's a good chance Hyperliquid and Solana will register a higher low. Of course that's no certainty, and it partly depends on how deep bitcoin's new bottom ends up being.
On top of that, altcoins move harder in both directions. Solana and Hyperliquid could still correct more than 30 percent and still put in the higher low. So while the bottom for both tokens is probably behind us, it's wise to enter via a plan or be prepared to sit underwater for a while.
The key questions these charts leave us with:
- "Is bitcoin merely lagging, with the higher high above $83,000 coming soon?"
- "Are the altcoins lying, and are we going to retest the bottom once more?"
- "Will these altcoins actually hold up if bitcoin does still post a lower low?"
We'll keep an eye on the situation and provide updates as soon as there's more clarity!
4️⃣ Key economic data heading into September's rate decision
 Contribution by
 Thom
In just under two weeks, the U.S. central bank will make a much-discussed rate decision. For now, the market sees roughly a 60% chance of a rate hike. But between now and then, we still have a considerable run of important economic data coming.
Starting today with private-sector job growth (NFP), wage growth, and unemployment. Last month, job growth was a bit of a disappointment. If that's the case again, the room for the U.S. central bank to hike rates shrinks.
While there are plenty of reasons in favor of a rate hike, there are also plenty of reasons to be cautious. Across the board, the economic data is starting to soften a little. Given the relatively high and rising rates, it's no surprise that everything outside the AI economy is beginning to sputter.
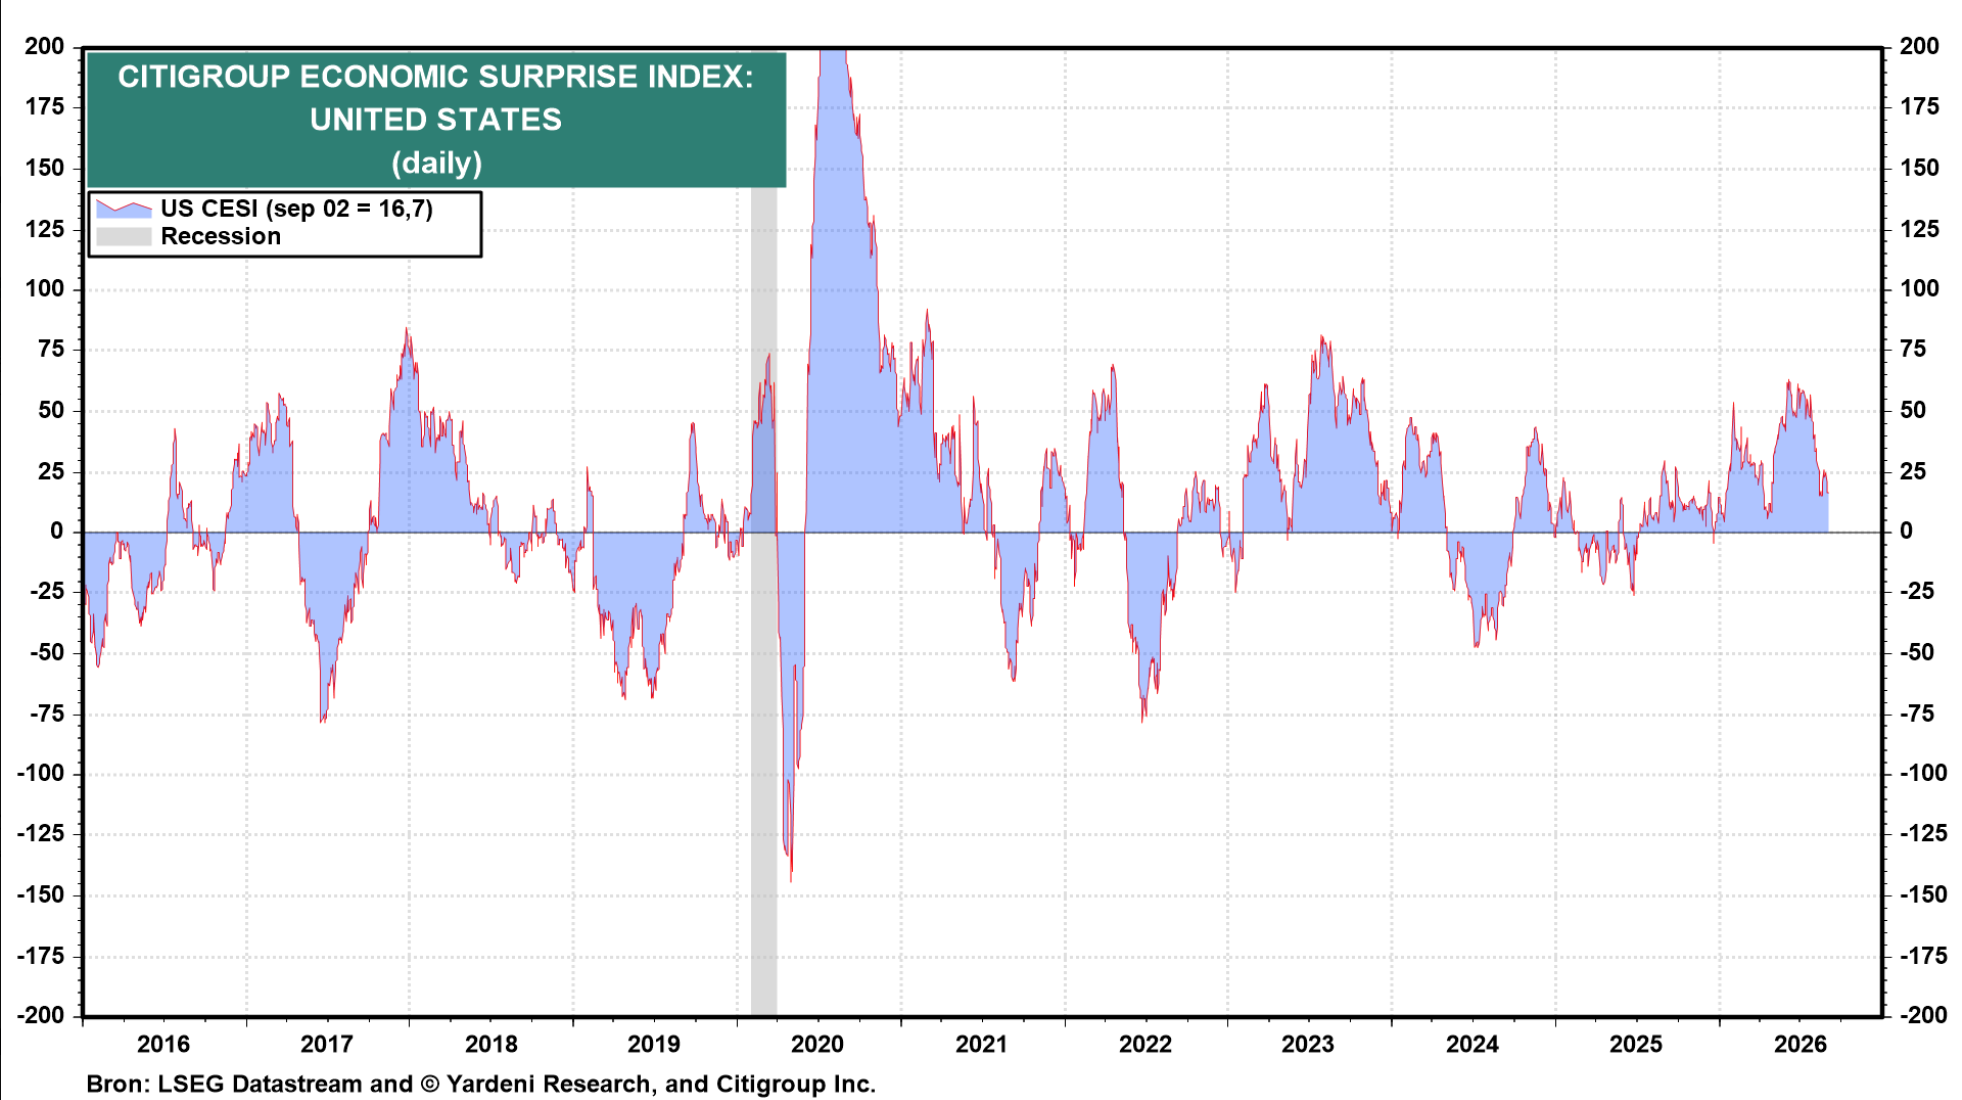
For now, the economic surprise index (ESI) for the U.S. is still positive, but considerably less so than before. We're currently seeing that trend worldwide. That in itself is a good reason for the U.S. central bank to hold off on any rate hikes. Especially when you consider that a hike wouldn't solve the supply problem in the oil markets.
Next up, the consumer price index (CPI) is on the calendar for next week Friday, in the week before the rate decision. There, it'll be especially interesting to see whether rising energy prices are feeding through into the rest of the economy—which would in turn be an argument for a rate hike.
So a lot of important data points and developments are converging in the run-up to the U.S. central bank's next rate meeting. At the same time, there are now rumors going around that Trump is considering declaring the Iran war over. That will undoubtedly also have something to do with this week's local peak in, for example, the 10-year yield.
5️⃣ Rate storm slowly builds a narrative for bitcoin heading into the 2028 halving
Contribution by Thom
The 30-year yield is hovering around 5.25 percent, the Brent oil price sits well above $90, and the odds of a September rate hike are more than 60 percent according to the futures market.
Worldwide, we're seeing bond yields climb to record levels driven by:
- Tighter central bank policy
- Concerns over government debt
- Rising energy prices
- Financing demand from the AI investment cycle
While the pace of the rate rise is modest compared to 2022, the significant difference is that rates were already coming off a relatively high level. The effect on refinancing existing debt, interest costs for governments, mortgages, and the discounting of future corporate earnings is therefore no less severe.
For now, though, there seems to be no genuine panic in the financial markets. The theme is in play, and it's increasingly moving to the foreground, but hope for a continuation of the AI bull market persists. At the same time, the price declines in bitcoin and gold are relatively contained.
In my view, this development acts as a brake on the bitcoin price, particularly in the short term. Rising rates make for tighter financial conditions, so bonds are competing ever more fiercely with the digital currency. After all, bitcoin pays no interest.
In the long term, however, this amplifies the very problems that form a key part of the investment case for bitcoin. The U.S. national debt now stands above $40 trillion. At the same time, they're currently running a budget deficit of 6%, worth roughly $2 trillion, while economic growth remains on track.
Rising bond yields drive up annual interest costs, which already sit around $1 trillion. Combined with the budget deficit—which could run even higher in a crisis year—inflation looks like the only serious way out.
In my view, it's a matter of time before this theme, sometimes also dubbed the 'dollar debasement trade,' comes back into play. Ideally, that would happen around the time of bitcoin's next halving in the spring of 2028.
So over the medium term, a strong narrative for bitcoin is starting to take shape once again.
In closing
You can reread all previous editions of Alpha Markets in the archive. Questions, comments, and suggestions are more than welcome in the community.
Thank you for reading!
To stay informed about the latest market developments and insights, follow our team members on X:
- Bart Mol (@Bart_Mol)
- Peter Slagter (@pesla)
- Bert Slagter (@bslagter)
- Mike Lelieveld (@mlelieveld)
We appreciate your continued support and look forward to bringing you more comprehensive analysis in our next edition.
Until then!