The Bottom Comes Into View
Price dropped to $57,700 this week—the lowest point of this bear market? Is it the bottom? Too early to say, but for the first time in this bear market, it's plausible.

A bear market is a process, a logical sequence of behaviors and emotions. A bull market is too, for that matter. Market cycles across all markets throughout history resemble each other precisely because of this chain of actions and reactions. A sequence of causes and effects. In every bull market lies the seed of the next bear market.
We often illustrate this with the sentiments characteristic of a particular phase in the market cycle. The bull market begins with innocent optimism and grows through excitement and thrill toward euphoria. That's the defining upper portion of the bull market where investors are overconfident, congratulating themselves on their brilliance and spectacular gains. Prices are wildly inflated by hype and mania.
When the bubble starts to deflate—whether it's bitcoin, gold, or AI stocks—denial dominates at first. The prevailing expectation is that it's just a dip, and the bull market will resume shortly. If the decline continues, anxiety follows.
The bear market begins when the trend has clearly reversed. Lower highs, lower lows, a weekly close below the dominant moving average. The brakes are pulled. More and more investors face reality; pessimism takes hold.
Capitulations form the skeleton of the bear market. They test the investor's conviction. Am I really going to hold? Should I sell after all? "We can't take it anymore," wrote Arend Jan Kamp on StockWatch when he sold his bitcoin ETPs yesterday, "Our own fault: we're taking our loss in bitcoin."
At the deepest point of the bear market, panic and capitulation give way to despondency and apathy. It feels like it will last forever, even though in hindsight it turns out to have been just a few months. And then the first signs of hope appear, like snowdrops heralding that winter will eventually end.
After hope comes relief that the bottom is behind us and a new uptrend has begun. It's still quiet—the tourists haven't noticed yet. They'll show up later, when optimism turns to excitement.
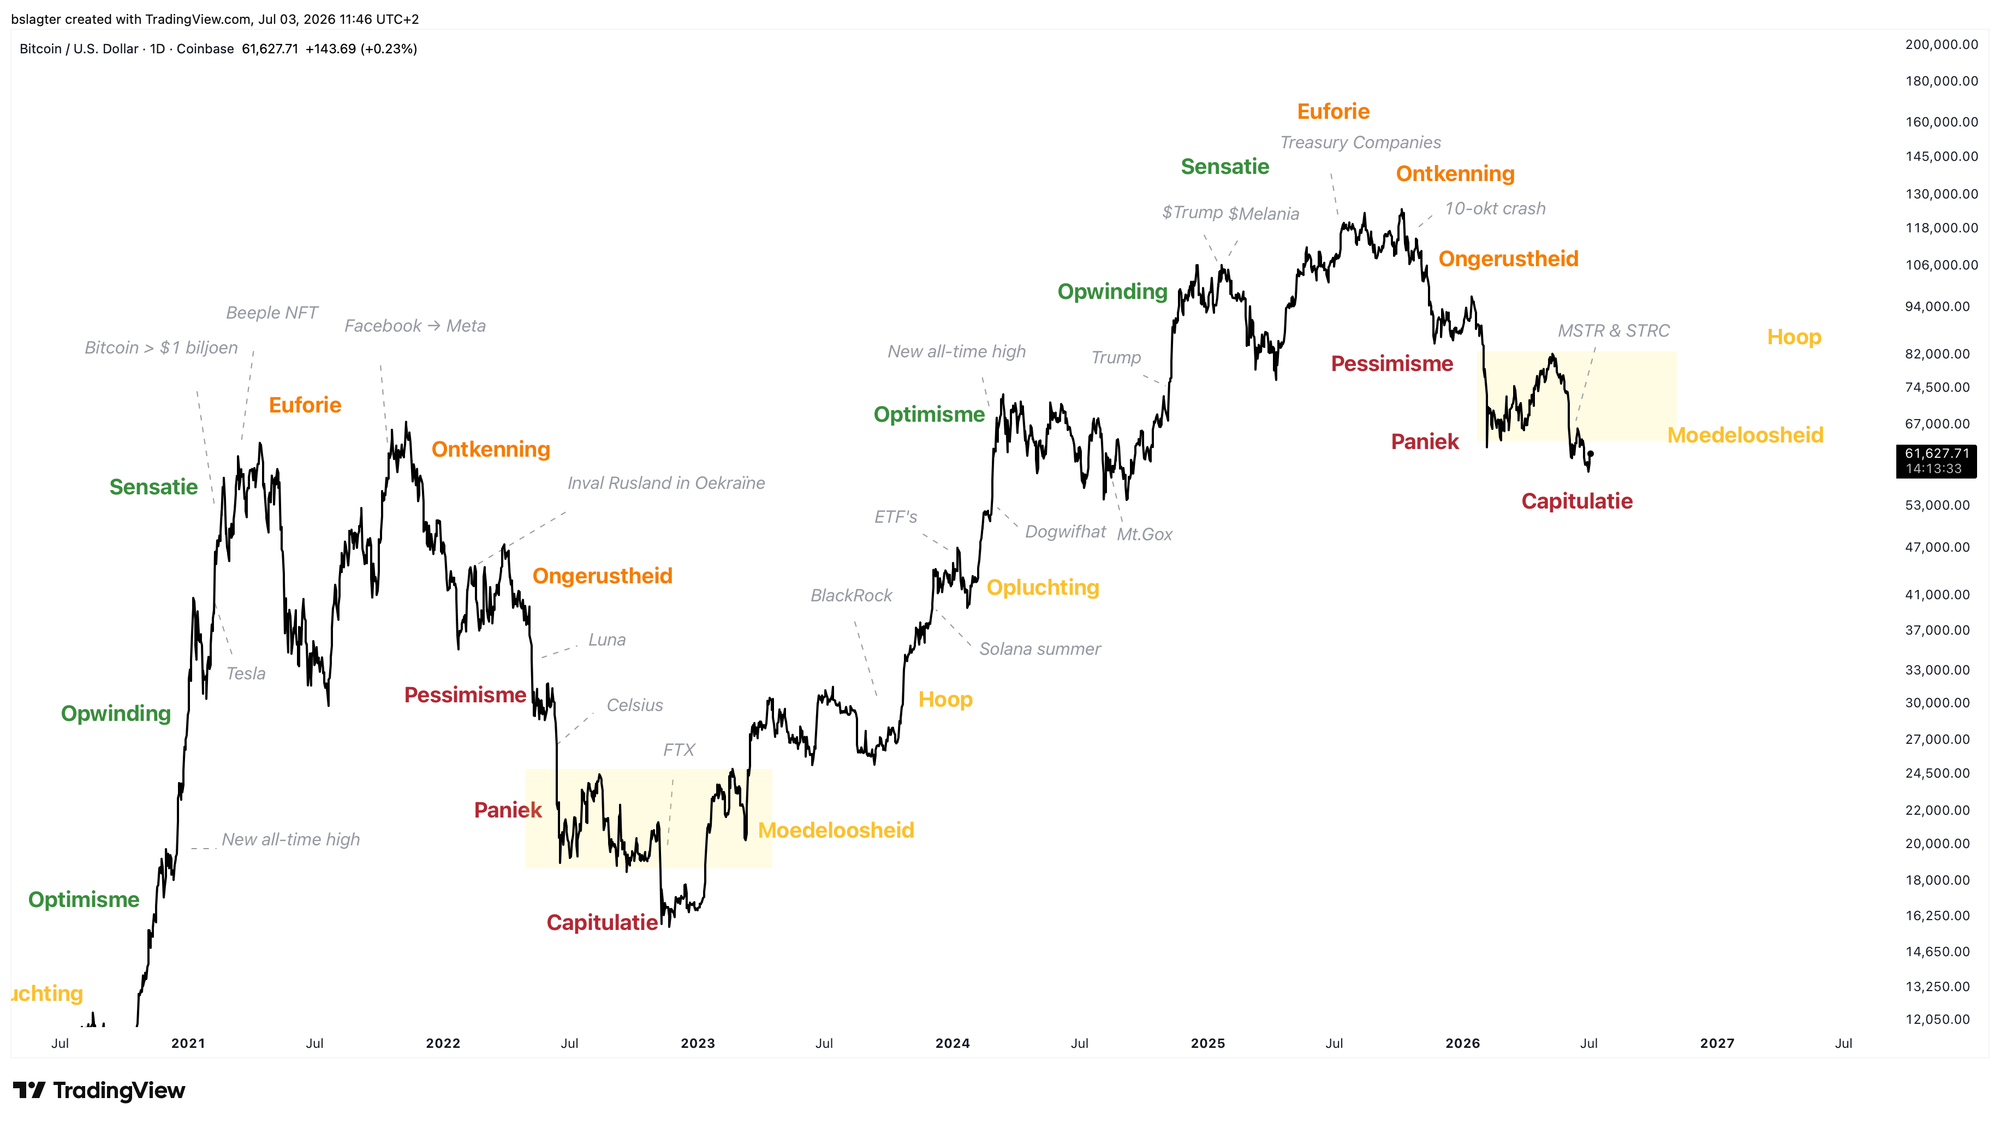
There's something ironic about the market cycle. The majority of participants in a bull market buy near the top—the period when enthusiasm and hype are at their peak. And the majority of losses are realized near the bottom. Investors without conviction are mercilessly shaken out.
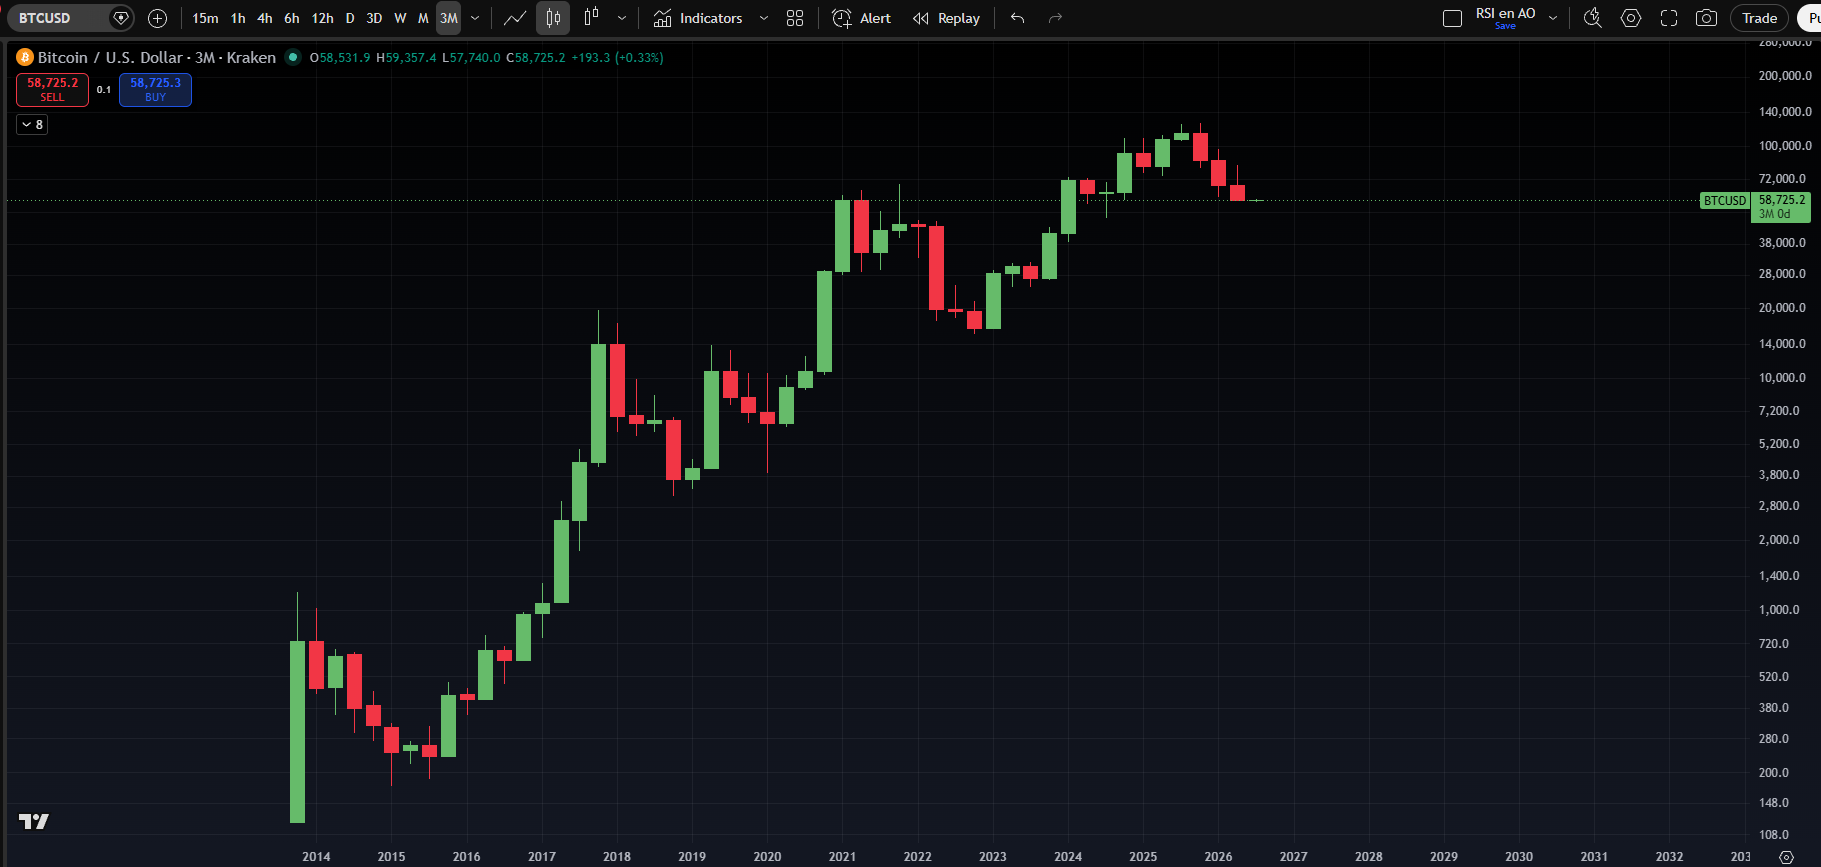
If you zoom out, you'll see that the market cycle is part of a secular movement. The chart below shows the S&P 500 between 1940 and 1985. A beautifully regular market cycle of just over four years forms a secular cycle of roughly thirty years: 1942, 1974, 2009.
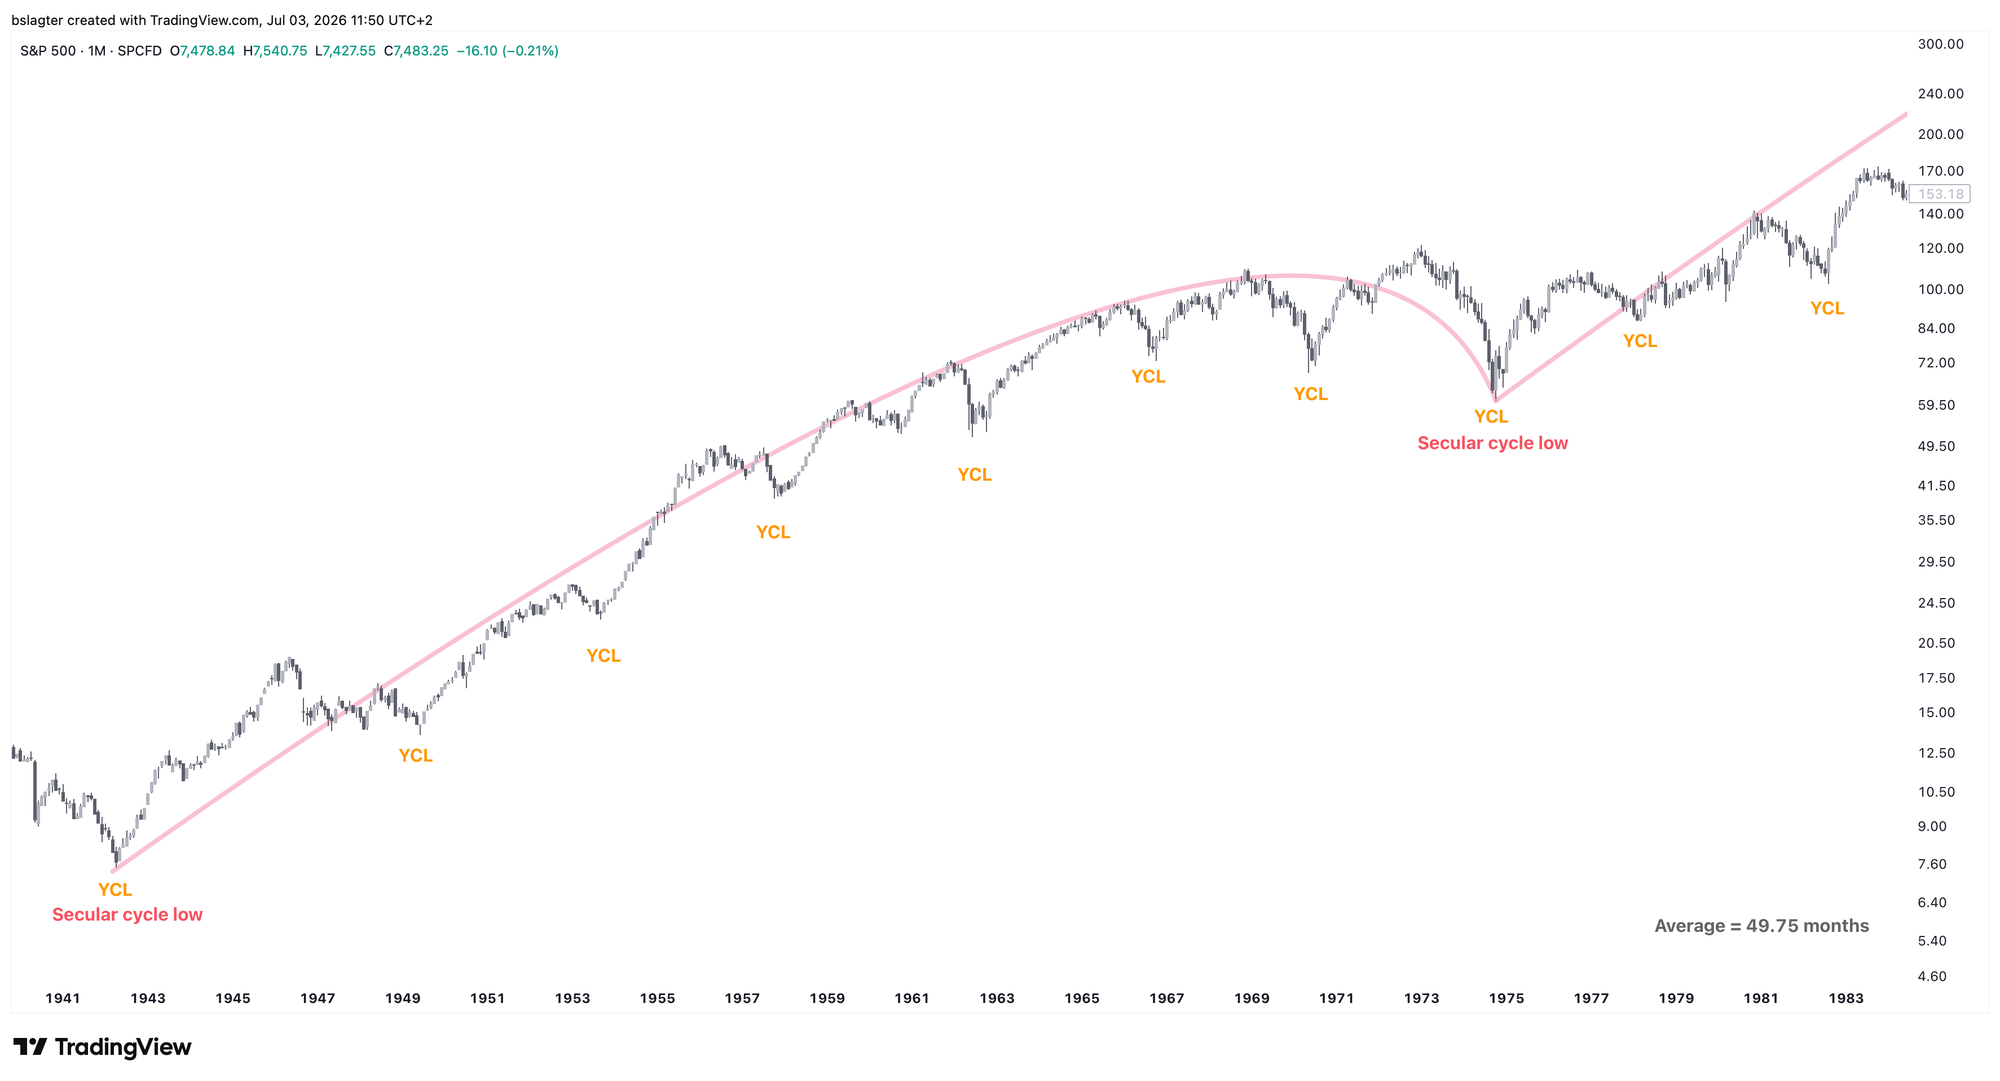
On a timescale of decades, every chart is fundamentally upward-sloping, simply because government-issued money slowly (dollar, euro) or rapidly (Turkish lira, Venezuelan bolivar) loses its purchasing power. But there are also charts that still go to zero—for instance, because a company goes bankrupt or a commodity falls out of use.
An index of the largest American companies, or the largest companies in the world, won't just vanish. But even those can go to zero. A dictator could nationalize all enterprise and shut down the stock market. Every investment therefore requires a conviction about the future.
- Do you expect bitcoin to no longer exist in ten years? Then you shouldn't invest in it. The volatility will tear you apart.
- Do you expect bitcoin to be adopted by more people, companies, and funds over the next ten years as digital gold? Then the depths of the bear market are the best place to add to your position.
The sentiment matches the period in which bottoms are typically formed. In terms of time, we've had enough bear market.
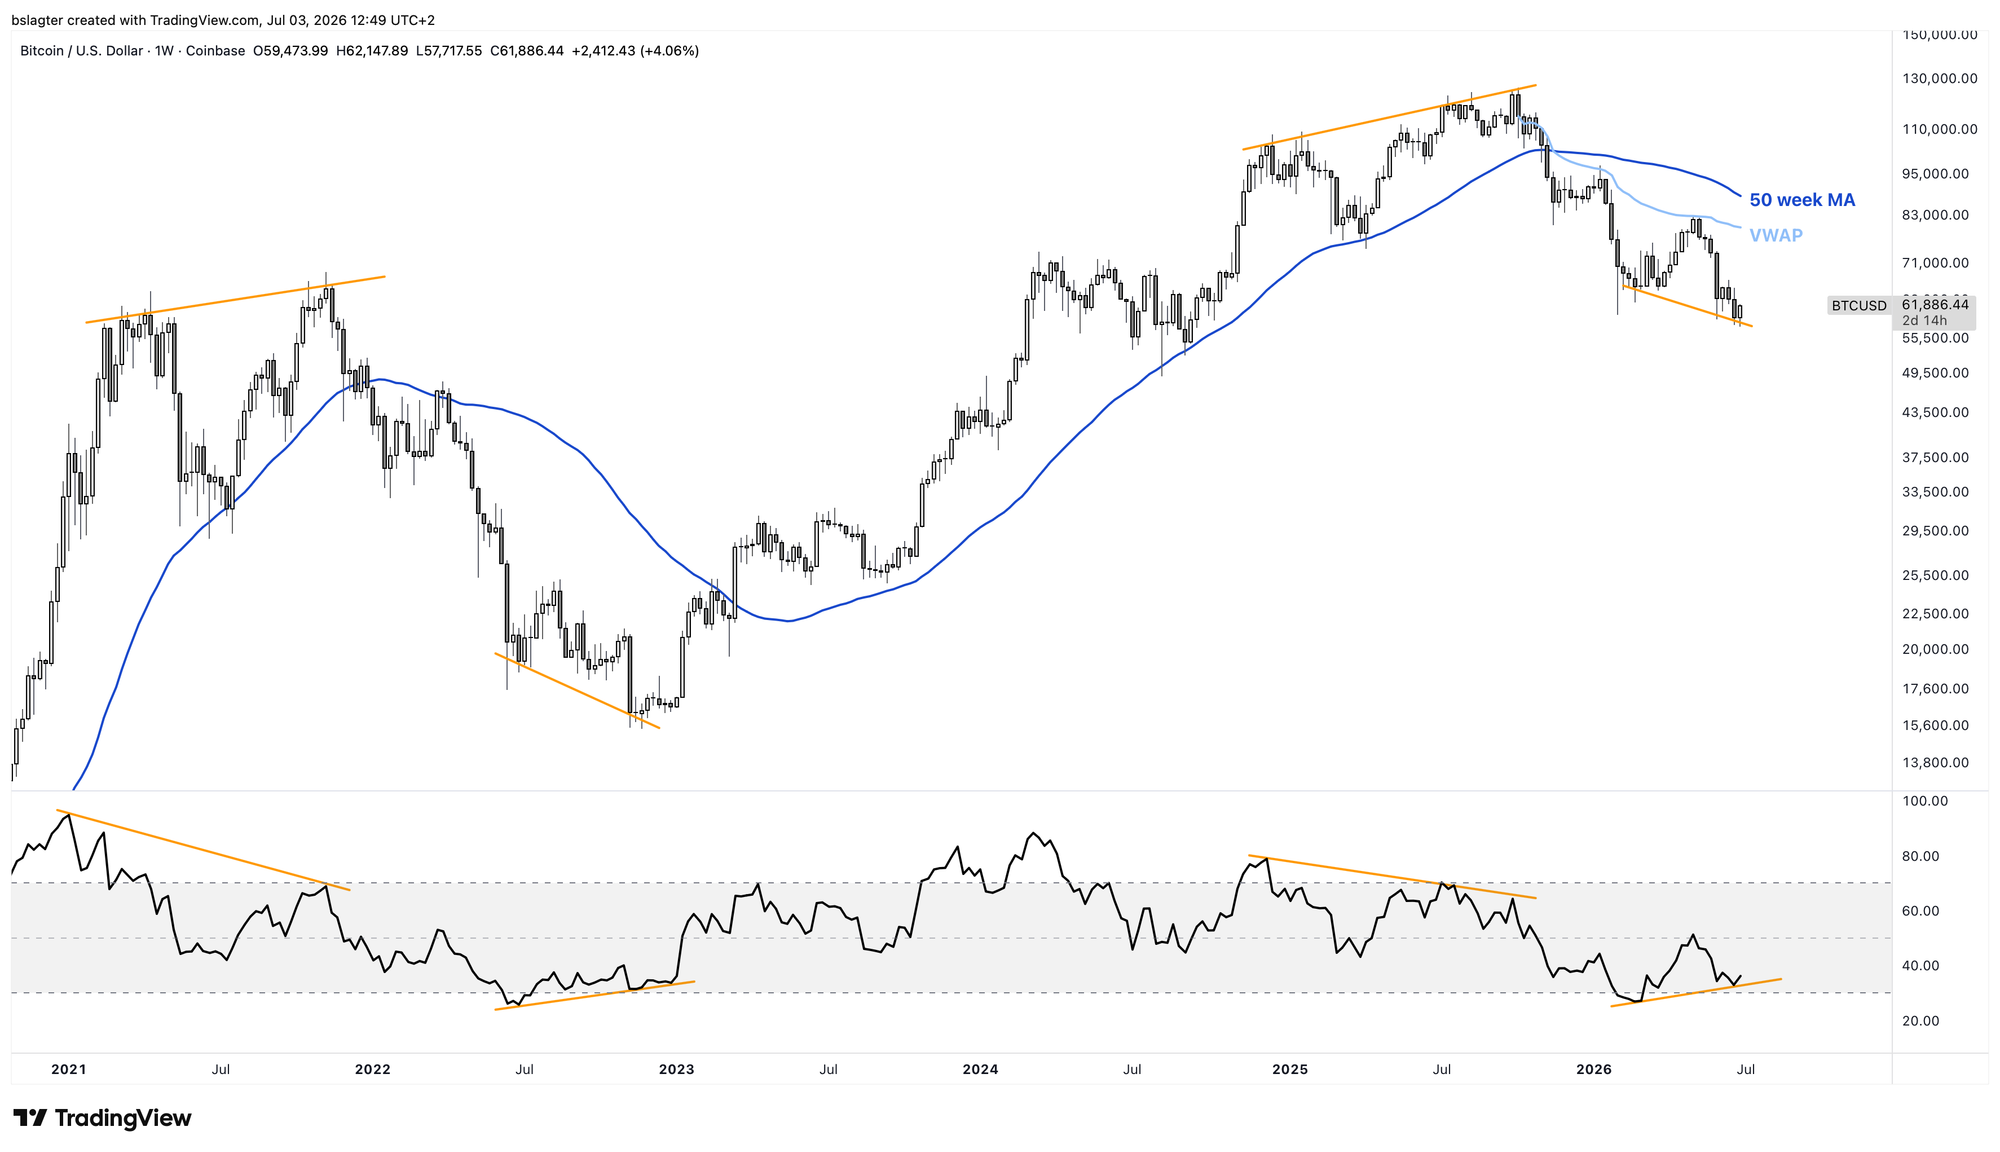
Looking at price, it could still go a bit lower than the $57,700 we saw this week. In past bear markets, bottoms formed around the 200-week EMA ($68k), the 200-week MA ($62k), and the realized price ($53k).
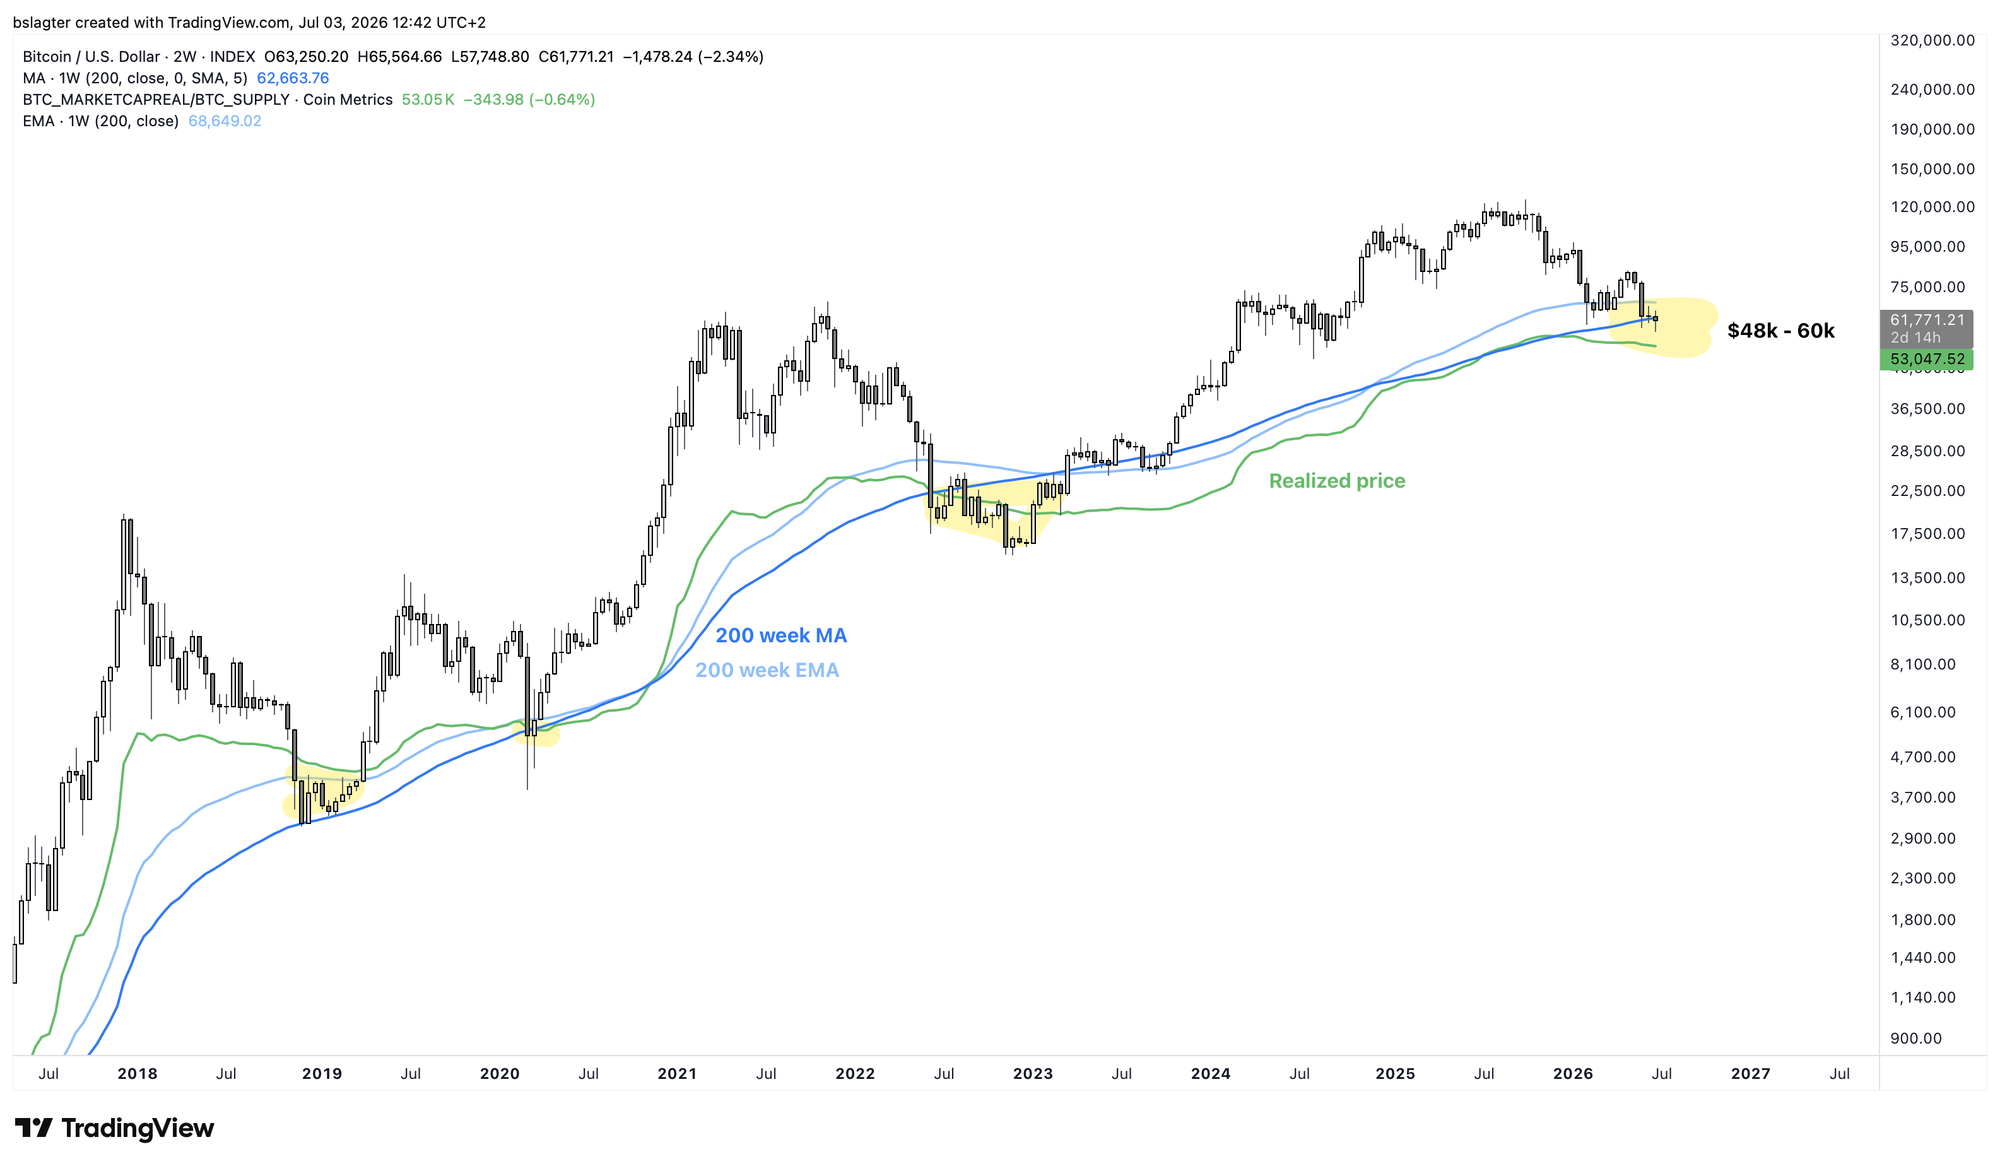
In our base case—a mild bear market—we've had the $48,000 to $60,000 range in mind for the bear market bottom since November. We're currently in the upper portion of this zone.
A bottom at $57,700 in July 2026 would be credible in terms of both time and price for a market cycle bottom. Somewhat early, and somewhat high, but possible.
This is the first time since we pulled the handbrake eight months ago that we're making this statement.
However, it's still (far) too early for action. It remains significantly more likely that the bottom lies ahead of us rather than behind us. But the balance is starting to shift.
What are we watching now?
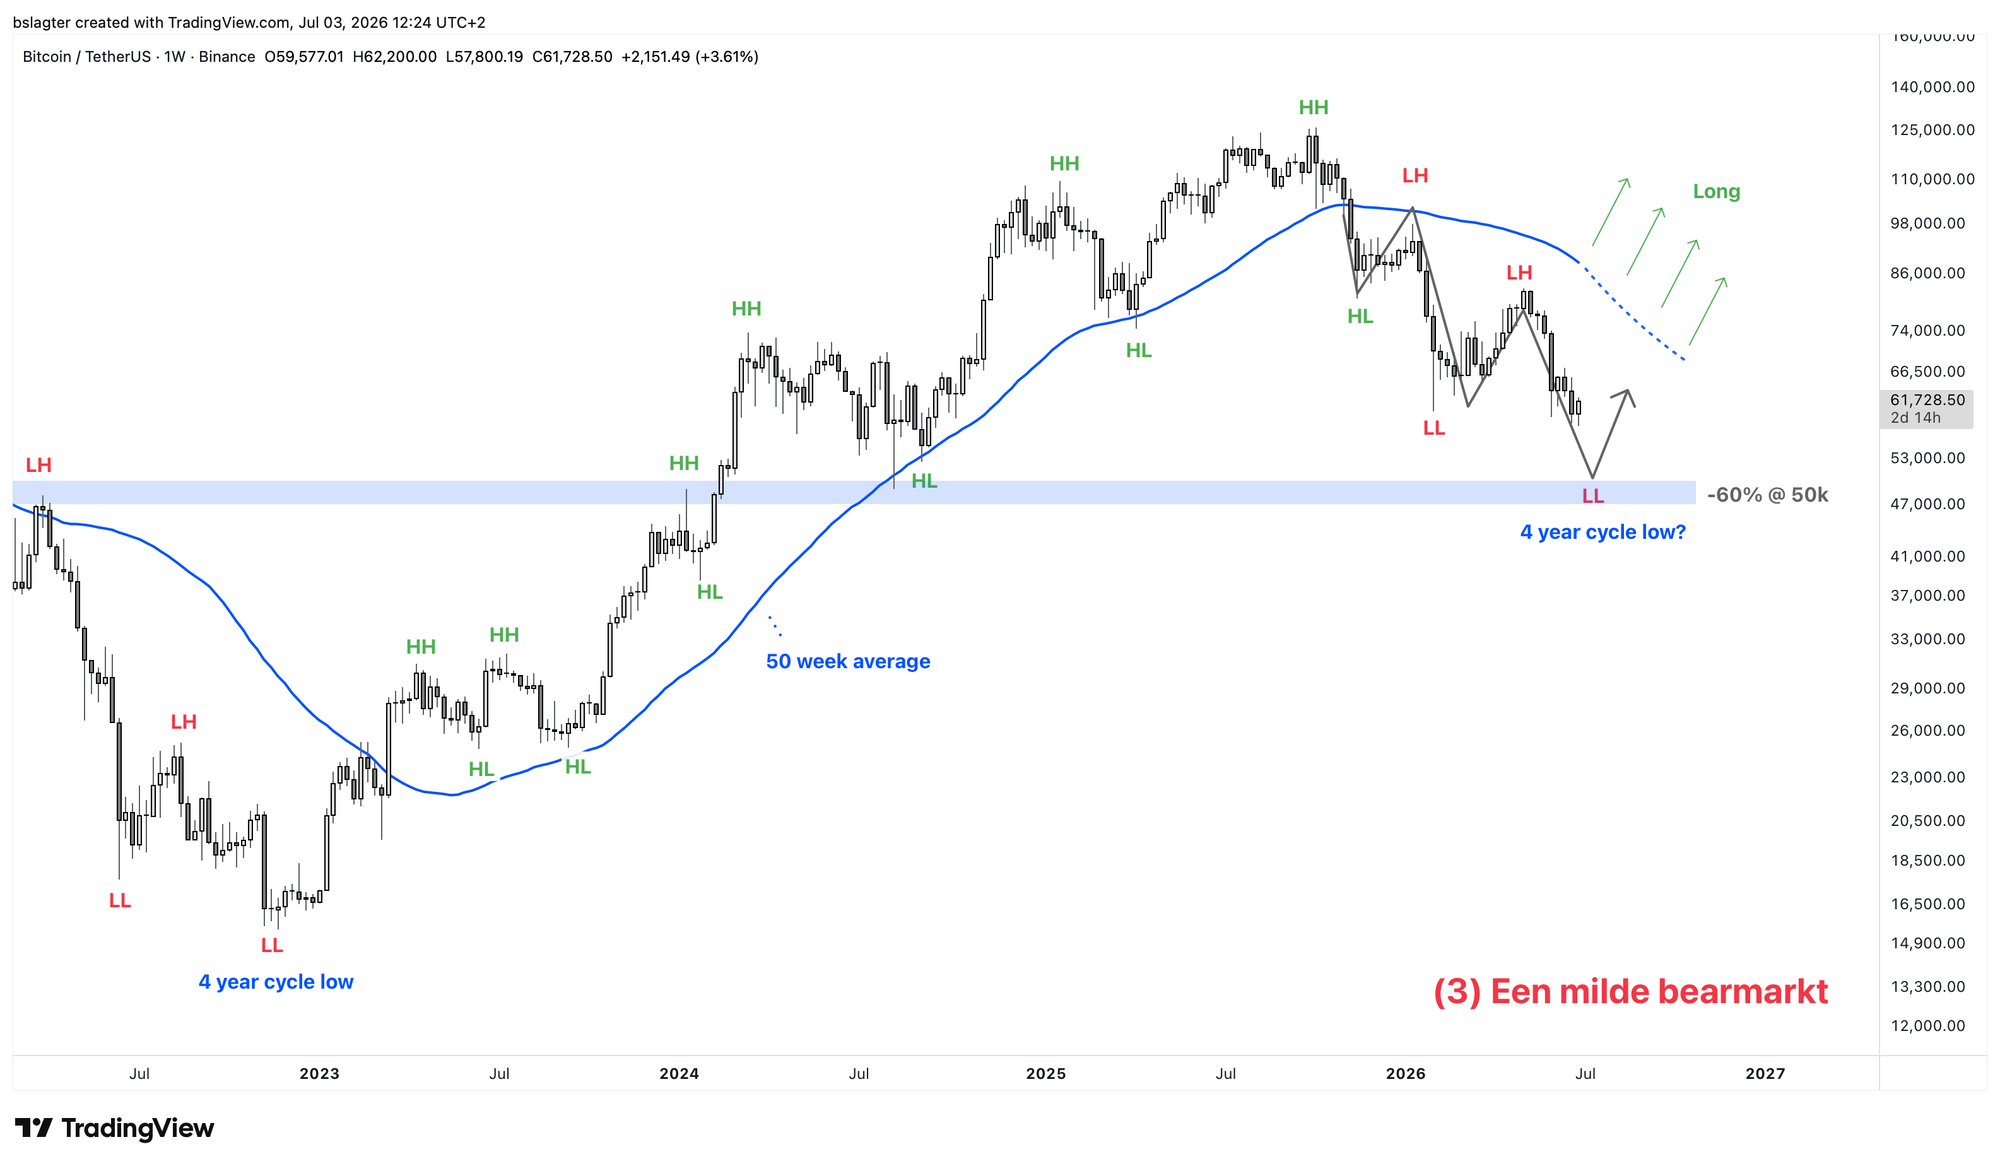
The early signals are the potential bullish divergences on the daily and weekly charts. More on that shortly. We'll get more confirmation when we see evidence of a new uptrend on the weekly chart:
⏹️ A higher low (HL) above the $57,700 of July 1
⏹️ A higher high (HH) above the $83,000 of May 6
⏹️ A weekly close above the 50-week moving average at $88,500
⏹️ A directional change of that moving average from declining to rising
We can currently check zero of these four boxes. So we still need some patience before "a new bull market" becomes our base case.
That doesn't mean you can't do anything. This part of the bear market is the ideal time to start building a position again. You can do this by buying at predetermined price levels, or by buying at a fixed interval—for example, weekly or monthly.
Just compare it to the last bear market. If you had started buying weekly 38 weeks after the top, you would have had an average entry price of $19,500 half a year later. Not the bottom, but still an extremely comfortable starting point for a new bull market!
We continue with the following topics for our Alpha Plus members:
- Bullish divergences
- 3.1 million bitcoin in new hands
- Weekly and monthly closes with significance
- The AI complex falters: is that an opportunity for bitcoin?
- Bitcoin gets breathing room from declining rate expectations
1️⃣ Bullish divergences
Bert
Bitcoin has a habit of developing divergences between price and indicators that measure the strength and conviction of the price movement at the end of bull and bear markets.
At the end of a bull market, price is still rising, but momentum and sentiment are already flattening. In a bear market, it's the mirror image. Price is still falling, but the force behind the decline is weakening.
A bullish divergence between price and the RSI on the weekly chart would therefore be an early signal that the bottom is behind us.
The problem is that you only know in hindsight when a divergence is complete, and whether it won't be extended or invalidated by further decline. That's why we're emphatically calling this a potential bullish divergence for now.
With that in mind, we can look at the weekly chart below, where a nice divergence is already becoming visible.
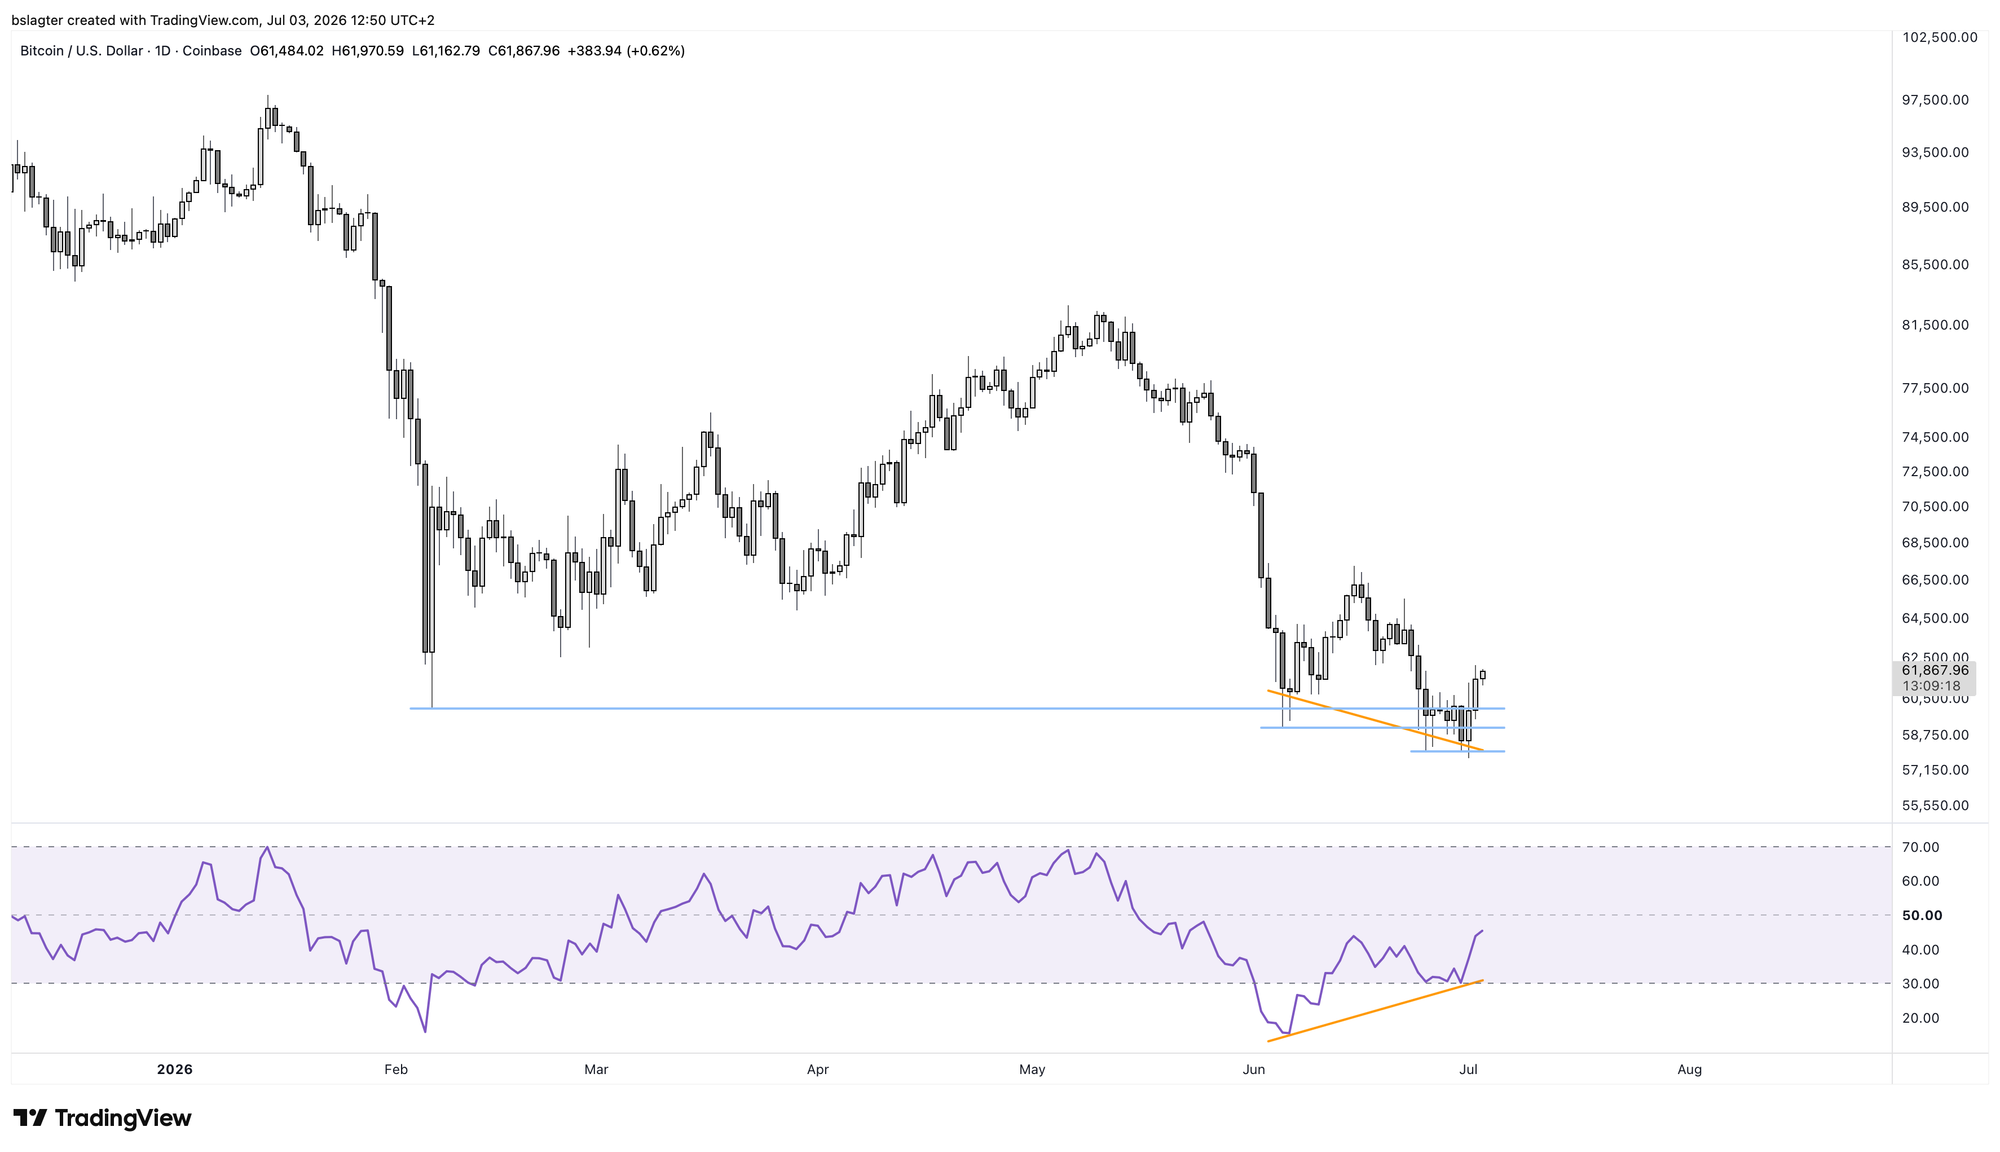
On a lower timeframe—the daily chart—potential bullish divergence is also emerging. Price kept making lower lows, first below $60,000, then below $59,000, and this week below $58,000. But the RSI didn't follow the pessimism.
A possible resolution is that we see a rally on the daily chart in the coming weeks that confirms this divergence. And that later this summer we go lower again—on the weekly chart potentially with a continuation of the divergence building there.
2️⃣ 3.1 million bitcoin in new hands
Bert
In a bear market, the focus is often on investors selling their bitcoin at a loss. Panic and capitulation. But for every seller, there's a buyer.
In fact, there are more buyers than panic sellers. After all, there are also sellers who got in long ago and are now calmly taking their still-handsome profits without any panic whatsoever.
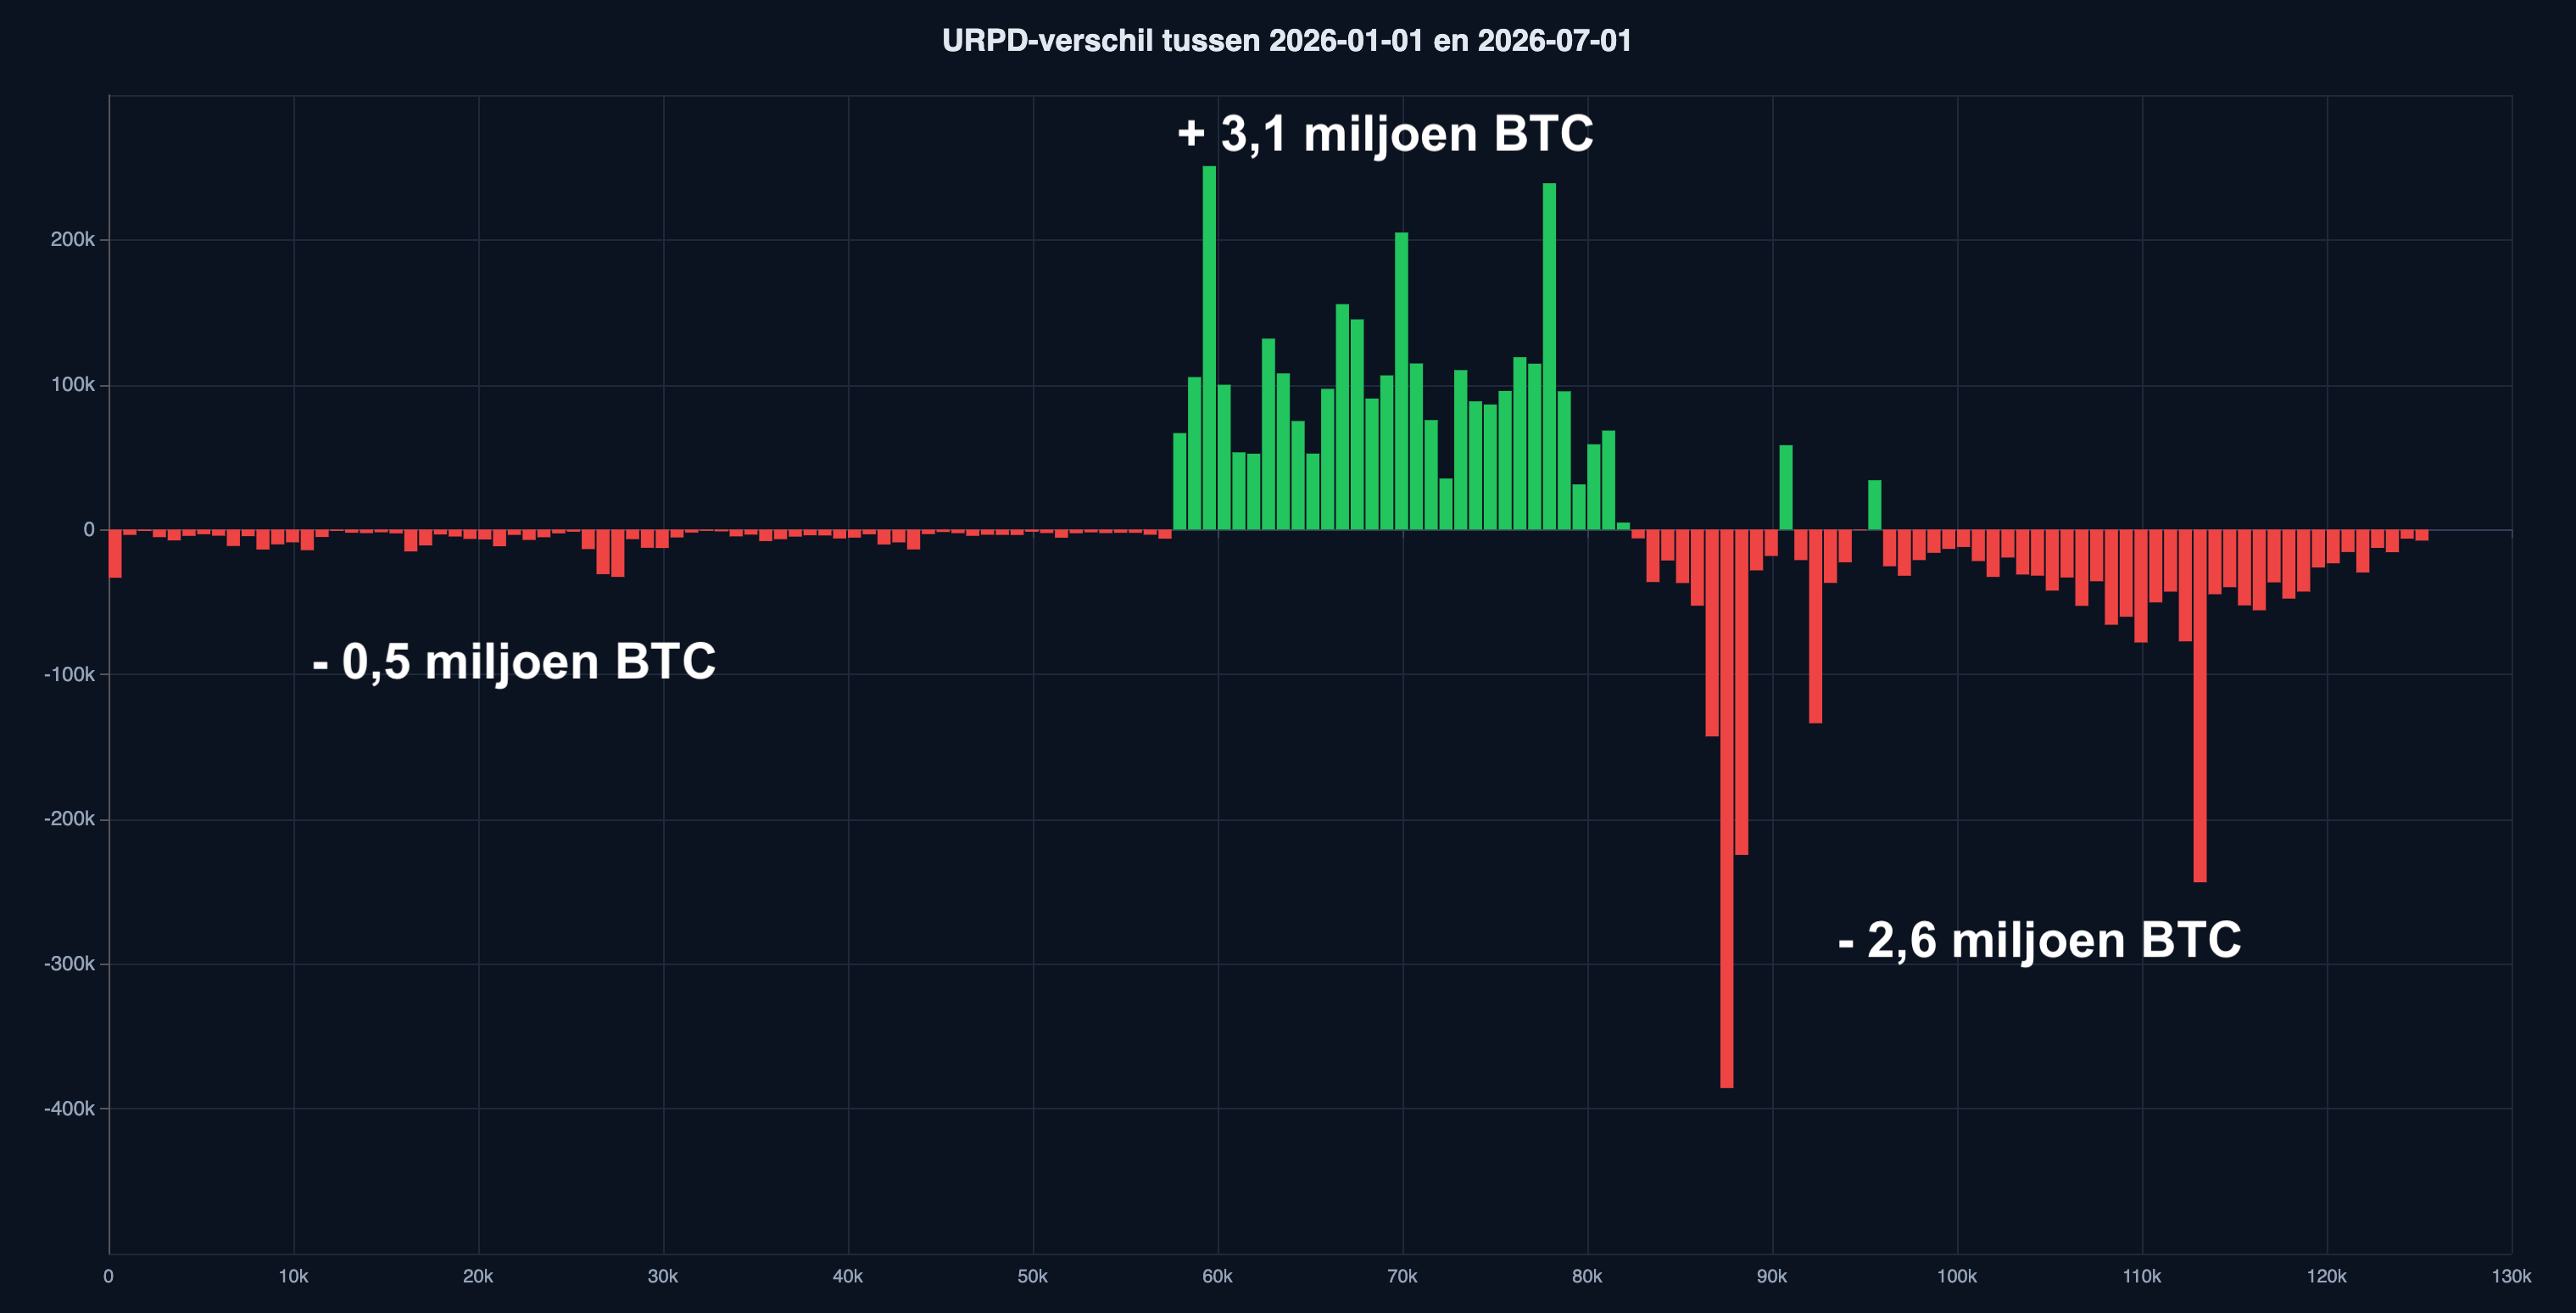
The chart below shows how that balance works out. It displays the shifts in cost basis between January 1 and July 1 of this year:
- The amount of bitcoin with a cost basis between $57,000 and $83,000 grew by 3.1 million coins.
- Of that, 2.6 million BTC came from above: sellers at a loss.
- And 0.5 million BTC came from lower prices: profit takers.
Most of the losses have been taken. At least, if price stays around $60,000. If we go a step lower—to (well) below $50,000—there's of course a whole new group that could capitulate.
3️⃣ Weekly and monthly closes with significance
Sam
As of last Tuesday, the first half of 2026 is already behind us. A half-year that saw bitcoin, after a slight rise in early January, drop from $98,000 to a low of $58,000. The month of June, the second quarter, and the first half of the year all closed on June 30 near this low, at $58,600.
We've now had three consecutive red quarters, which isn't unusual in bear markets. Historically, however, this does mean that the bulk of the bear market is now behind us—both in terms of price decline and time. This fits perfectly within our base case of a bottom forming in the coming months.
Looking at bitcoin's monthly close, we see a very clear close below the February low. This underscores the downtrend of lower highs and lower lows. It also means that we don't need a higher high near $98,000—that signal already comes via a monthly close above $83,000.
The weekly chart has also recently had a meaningful weekly close—the first weekly close below the February low. A weekly close above $67,000 would be a strong signal that the bear market bottom may well be in. It would mark the first higher high since the start of this bear market.
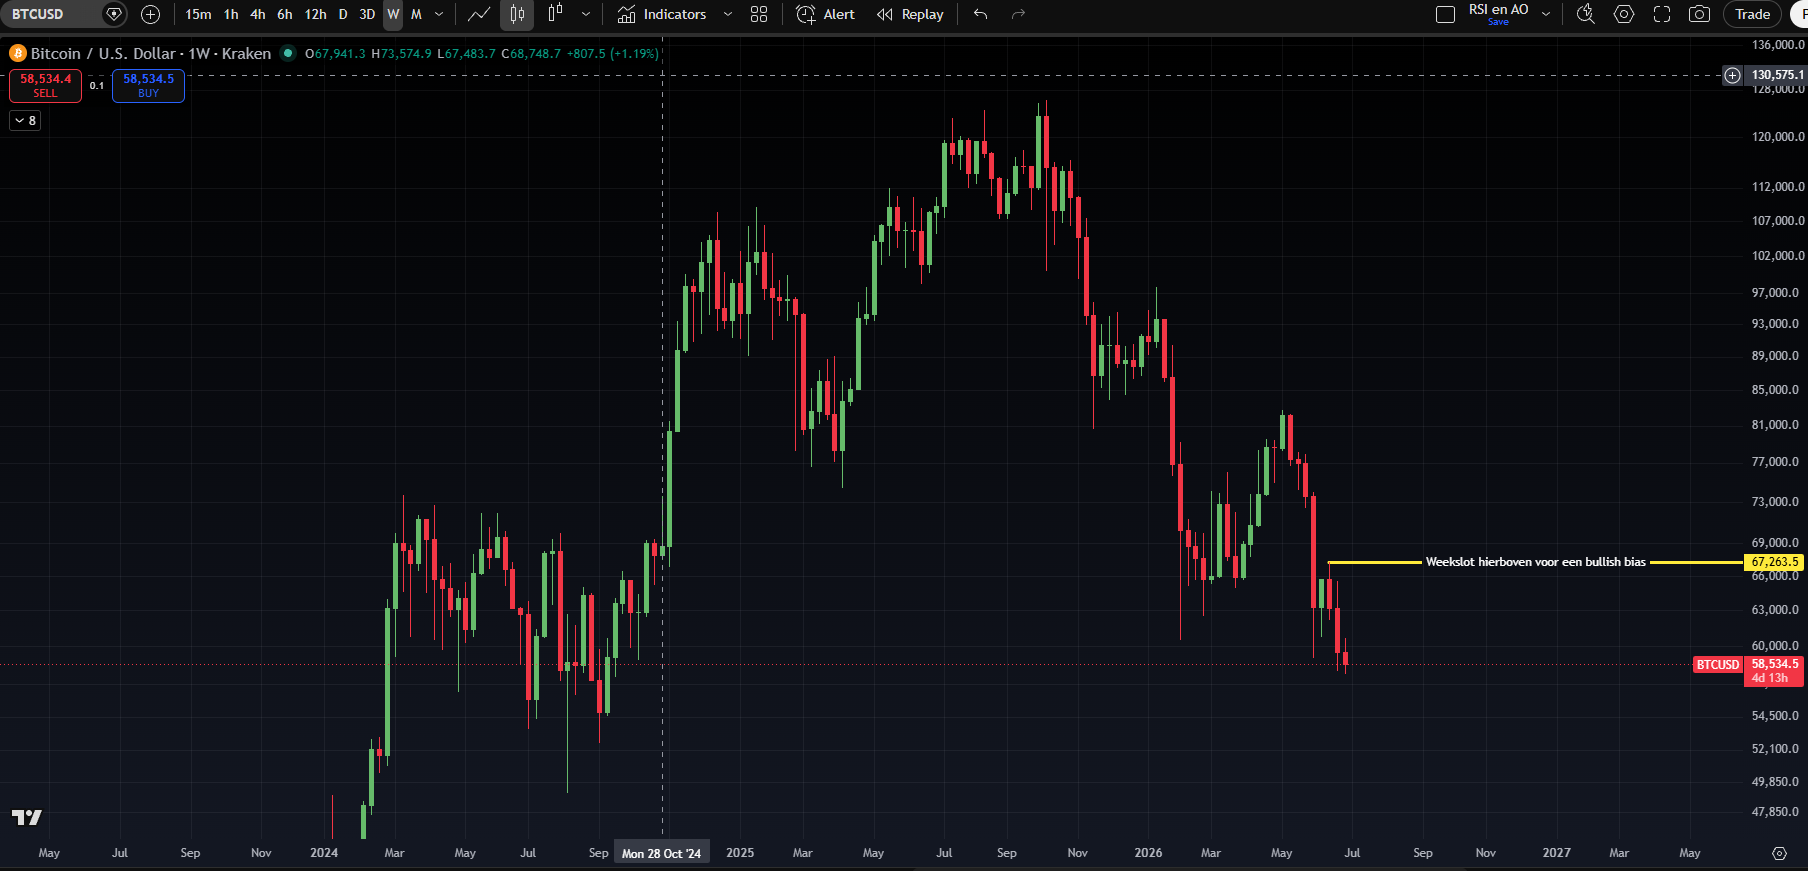
Finally, it's important to put the above into perspective. It hasn't been that long since we saw $67,000, so it can feel like the end of the bear market is right around the corner. I want to add two caveats, however:
- The current trend is down, so we assume lower prices until proven otherwise;
- Even if a weekly close above $67,000 follows, it would likely be followed by a period of sideways action and/or the formation of a higher low that still tests conviction and confidence.
4️⃣ The AI complex falters: is that an opportunity for bitcoin?
Thom
The AI complex on the stock market has suddenly entered a difficult phase. Last quarter's winners are under pressure, but for now there doesn't appear to be a broad risk-off moment.
Generally speaking, the broader market indices are holding up better than the chip companies. Europe is also doing a bit better outside of tech, while consumer-facing companies are cautiously recovering.
At the same time, we see bitcoin and gold rising a few percent. This comes after oil prices have declined further, tensions in the Middle East have somewhat eased, and the market is starting to price in a slightly less aggressive Federal Reserve.
That shift gained momentum on Wednesday after Kevin Warsh indicated that inflation expectations have cooled somewhat since the rate decision on June 17.
Still, the big question remains what exactly is driving this cautious rotation. Is this primarily the result of selling pressure in AI leaders, or is there genuinely renewed risk appetite? If the AI complex keeps falling while the rest of the market only rises due to a temporary easing in rate expectations, that's not a particularly solid foundation for a durable rotation.
Personally, I expect this is mainly a reset of positioning within the chip complex. My hunch is that we're not looking at the end of the AI bull market, but rather that an opportunity is emerging to add positions at more attractive prices. That's my plan, at least.
Given the enormous potential of the technology, it seems unlikely to me that enthusiasm for AI will fade significantly anytime soon. The combination of robotics and artificial intelligence alone opens up vistas that investors can probably ride for years to come.
Additionally, AI is playing an increasingly significant geopolitical role. America wants to keep its best models out of foreign hands, while Europe is cautiously wondering whether it should open the funding spigot for AI further.
All things considered, I see too many strong arguments for a continuation of the AI bull market.
For bitcoin, that doesn't immediately create the best outlook. In theory, it means the digital asset could remain on the back burner for a while longer. On the other hand, it's questionable whether the end of the AI bull run would produce a better scenario. If that were to happen, the odds of a recession would probably increase.
5️⃣ Bitcoin gets breathing room from declining rate expectations
Thom
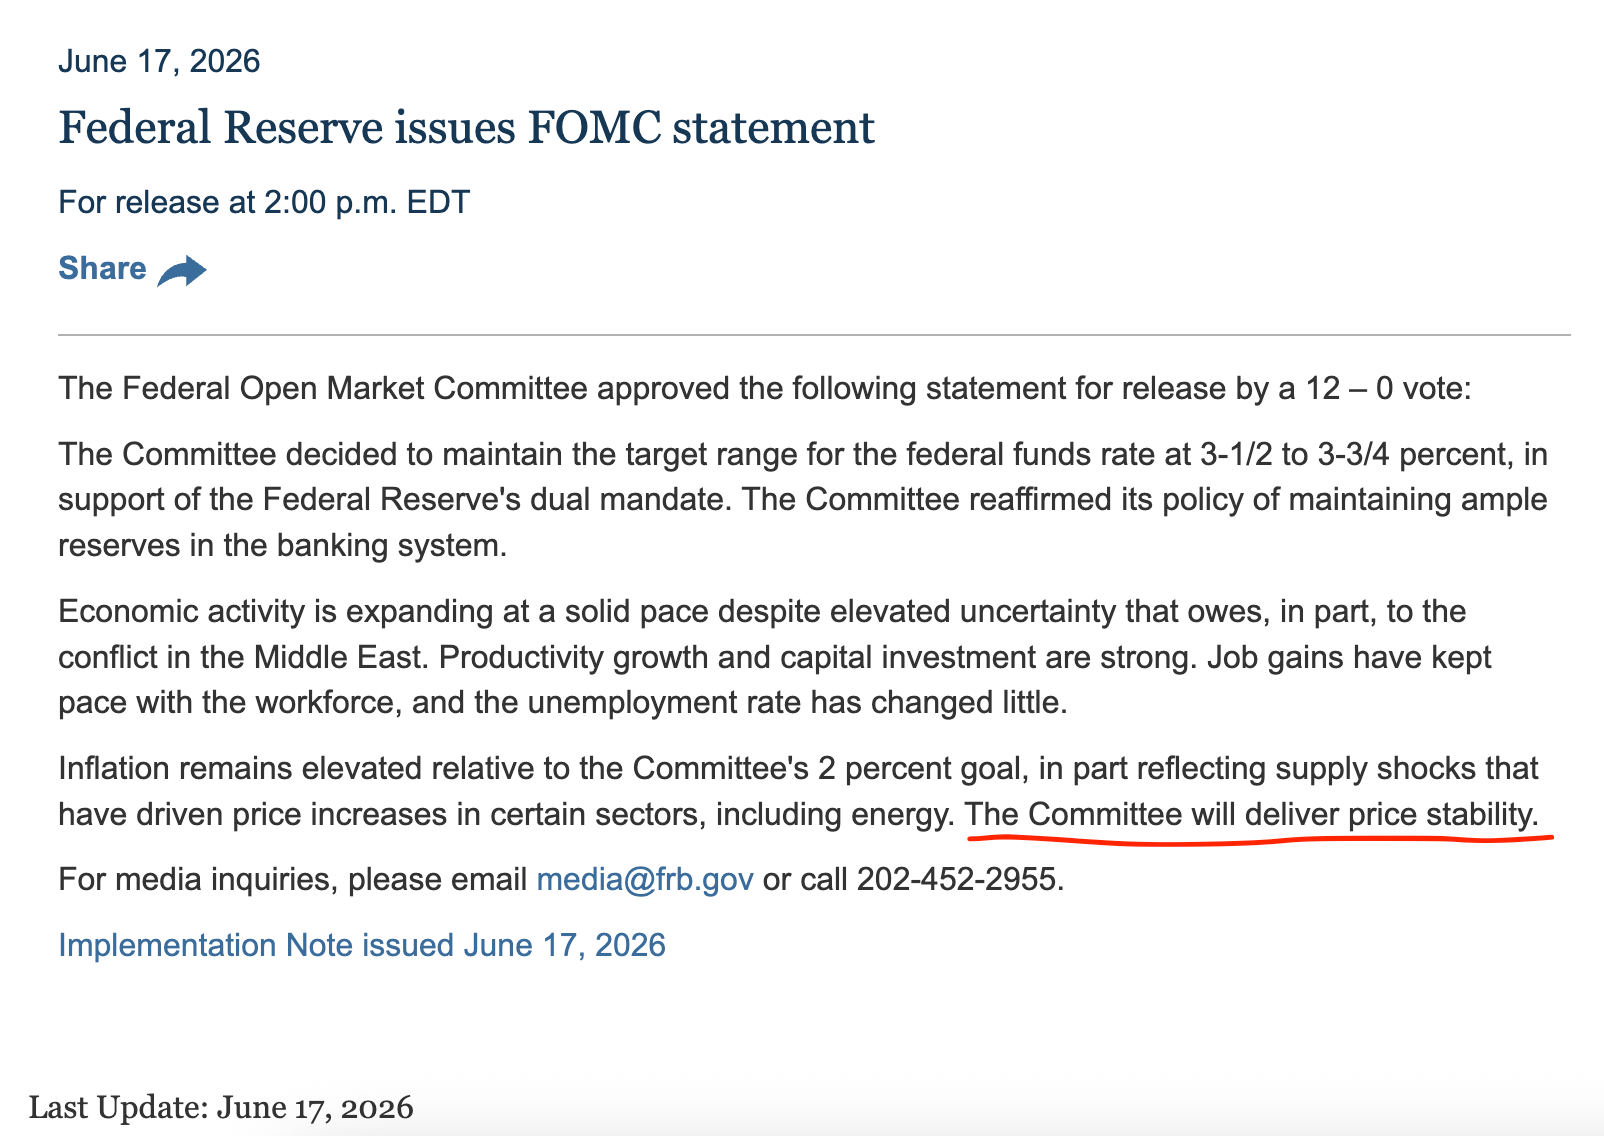
Kevin Warsh's first rate meeting as Federal Reserve Chair was interpreted by the market as hawkish. That reading stemmed in part from the FOMC statement, which explicitly stated: "The Committee will deliver price stability." It also didn't help that the dot plot showed nine committee members suddenly projecting one or more rate hikes for 2026.
As a result, the market began pricing in roughly one and a half rate hikes for 2026. That gave the US dollar a tailwind, while bitcoin—as a non-yield-bearing asset—came under additional pressure.
The big question, of course, is whether the Fed will actually follow through with those rate hike(s). If not, that should in theory provide an upward force for the bitcoin price.
Based on current conditions, my base case is that rate hikes are unlikely:
- The rise in oil prices was the primary driver behind the resurgence in inflation and rates. Oil has since fallen back to pre-war levels, meaning rates should theoretically follow. Inflation expectations have already dropped sharply.
- Kevin Warsh acknowledged on Wednesday that inflation expectations have declined since the Fed's rate decision. That likely triggered the brief bounce in the bitcoin price.
- Job growth has been stronger than expected in recent months, but according to Bank of America, the FIFA World Cup in the United States is playing a significant role in that. As a result, the numbers may paint a slightly rosier picture than reality. They argue that the labor market is probably somewhat weaker than the headline figures suggest. That narrows the room for rate hikes. Thursday's jobs report seems to confirm this.
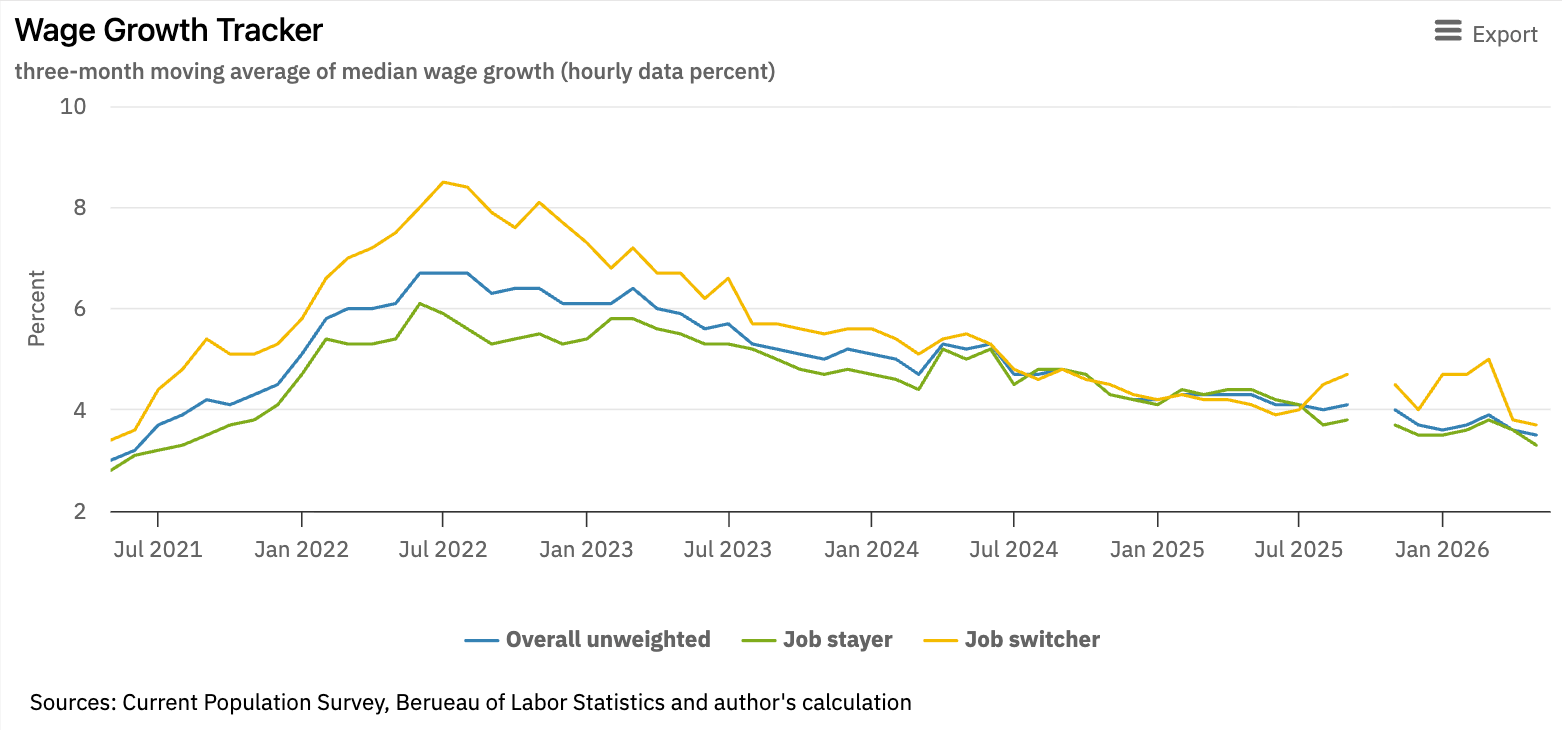
- Furthermore, wage growth currently poses no clear inflation risk. The chart below shows that wage growth has been in a declining trend since 2022 and has now fallen to its lowest level since 2021.
All things considered, I see insufficient arguments for rate hikes. The market appears to be slowly reaching the same conclusion.
With the decline in oil prices, the original catalyst for renewed inflation fears has largely disappeared, while the labor market also doesn't seem to present clear risks.
In theory, this could produce a period in which bitcoin can at least catch its breath and possibly even find a definitive bottom for this bear market.
Especially when you combine it with the bullish divergences discussed earlier in Markets, which are currently visible across multiple timeframes. Other technical bottoming signals are also cautiously pointing in the same direction.
In closing
All previous editions of Alpha Markets can be found in the archive. Questions, comments, and suggestions are always welcome in the community.
Thank you for reading!
To stay informed about the latest market developments and insights, follow our team members on X:
- Bart Mol (@Bart_Mol)
- Peter Slagter (@pesla)
- Bert Slagter (@bslagter)
- Mike Lelieveld (@mlelieveld)
We appreciate your continued support and look forward to bringing you more comprehensive analysis in our next edition.
Until then!