Nasdaq at All-Time High — Will Bitcoin Follow?
The S&P 500 and Nasdaq 100 just hit all-time highs. Bitcoin edged up slightly but remains far from its record. Stocks are surging, bullish news keeps stacking — yet BTC barely moves. Is change coming soon?

In the Alpha Markets edition from two weeks ago, we briefly discussed the crossroads the stock market had reached:
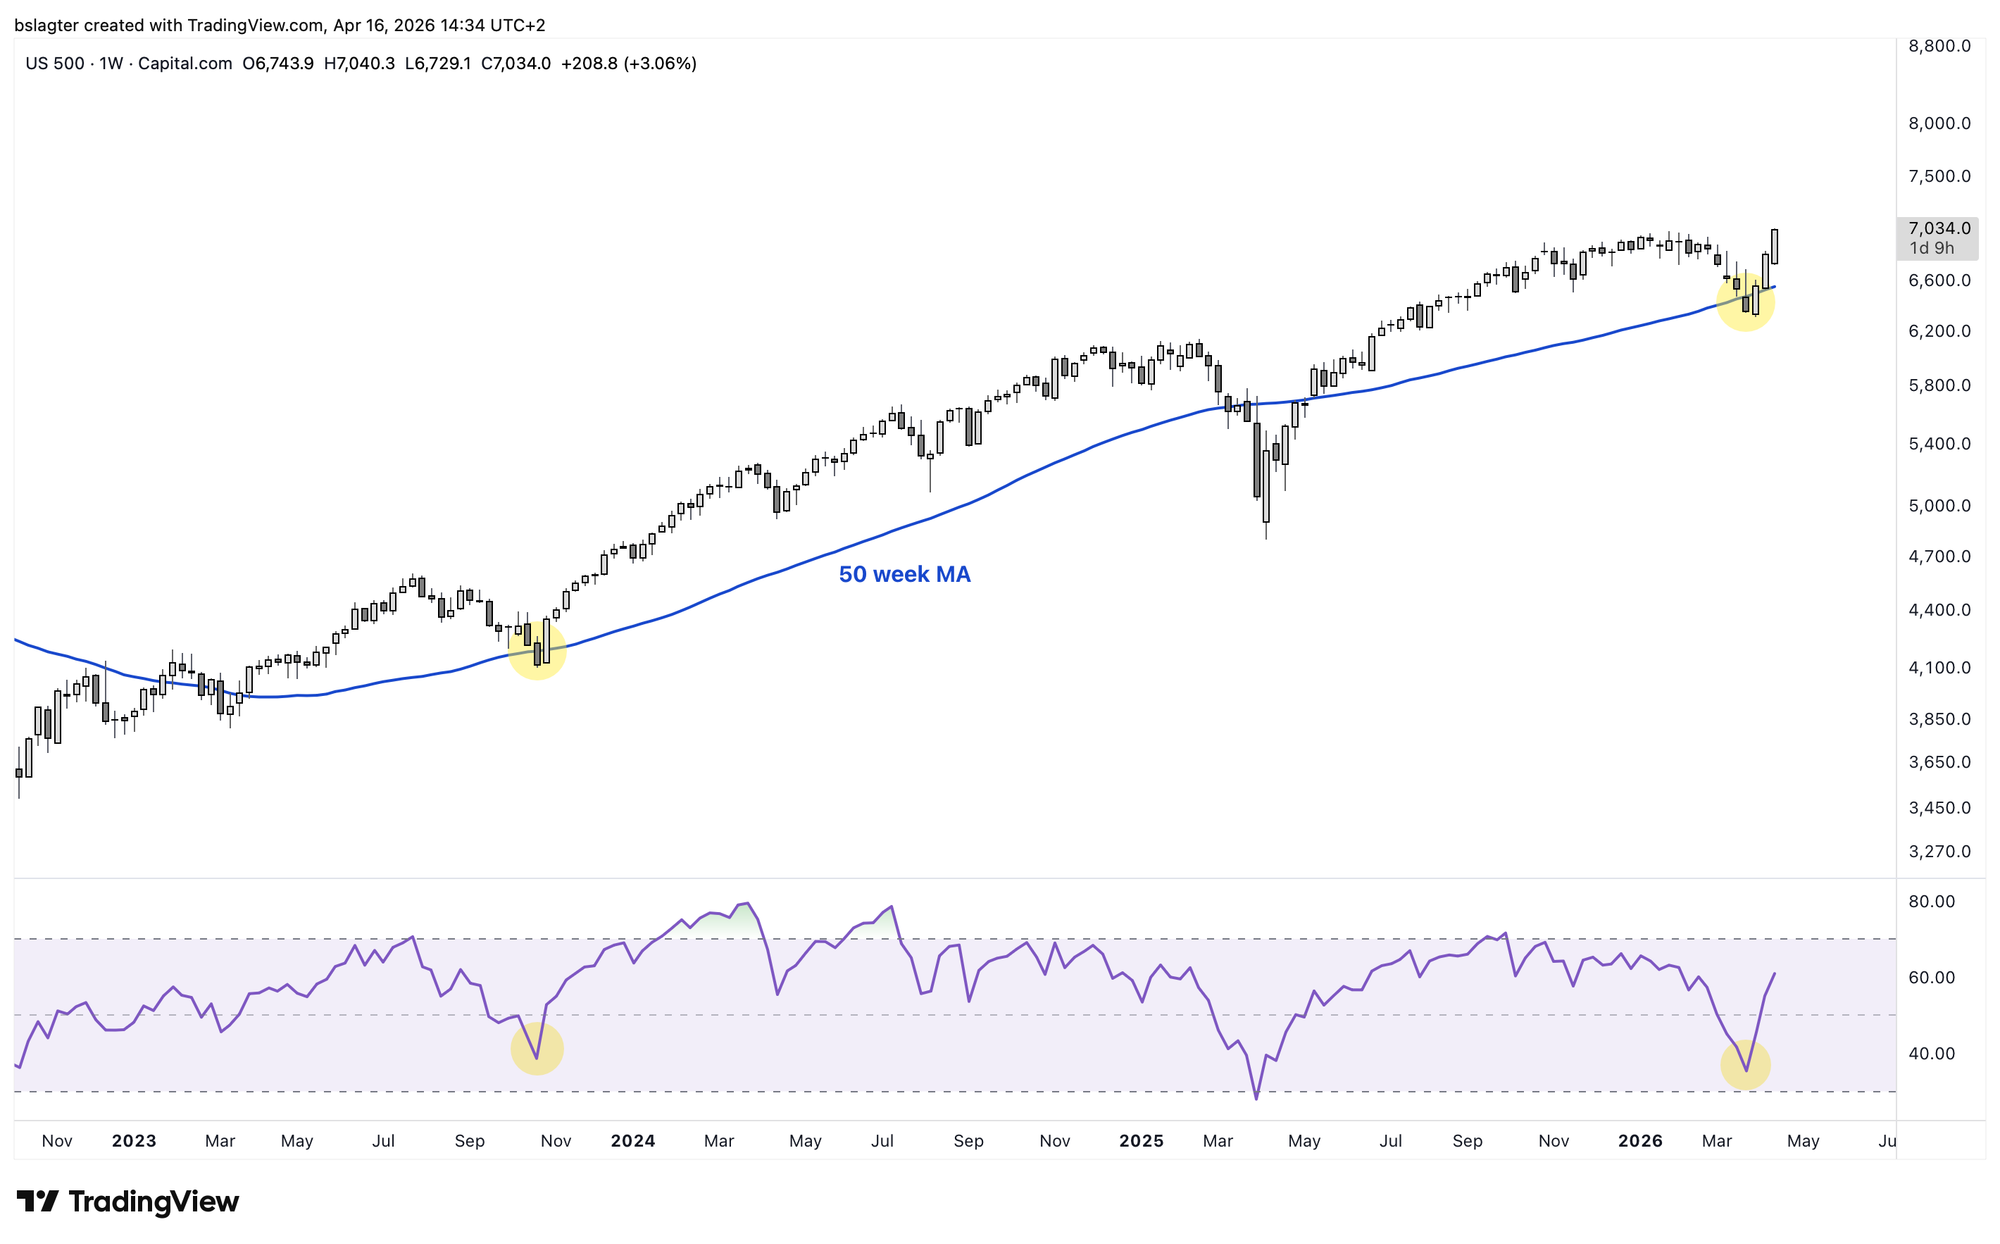
[Stocks] are flirting with their dominant moving averages. They're declining toward support levels. On the verge of a serious shift into a bear market, but also poised for a new period of gains. The S&P 500 now has a similar setup to October 2023.
Last weekend, following a stellar weekly close, the stock market was already leaning heavily toward the bullish scenario. On Discord (and on the Markets tab in the Bitcoin Alpha app) we shared the following:
Odds of a new rally phase for stocks have increased
Based on cycle analysis, we expected a longer period of weakness for stocks — the declining leg of the market cycle on its way to the yearly cycle low later this year.
But technical analysis tells a different story:
- A weekly close above dominant moving averages
- A weekly close above the 50%–61.8% retracement
- A weekly close above the descending trendline from the top
- An intra-week gap left unfilled (often bullish)
- The Nasdaq closing green for eight consecutive days
These are signals that the market wants to go higher.
And that's exactly what happened. This week, the S&P 500 and Nasdaq 100 reached an all-time high. From the bottom to new records in three weeks.
You can broadly group the analyses of this move into three camps:
- This is a new cycle of economic growth, spending, corporate earnings, and valuations. We have years of growth ahead of us. Think of it like the summer of 2020, when the PMI crossed back above 50 after a year of contraction.
- This was a mid-cycle correction in the cycle that began after the 2022 bear market. The Nasdaq 100 dropped 38% back then and bottomed in October 2022. Now we're continuing the bull market. Raoul Pal, for example, is in this camp.
- This is the last gasp of this market cycle — a final blow-off top lasting maybe another month or two. A 'complacency top' where price may push higher, but enthusiasm is already fading.
"Bull markets climb a wall of worry," as the saying goes. That means there are positive signals, but investors don't fully trust them.
One example of such a concern: the S&P 500 is at an all-time high, but it's being driven by just a handful of stocks. A large portion of the market is still well below its highs from a few months ago.
One sector that is performing well is financials. They've had an outstanding quarter. Presumably they're benefiting from the trading activity triggered by the war in Iran. Not exactly a great narrative for a sustained bull market.
Another driving force behind the recent rally is AI. And not the promise of future productivity, but the money being made from current usage and the investments being deployed right now: chips, networking, storage, data centers.
We believe the market will look through the worries in the coming months and indeed begin a longer period of gains. Whether it's a new economic growth cycle (analysis 1) or the second half of a long cycle (analysis 2) — we don't really mind either way.
A compelling argument is that current sentiment is highly unusual for major tops. Investors are cautious, worried, skeptical, and seeking downside protection. Major tops are characterized by hype, euphoria, and unbridled optimism. Think back to the atmosphere in the first half of 2021 and the winter of 2024.
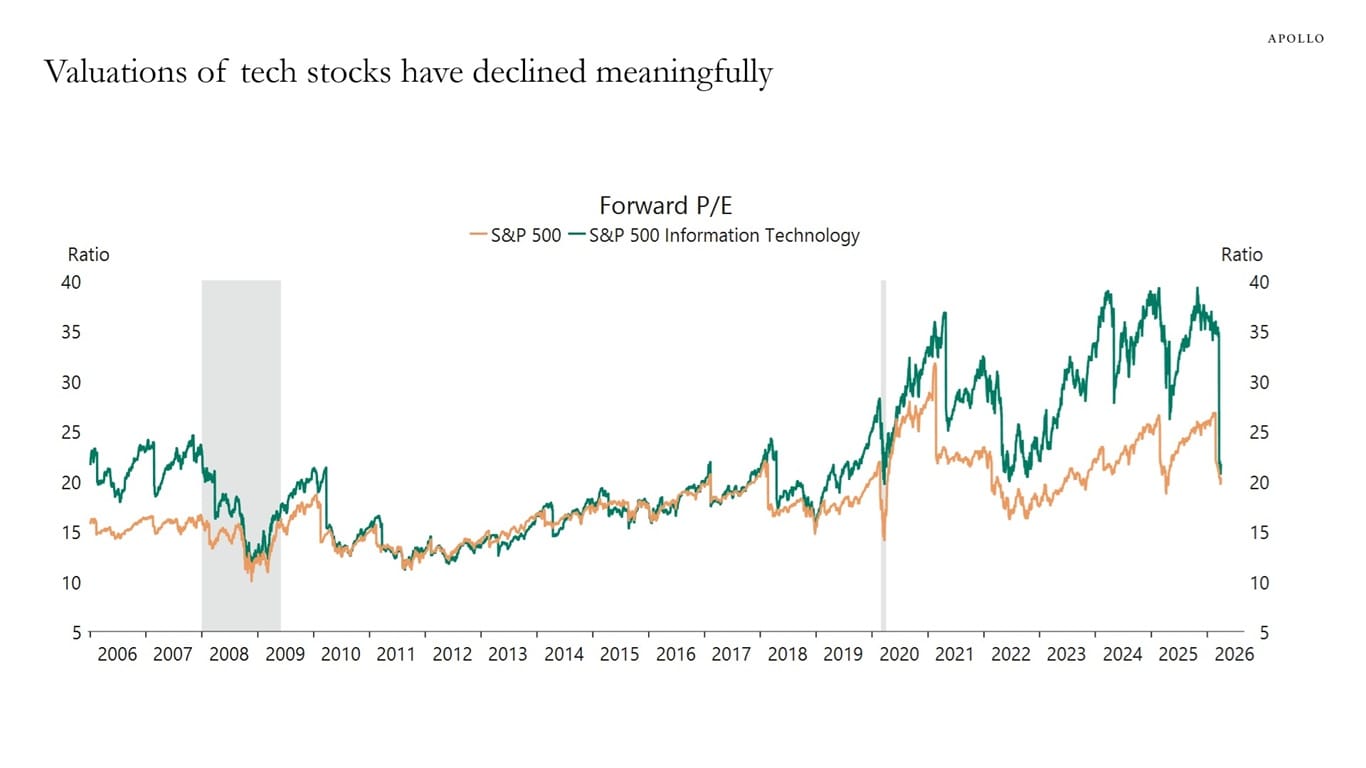
Torsten Slok of Apollo wrote a piece titled "Tech valuations back to pre-AI boom levels." The chart below goes with it. The forward P/E has fallen from 40 to 20. You're now paying 20x expected earnings instead of 40x, which is roughly the average from the decades before ChatGPT's release in 2022.
You could say: the promise of AI is still intact, but the froth that built up in the bubble has been squeezed out over recent months.
That could be what pushes against the wall of worry in the coming period. One by one, investors capitulate: maybe this is actually a good time to increase their AI exposure. Until eventually everyone turns optimistic. That's when you need to be careful — because those are the conditions in which major tops are formed.
All well and good, but what does this mean for bitcoin?
During the war, bitcoin stood out for its unexpectedly resilient price action. Now the opposite is true. Stocks are surging, but bitcoin is going nowhere.
You could argue this is still good news. After all, it confirms the low correlation with other asset classes, and therefore its beneficial role in a diversified portfolio. But it doesn't feel like good news.
The explanation is probably simple: bitcoin is in a (cyclical) bear market and needs more time to work through it.
It's a peculiar mix:
- Stocks are rallying to all-time highs.
- Plenty of bullish news for bitcoin and the crypto space.
- Six of the past seven weeks saw inflows into crypto funds.
- During the same period, Strategy bought 63,767 BTC.
And yet the price barely moves.
Surprising? Not at all — that's how bear markets work. In a bear market, good news gets ignored and bad news gets amplified. Think of all the attention around quantum computing and the concerns over the Clarity Act.
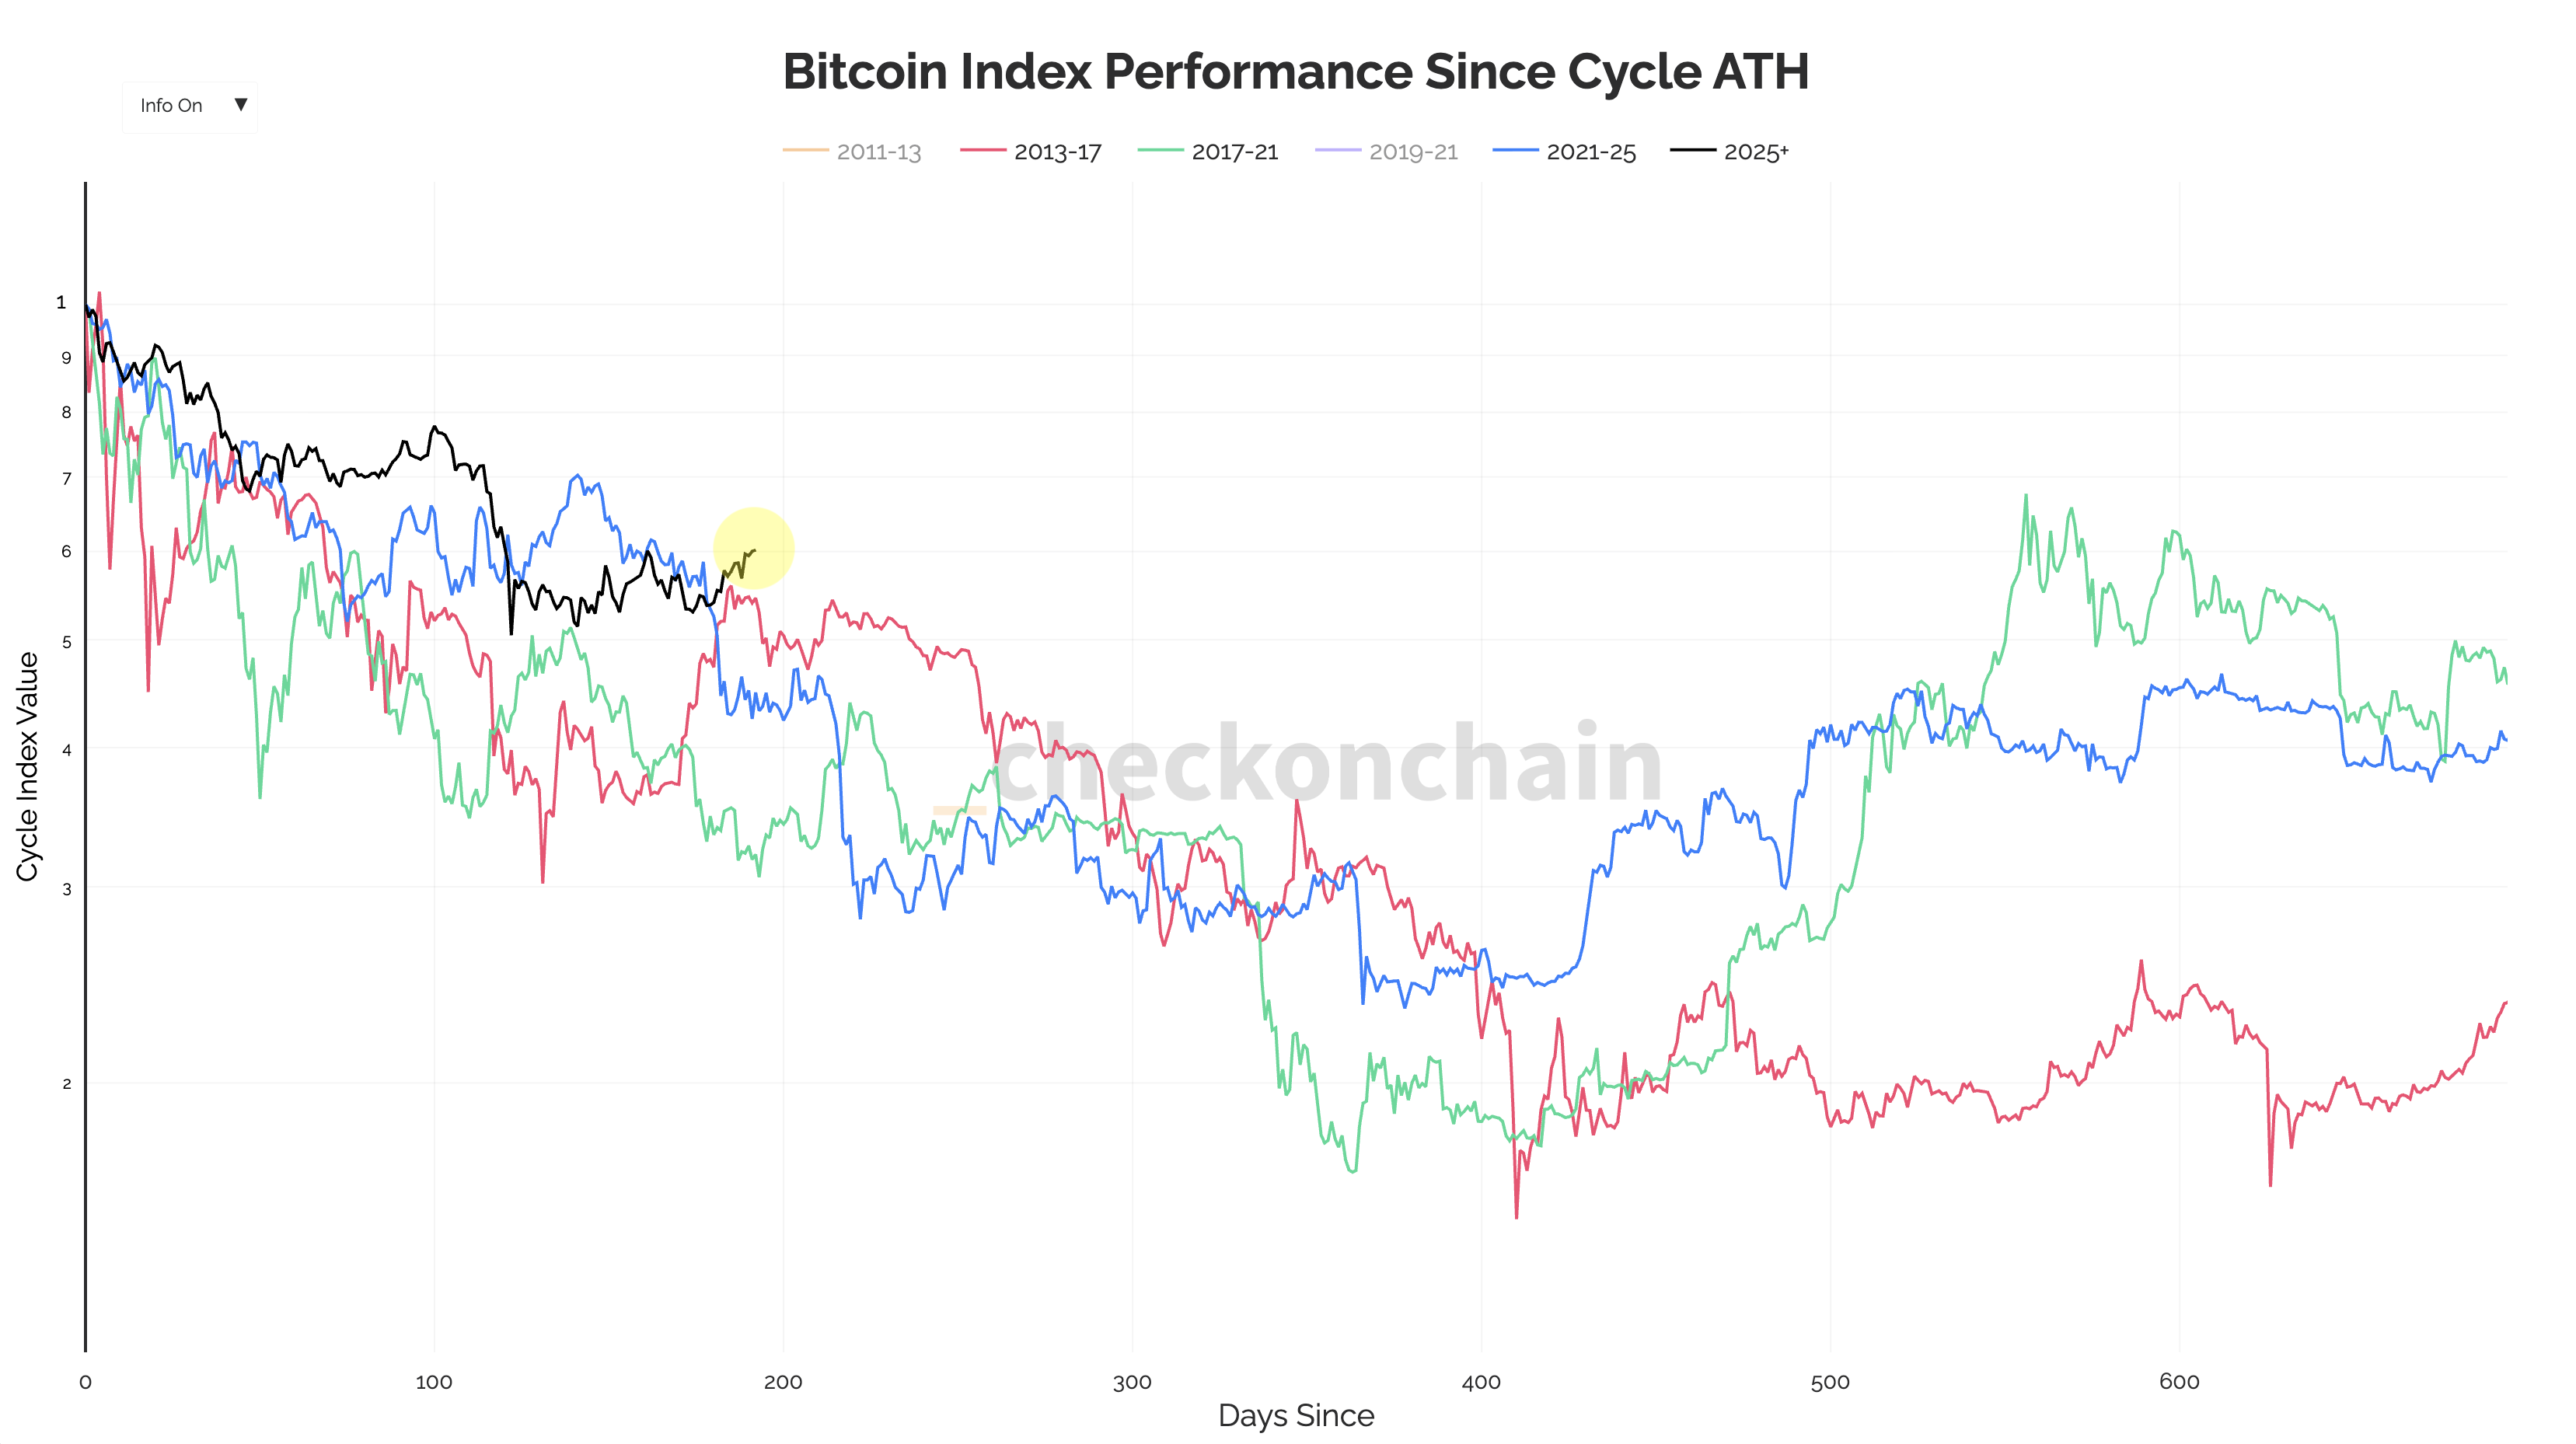
The chart below shows the trajectory of the bear markets following the tops of 2013, 2017, 2021, and 2025. Today, on day 196 after the top, this bear market is the mildest of the four. Perhaps the effect of the tailwinds (see also Thom's sections further down) isn't that we'll be back at an all-time high soon like stocks, but rather that this bear market stays mild.
We continue with the following topics for our Alpha Plus members:
- Who has been selling over the past months?
- How is ETH faring in this bear market?
- The power of three
- Falling real rates as a tailwind for bitcoin
- Easing financial conditions as a tailwind for bitcoin
1️⃣ Who has been selling over the past months?
Bert
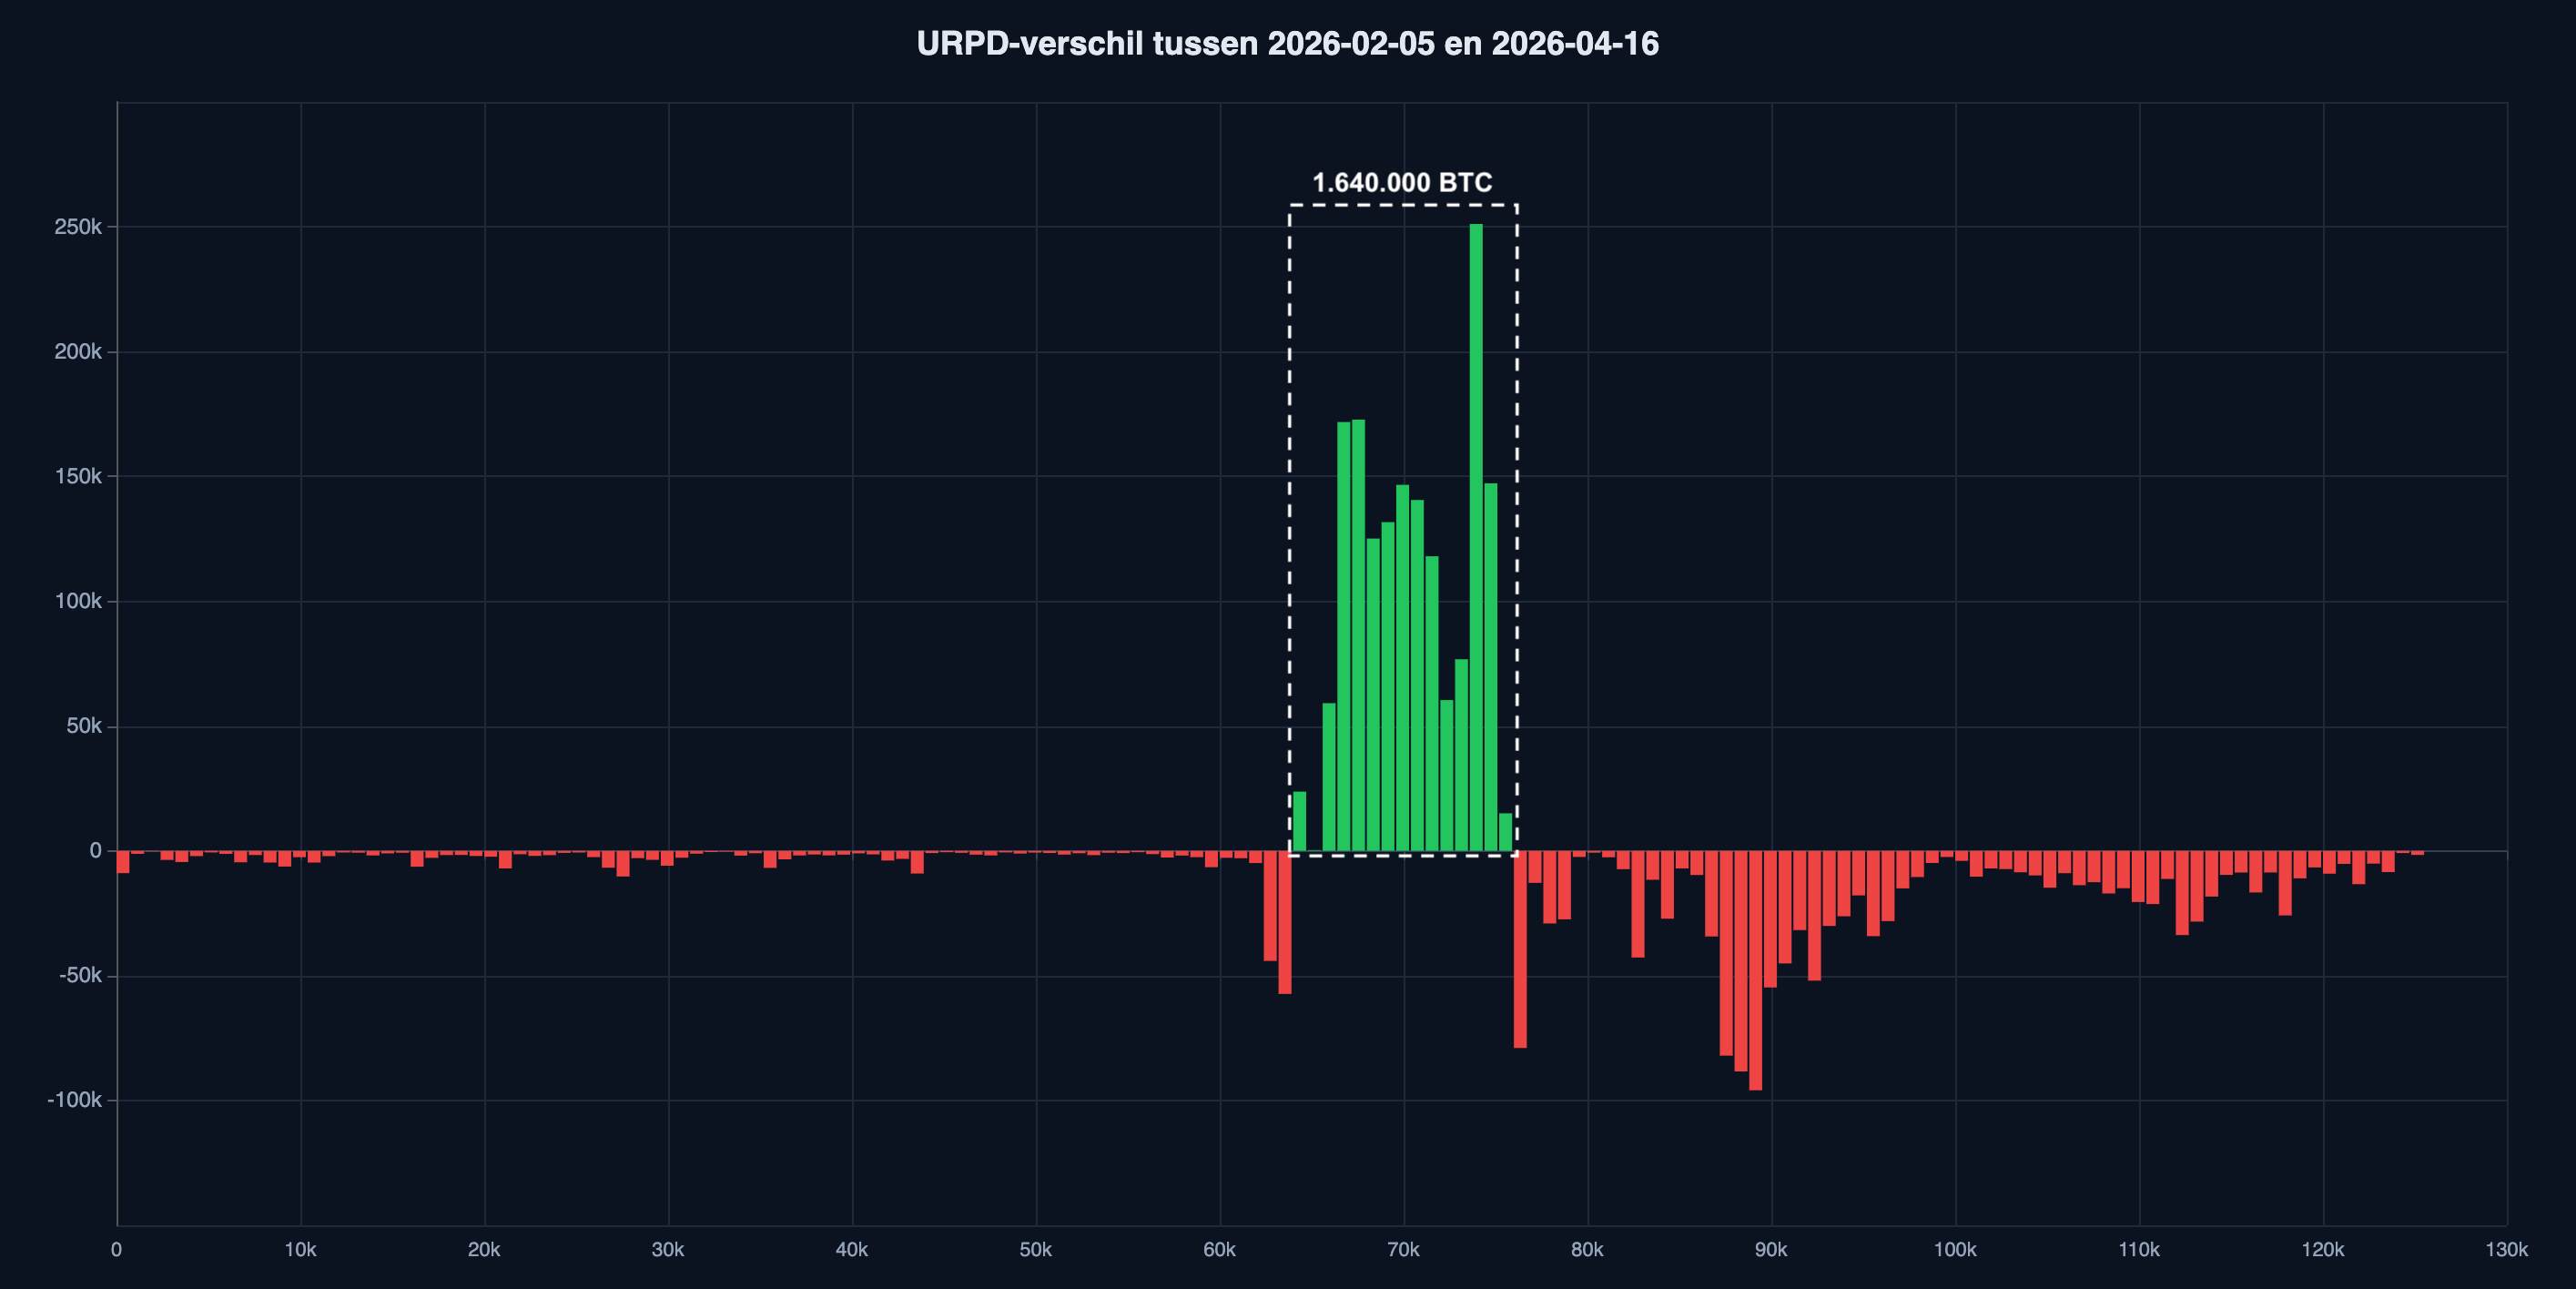
Since February 5, the bitcoin price has mostly traded between $65,000 and $75,000. Over the past ten weeks, buyers have accumulated 1.6 million BTC. The chart below shows which price buckets gained bitcoin and where it came from.
300,000 BTC came from sellers who originally bought bitcoin at prices below $64,000. There aren't many 'old' investors left who are still taking profits.
1,310,000 BTC came from sellers who originally bought bitcoin at prices above $76,000. So most of the supply comes from people who 'bought the top' and are now exiting at a loss.
Note that short-term trading has been largely filtered out. If you bought and sold 20 times within this time period, it only counts once. And exchange trading doesn't show up in on-chain data at all. That's quite a lot — 1.6 million!
In the video below you can see how this transfer of bitcoin between February 5 and April 16 unfolded. It all progresses quite evenly. No major shocks.
This is the process we need to go through in a bear market. At current prices, there's plenty of demand for bitcoin, and there are no strong indications that this demand is drying up. However, it's plausible that fewer and fewer investors are willing to sell at the current price.
Investors who accumulate during a bear market are patient. They wait until there's not a single satoshi left to be had at these prices. But then they'll have no choice — they'll have to pay up to unlock supply from existing holders: a new uptrend can begin!
2️⃣ How is ETH faring in this bear market?
Bert
We don't often talk about tokens other than bitcoin during bear markets. There's usually little to say. They drift along with bitcoin, and during capitulation events they take bigger hits to the downside. With the occasional exception.
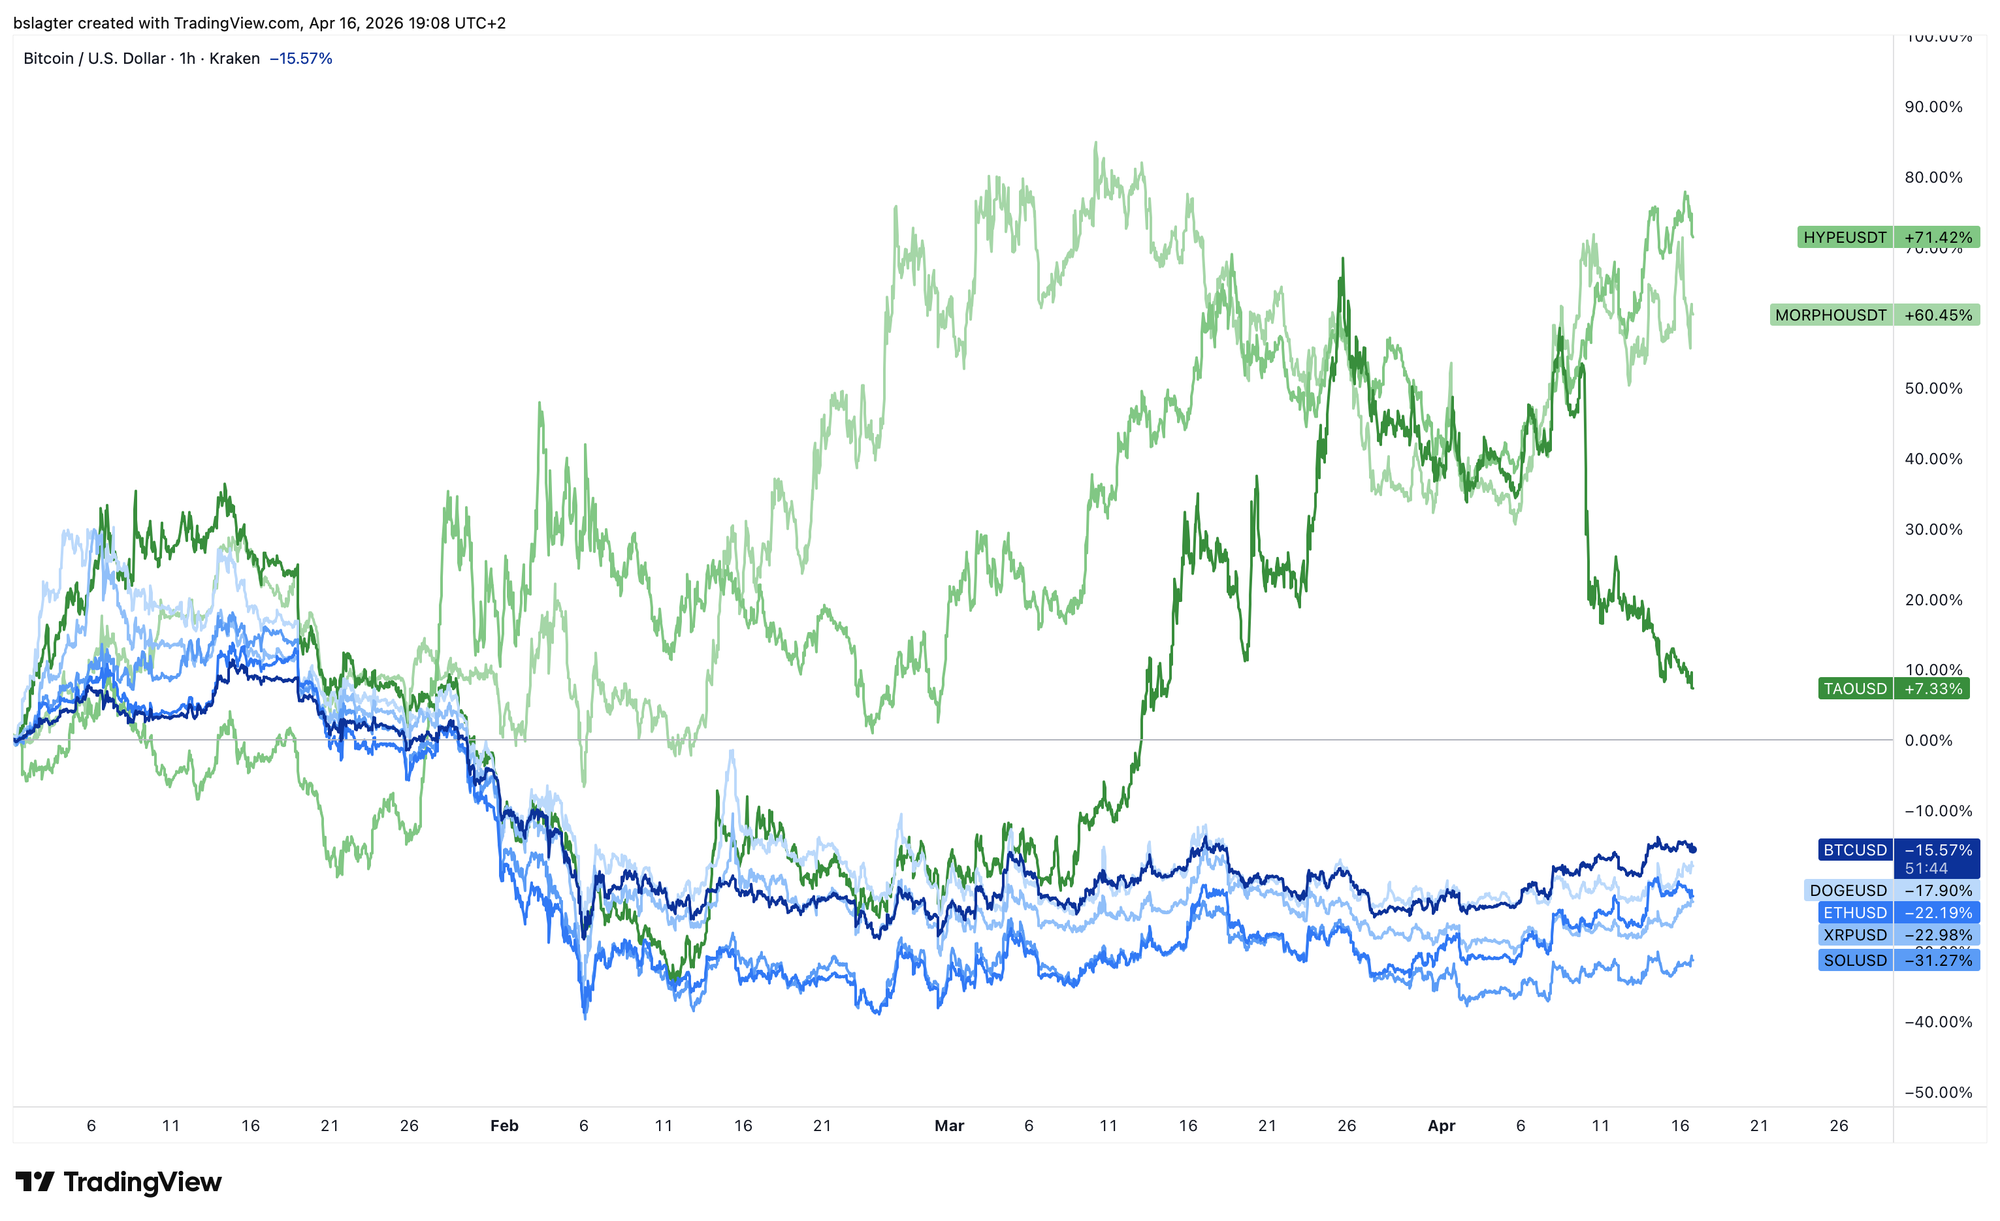
The chart below shows BTC, ETH, SOL, XRP, and DOGE in blue, and HYPE, TAO, and MORPHO in green. Exceptions are often fragile. They break away, ride at the front of the peloton for a while, but soon fall back to the pack.
Someone asked me on Discord how ether is doing — whether our base case for bitcoin also applies to the number two cryptocurrency.
That's not a given. ETH has a less clear cycle, less usable on-chain data, and no clear interaction with a dominant moving average.
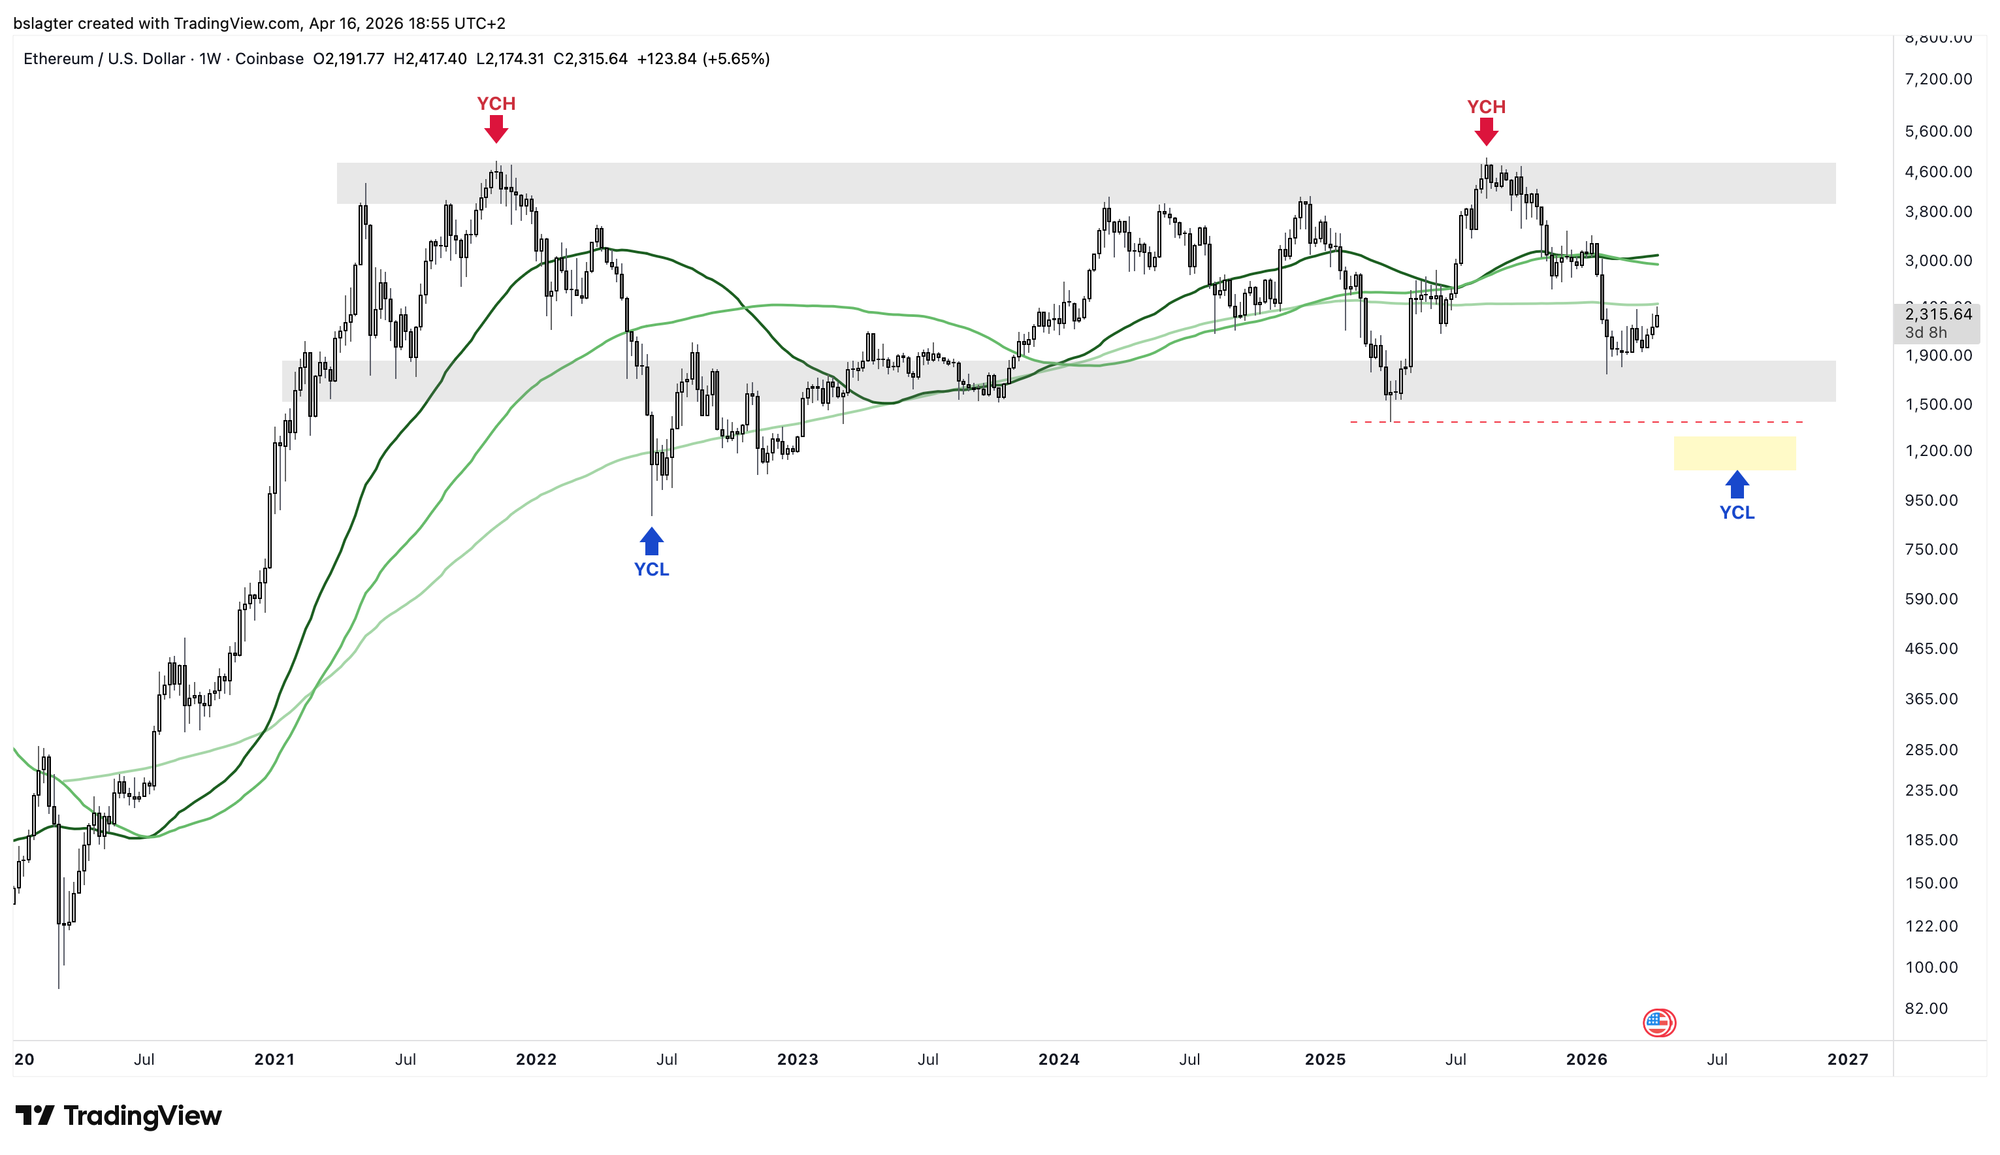
You could make the case that ETH has been in a trendless phase on the weekly chart for five years now: range-bound, oscillating around the 50-, 100-, and 200-week moving averages, which have been running flat for a couple of years.
In this bear market, however, ETH has been relatively strong:
- For bitcoin, the February 5 low ($60,000) was well below the April 7 low last year ($74,400).
- For ether, the February 5 low ($1,740) was well above the April 7 low last year ($1,380).
From a fundamental perspective, you'd expect ETH to decouple from BTC at some point, because they represent two very different worlds: digital gold vs. tokenization. Perhaps we're seeing the first signs of that now.
In any case, if bitcoin takes another (significant) leg down in the coming months, I would expect ETH to drop below $1,380 to put in a yearly cycle low (YCL) there.
3️⃣ The power of three
Sam
We're all familiar with the age-old adage that investing is nothing more than "buy low, sell high." On paper it's dead simple, but especially in the world of crypto, we know that low prices can always go a whole lot lower.
In most cases, a downtrend is followed by a period of sideways action. During this sideways market, it pays to buy near the bottom of the range in case an uptrend follows.
The problem, however, is that we don't know in advance whether this sideways period will be followed by an uptrend or a continuation of the preceding downtrend.
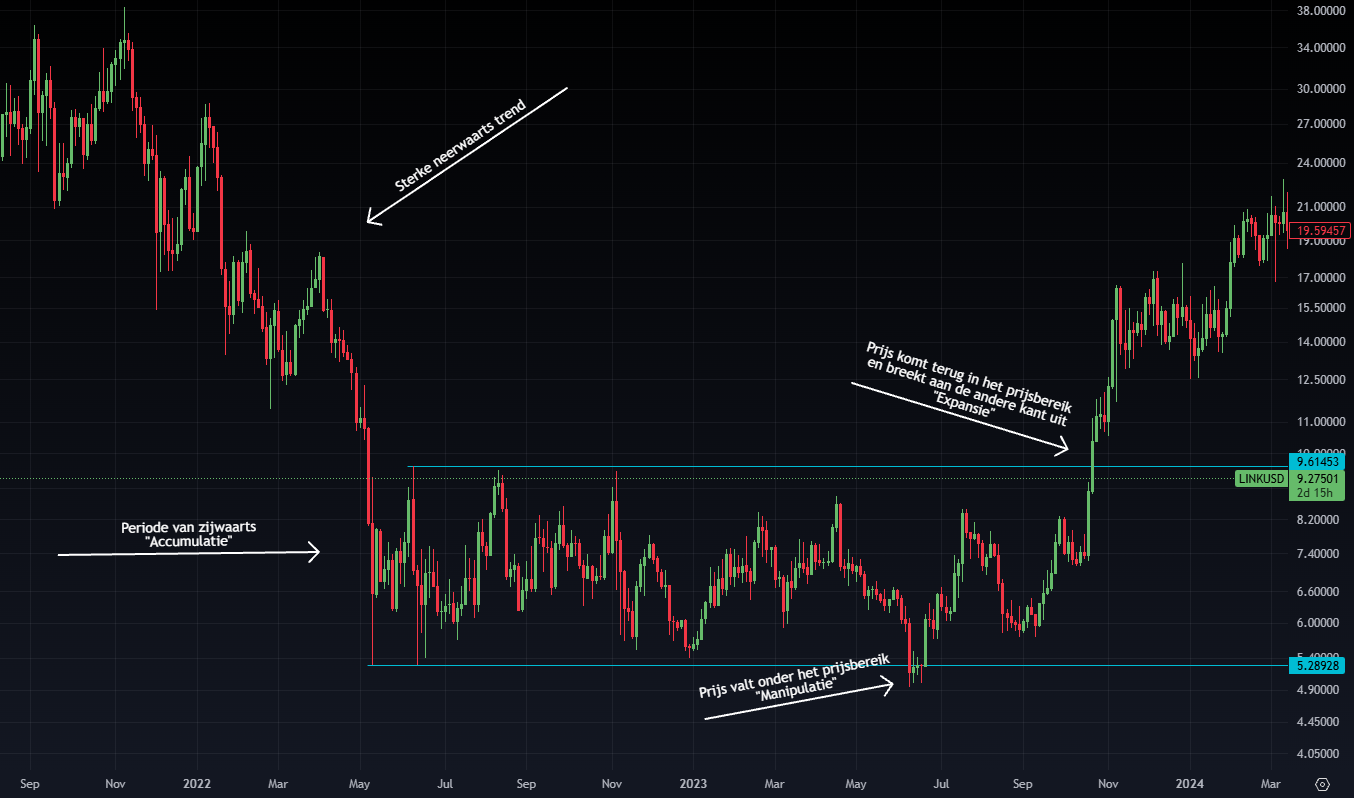
One way to deal with this is "the power of three." This is a trading strategy consisting of three components:
- Accumulation
- Manipulation
- Expansion
This works in principle on all timeframes, but for a horizon of several months, the most reliable signals come from the 3-day or weekly chart.
In the example below, Chainlink (LINK/USD) is shown with the three phases highlighted.
Two important points to note:
- We only buy once price is back inside the range — preferably confirmed by at least one strong daily close back within it;
- We set a hard stop loss below the manipulation low.
The reasoning behind this strategy is that a market has been trading within the range for so long that a legitimate breakout has no reason to come back inside it. And if a breakout does come back into the range, then it was (therefore) a false breakout — and won't follow through.
No strategy is foolproof, but the advantage of this one is that we know exactly when the idea is wrong, so we can limit our losses. Additionally, a renewed break to the downside is likely to push the price significantly lower, resulting in even better buying opportunities.
If it does work in our favor, however, then the "buy low" part is already taken care of.
Beyond these advantages, the biggest drawback is that we sometimes have to buy after a strong green candle, and there will certainly be moments when price dips below our entry. The hard stop loss should protect against emotionally selling prematurely at a loss.
4️⃣ Falling real rates: a tailwind for bitcoin
Thom
Bitcoin is starting to inch higher, the S&P 500 is rallying, and the Russell 2000 — representing small-cap American companies — is performing exceptionally well. That last point is a notable signal, because you don't typically see that during periods of weakness. Which raises the big question: are we actually looking at a period of weakness?
The market's full attention is obviously on the Iran war, about which there is still no complete clarity at the time of writing. New talks seem to be bringing some hope, but peace and a reopening of the Strait of Hormuz remain out of reach.
So how is it possible that the S&P 500 is already trading near its all-time high, the Russell 2000 is doing even better, and the bitcoin price is also climbing?
Often there isn't one single identifiable reason for a particular market development. Here too, it's a confluence of signals:
- The Iran war was (and is) a stress test for the system. So far, nothing has broken. We didn't see the kind of panic that erupted during Trump's tariff war in April 2025. The fact that a serious threat only produces hairline cracks is a positive sign.
- Credit flows toward AI projects continue unabated, largely unaffected by the conflict.
- Lower-rated credits — so-called junk bonds — have recovered their March losses and are even posting a positive return for 2026.
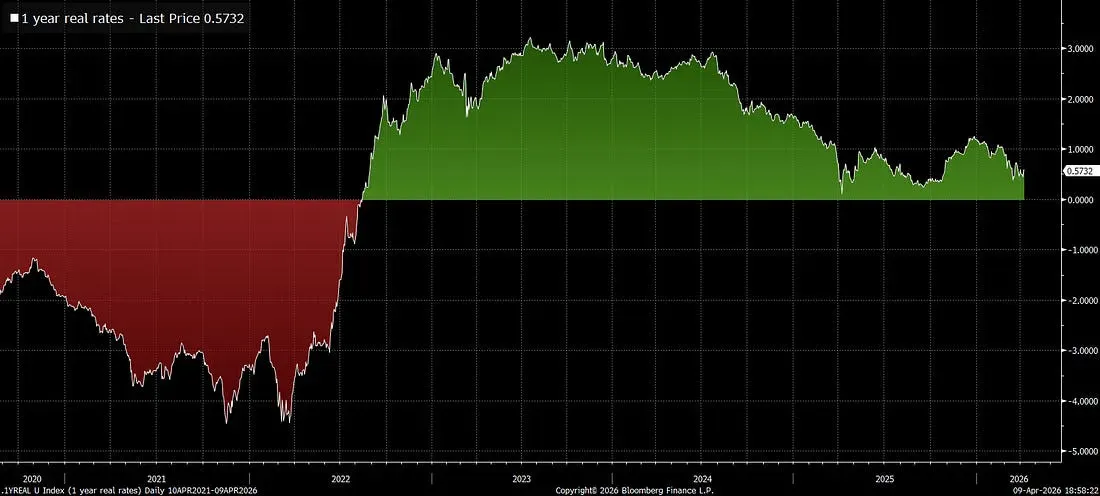
In short, we're seeing quite a few signals that the stagflation scenario is unlikely. In my view, the most important signal comes from real interest rates, which are heading toward zero worldwide.
You get the real interest rate by subtracting inflation from market bond yields. When real rates turn negative, investors' capital loses purchasing power in the bond market. The market effectively forces investors to take on more risk.
The reason real rates are declining lies in rising inflation (expectations), partly due to the Iran war, while the U.S. Federal Reserve simultaneously sees no room for a rate hike.
In this case, no rate cut is needed to achieve lower real rates. A central bank that doesn't react to a modest rise in inflation can be enough by itself to push real rates down.
In my view, this development plays an important role in the cautious shift of capital up the risk curve that we're currently seeing. While it's too early for definitive conclusions, we are seeing the first outlines of the return of the risk appetite needed for the end of bitcoin's bear market.
5️⃣ Easing financial conditions: a tailwind for bitcoin
Thom
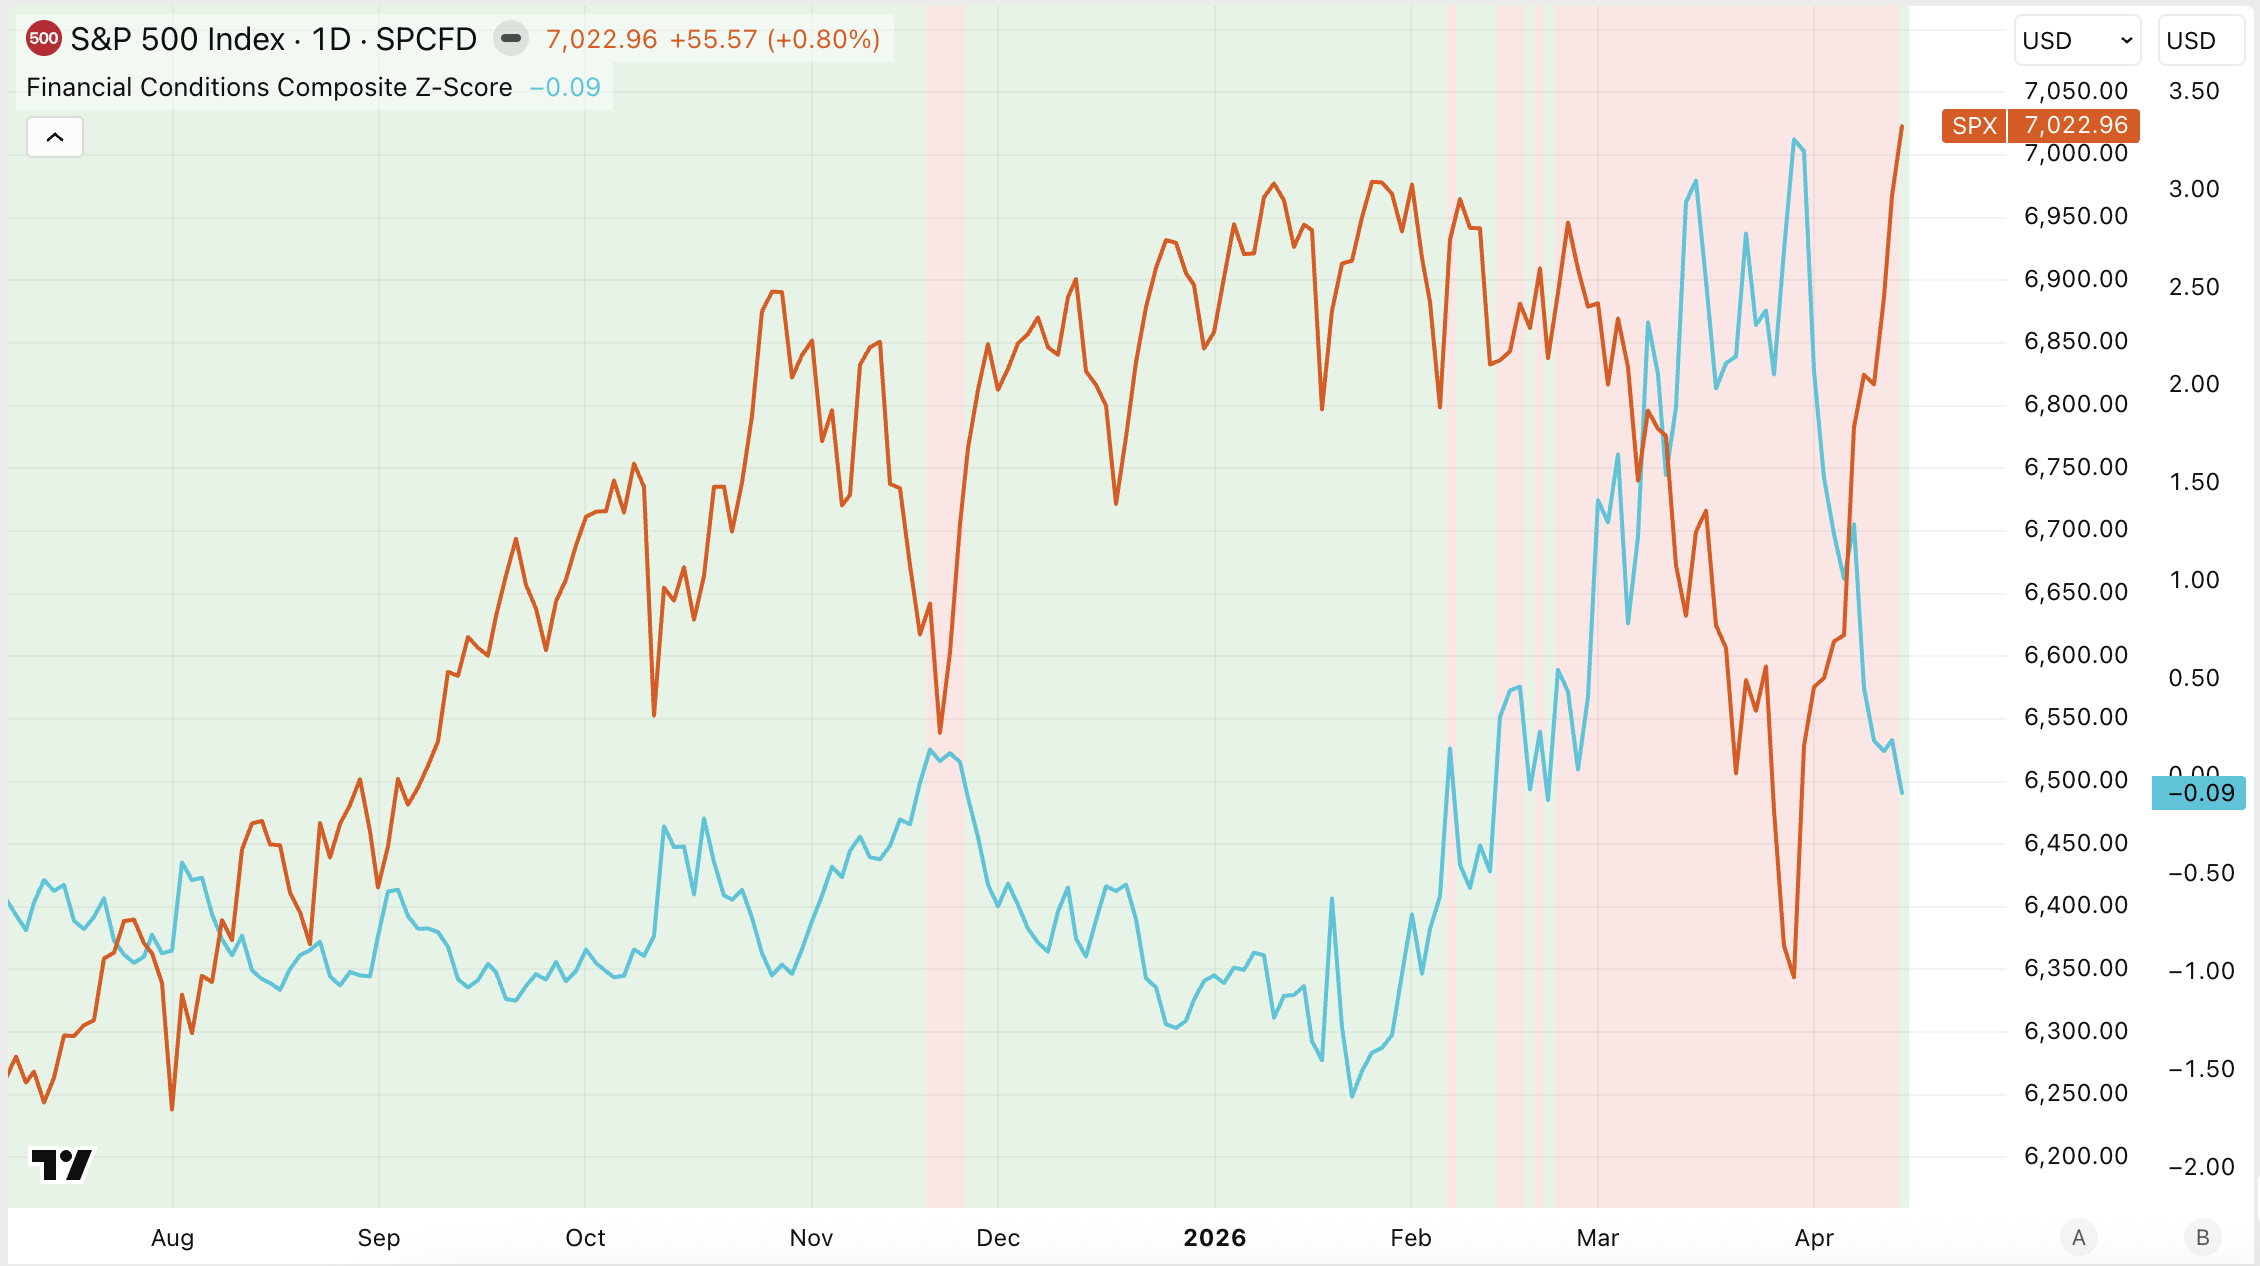
The S&P 500 closed at a record level on Wednesday, while financial conditions are improving rapidly. During the Iran war, there was a sharp tightening of these conditions, shown by the blue line in the chart below. In simple terms, such tightening means that credit becomes less widely available and harder to access.
Since early April, however, we've been seeing the opposite. Expected volatility is declining in both the bond market (MOVE) and the stock market (VIX), while credit spreads are also narrowing. The latter means that companies are paying less additional interest on loans relative to U.S. government bonds.
The financial system appears to be shaking off the geopolitical shock more and more. Stability and confidence are returning, which is once again channeling capital into markets and encouraging investors to take on more risk.
This is cautiously creating the kind of environment bitcoin needs for a new bull market — or at least for the end of the bear market.
Even better is that this dynamic is playing out while bitcoin is starting to build momentum relative to other asset classes. As we've seen in recent months, improving financial conditions alone are not enough for bitcoin to rally.
From December through early February, financial conditions improved as well, yet we saw bitcoin slide to the tentative bear market low of $60,000. While improving financial conditions aren't sufficient to create a rising market, they played an important role in limiting bitcoin's downside in my view.
After the geopolitical shock that caused a tightening of financial conditions — primarily in March — the picture is now starting to turn. This is happening at a moment when bitcoin is beginning to gain traction. The easing of financial conditions can serve as an extra tailwind to really get bitcoin up to speed.
It's still too early for conclusions, especially since the Iran war could escalate at any moment, but this is very cautiously creating a favorable scenario for bitcoin.
In closing
All previous editions of Alpha Markets can be found in the archive. Questions, comments, and suggestions are always welcome in the community.
Thank you for reading!
To stay informed about the latest market developments and insights, follow our team members on X:
- Bart Mol (@Bart_Mol)
- Peter Slagter (@pesla)
- Bert Slagter (@bslagter)
- Mike Lelieveld (@mlelieveld)
We appreciate your continued support and look forward to bringing you more comprehensive analysis in our next edition.
Until then!