History Doesn't Crawl — It Leaps
Bitcoin edged above $72,000 last week — unexpectedly strong amid an escalating war threatening global energy supplies. What does this resilience signal for the months ahead?
Nassim Taleb in The Black Swan:
History does not crawl. It jumps.
The war in Iran is one such jump.
In the thirteen days since the conflict in the Middle East began, all attention has been focused on the relentless stream of events. Attacks with missiles and drones. Shipping through the Strait of Hormuz disrupted. Speeches by world leaders. Analyses from every kind of expert imaginable.
The hope for a short, effective operation with limited collateral damage evaporated long ago. Many countries in the region have become directly involved, and virtually every country in the world is feeling the consequences through sharply rising oil prices.
Much of the conversation now centers on what lies ahead in the coming weeks and months. Humanitarian damage to affected civilians. Higher prices for oil, gas, gasoline, and fertilizer. Hardened relations between countries in the region. Political consequences for the Trump administration. And — will the situation escalate further?
These are legitimate topics, also with an eye on financial markets, and we'll discuss them in more detail shortly.
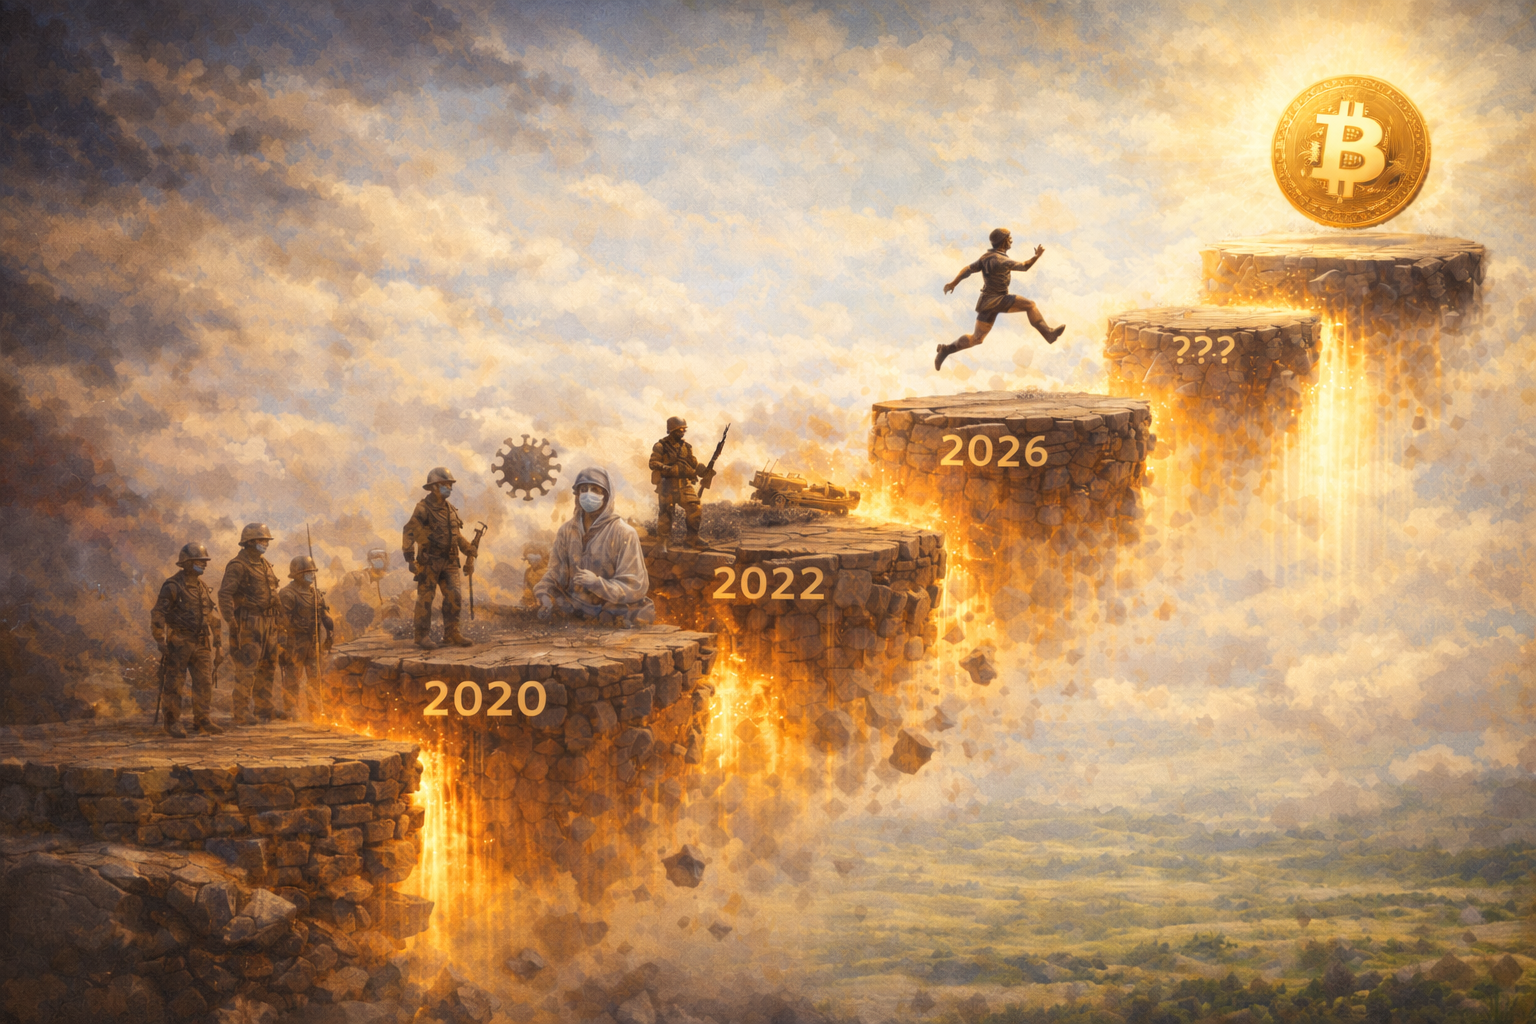
But first, let's zoom out far enough to survey the decades. After World War II, America became the dominant power: militarily, institutionally, economically, and culturally. The peak was the period between 1990 and 2010. The Cold War was over and rapid globalization brought prosperity.
Between 2010 and 2020, the first cracks appeared. China grew into an economic and technological rival. Russia became more assertive, with the annexation of Crimea as a turning point. In many Western countries, resistance grew against globalism — the belief that worldwide economic integration would automatically lead to greater prosperity.
After 2020, things accelerated. The COVID pandemic proved that global production and supply chains are fragile. Russia's invasion of Ukraine demonstrated the importance of autonomy in energy and raw materials. And that government bonds used as currency reserves are vulnerable to being frozen.
We should recall the speech by ECB Executive Board member Isabel Schnabel at the Jackson Hole central bankers' meeting in 2022. She spoke of "a new era of volatility, [..] one in which shocks are potentially larger, more persistent and more frequent."
Schnabel looked back at the much calmer decades before and identified two stabilizing forces:
[The pandemic and the war] challenge two of the fundamental stabilising forces that have contributed to the decline in volatility during the Great Moderation: globalisation and an elastic energy supply. Globalisation acted as a gigantic shock absorber.
An elastic supply provides stability. Governments and central banks don't need to factor in the supply of energy, raw materials, products, and labor when setting policy. Put simply: controlling inflation meant watching demand, because supply was always sufficient.
Thanks to years of increasing globalization, everything was abundant. Now that this is no longer the case, the risk of supply shocks is growing. The result: shortages and wildly fluctuating inflation. The volatility Schnabel was talking about.
A logical consequence is that (groups of) countries want to reduce their dependence on others. Your own energy, raw materials, and production.
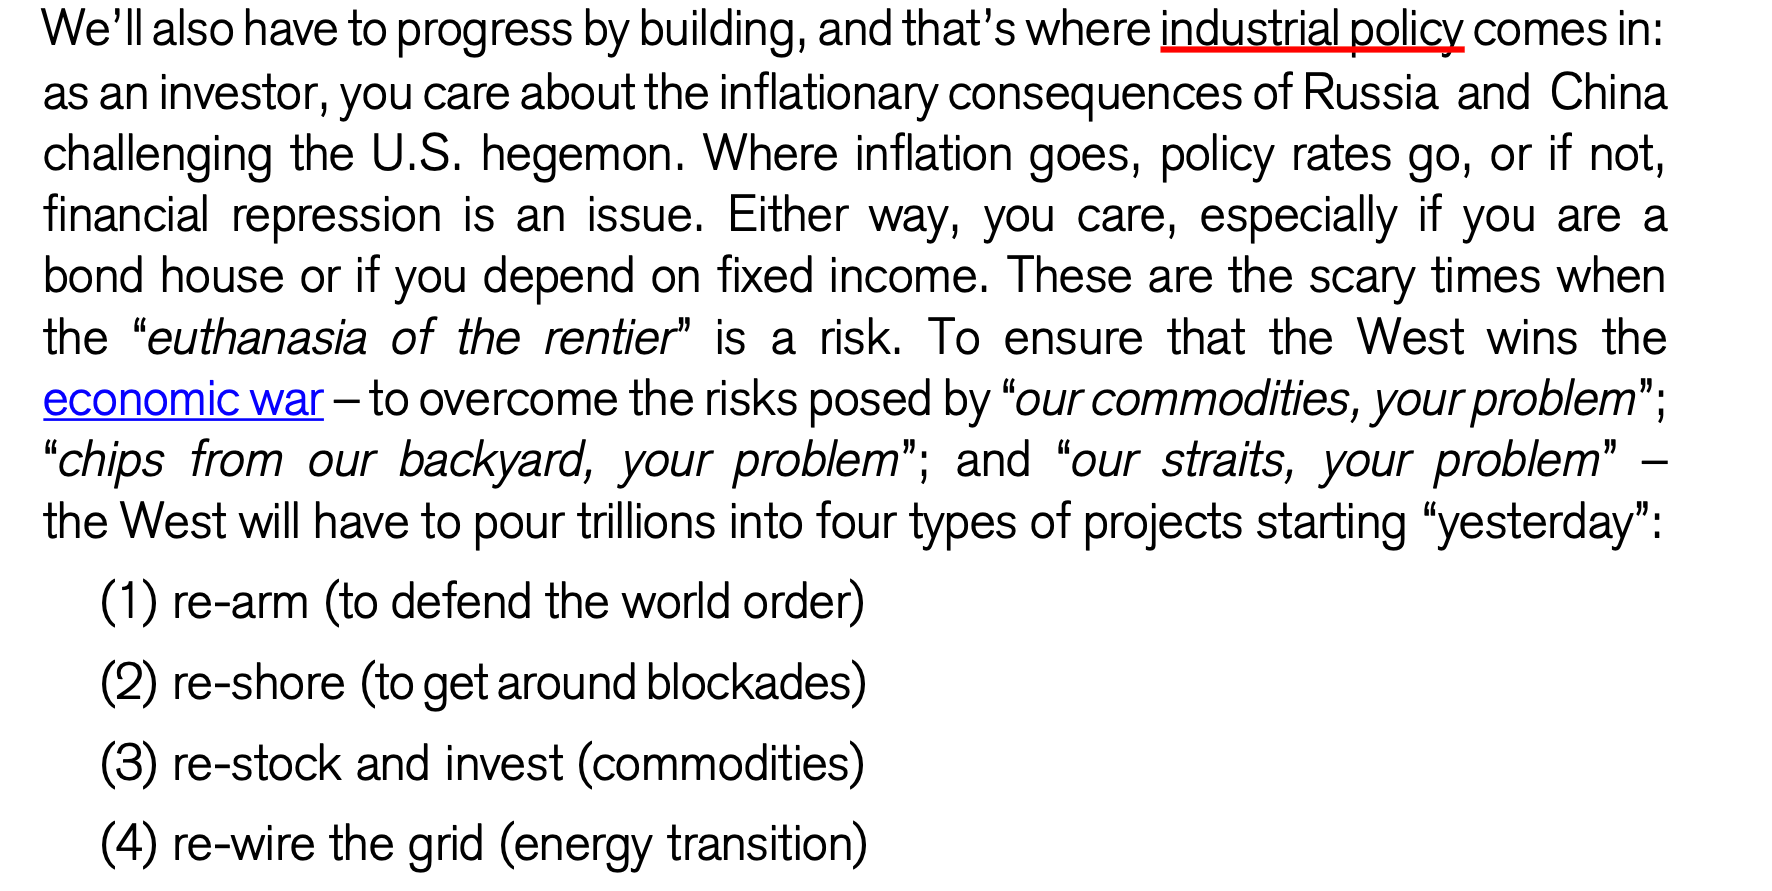
Zoltan Pozsar, analyst at Credit Suisse, identified in 2022 four ways this will drive higher inflation: re-arm, re-shore, re-stock, and re-wire. Reinvesting in defense, bringing production back home, maintaining larger stockpiles, and building out energy infrastructure.
The Nassim Taleb quote we opened this article with is explored more deeply later in The Black Swan.
History and societies do not crawl. They make jumps. They go from fracture to fracture, with a few vibrations in between. Yet we (and historians) tend to believe in the predictable, incremental nature of change.
COVID in 2020 and Russia in 2022 were fractures. After that, things calmed down for a few years — mostly vibrations.
The unveiling of Trump's economic and geopolitical vision in early 2025 was also a fracture. The dollar and trade are being weaponized, and institutions are being devalued. America is retreating to its own sphere of influence, explicitly making room for the transition to a multipolar world order.
The war in Iran is the next fracture.
America has failed to keep the Strait of Hormuz open. The American thalassocracy — its command of the world's seas — is losing its grip. The mere presence of an American aircraft carrier is no longer enough to guarantee safe trade routes. The asymmetry between swarms of cheap drones and enormously expensive ships and radar installations is transforming warfare.
The war in Ukraine primarily affected gas prices in Europe. The war in Iran affects the energy supply worldwide. And no one can stop it.
This reinforces Zoltan Pozsar's thesis. In many countries, conversations are now being held about strategic stockpiles, alternative sources of energy and raw materials, and the state of defense capabilities.
Overton windows have shifted. What was unthinkable ten years ago is now accepted. Hundreds of billions for the ReArm Europe defense plan. Von der Leyen even ate humble pie this week over 'the strategic mistake of turning our backs on nuclear energy.'
The pendulum has swung direction — from globalization to deglobalization. From centralization to decentralization. From a unipolar to a multipolar world order. From one world currency and one trading system to smaller alliances with their own financial arrangements.
How can you, as an individual, position yourself for this? What does it mean for your portfolio construction?
It's a confirmation of our secular base scenario for 2020 to 2030:
- Inflation will average higher than the 1% to 2% of the preceding era.
- Governments will borrow heavily for strategic investments, driving up national debts further.
- Bonds are "return-free risk." They yield less than inflation but still carry counterparty risk.
- Investors will seek assets that governments can't print into existence. Real assets like real estate, precious metals, quality stocks, and bitcoin. The 'debasement trade.'
An additional factor is the rapid rise of AI and its potentially disruptive impact on the economy, society, and financial markets.
Whether that plays out as utopia or dystopia, in both cases the costs and benefits will not be evenly distributed across people, companies, industries, and countries. This creates an interplay between the rise of AI and geopolitical shifts.
For investors, that makes the puzzle somewhat harder. In our secular base scenario, there's plenty of room for stocks in the portfolio. Good companies are scarce, benefit from turbulence, and grow at least as fast as the economy. They protect against inflation and debasement.
But with a potential AI revolution on the horizon, are stocks still such a good choice? Which companies benefit from AI and which get hammered? The honest answer is that no one can foresee this yet. We simply don't know how a potential revolution will unfold.
That's an additional argument for including bitcoin in the portfolio.
A company's market capitalization is tied to expected future earnings. AI increases the uncertainty around those expectations. That explains the steep declines in SaaS stocks. They'll make a profit this year, and probably next year too, but after that? Will this company still be profitable in 2028, 29, 30? Will it even exist?
With bitcoin (and gold), that uncertainty doesn't apply. They don't represent a claim on future cash flows — they are an (emerging) store of value.
Bitcoin is far from having the reputation and network effect of gold. There is no guarantee whatsoever that bitcoin will actually grow into a globally accepted store of value. But if there's ever a time when that could happen, it's now.
By that we don't mean today or this week, but the next 5 to 10 years. Possible signals that this thesis is playing out:
- A wide variety of investors are adding bitcoin to their portfolios. Individuals, funds, corporations, nation-states. In every corner of the world.
- Bitcoin's price increasingly moves to its own beat. Correlations with other asset classes decline.
- Bitcoin's price increasingly holds strong during risk-off regimes.
There is evidence to support each of these points, but for all of them the body of evidence is still small. It's not yet a strong pattern.
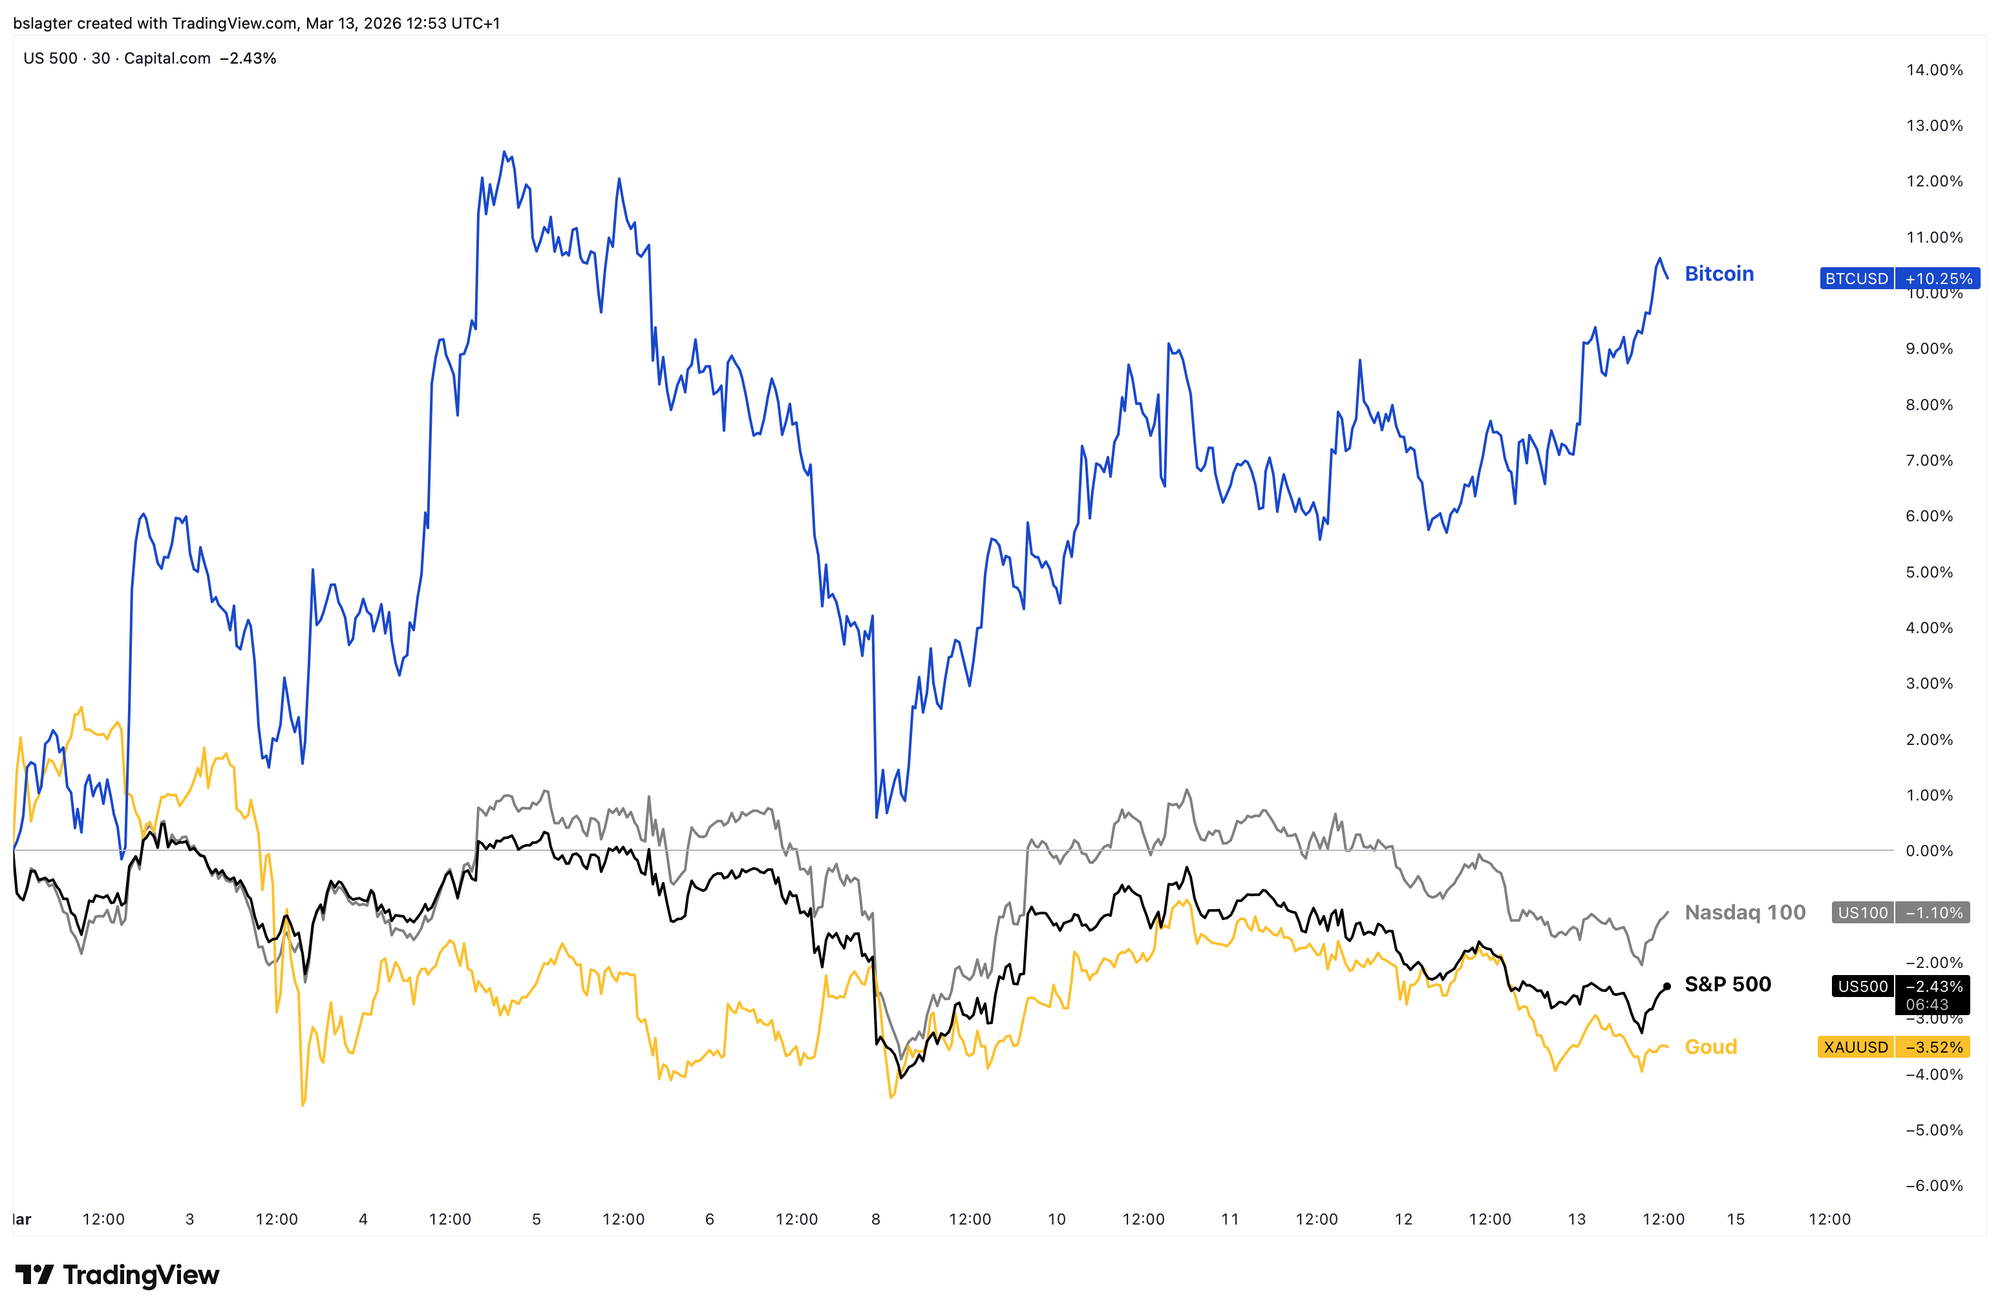
Bitcoin's relative strength over the past two weeks is a good example. Since the start of the war on February 28, bitcoin's price has risen about 10%, while major stock indices and gold are down about 2%.
That's not a signal that the bear market is over, or that a massive flight to bitcoin is imminent. It's a modest positive for bitcoin's outlook over the coming years.
We promised to revisit the outlook for financial markets in the near term. Are we on the brink of a market crash and a deep recession? Or is this the beginning of a new period of rising prices or even a melt-up?
There are arguments for both scenarios. Much depends on how the war in Iran unfolds. If the Strait of Hormuz remains closed for months, the negative scenario seems hard to avoid. A swift de-escalation could be the starting gun for a rally.
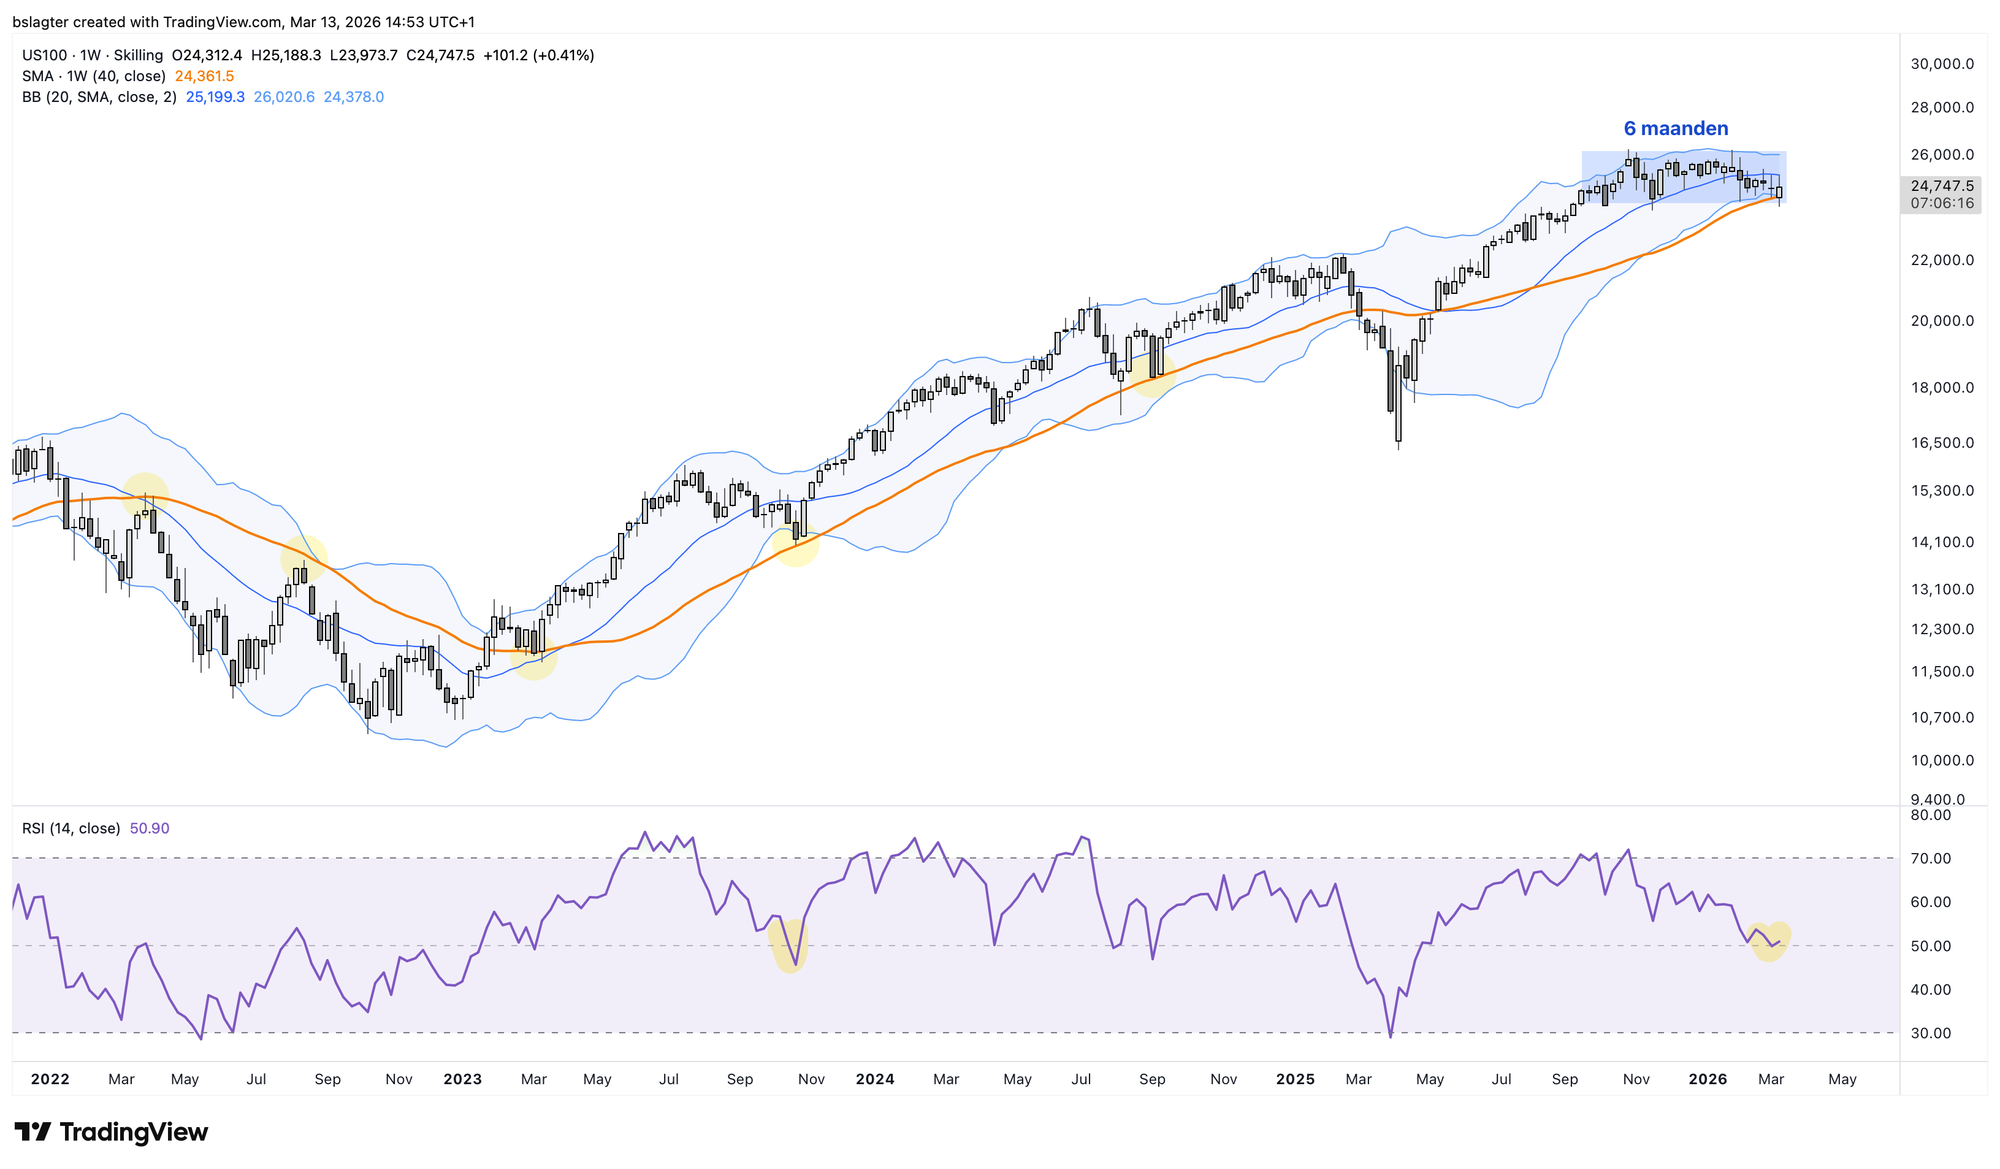
That's often the case at crossroads. The chart below shows the Nasdaq 100, the American tech index. After six months of sideways trading, the price is now resting on the dominant moving average and the lower Bollinger Band.
Many analysts are bearish. Many investors are pessimistic. On the options market, downside protection is especially popular. Could they all be right? Or will this turn out to be a fantastic buying opportunity?
In this case, there's little point in diving deep into the numbers for a thorough analysis. The events in Iran carry far more weight. It doesn't hurt to wait patiently, or at the very least manage your risks carefully!
Let's move on to the following topics:
- Encouraging signals for bitcoin
- Why bitcoin is interesting for institutional investors
- The EMA as a signal
- Cycle update for bitcoin
1️⃣ Encouraging signals for bitcoin
Thom
While we as bitcoiners love to proclaim that the digital currency is theoretically an ideal safe haven, reality often tells a different story. To date, bitcoin has primarily traded as a speculative asset. Buying bitcoin is a bet on the future scenario in which the digital currency plays a more significant role in the global financial system.
In short, bitcoin is currently an asset that performs well when investors are willing to take risk — ideally in extreme fashion. It's an asset that thrives when confidence in the future is high and capital flows freely through the system.
That hasn't been the case in recent months. We saw doubts about the AI revolution, tech stocks took a beating, and the geopolitical climate is anything but calm. The result was an environment in which investors were less eager to take on risk.
This wasn't just reflected in the bitcoin price, which fell significantly since October 2025 and even entered a bear market. We see the same thing in the stock market.
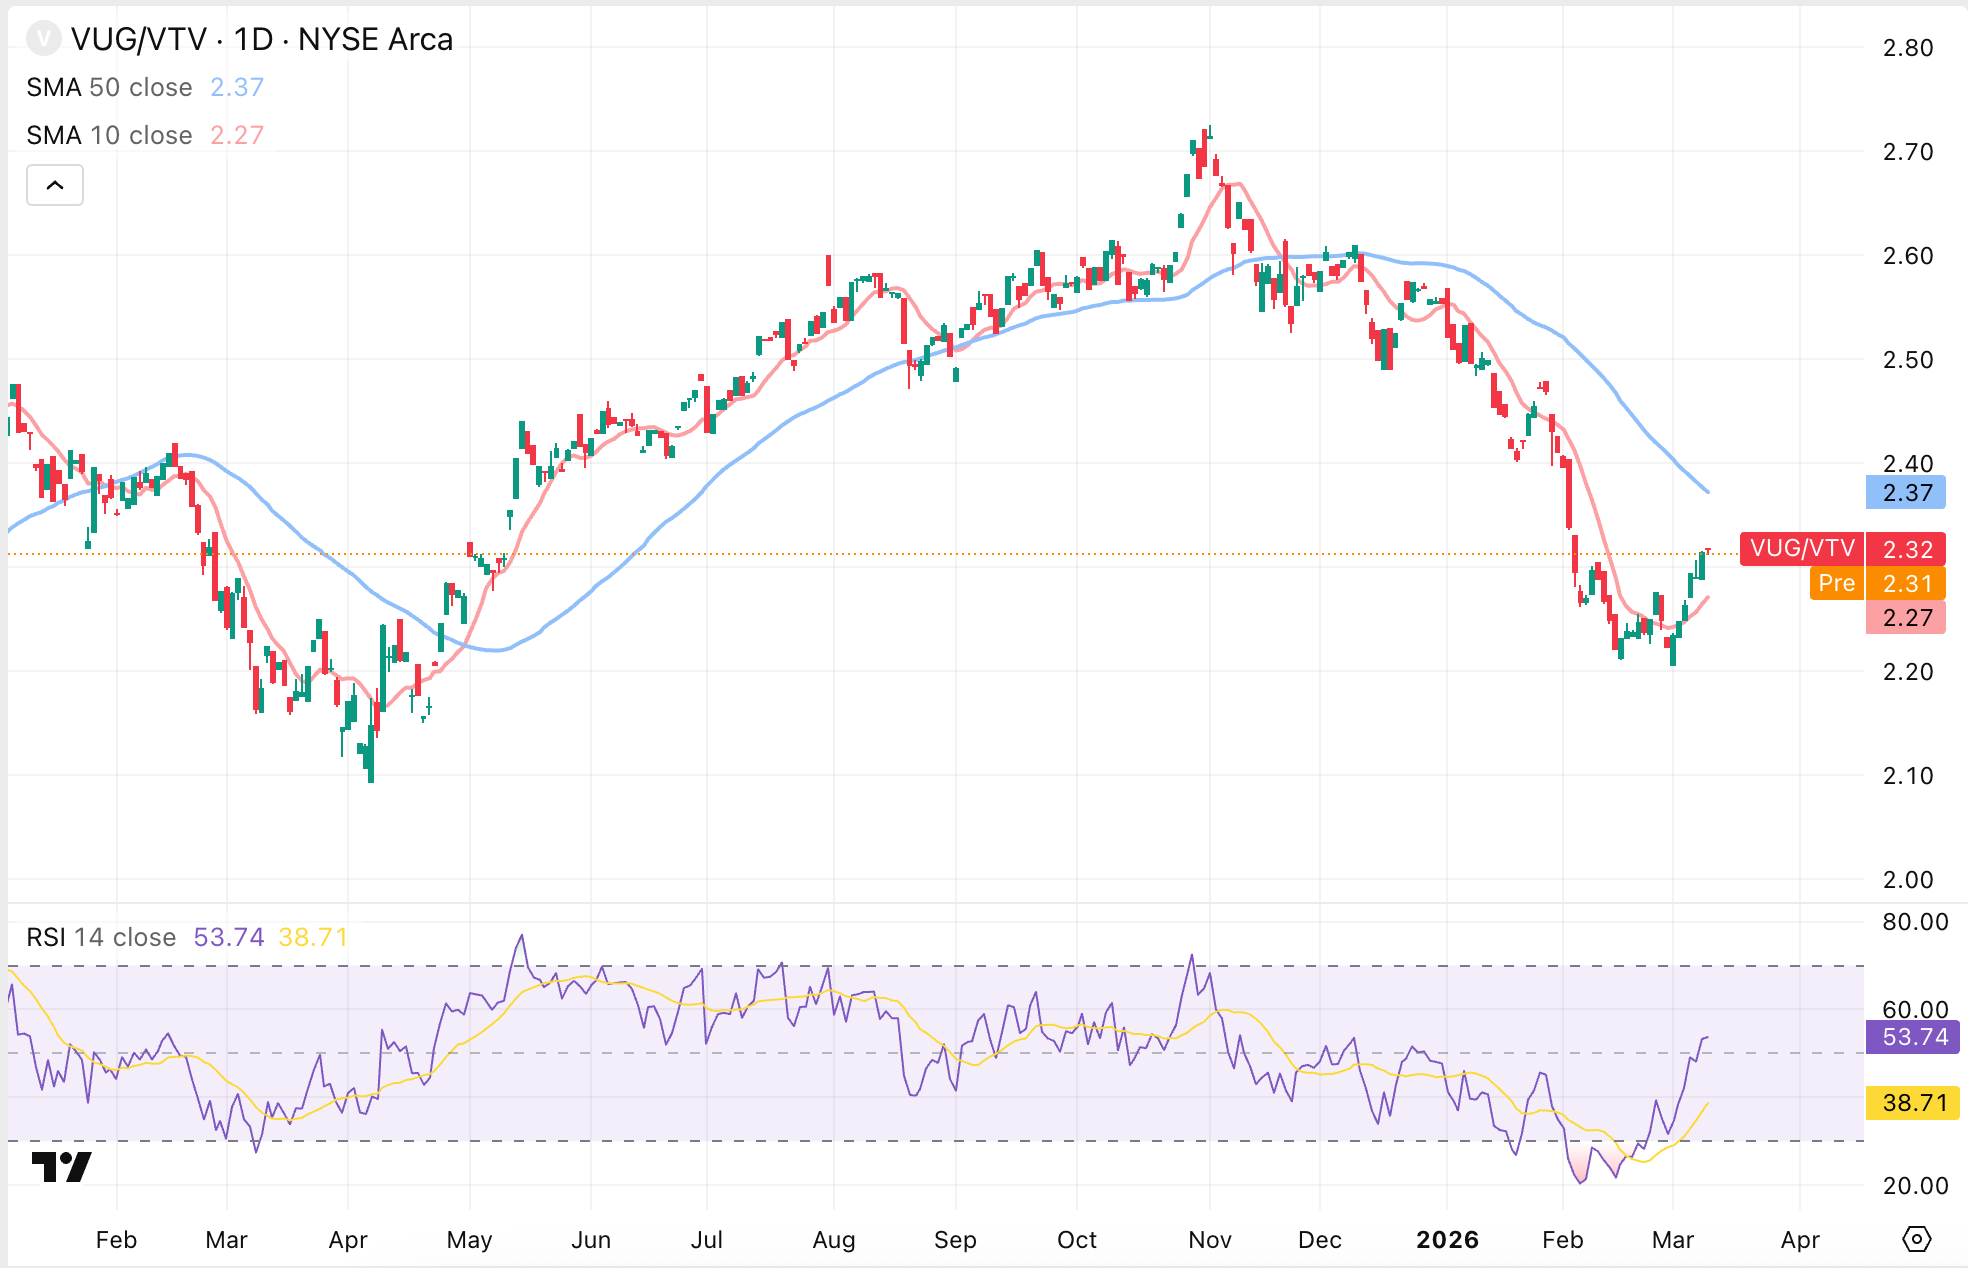
There we see that growth stocks (VUG) have significantly underperformed the safer value stocks (VTV) since October last year. Investors are choosing established companies with years of stable earnings over forward-looking companies that still have to prove themselves.
Recently, however, that appears to be changing. Growth stocks seem to have started a comeback. The prevailing narrative is still that investors are opting for relative safety. But these are signals suggesting that the dominant narrative may be reaching its expiration date.
What's interesting is that bitcoin and many investments classified as more speculative are also beginning to recover at precisely this moment. It's too early for conclusions and more confirmation is needed, but we're seeing an increasing number of signals offering hope that this winter may be coming to an end.
2️⃣ Why bitcoin is interesting for institutional investors
Thom
Institutional capital views the market through a different lens than retail investors. For the world's wealthiest, maximizing returns is less important than protecting capital. From that perspective, things are currently changing in ways that appear to favor bitcoin.
Stocks and bonds — the traditional building blocks of an investment portfolio — have shown a changing correlation pattern in recent years. Historically, bonds served as a stable counterweight to stocks.
When stocks underperformed, bonds picked up the slack, and vice versa. Now we see both asset classes sometimes moving in the same direction. During the Iran war as well, stocks are under pressure, but the same is true for long-dated U.S. Treasuries. For institutional capital, this increases the urgency to look beyond the classic stock-bond mix.
That was also the conclusion of Jurrien Timmer, Director of Macro at Fidelity Investments, which manages trillions of dollars in capital. This week he shared an analysis of 5-year correlations between various asset classes, the S&P 500, and long-dated U.S. Treasuries.
Commodities (BCOM), managed-futures strategies (HFRX), gold, and increasingly bitcoin are, according to him, positioning themselves as potential diversification instruments.
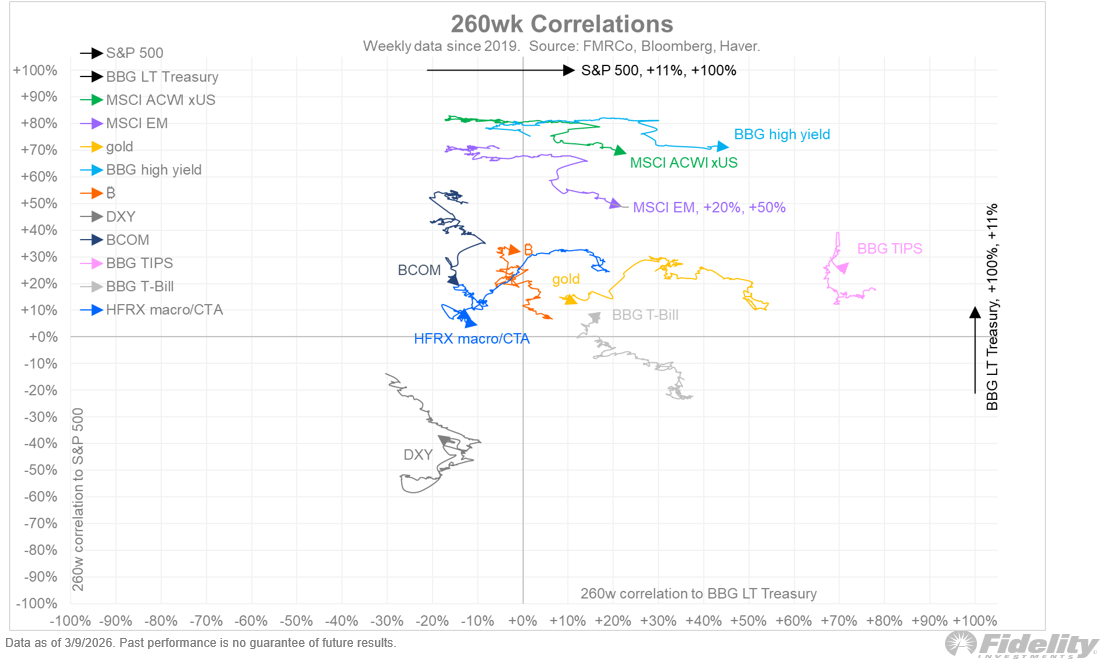
For the way institutional capital constructs portfolios, that's a relevant observation. Assets with a low correlation to the traditional market can theoretically contribute to more efficient risk diversification.
Put differently, adding bitcoin to a portfolio has the potential to improve the risk-return ratio. At least based on the rules that these types of investors operate by.
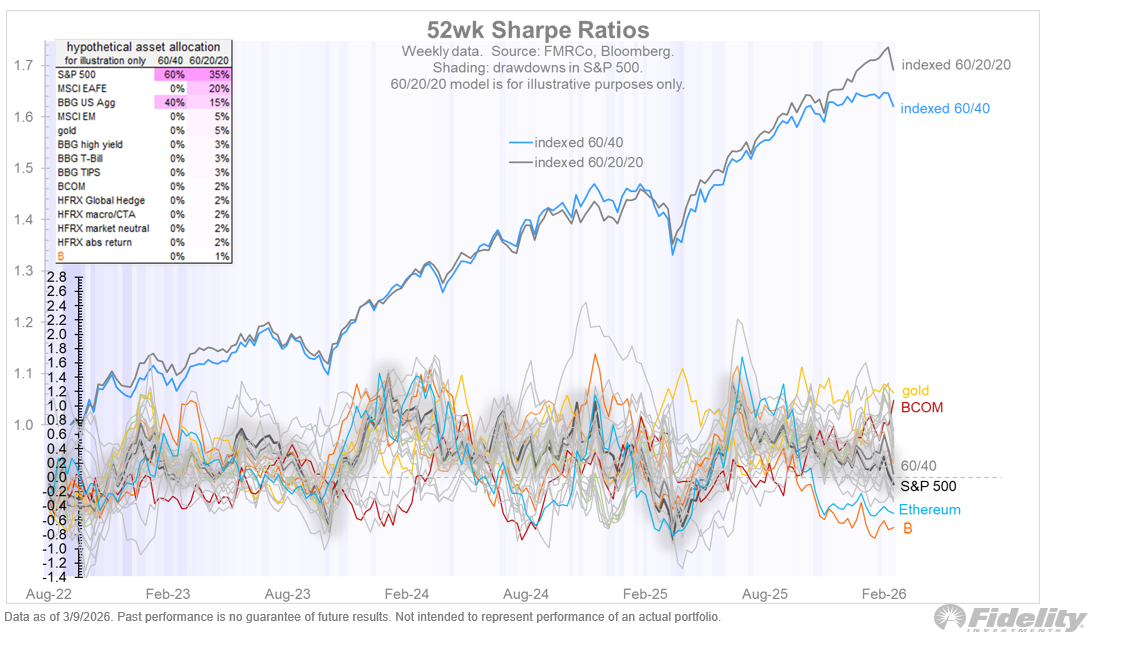
This doesn't mean, by the way, that professional investors will load up their portfolios with bitcoin. That's not how it works. Timmer, for example, has been arguing for some time that the traditional 60/40 portfolio — 60% stocks and 40% bonds — is outdated.
He advocates a 60/20/20 portfolio, where 20% is taken from bonds and allocated to alternative investments. Bitcoin falls into that category, but as you can see in the chart below, Timmer currently gives bitcoin an allocation of 1%.
That may not seem groundbreaking, but in my view it is. It shows that bitcoin is being taken seriously within this corner of the financial industry, and that the digital currency fits within the rules they apply when constructing portfolios.
3️⃣ The EMA as a signal
Sam
The crypto market regularly experiences large price swings that can stir up intense emotions in investors. These emotions can then lead to poor decisions.
There are several reasons why people give in to emotions, such as:
- You don't have a plan, or you're not sticking to your plan.
- You have too little exposure in a rising market and FOMO kicks in.
- You have too much exposure during falling prices and panic sets in.
Fortunately, there are indicators like the exponential moving average (EMA) that aren't influenced by emotion, but by data. The EMA calculates the average price over a given period, assigning more weight to recent prices.
There are a few key principles to keep in mind:
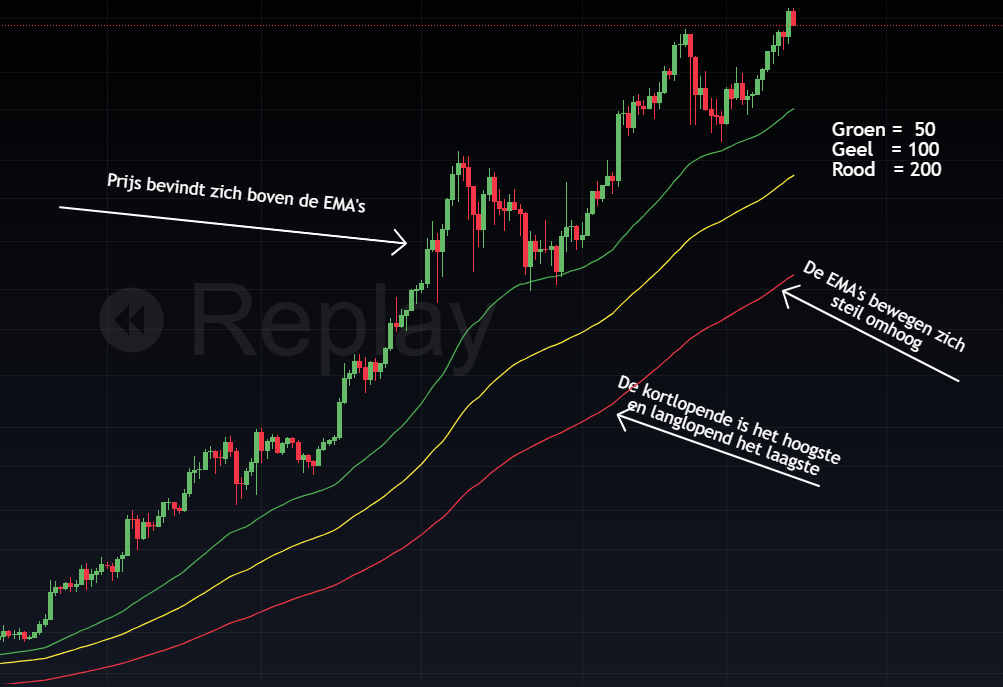
- Price above the EMAs is bullish; price below the EMAs is bearish.
- When the short-term EMA is above the long-term EMA, that's bullish.
- A steeper EMA is a stronger signal.
- A higher timeframe gives a stronger signal.
In the image below, you can see a market that meets all of the above conditions for a strong upward trend, and it's therefore perfectly fine to be maximally bullish until something changes.
EMAs help you create an objective plan with fixed rules. This allows you to take emotions out of the equation — provided, of course, that you actually stick to the rules in the heat of the moment.
Here are some examples of rules for potential sell moments:
- A weekly close below the 50 EMA on the weekly chart.
- When the 50 EMA crosses below the 200 EMA on the daily chart.
- A daily close below the 200 EMA on the daily chart, where this EMA is no longer pointing steeply upward (i.e., is flat or trending downward).
Of course, none of these examples guarantee a good selling point, but the key takeaway is that they can protect you against deep corrections or bear markets.
4️⃣ Cycle update for bitcoin
Bert
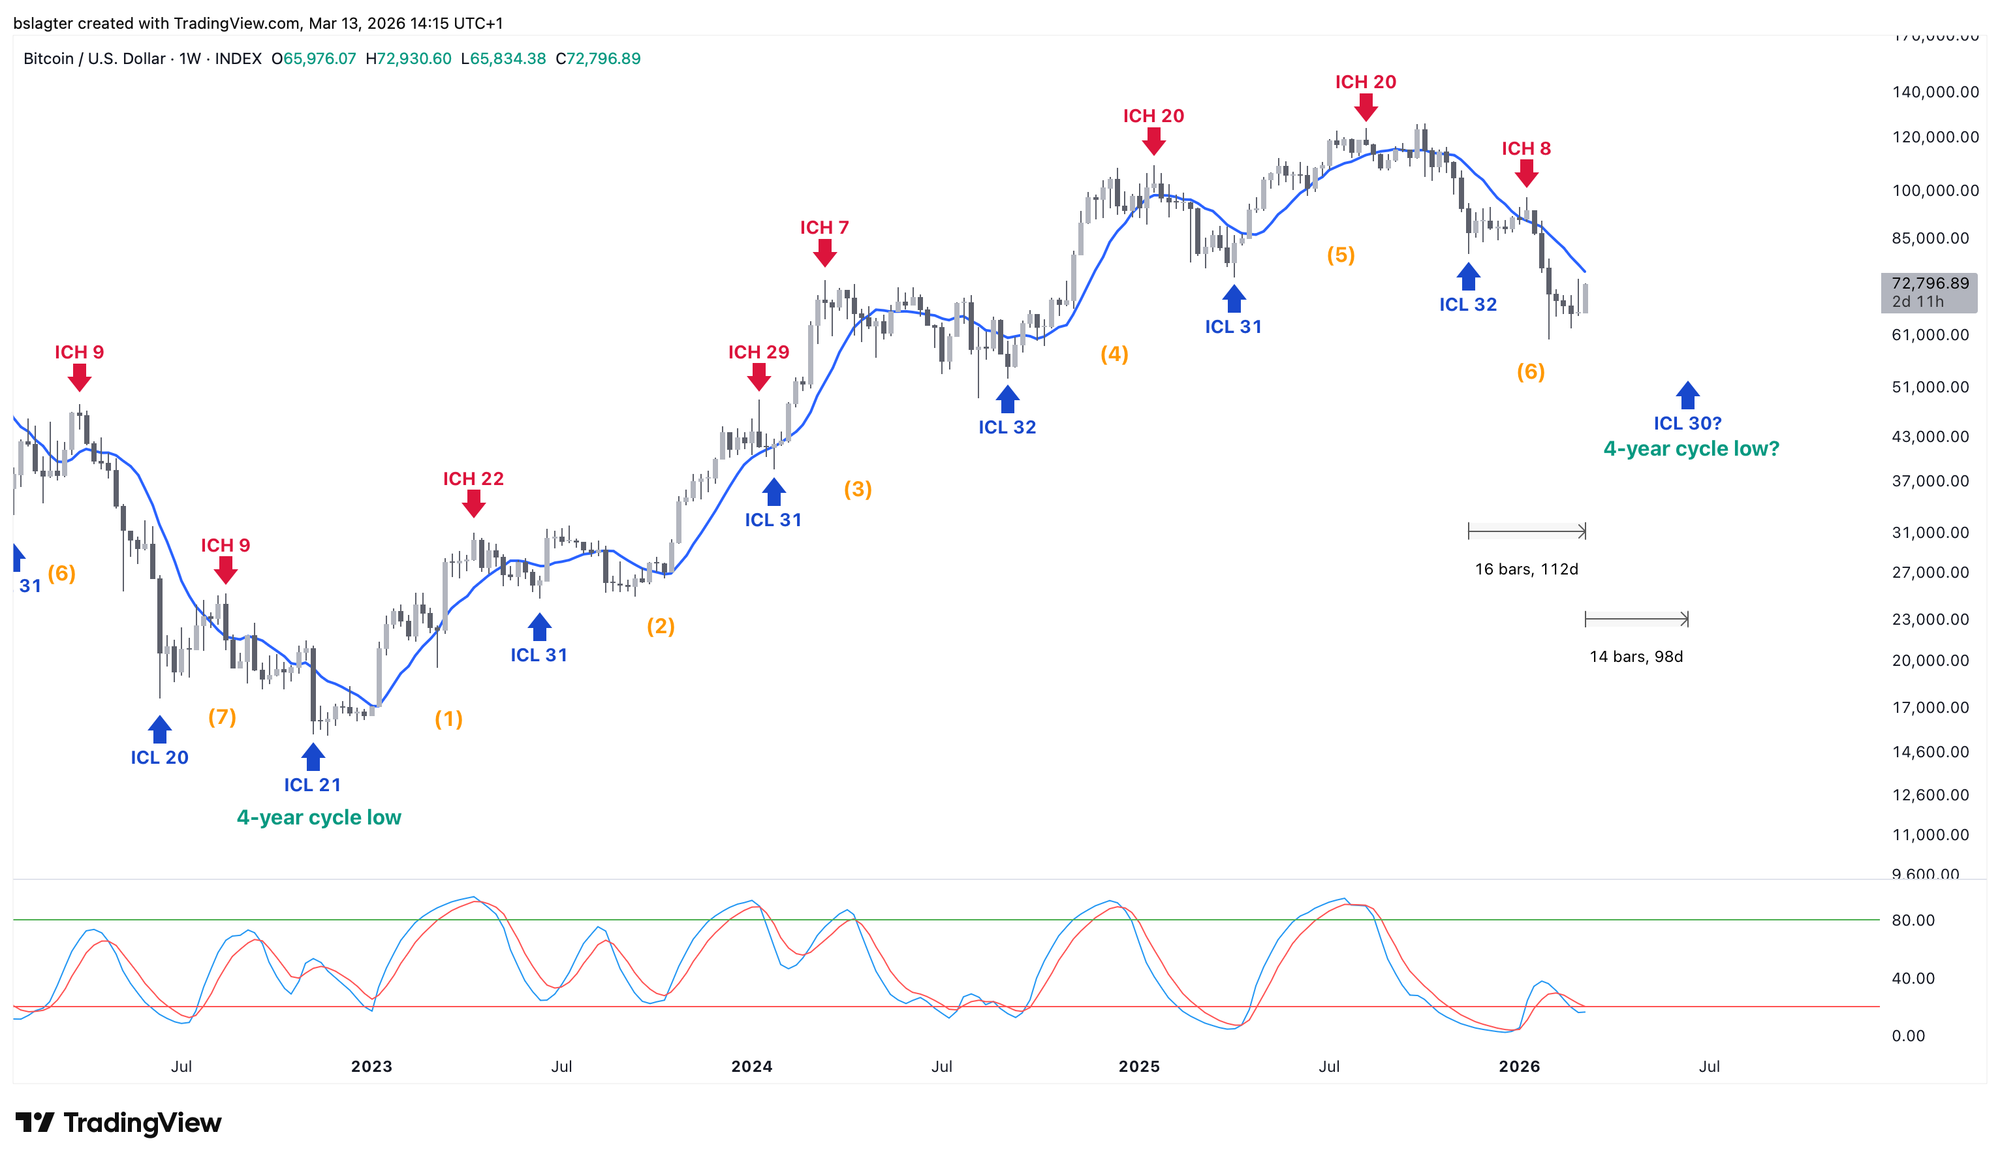
To close out this Alpha Markets edition, let's look at bitcoin's weekly and daily cycle. We're in the declining phase of the market cycle, heading toward the bottom of the yearly cycle (YCL) and with it the end of the bear market.
The yearly cycle consists of six to eight weekly cycles so far. We're currently in the sixth, and naturally hope this is also the last. If so, the bear market bottom would fall around the end of the second quarter. We're currently in week 16 of an average 30-week cycle.
It's quite possible that the price will rise in the coming weeks to slightly above the 10-week moving average, which is currently running at $74,000. But in bear markets, the price only stays there briefly — a few weeks perhaps.
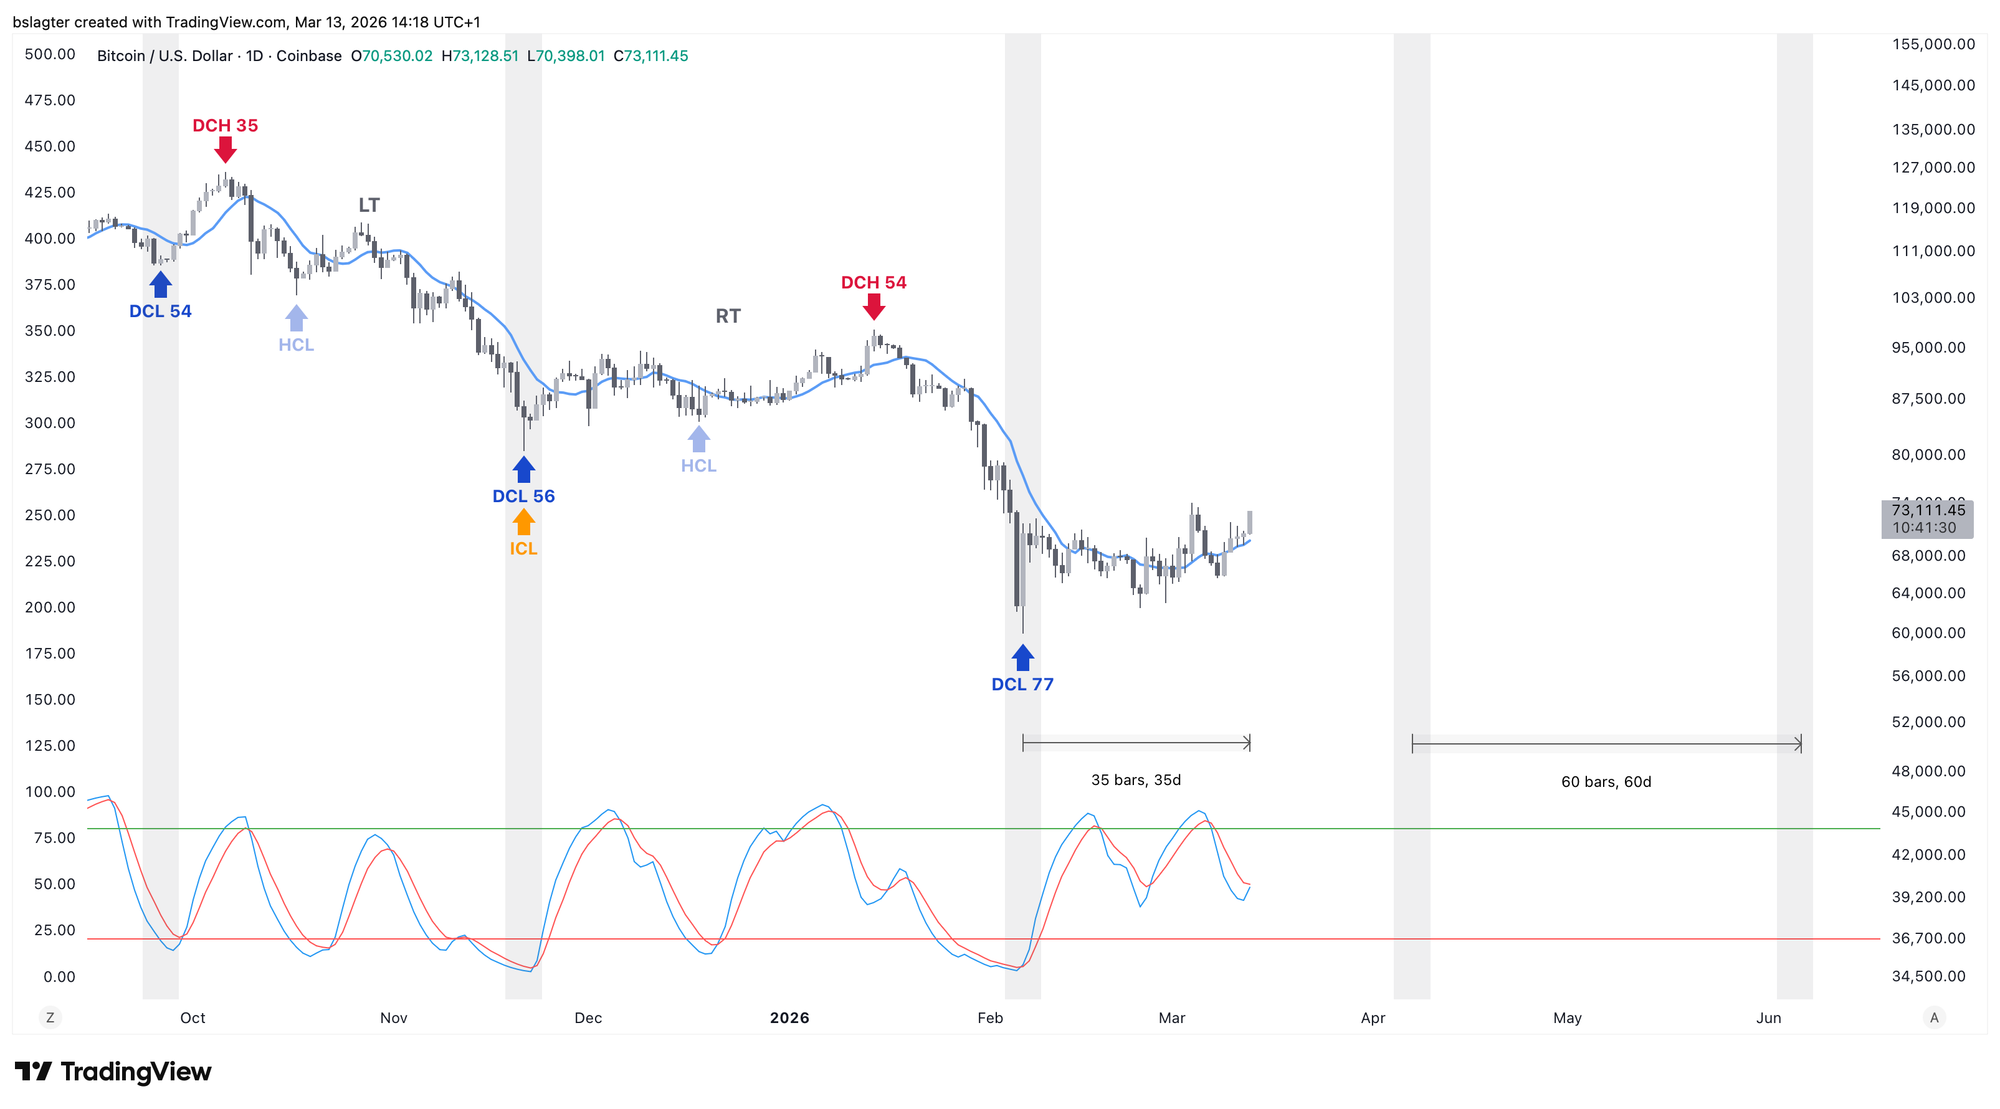
In the daily cycle, we're now on day 35 of an average 60 days. Once again, there was little upside in the first part of the daily cycle. That's consistent with bear markets.
The oscillator shows a somewhat compressed picture, as if this cycle has been squeezed together. It could turn out shorter than 60 days, or develop a very long declining tail. We'll see!
In closing
All previous editions of Alpha Markets can be found in the archive. Questions, comments, and suggestions are always welcome in the community.
Thank you for reading!
To stay informed about the latest market developments and insights, follow our team members on X:
- Bart Mol (@Bart_Mol)
- Peter Slagter (@pesla)
- Bert Slagter (@bslagter)
- Mike Lelieveld (@mlelieveld)
We appreciate your continued support and look forward to bringing you more comprehensive analysis in our next edition.
Until then!