First the Sweet, Then the Sour
Governments worldwide are unleashing massive stimulus, pushing bond yields to ’90s highs. While fiscal support boosts profits, inflation looms and US rate cuts may be imminent. Is this the calm before a storm in global markets?
Governments worldwide are planning to inject substantial support and stimulus into their economies. In China, the aim is to revive economic activity. In Europe, the focus is on investing in defense and securing energy supply. And in the US, the mantra is to make America great again. Almost everywhere, these initiatives are being financed by further expanding budget deficits.
The bond market isn’t very enthusiastic. Yields on long-term government bonds are spiking, and this week in the UK and Japan, we saw the highest levels since the late ’90s.
The surge in yields on 20- or 30-year bonds is driven by worries about rapidly increasing government debt. There’s no immediate fear of national bankruptcies, but concerns persist that the purchasing power of borrowed money will diminish over time due to sustained higher inflation.
This isn’t exactly reassuring for savers and bond investors. However, investors holding gold, stocks, real estate, and bitcoin are less anxious. At least initially, they benefit from the stimulus. Government support quickly reflects in profit figures, consumer spending, and investors’ willingness to take risks, with inflation only catching up later.
This is especially true when fiscal stimulus is paired with easy monetary policy. In times of high government debt and large budget deficits, keeping short-term interest rates low allows governments to borrow cheaply.
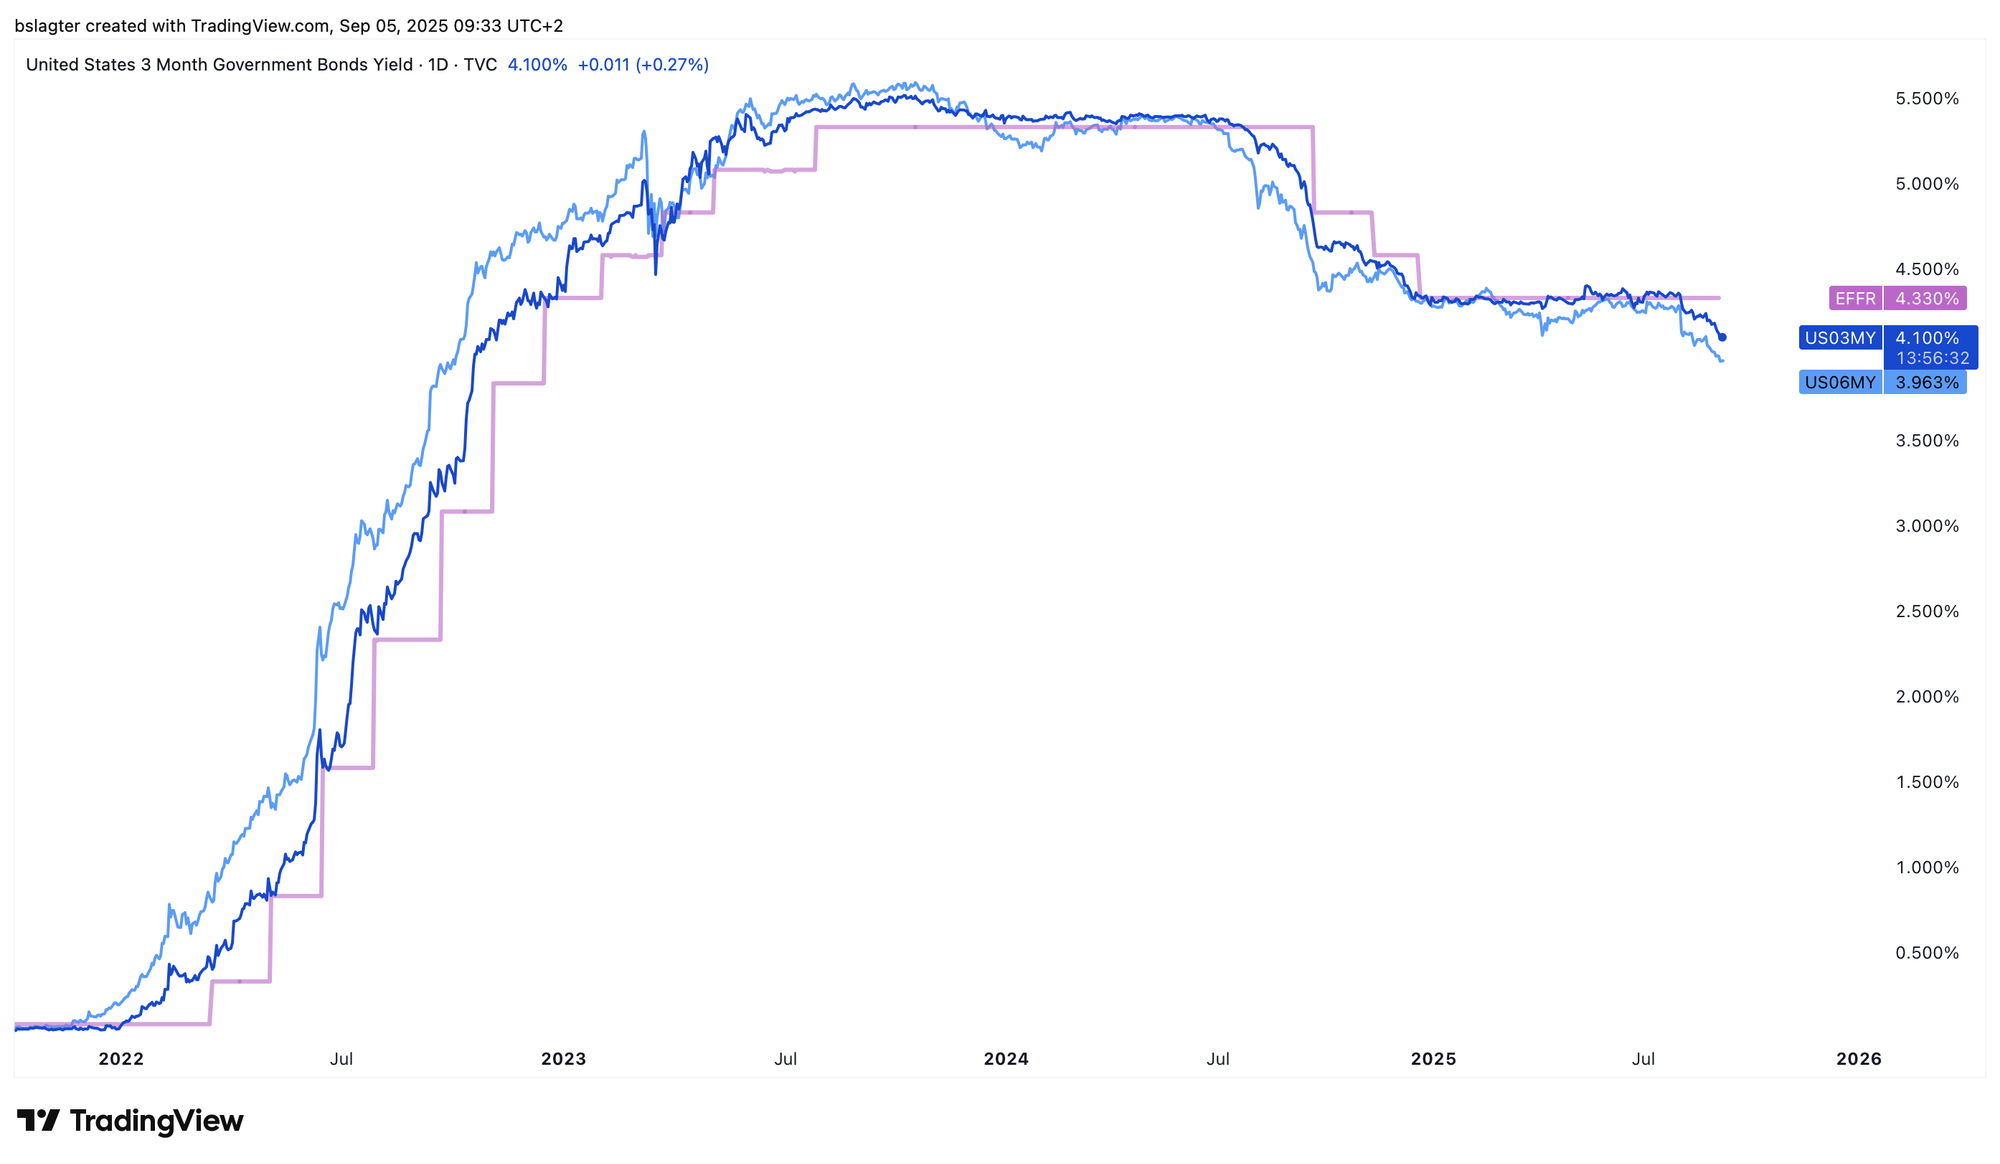
In the US, the central bank has been reluctant to lower its policy rate since the economy doesn’t seem to require an extra boost and inflation remains above the 2% target. But that decision now appears to be final.
Although Fed Funds futures yields are often used to gauge expectations for upcoming rate cuts, the futures market tends to be off the mark because its primary purpose is hedging and speculation.
The bond market offers a more reliable signal. When the 3‑month rate begins to decline, it indicates that investors believe they can earn more from such bonds than from the Fed’s policy rate. And that’s what we’re seeing right now. The 3‑month rate has paved the way for a cut in September, and the 6‑month rate is already hinting that more cuts could follow.
An expansionary fiscal policy, reinforced by loose monetary conditions, creates an explosive mix. Initially, it boosts risk assets and economic growth; later, it fuels inflation. First comes the sweetness, then the sourness.
Stocks and bitcoin are nearing the final phase of their weekly cycles. This cycle began on April 7, when prices were crushed by Trump’s trade war and tensions between Iran and Israel. Since then, the S&P 500 climbed 34%, the Nasdaq 100 increased by 45%, and bitcoin even surged 67%—all reaching new record highs before taking a short pause.
Given the macroeconomic backdrop, it seems unlikely that we’re heading into a prolonged period of weakness. A mild correction might occur—perhaps one driven more by the passage of time than by a sharp price drop.
Bitcoin displays all the signs of being in the weak final phase of its weekly cycle. It’s trading below the 10‑week moving average, and momentum indicators are declining. We’re keeping a close eye on the bottom.
After that, a new weekly cycle should begin, and our base scenario is that the upward trend will return—for both stocks and the crypto market. We discussed this in detail in last Sunday’s market update on YouTube.
Where will the turning point occur? On what date and at what price will the weekly cycle low (ICL) hit, marking the start of a new phase of gains?
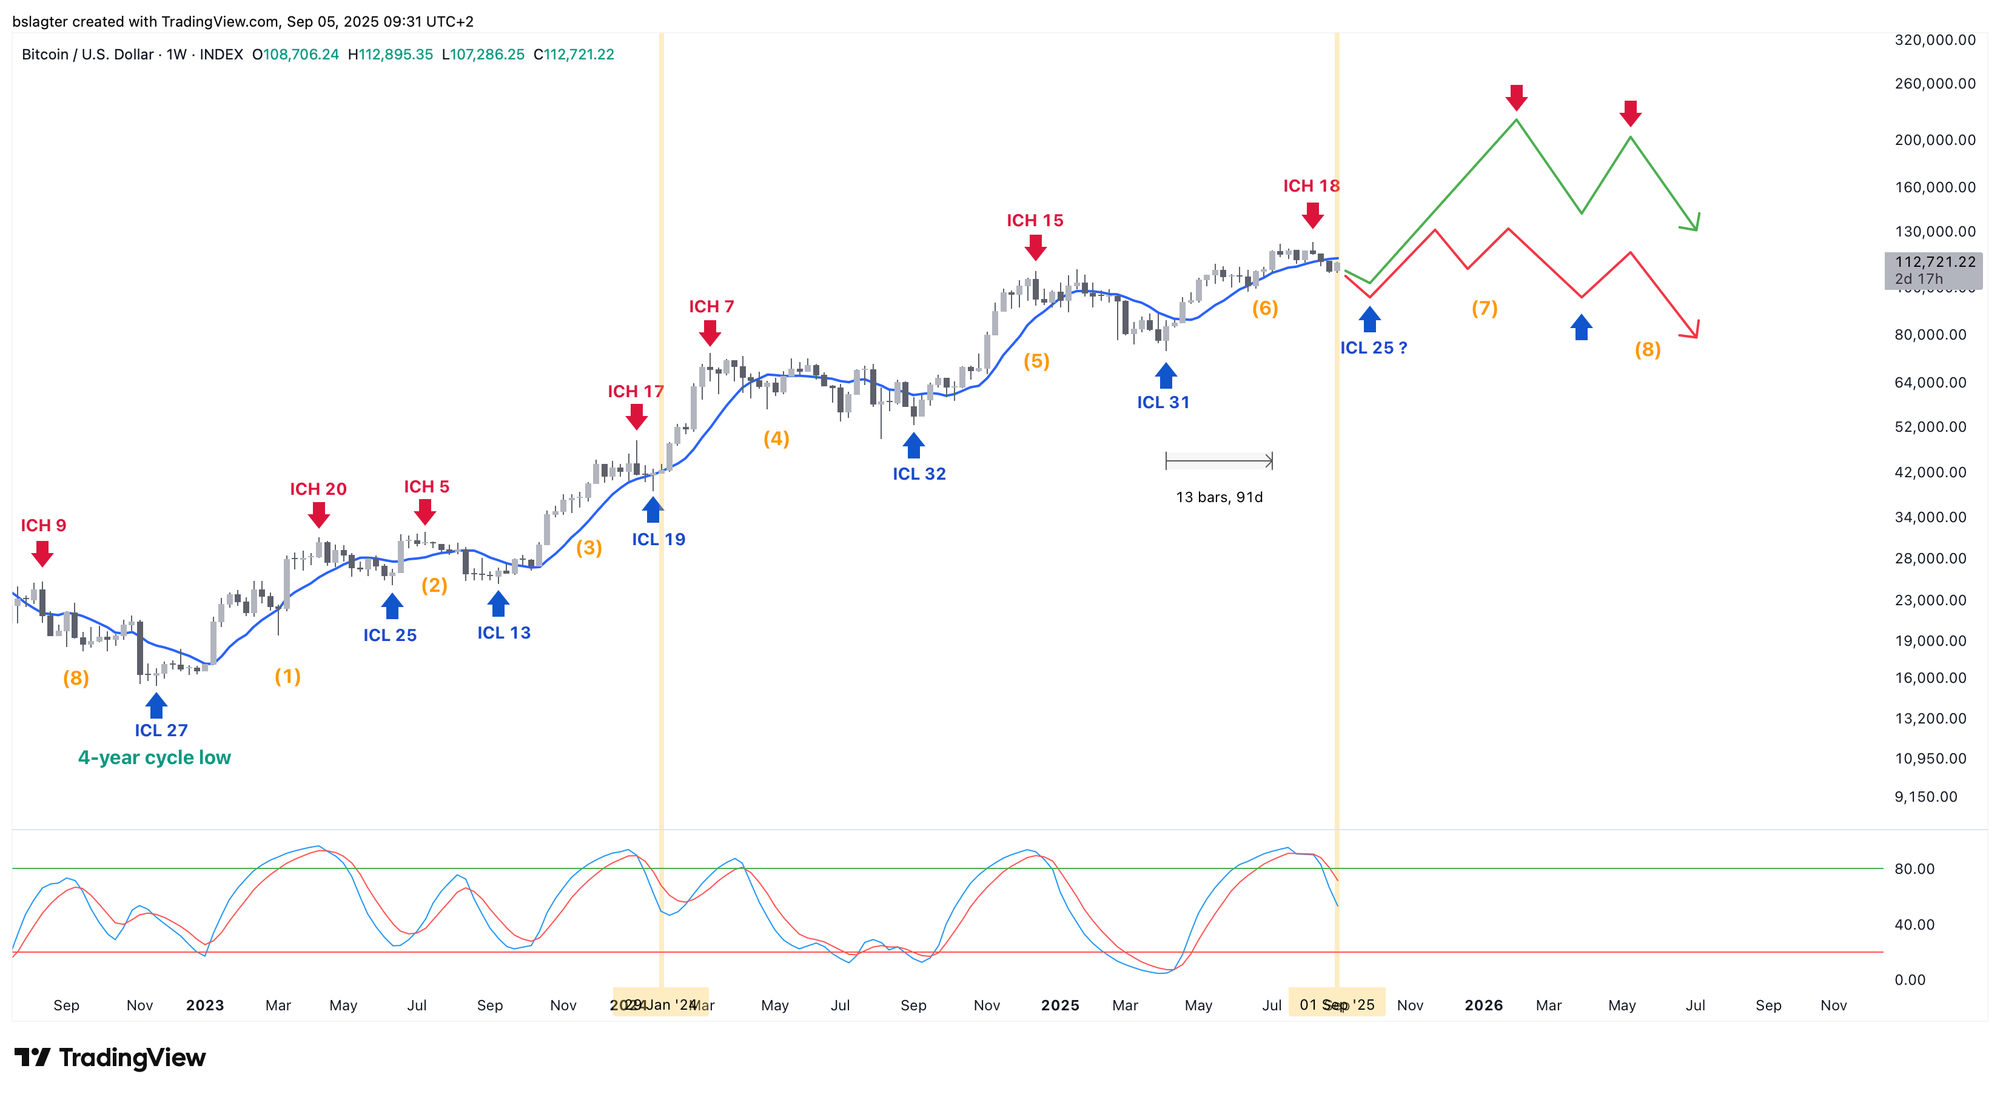
From a cycle analysis perspective, you can also examine the daily cycle, since the weekly cycle low (ICL) is always also a daily cycle low (DCL). We’re only on day 33 of an average roughly 60‑day daily cycle, which makes the end of September or early October a logical time frame.
However, external forces can easily disrupt the market’s natural rhythm. For example, in January 2024, following the launch of spot bitcoin ETFs, the weekly cycle’s end was forced within just a few weeks. In the chart below, this is shown by the left vertical yellow line.
If something similar happens again, it’s even possible that the ICL occurred this week. In that case, we’d be looking at an unusually short (half) daily cycle of 29 days, starting from an ICL of $107,250 on September 1.
That would be unusual. It seems more realistic that we’ll need a few more weeks. The week of September 15 looks promising. On September 17, the US central bank will announce its interest rate decision, and on September 19 it’s ‘quad witching day’ in the stock markets—a day when four types of derivatives (futures and options on both stocks and stock indices) expire simultaneously, often sparking volatility.
While no one can predict exactly how things will unfold, you can watch for signs of an ICL. We’ll be looking for a weekly close above the 10‑week average, rising momentum indicators, and a clear short‑term upward trend.
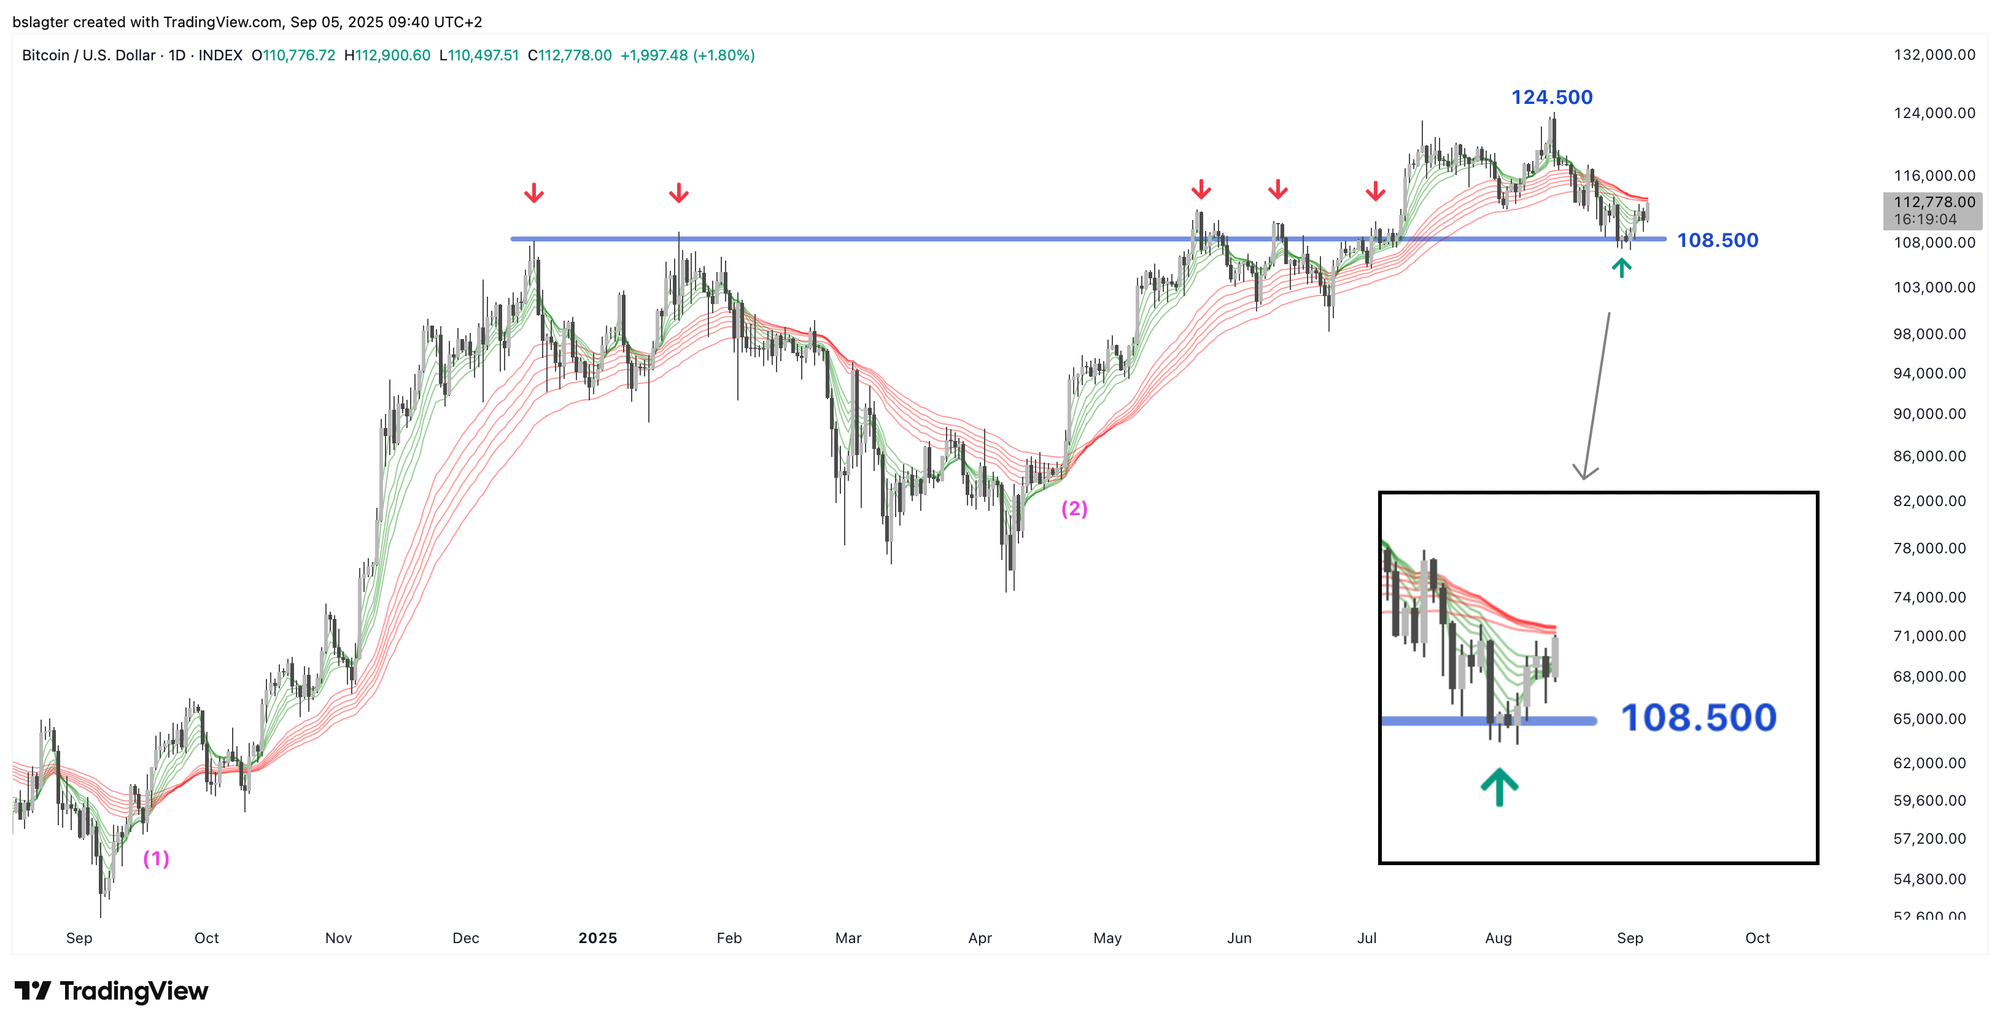
In the short term, we’re still in a downtrend, though that trend is losing steam. A daily close above $114,000 would mark several things: it would be the first higher peak since mid‑August after a series of lower highs, and it would push the short‑term averages above the long‑term ones.
The chart below shows the red (long‑term) and green (short‑term) lines. At points (1) and (2), the green cloud cuts through the red, confirming the start of a new weekly cycle.
For now, the red cloud is acting as resistance, so it’s too early for widespread optimism or taking big risks. With prices trapped between a horizontal level of $108,500 and the downtrend near $113,500, waiting appears to be the wisest course. We’ll keep you updated weekly in this newsletter. Want to be closer to the action? Join our market channel on Discord.
We will continue with the following topics for our Alpha Plus members:
- The correction in four charts
- Financial conditions remain favorable for bitcoin
- How many rate cuts can we expect from the US central bank?
1️⃣ The correction in four charts
Bert
Across all financial markets, cycles of strength and weakness tend to follow a fairly predictable rhythm, much like the seasons. While the leaves rarely change color on the exact same day each year, the timing typically only varies by a few weeks.
Autumn reveals itself in more ways than just changing leaves. The days get shorter, temperatures drop, birds migrate, mushrooms begin to appear among fallen leaves, and spiced biscuits return to store shelves.
Our current place in the cycle is evident not only in nature but also in the economy and financial markets.
Let’s examine four additional perspectives alongside cycle analysis:
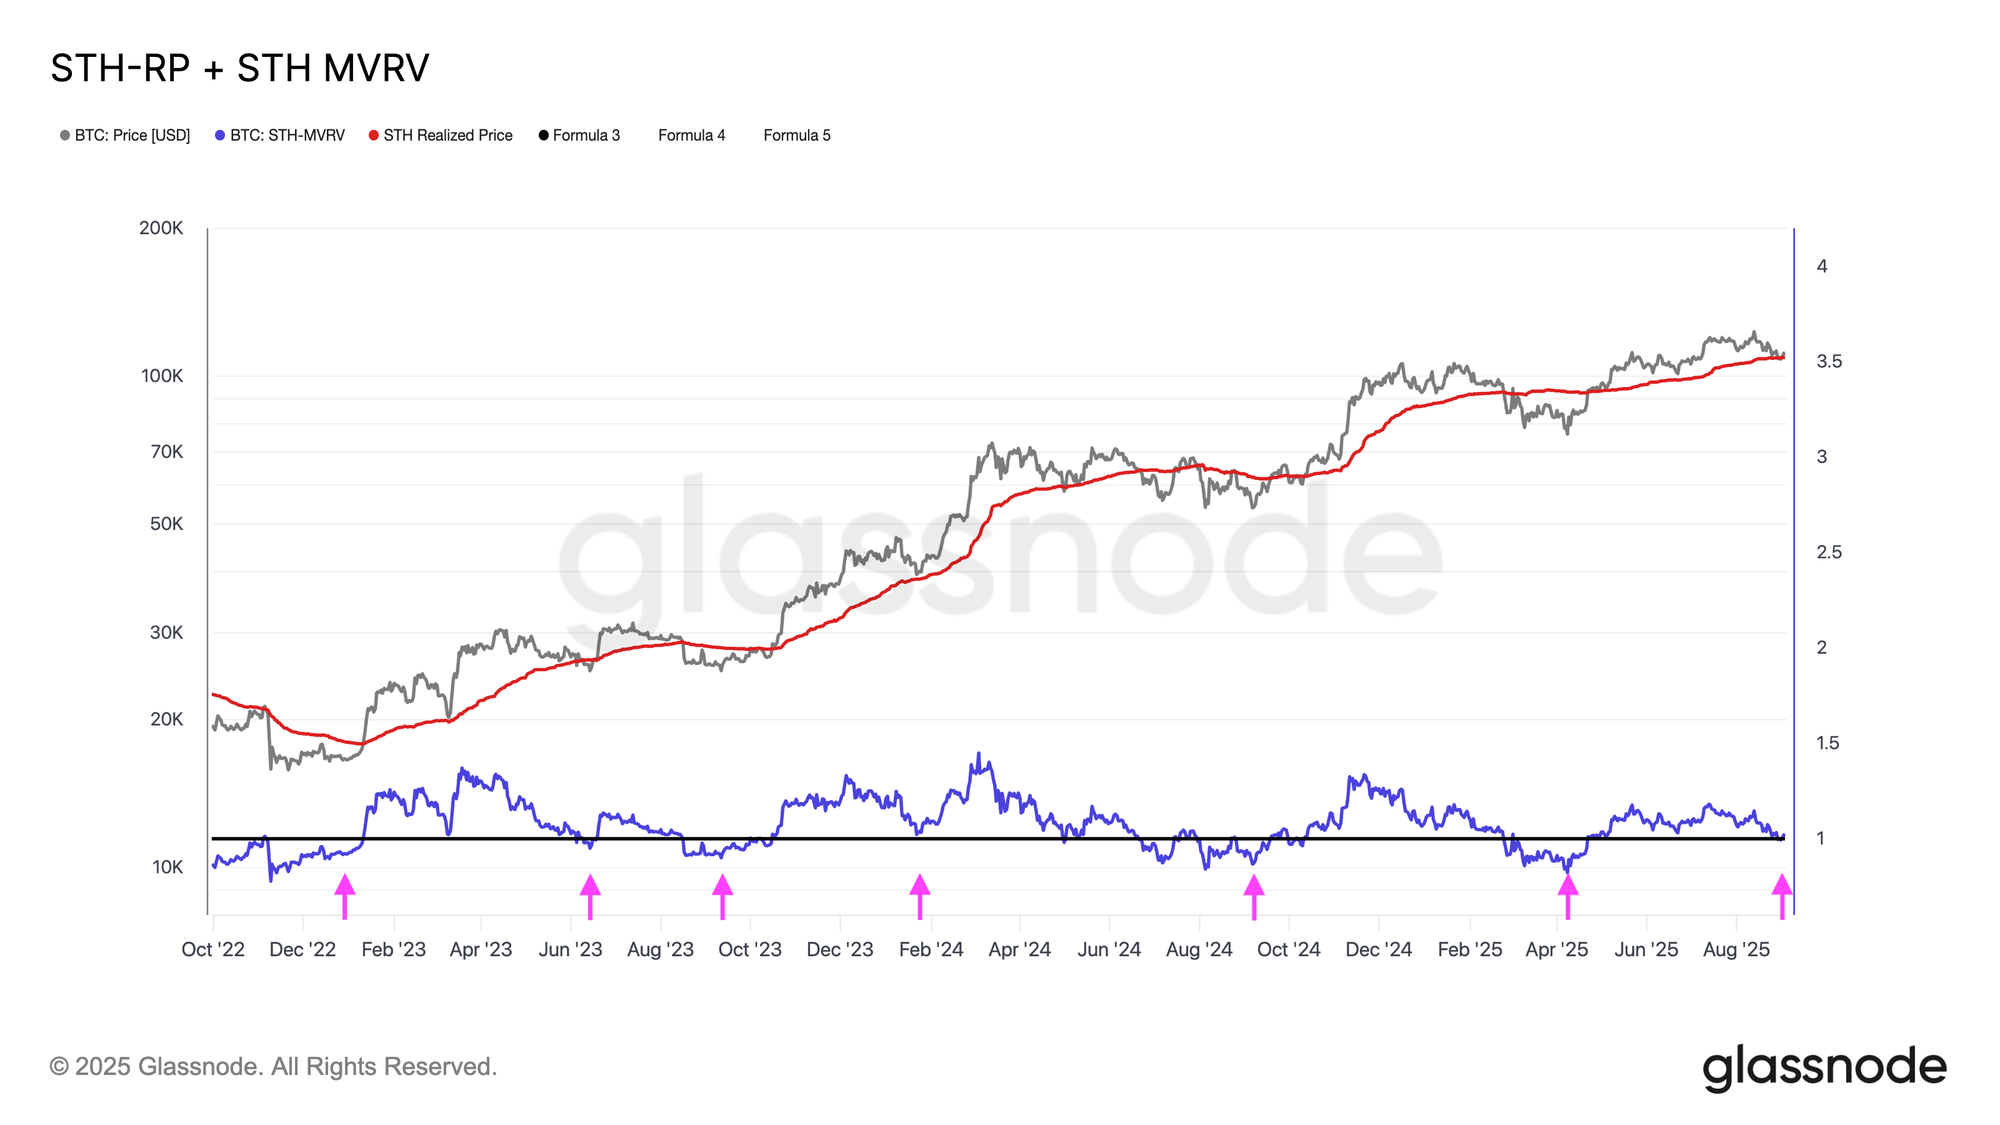
- The short‑term holder’s realized price
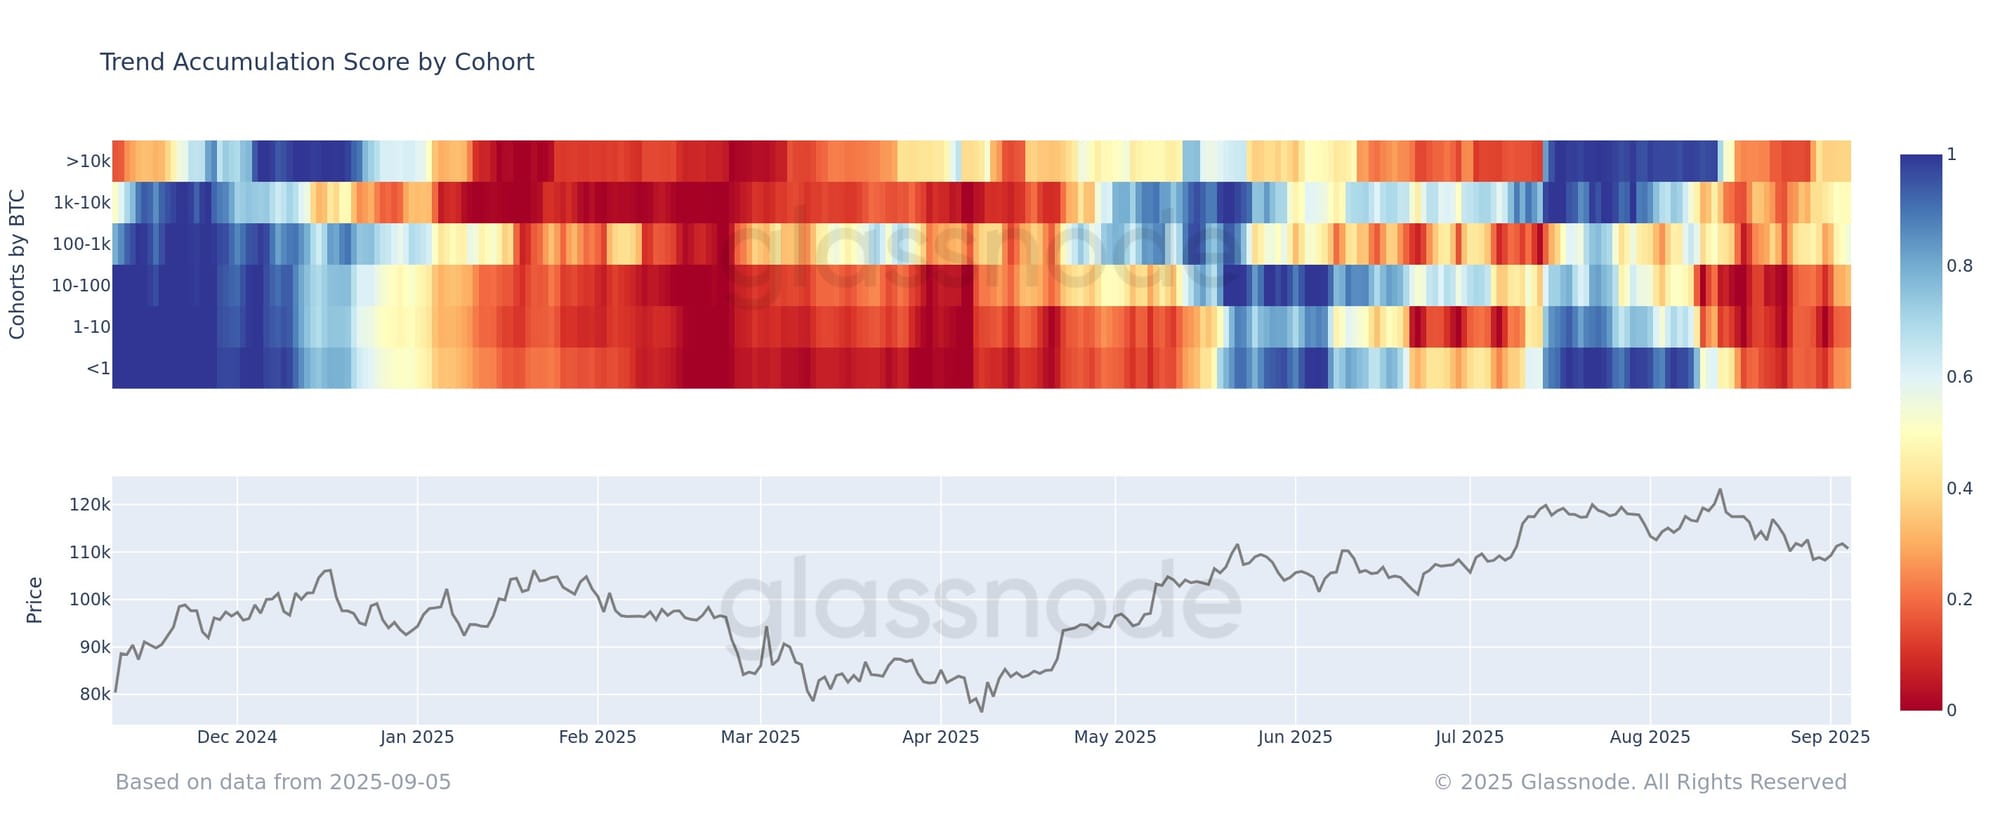
- Accumulation vs. distribution
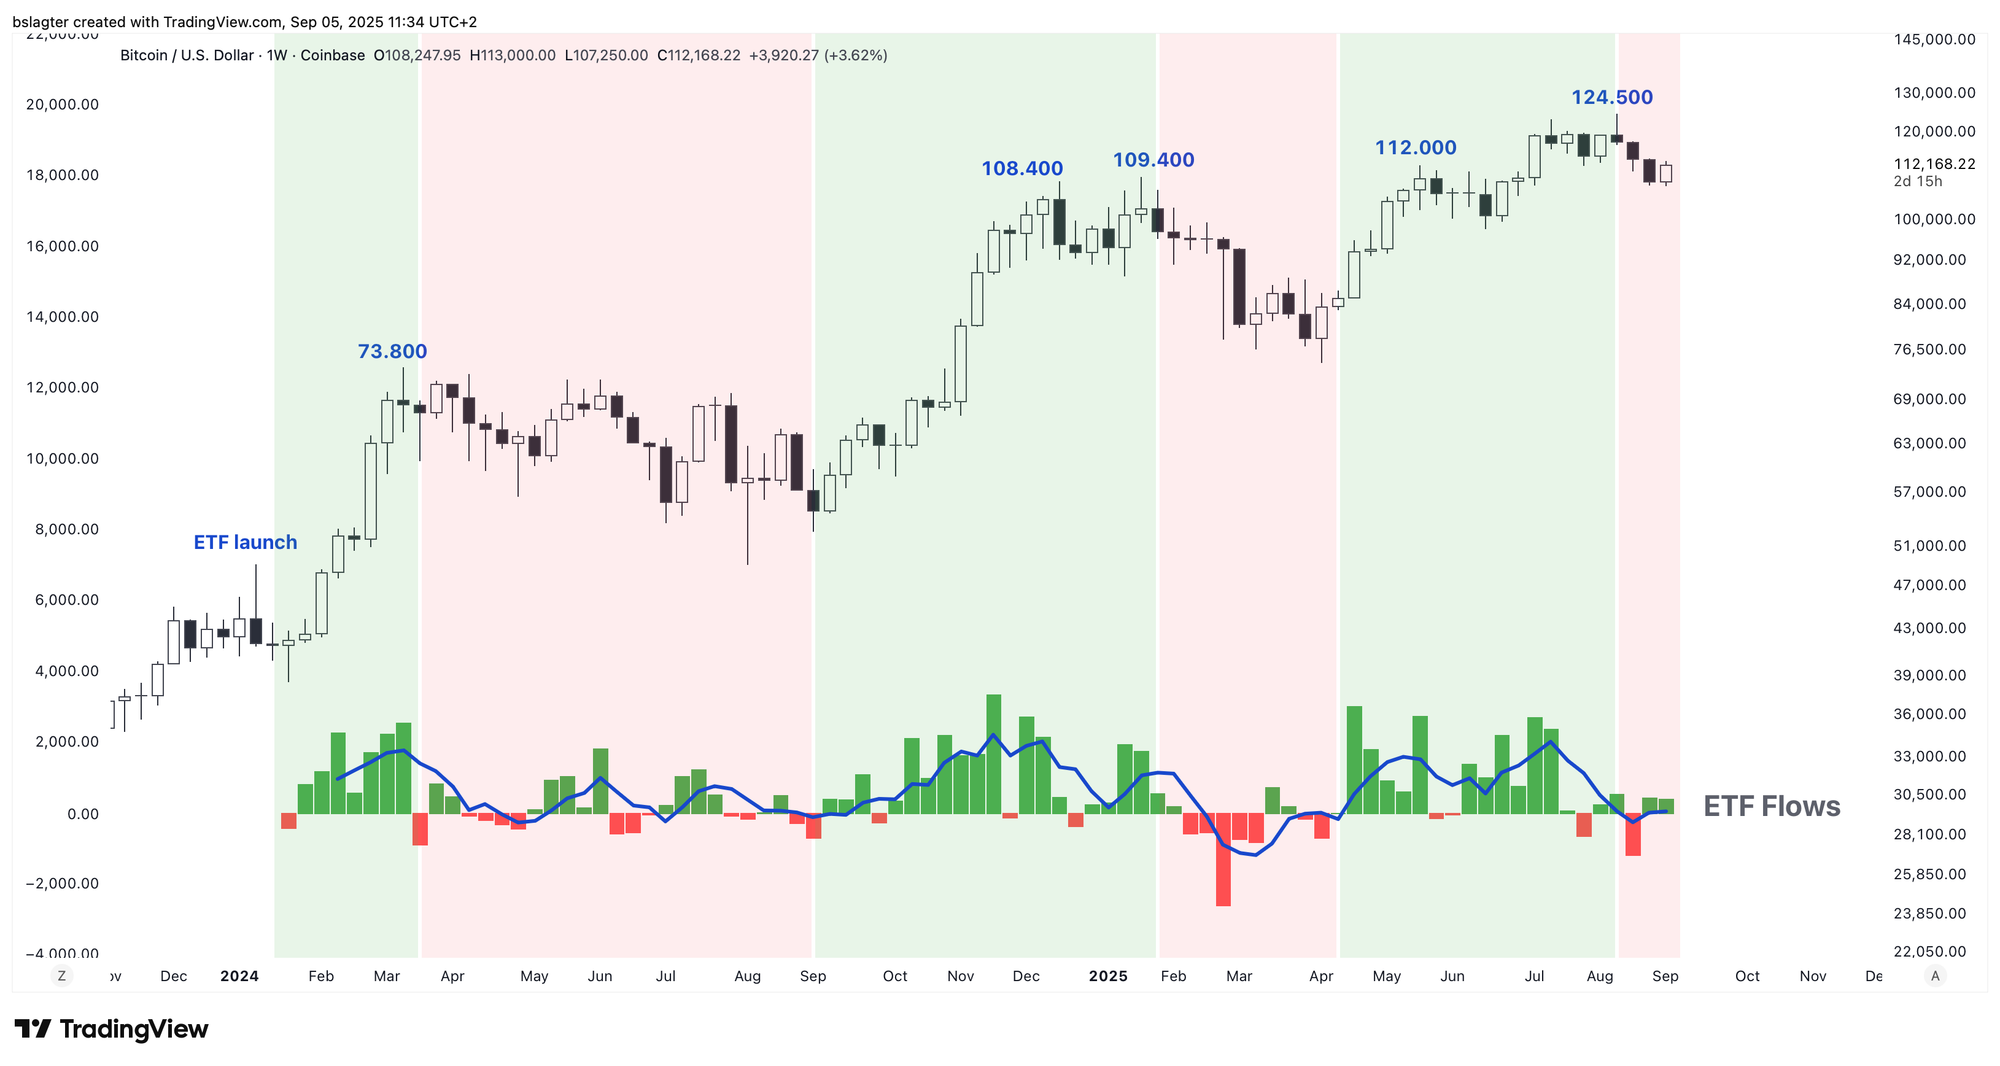
- ETF flows
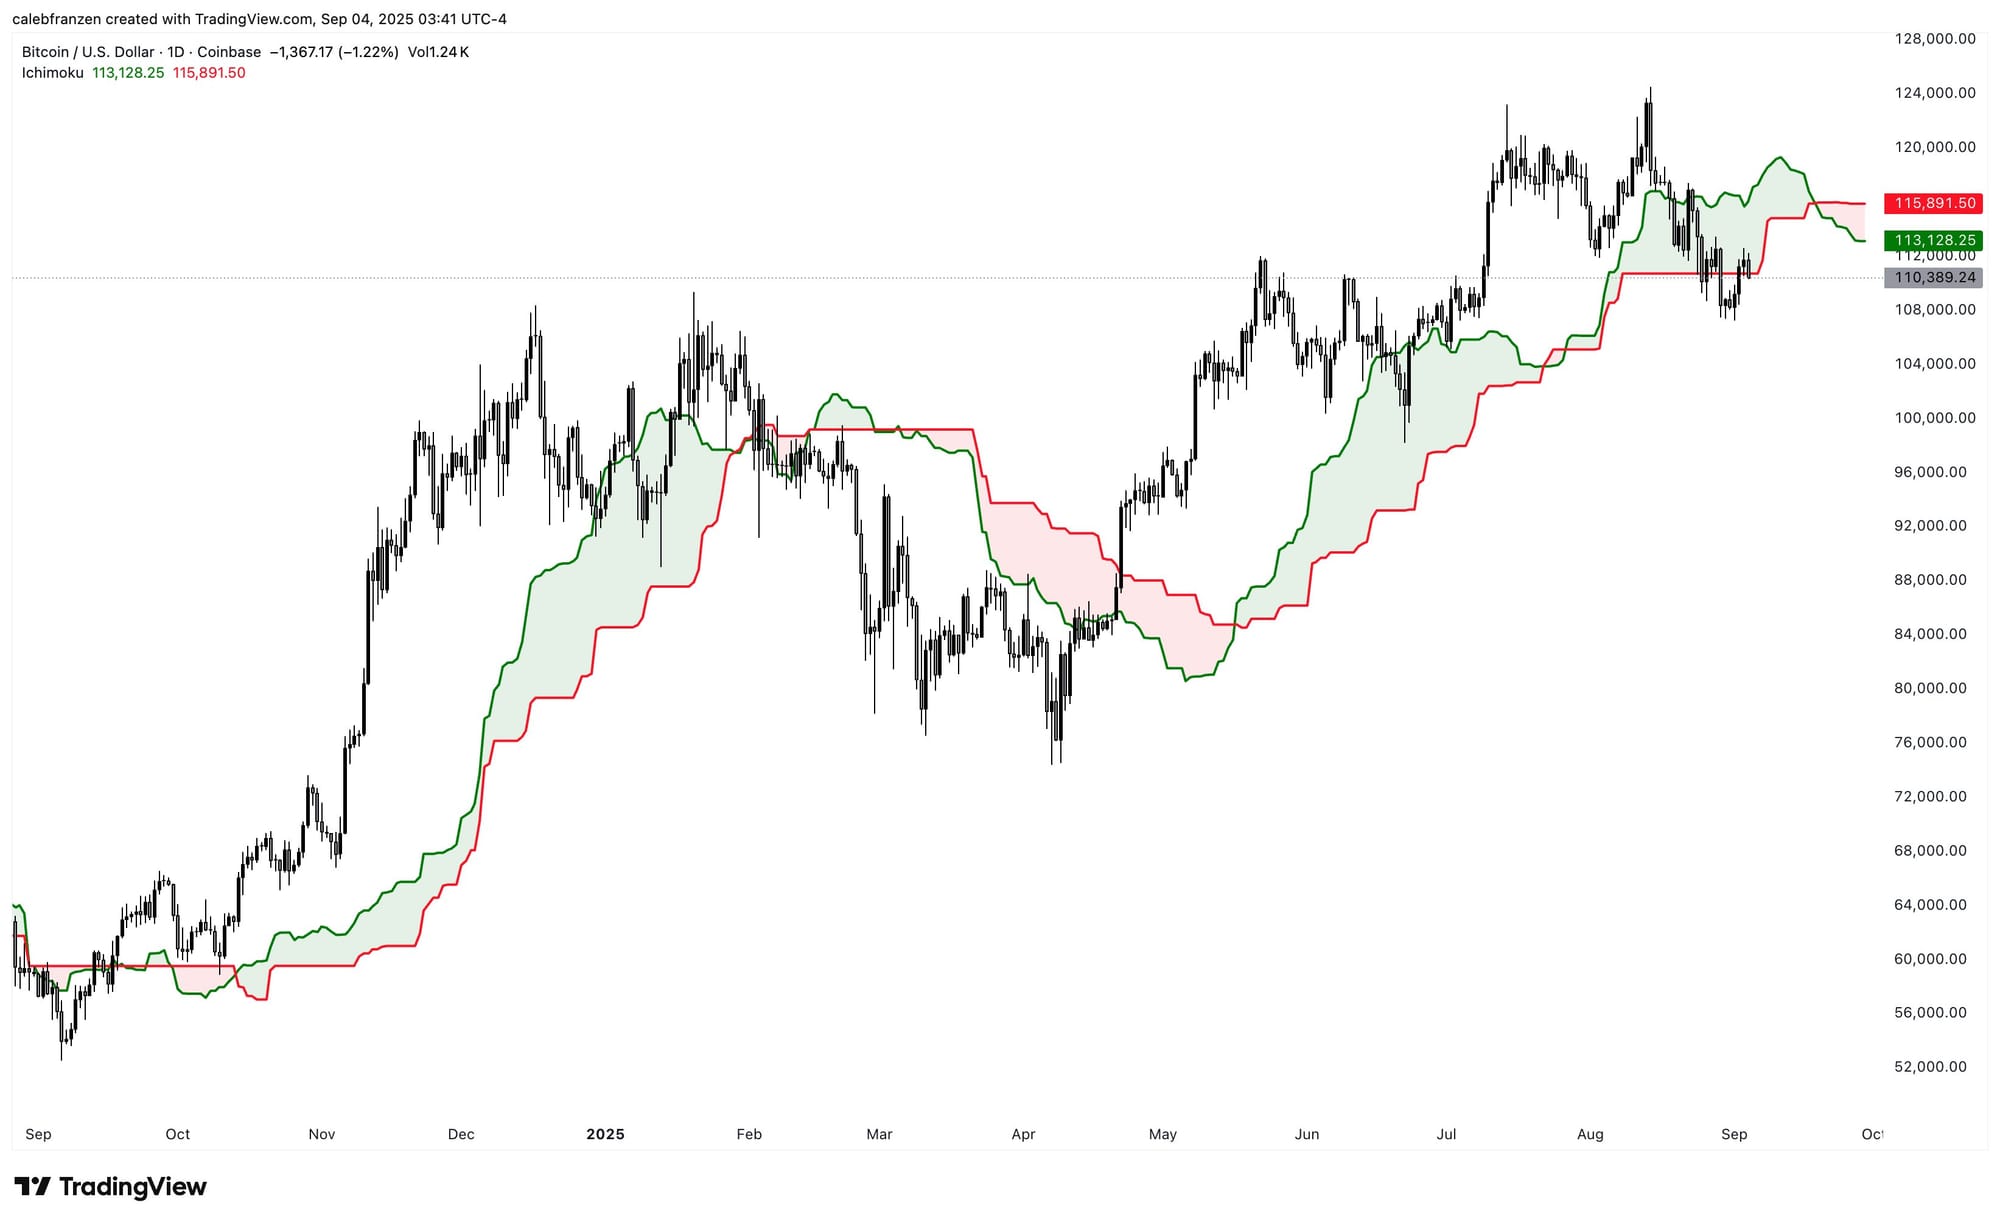
- The Ichimoku Cloud
We start with the realized price for short‑term holders, which represents the average purchase price of bitcoin acquired over the past five months. We observe that roughly every six months, the price dips below—or at best, just touches—that level, usually around the ICL.
Next, look at the behavior of existing investors through on‑chain data: are they accumulating or distributing their positions? We created this YouTube video to explain.
At the moment, we are in a phase of distribution. Although it’s relatively mild, it does indicate that current investors are choosing to sell rather than add to their positions.
In Sunday’s video, we showcased a chart by CarpeNoctum to illustrate the ebb and flow of bitcoin ETF flows. In the chart below, we overlaid a 4‑week moving average: the rising segment of the weekly cycle is marked in green, and the falling segment in red.
In recent weeks, inflows into bitcoin ETFs have stalled, and the 4‑week average has fallen to just below zero—clearly indicating that we are in the weaker phase of the cycle.
Finally, we look at a chart by Caleb Franzen, in which an Ichimoku cloud is overlaid on bitcoin’s daily chart. For the first time since February 2025, the price has fallen below the cloud.
The chart clearly shows that the ICL consistently lies below the cloud while the ICH remains above it. The upward phase of the weekly cycle generally takes place above the cloud, and the downward phase below it—a strong piece of technical evidence.
Conversely, these four signals suggest that we’ve already passed the ICL: a rise above the Ichimoku cloud, the return of ETF inflows, a shift from distribution to accumulation, and prices moving above the short‑term holders’ realized price. If all these align, then the ICL is likely behind us.
2️⃣ Financial conditions remain favorable for bitcoin
Thom
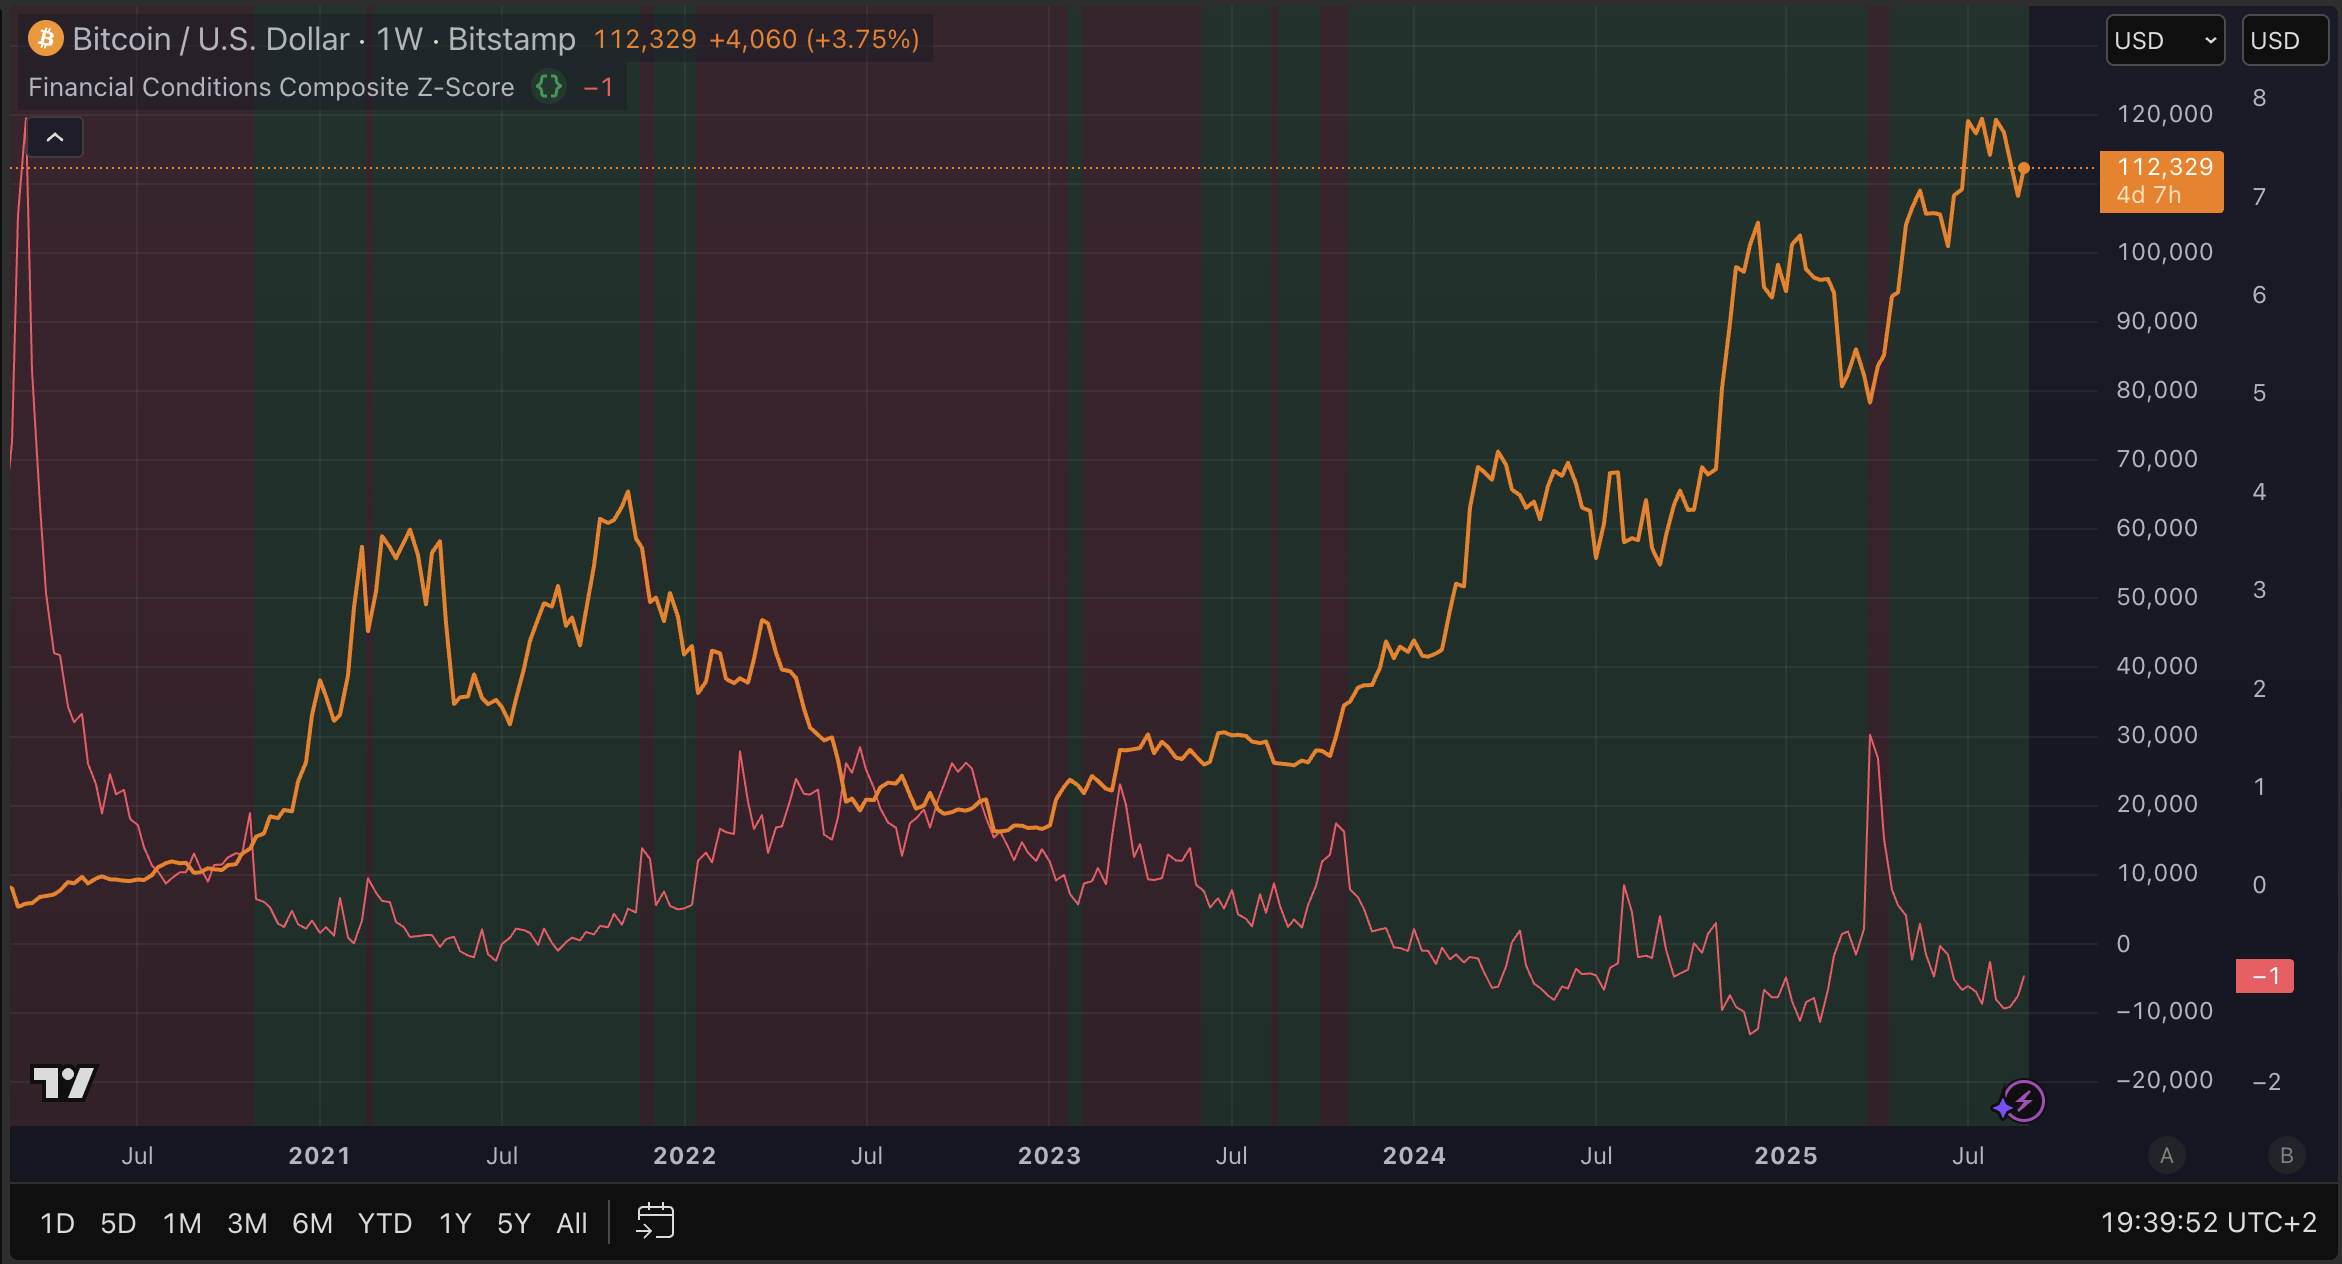
Although bitcoin has gone through some turbulent weeks and has fallen significantly from its all‑time high, the overall financial conditions remain favorable for the long term.
Expected volatility for stocks (VIX) and US government bonds (MOVE) is currently very low, and the same applies to credit spreads—the extra yield that riskier companies must offer compared to risk‑free US government debt.
In simple terms, this means there is little fear of a recession, and the market looks forward with confidence, expecting steady momentum to continue.
This is reflected in the chart below, where the red line combines the z‑scores of the VIX, MOVE, and two credit spreads—a relative measure that compares current volatility and credit spreads with recent history.
At present, these z‑scores are very low, indicating exceptionally favorable financial conditions. Simply put, it’s currently easier to access fresh capital.
We’re seeing a set of conditions that will likely continue to boost global liquidity—the amount of capital available worldwide for investments—a concept often cited by analysts.
One could argue pessimistically that bitcoin might be nearing a peak since favorable financial conditions typically occur at the low point of the cycle, signaling the start of a new bear market.
However, that conclusion is premature since it’s impossible to predict how long these financial conditions will last—and they might even improve further.
Until a clear catalyst triggers a reversal, such as a sharp increase in long‑term global bond yields, I remain patient for the bull market to resume. My main outlook is that bitcoin is in a temporary challenging phase and that new all‑time highs are likely in 2025.
3️⃣ How many rate cuts can we expect from the US central bank?
Thom
The market consensus is that the US central bank will cut rates on September 17. While I believe that inflation poses a greater risk than a sharp slowdown in economic growth, I also expect to see a rate cut in roughly two weeks.
Why? Because the US central bank has repeatedly stated that the recent rise in inflation is a temporary effect of Donald Trump’s tariff war. In other words, it isn’t a structural issue to be overly concerned about.
They also anticipate that economic growth and the labor market will cool enough to prevent inflationary pressures from becoming ingrained.
For now, most indicators point to a robust economy that has largely surpassed expectations. Coupled with a Trump administration that is aggressively pushing for stimulus and the current favorable financial conditions—which shouldn’t be viewed in isolation—it’s hard to justify a scenario involving multiple rate cuts.
Currently, the market is pricing in six to seven rate cuts by the end of 2026, which seems rather optimistic based solely on economic conditions. For that reason, I remain very positive in the coming months.
The risk is that market optimism about rate cuts is partly driven by the Trump administration increasingly influencing the US central bank. In May 2026, Trump will have the opportunity to appoint a new chair, who is likely to favor even deeper rate cuts.
That might sound appealing, but the danger is that such aggressive stimulus could undermine confidence in long‑term government bonds—potentially triggering a sharp spike in long‑term yields. If the US central bank were to lose its independence, it could create significant turmoil in the global economy.
My hope is that the US central bank maintains its independence and takes appropriate action if inflation starts to become a real problem.
Thank you for reading!
To stay informed about the latest market developments and insights, you can follow our team members on X:
- Bart Mol (@Bart_Mol)
- Peter Slagter (@pesla)
- Bert Slagter (@bslagter)
- Mike Lelieveld (@mlelieveld)
We appreciate your continued support and look forward to bringing you more comprehensive analysis in our next edition.
Until then!