Early Signs of a Comeback
Bitcoin shows rare strength—a higher high emerges, and the $107,250 low sparks the question: Is the worst over? With Fed rate cut hints, shifting cycles, and bold macro trends, the market may be poised for its next leap. Dive in to see what's next!

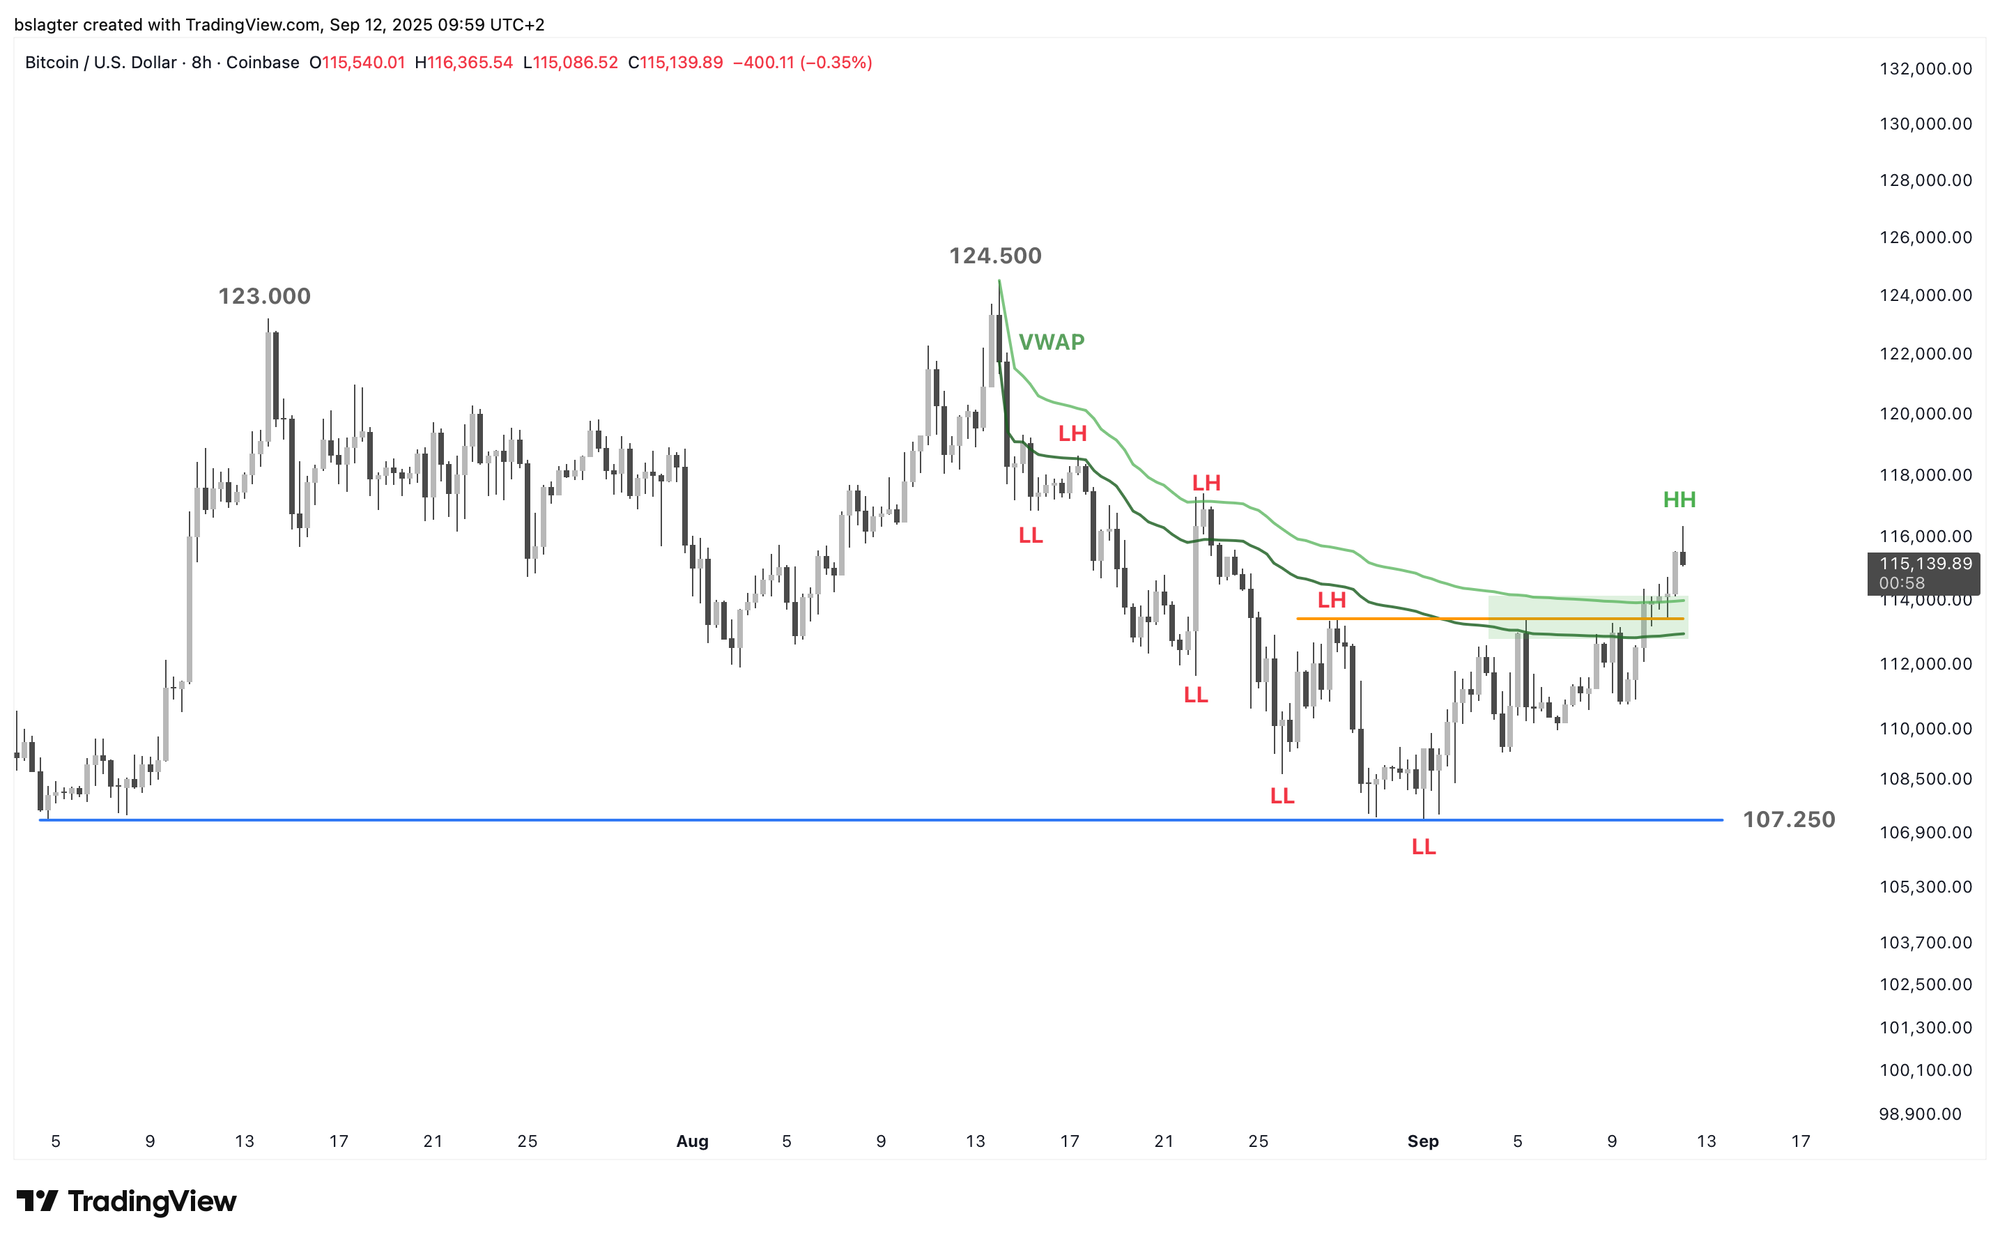
For the first time in four weeks, bitcoin is showing signs of strength. After a series of lower highs (LH) and lower lows (LL), we now see a higher high (HH) on the chart below. We're also trading above the volume-weighted average price (VWAP) that has supported the decline since the August 14 high.
Could the $107,250 on September 1 be the bottom?
In addition to our thoughts on that question, this edition of the Markets also features the following deep dive:
- The daily & weekly cycle
- Favorable macro numbers for bitcoin
- Does AI drive more growth with fewer jobs?
- Raoul Pal & Michael Howell: peak in spring 2026
- Altseason update
There’s plenty to read, so let’s return to the big question: Is the worst now behind us? To answer that, we look at the return of investor confidence.
Is the bottom behind us?
We use the following checklist to gauge investor confidence:
- A higher high in the short term ✅
- A breakout above the VWAP ✅
- A weekly close above the 10-week average, currently at $115,500
- A daily close above $120,000
- An inflow of $2 billion into bitcoin ETFs within a week
- An on-chain shift in investor behavior from distribution to accumulation
- A return of optimistic sentiment
Only two checkmarks so far is a bit scarce. As the saying goes, one swallow does not make a summer. While it's possible that we began a new weekly cycle on September 1, history isn’t on our side. A correction from $124,500 on August 14 to $107,250 on September 1—a 14% drop in 18 days—would be considered very mild.
That's why we'd like to see a few more checkmarks before we adopt the baseline scenario that the weekly cycle low is behind us.
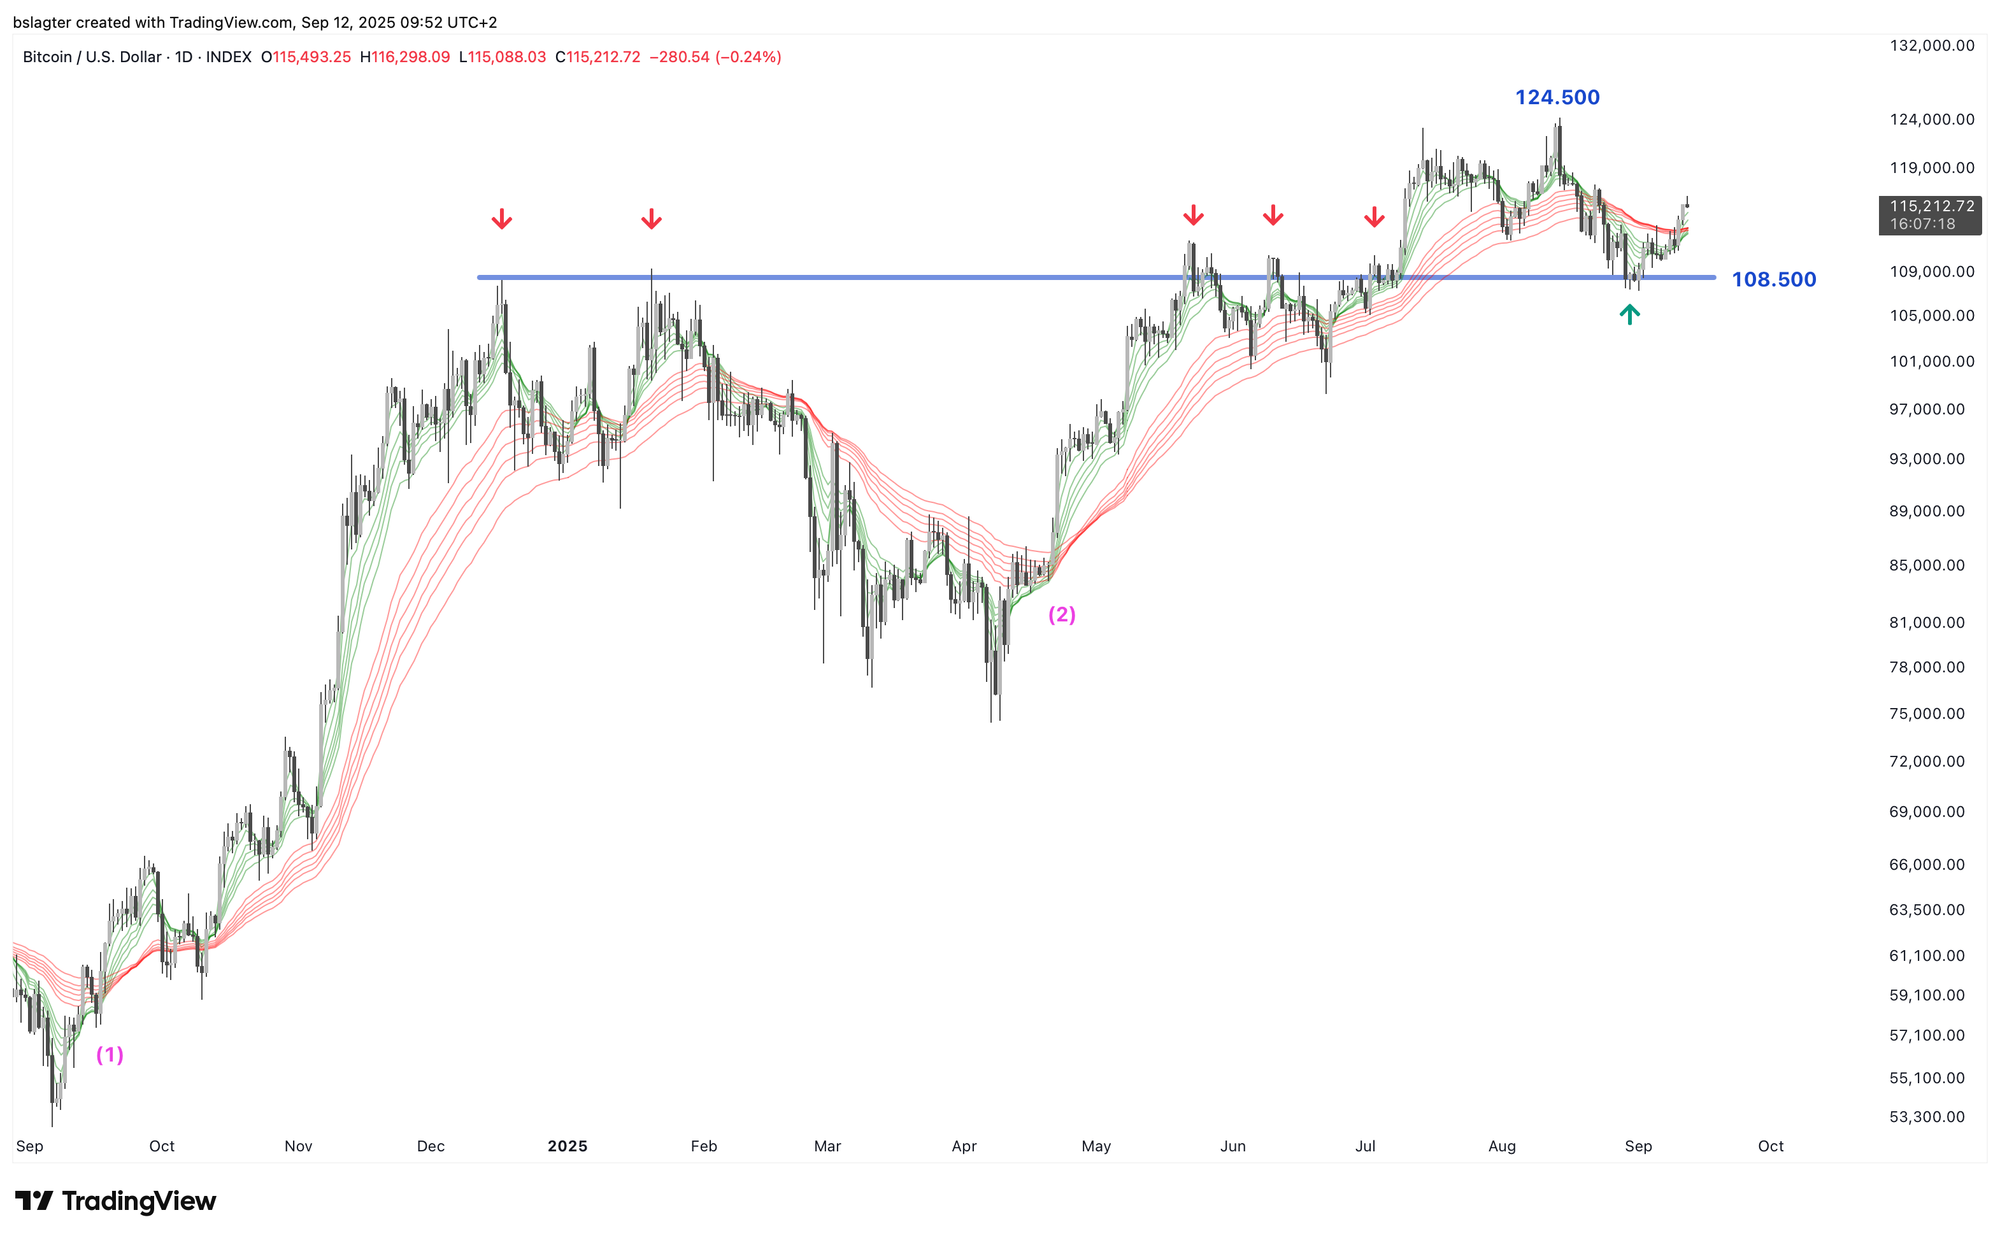
The chart below shows the past twelve months. With markers (1) and (2), we've indicated the two previous instances when the short-term averages (green) crossed above the long-term averages (red). In both cases, it signaled the start of a new weekly cycle upswing.
We don’t see that crossover now. Although the price is above the averages, the green and red lines have yet to cross.
Investor confidence would certainly get a boost if the bottom holds around $108,000. Then, the bottom of this weekly cycle would serve as a successful test of the zone marked by peaks at 108k, 109k, and 112k. This could mean that the bottom truly occurred on September 1, or that we might see a second bottom in that zone later this month.
Next Wednesday, September 17, the U.S. central bank is very likely to lower its policy rate. The questions are how much, what the reasoning will be, and what the outlook is.
This is important because a rate cut isn’t inherently positive or negative. We hear both perspectives:
- Rate cuts are positive—they stimulate the economy and benefit financial markets. Just think back to the rally at the end of last year following rate cuts.
- Rate cuts are negative—they signal underlying economic problems and the potential onset of a recession. The previous major series of rate cuts occurred during the crises of 2001, 2008, and 2020.
Both can be true. It all depends on the context in which the rate cut is implemented.
A normalizing rate cut accompanied by a soft landing is positive. As inflation falls, rates can be gradually lowered to keep the real rate stable without unnecessarily hindering the economy. This scenario is favorable for financial markets.
A necessary rate cut to stave off a recession is negative. Economic data, such as unemployment and growth figures, are reported with a lag. If those numbers deteriorate, the recession could deepen significantly—bad news for financial markets.
An urgent rate cut to address an acute crisis is very negative. This happens when issues in the banking system or bond market arise, triggered by shocks such as natural disasters, wars, or political crises.
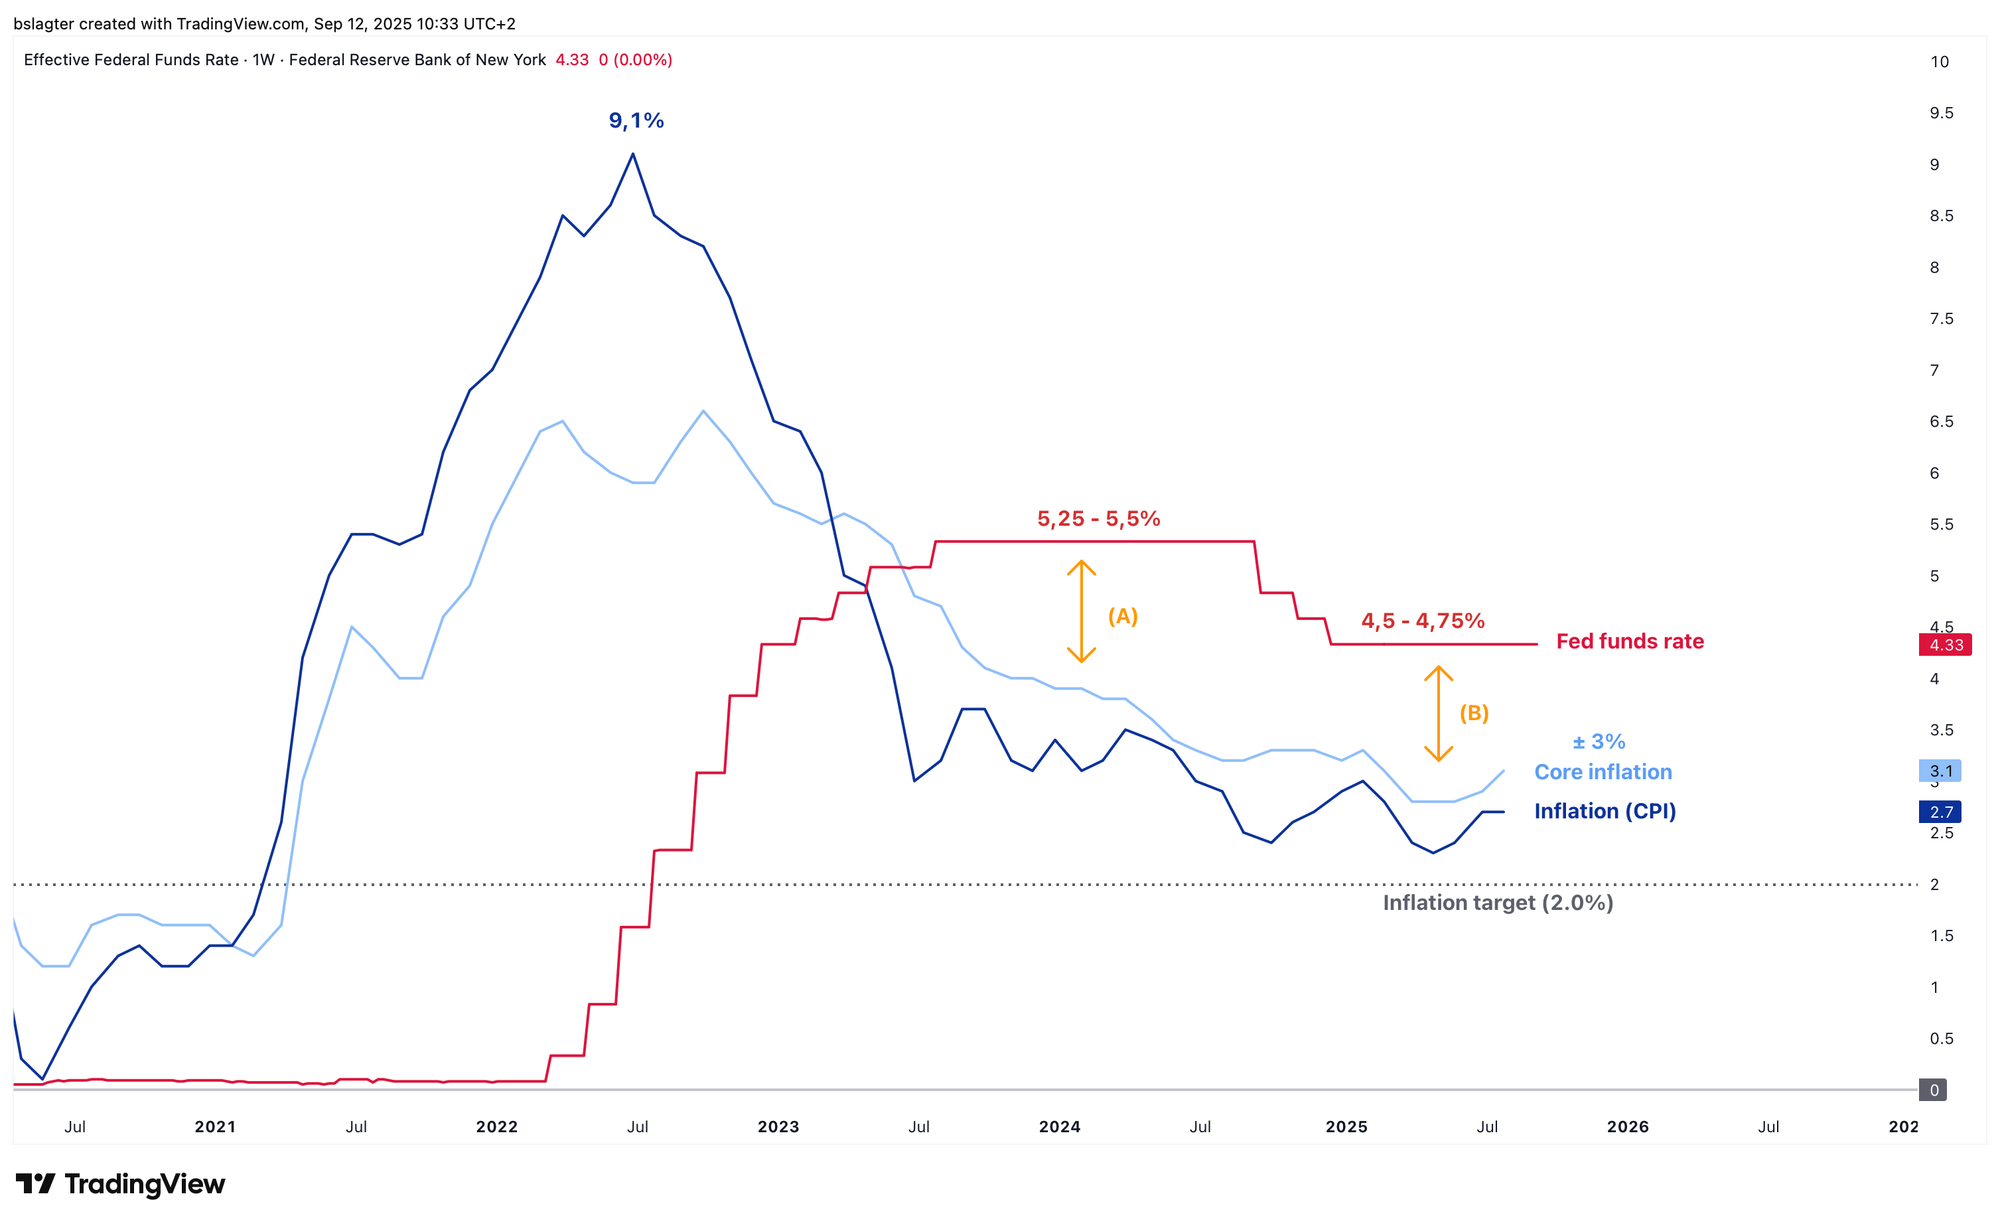
The chart below shows the policy rate (red) and inflation (blue).
Last year’s rate cuts were of a normalizing nature. The rate was significantly above neutral and was suppressing economic activity. By lowering rates in small steps, the Fed eased the brake on the economy without causing undue harm.
The U.S. economy appears to be in excellent shape at the moment. However, the data is hard to interpret:
- Inflation figures are skewed by one-off effects, such as import tariffs.
- Job numbers are distorted by structural changes during the corona period, Trump’s migration policies, and the rise of AI.
It's not just about the numbers, but also about how the central bank interprets them. That’s why Powell’s commentary is important. If he lowers rates by 25 bps and expresses confidence in the economy, that would be bullish. On the other hand, a big 50 bps cut paired with a gloomy outlook would be bearish.
1️⃣ The daily & weekly cycle
Bert
Today marks day 40 of this daily cycle. If September 1 was the weekly cycle low (ICL), it would also represent the daily cycle low (DCL) on day 29—an unusual and less straightforward outcome.
Therefore, we assume that both the DCL and the ICL are still ahead of us. Come October 2, this daily cycle will span exactly 60 days, making the end of September or early October a logical window.
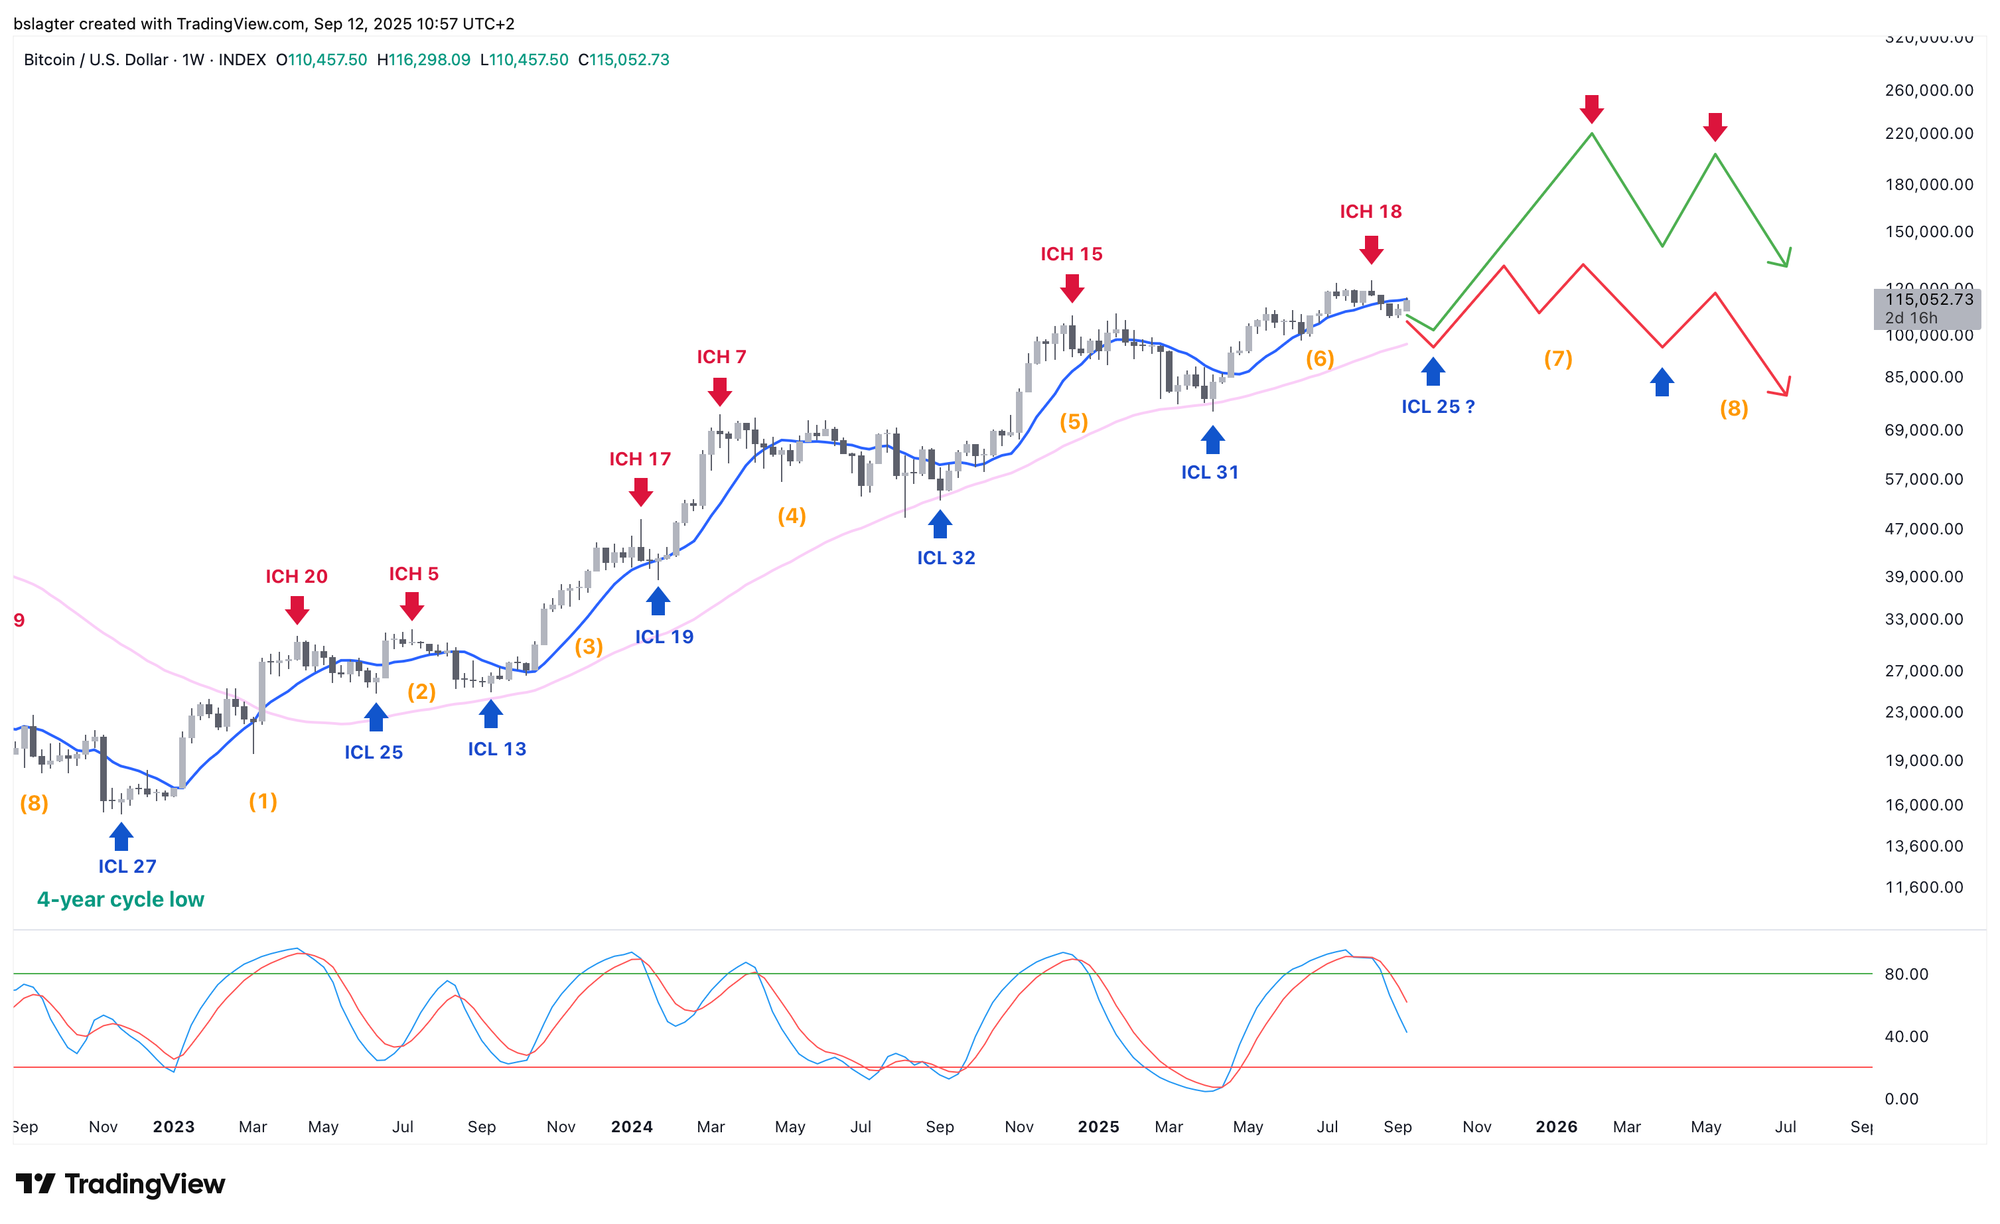
As mentioned above, in the later stages of a bull market, the market often grows impatient. Corrections may become shorter and shallower, and a distinctly defined bottom might be absent. The price could trade sideways for a while before surging upward. That would be the ideal green path.
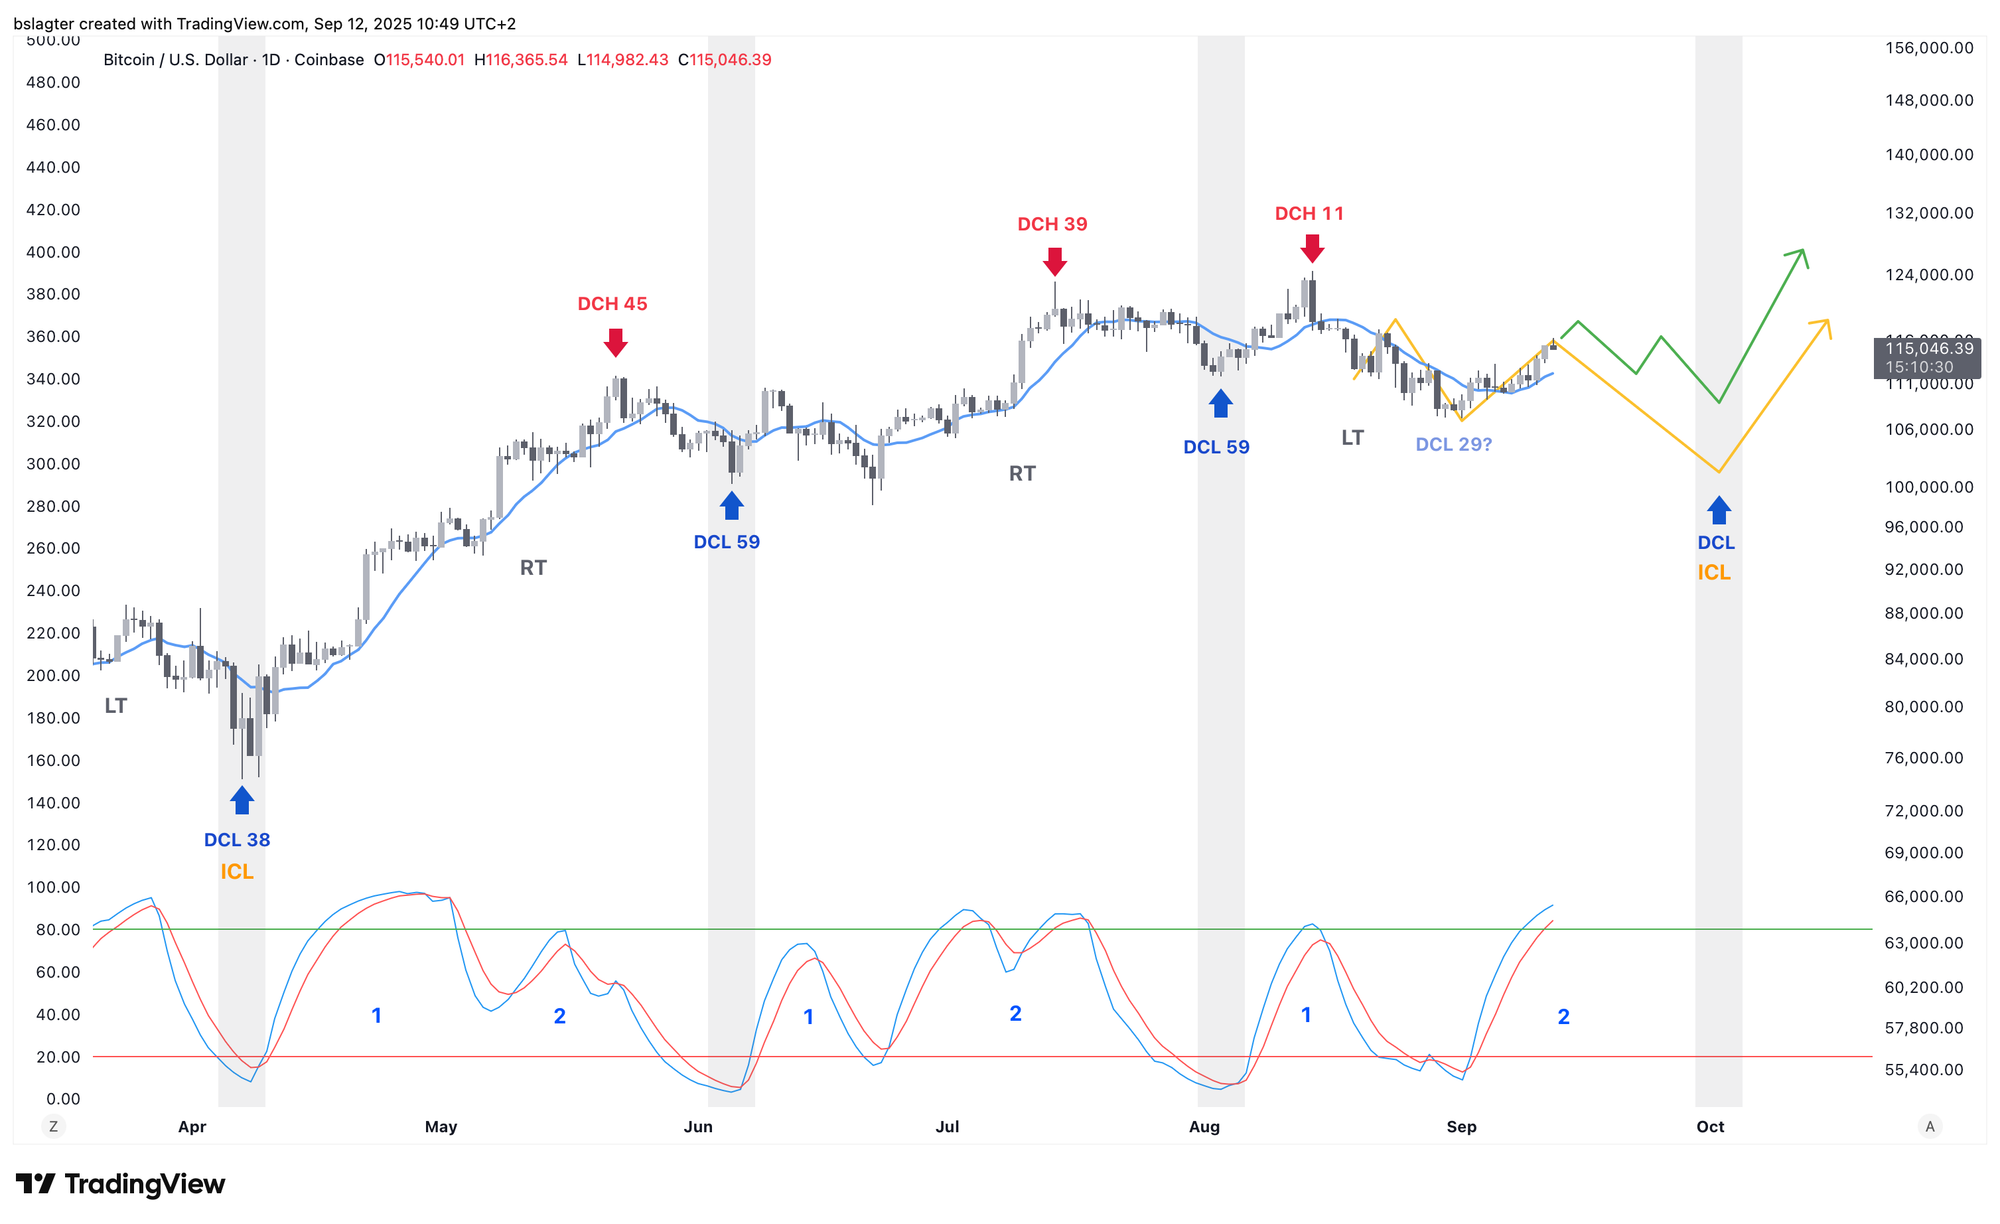
In contrast, the traditional ICL, marked in yellow, features a distinctly deeper low. In the past, we often saw a brief touch of the 50-week average. That average is now at $97,000 and rising by about $1,000 per week, as shown by the light pink line in the chart below.
Our baseline scenario is that the next weekly cycle—the seventh in this bull market—will continue upward. Governments are stimulating the economy and central banks are providing support through accommodative monetary policy, which benefits risk investments.
The green path in the chart below represents an optimistic version of our baseline scenario, where the price more than doubles from the ICL. In that case, we might expect some hype and euphoria, setting the stage for a somewhat prolonged period of subsequent weakness.
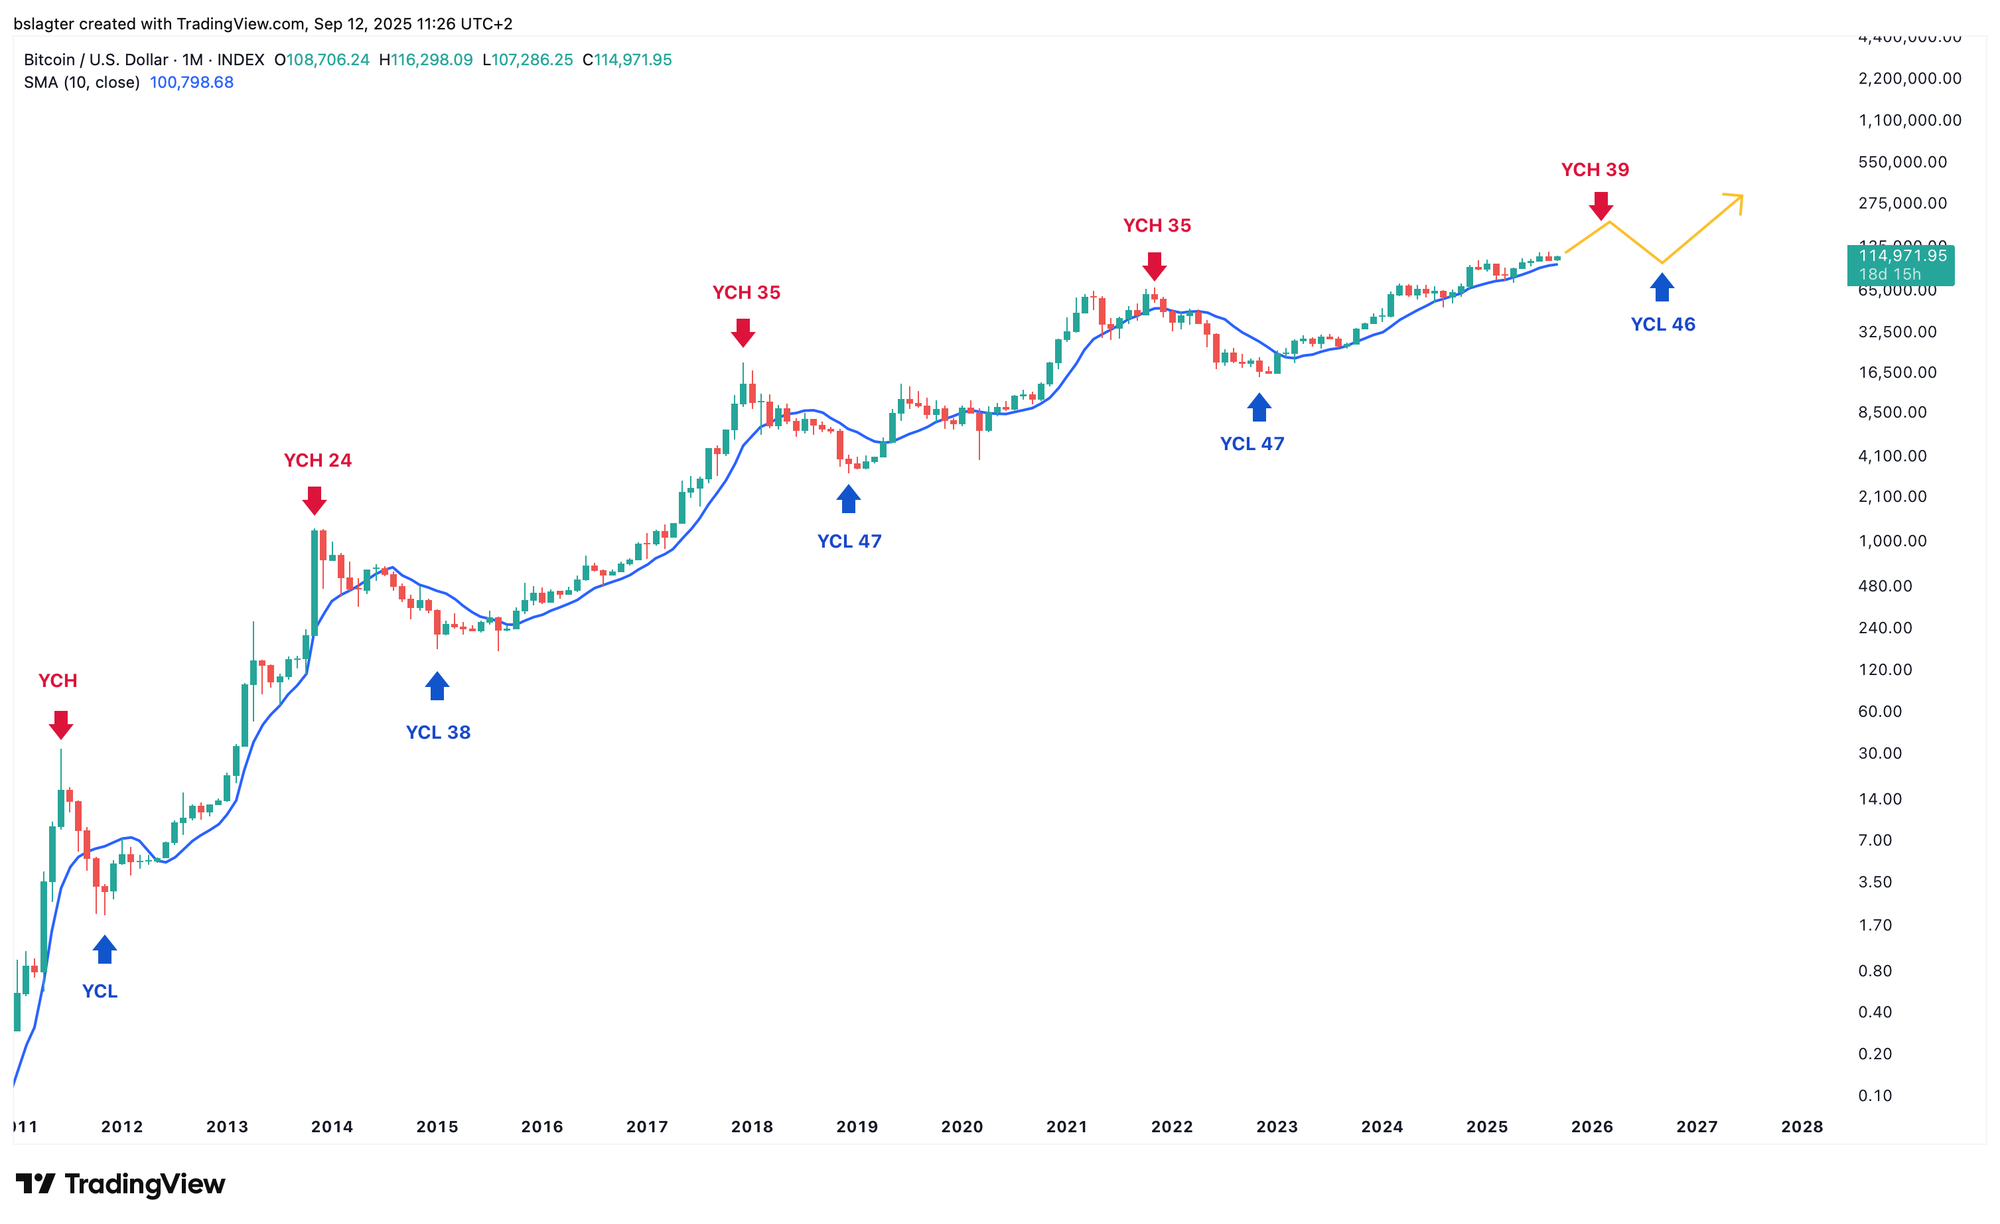
This could well mark the declining phase of the yearly cycle—that is, the bear market—although it might not develop into the classic bear market with collapsing crypto companies and a 75% drop. A single solidly declining weekly cycle might be enough to reach a yearly cycle low.
Let’s illustrate that scenario within the yearly cycle: A peak in February 2026 followed by a weekly cycle bottom in September 2026 would look something like this.
A mild, shallow yearly cycle low would be consistent with conditions such as the entry of institutional players, constructive regulation, and economic growth spurred by global stimulus measures.
2️⃣ Favorable macro numbers for bitcoin
Thom
After a week of weak labor market data that gave the U.S. central bank more reason to implement rate cuts, this week’s focus shifted to inflation.
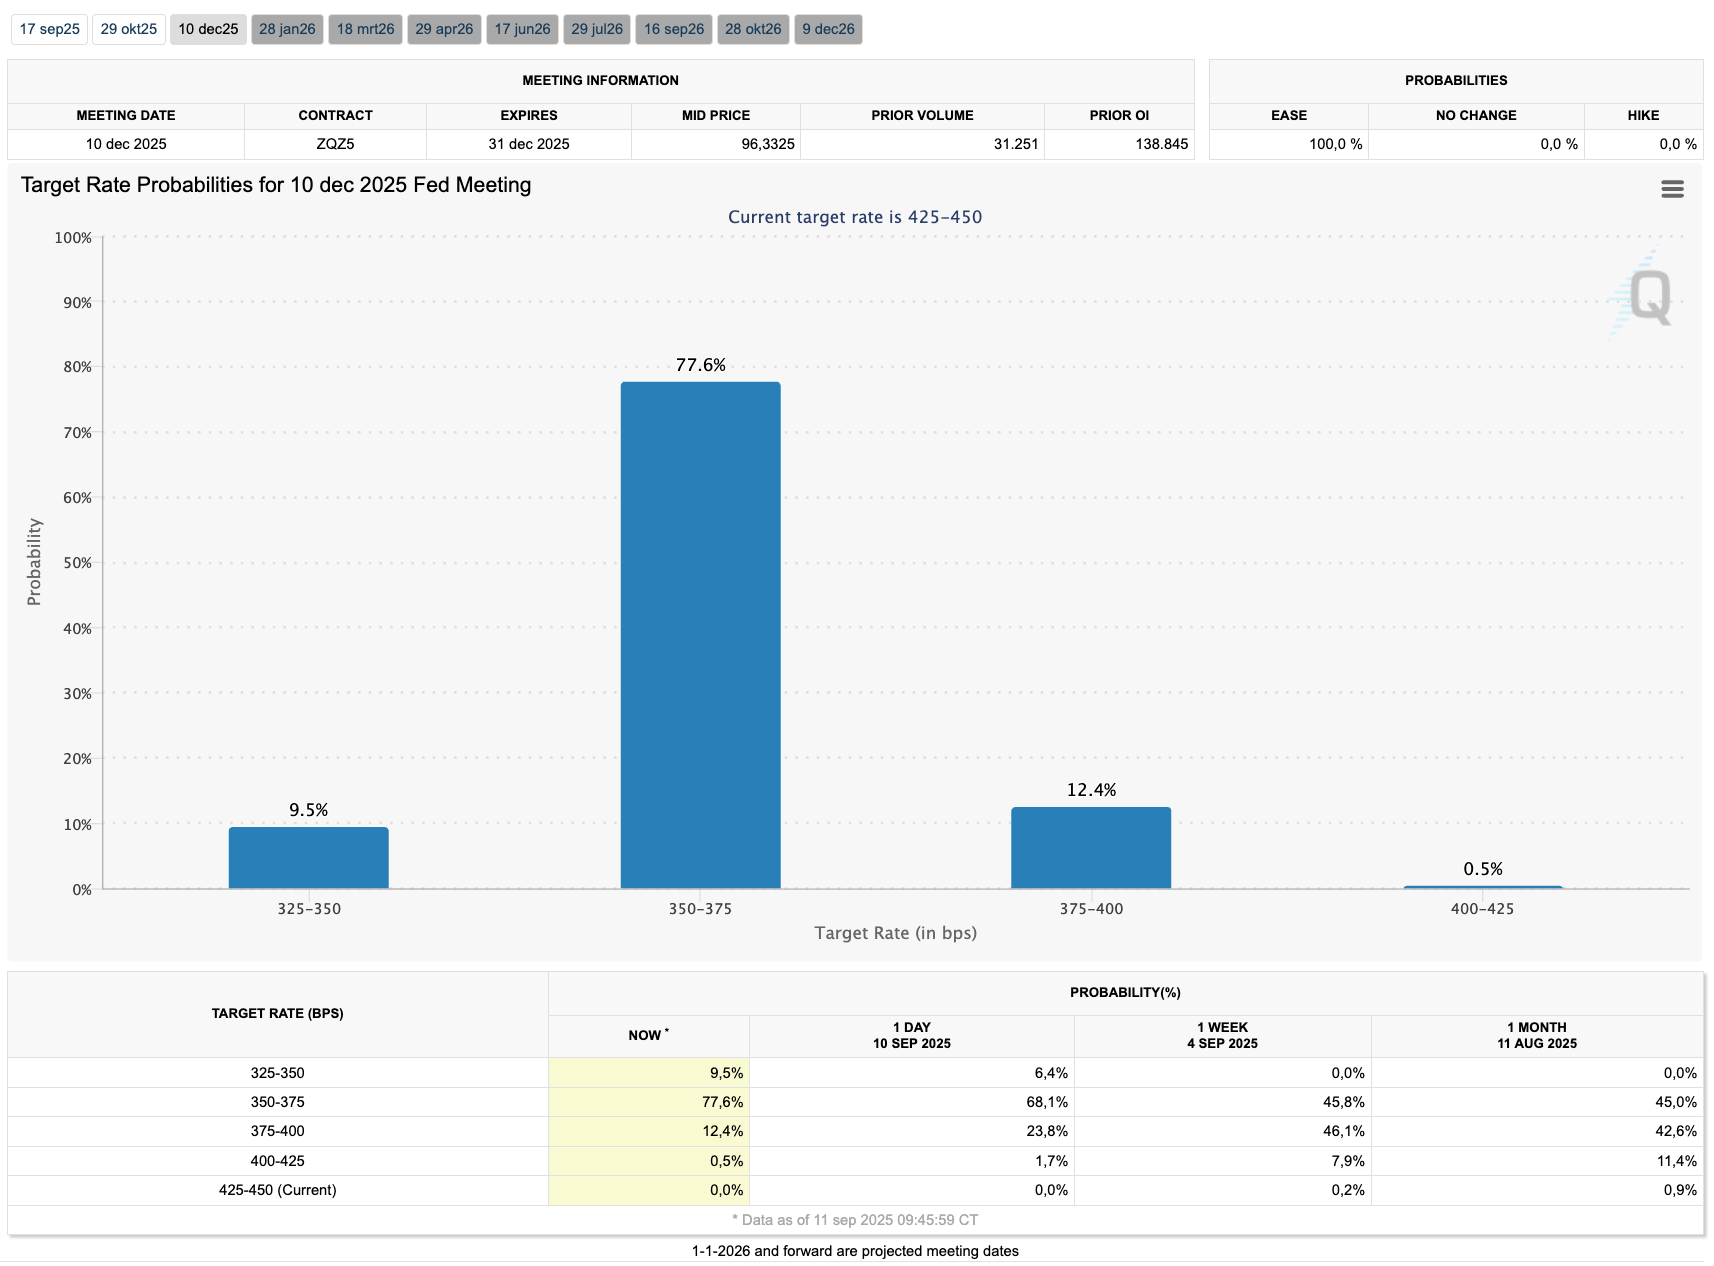
The Producer Price Index (PPI) came in much lower than expected, while the Consumer Price Index (CPI) was largely on target. This leaves the U.S. central bank with no clear reason to change its plans. It's likely that we'll end 2025 with a series of rate cuts because the Fed is more concerned about the labor market than inflation.
For now, the market is pricing in a 78% probability for a scenario with three rate cuts and a 10% probability for a scenario with four 0.25 percentage point cuts.
Based on the economic data and market reaction, I tend to believe that the U.S. central bank might be overdoing it—that the risks for inflation and the labor market are more balanced than they appear. In other words, fewer rate cuts might ultimately be needed to keep the economy on track.
- The record highs in the stock market continue to dazzle us.
- Relative financing costs for companies (credit spreads) are very low, as lenders remain confident in the health of the economy.
- Both actual and expected volatility for stocks and bonds are low—a calm and stable market is often a sign of economic confidence.
- Even though there are signs of a cooling labor market, economic growth has stayed rock solid. It seems that weaker job markets are not impacting productivity.
For now, my view is that the U.S. central bank is stimulating an economy that might not truly need it. I wouldn’t be surprised if pressure from the Trump administration played a significant role in that decision.
For investors, however, the main takeaway is that this creates a favorable climate for risk investments, increasing the likelihood of new bitcoin all-time highs toward the end of 2025.
3️⃣ Does AI drive more growth with fewer jobs?
Thom
You may have noticed that this week, the U.S. revised its job growth numbers downward by 911,000 for the period from April 2024 to March 2025. This revision came on the heels of weak figures last Friday, when June’s job growth even registered as the first negative print for this cycle after adjustments.
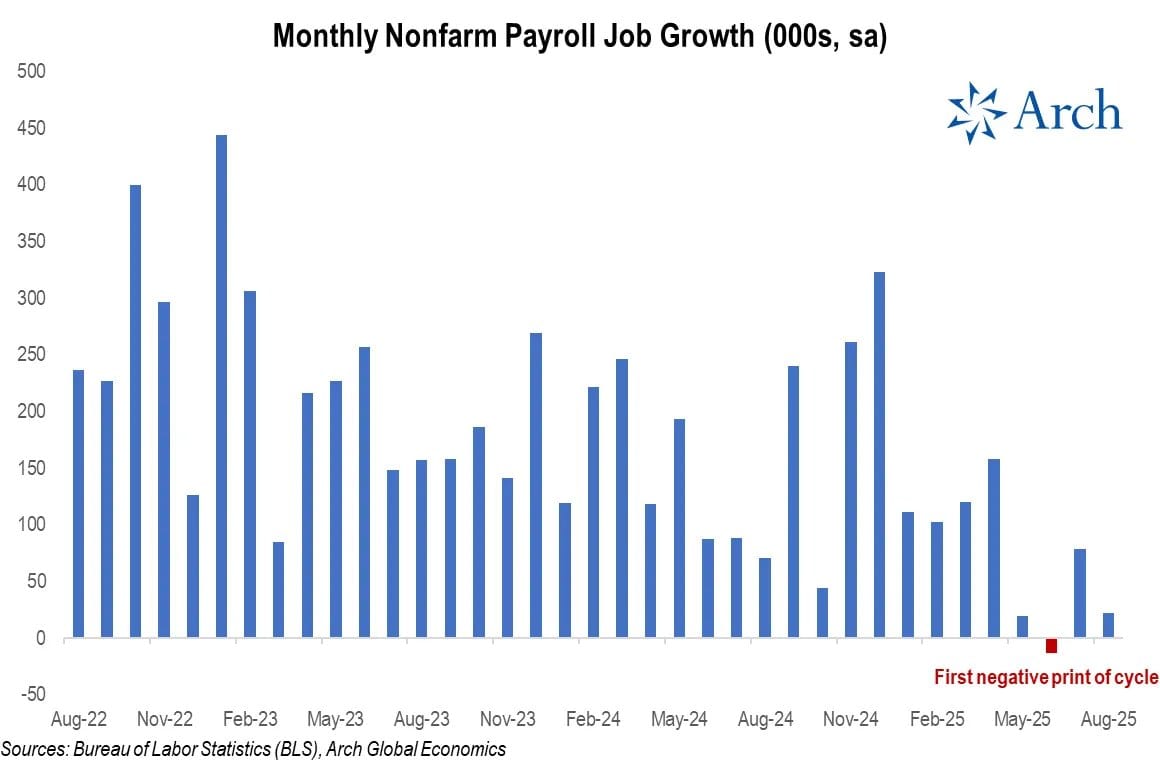
For the U.S. central bank, these figures further justify the need for rate cuts. However, when looking at the broader economy, the key question remains whether the weakness in the labor market will actually hinder U.S. economic growth.
During the period from April 2024 to March 2025—when the revision of -911,000 jobs was announced—the U.S. real economic growth averaged +2.4%.
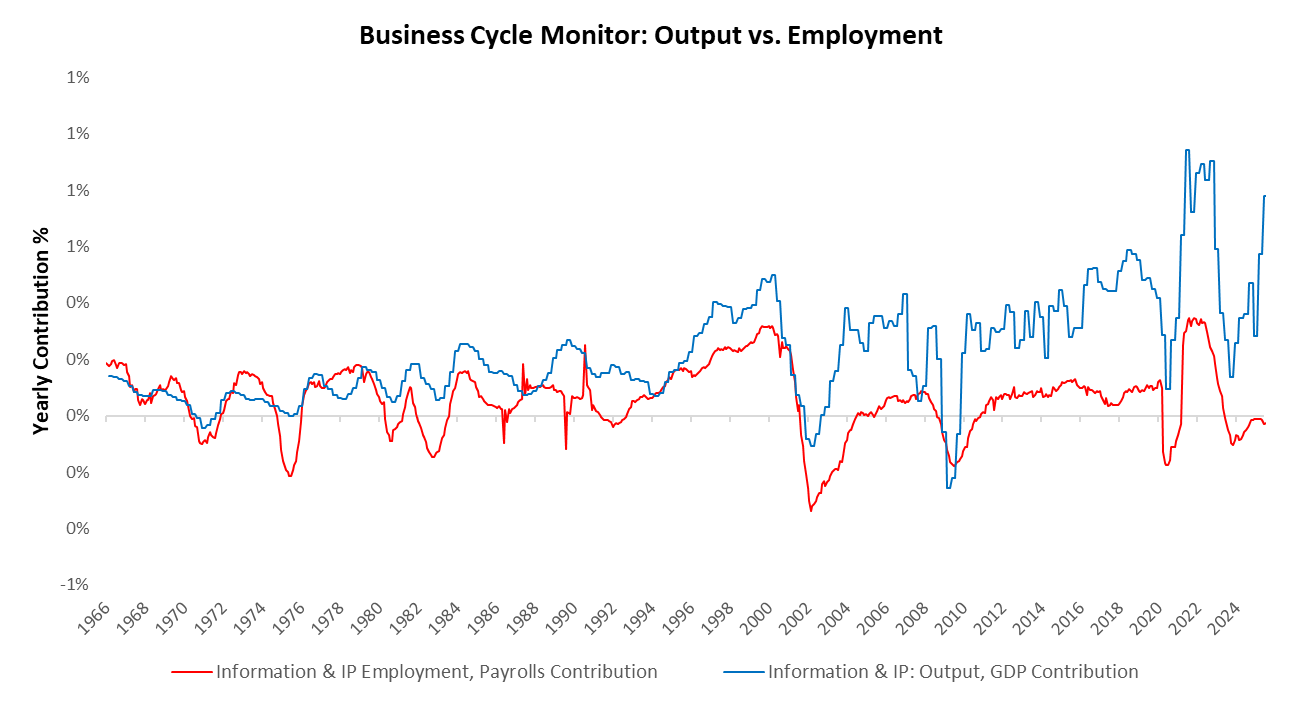
One possible explanation is illustrated in the chart below, which shows the contributions of the information technology sector (tech) to overall economic growth (blue) versus its contribution to employment (red).
Notably, the tech sector’s contribution to economic growth has been strong recently, while its contribution to employment has stagnated. This suggests that the AI revolution in tech may be creating a new dynamic in the labor market.
If that’s the case, we might see rising unemployment even as overall economic output remains robust. Under such conditions, rate cuts by the U.S. central bank could act as rocket fuel for bitcoin and other risk investments.
4️⃣ Raoul Pal & Michael Howell: peak in spring 2026
Bert
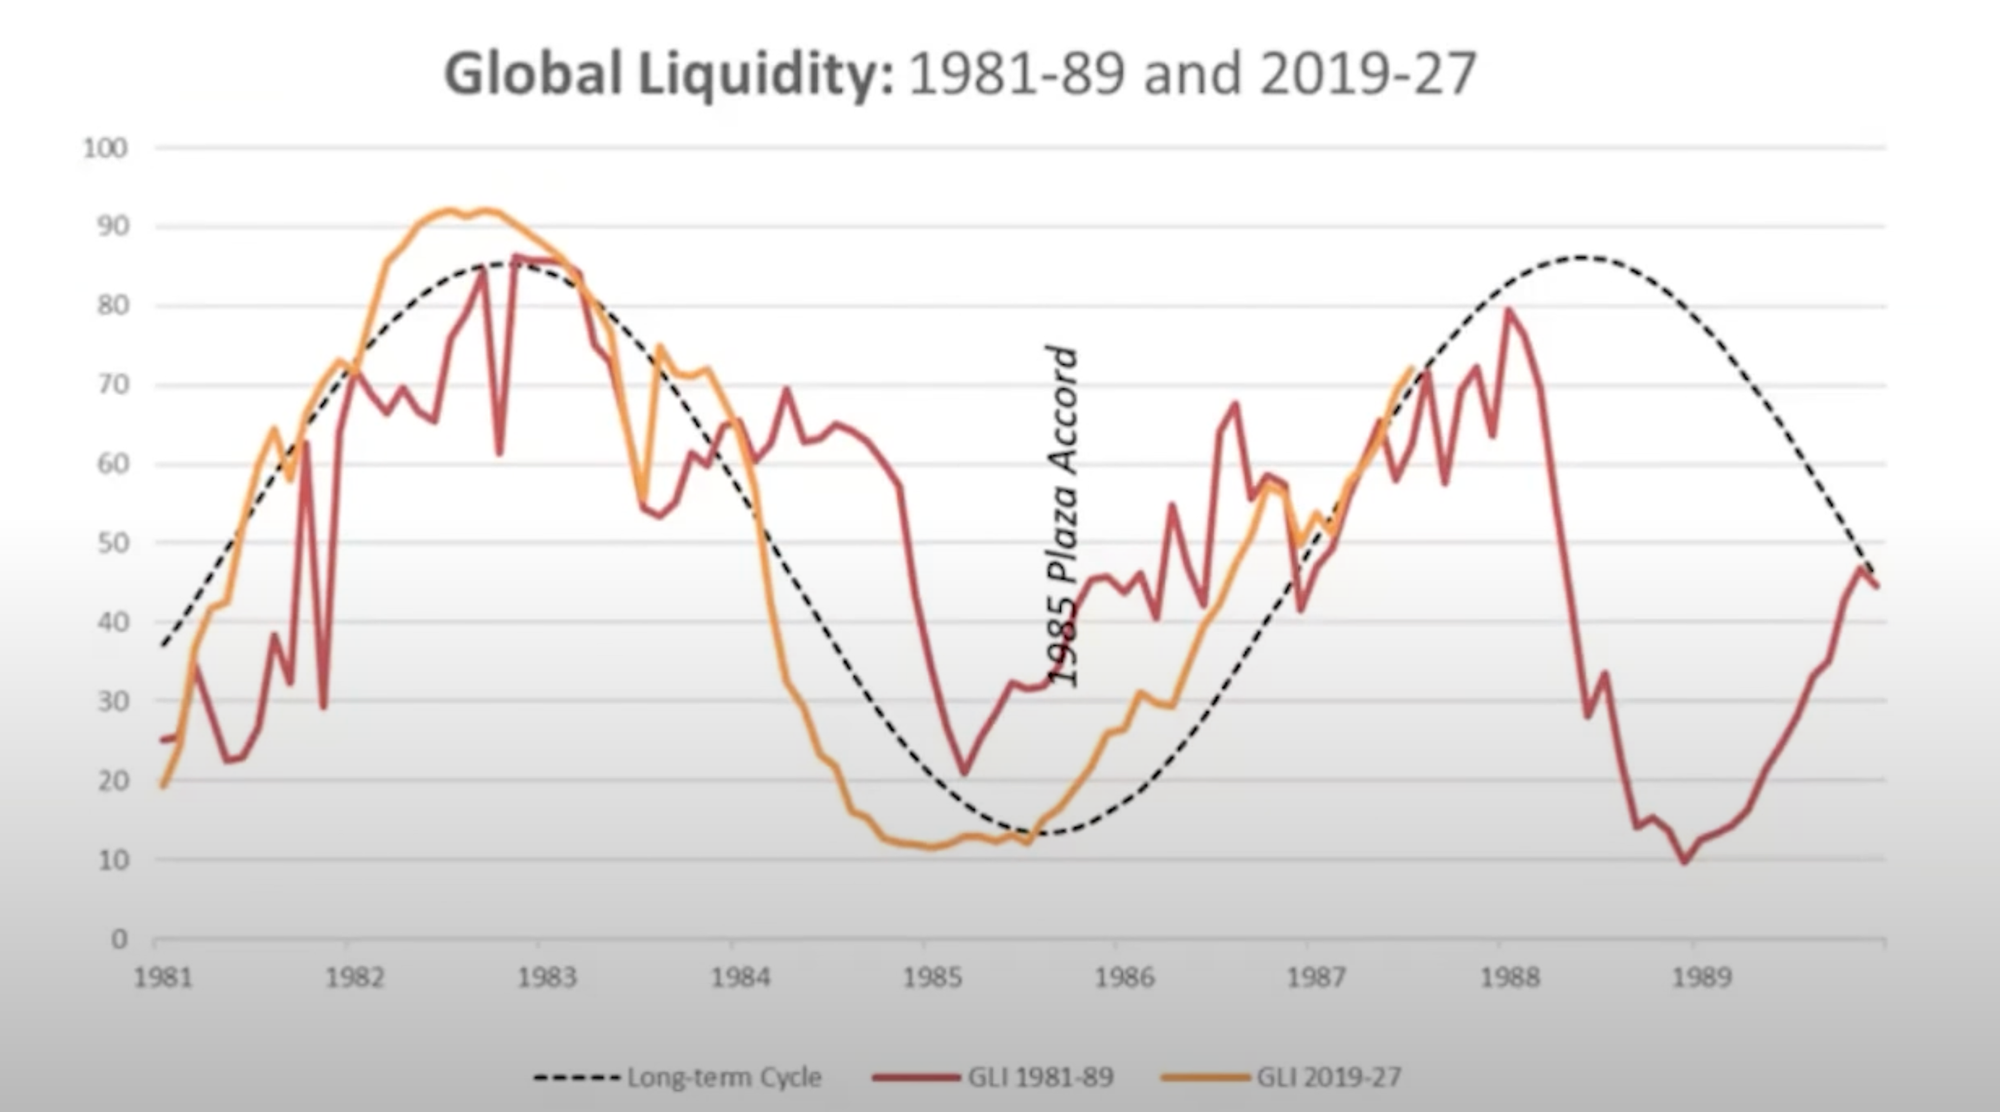
I recently listened to a discussion between Raoul Pal and Michael Howell on the global liquidity cycle. Howell, an expert on the subject who has been studying it for decades—and even compiles a detailed global liquidity index—shared some cautionary insights at the end of last year. According to him, we are entering the final stage of the liquidity cycle: “Enjoy the party, but dance near the door.”
About 50 minutes into the conversation, Pal and Howell discussed their expectations for when the liquidity cycle will peak and what that means for the tailwind supporting risk investments.
Pal is targeting the second quarter of next year, and Howell agrees, as his forward-looking indicators suggest that global liquidity will likely continue increasing for about another six months, bringing us to March or April.
The chart below is a screenshot from the YouTube video. Although the quality is poor, it clearly shows their current viewpoint.
5️⃣ Altseason update
Bert
We often see that altcoins underperform bitcoin during the down phase of a weekly cycle. If bitcoin drops 20%, many altcoins might lose 50% or more. That isn’t the case right now.
In fact, some altcoins recorded a higher bottom when bitcoin fell to $107,250 on September 1. Remarkable!
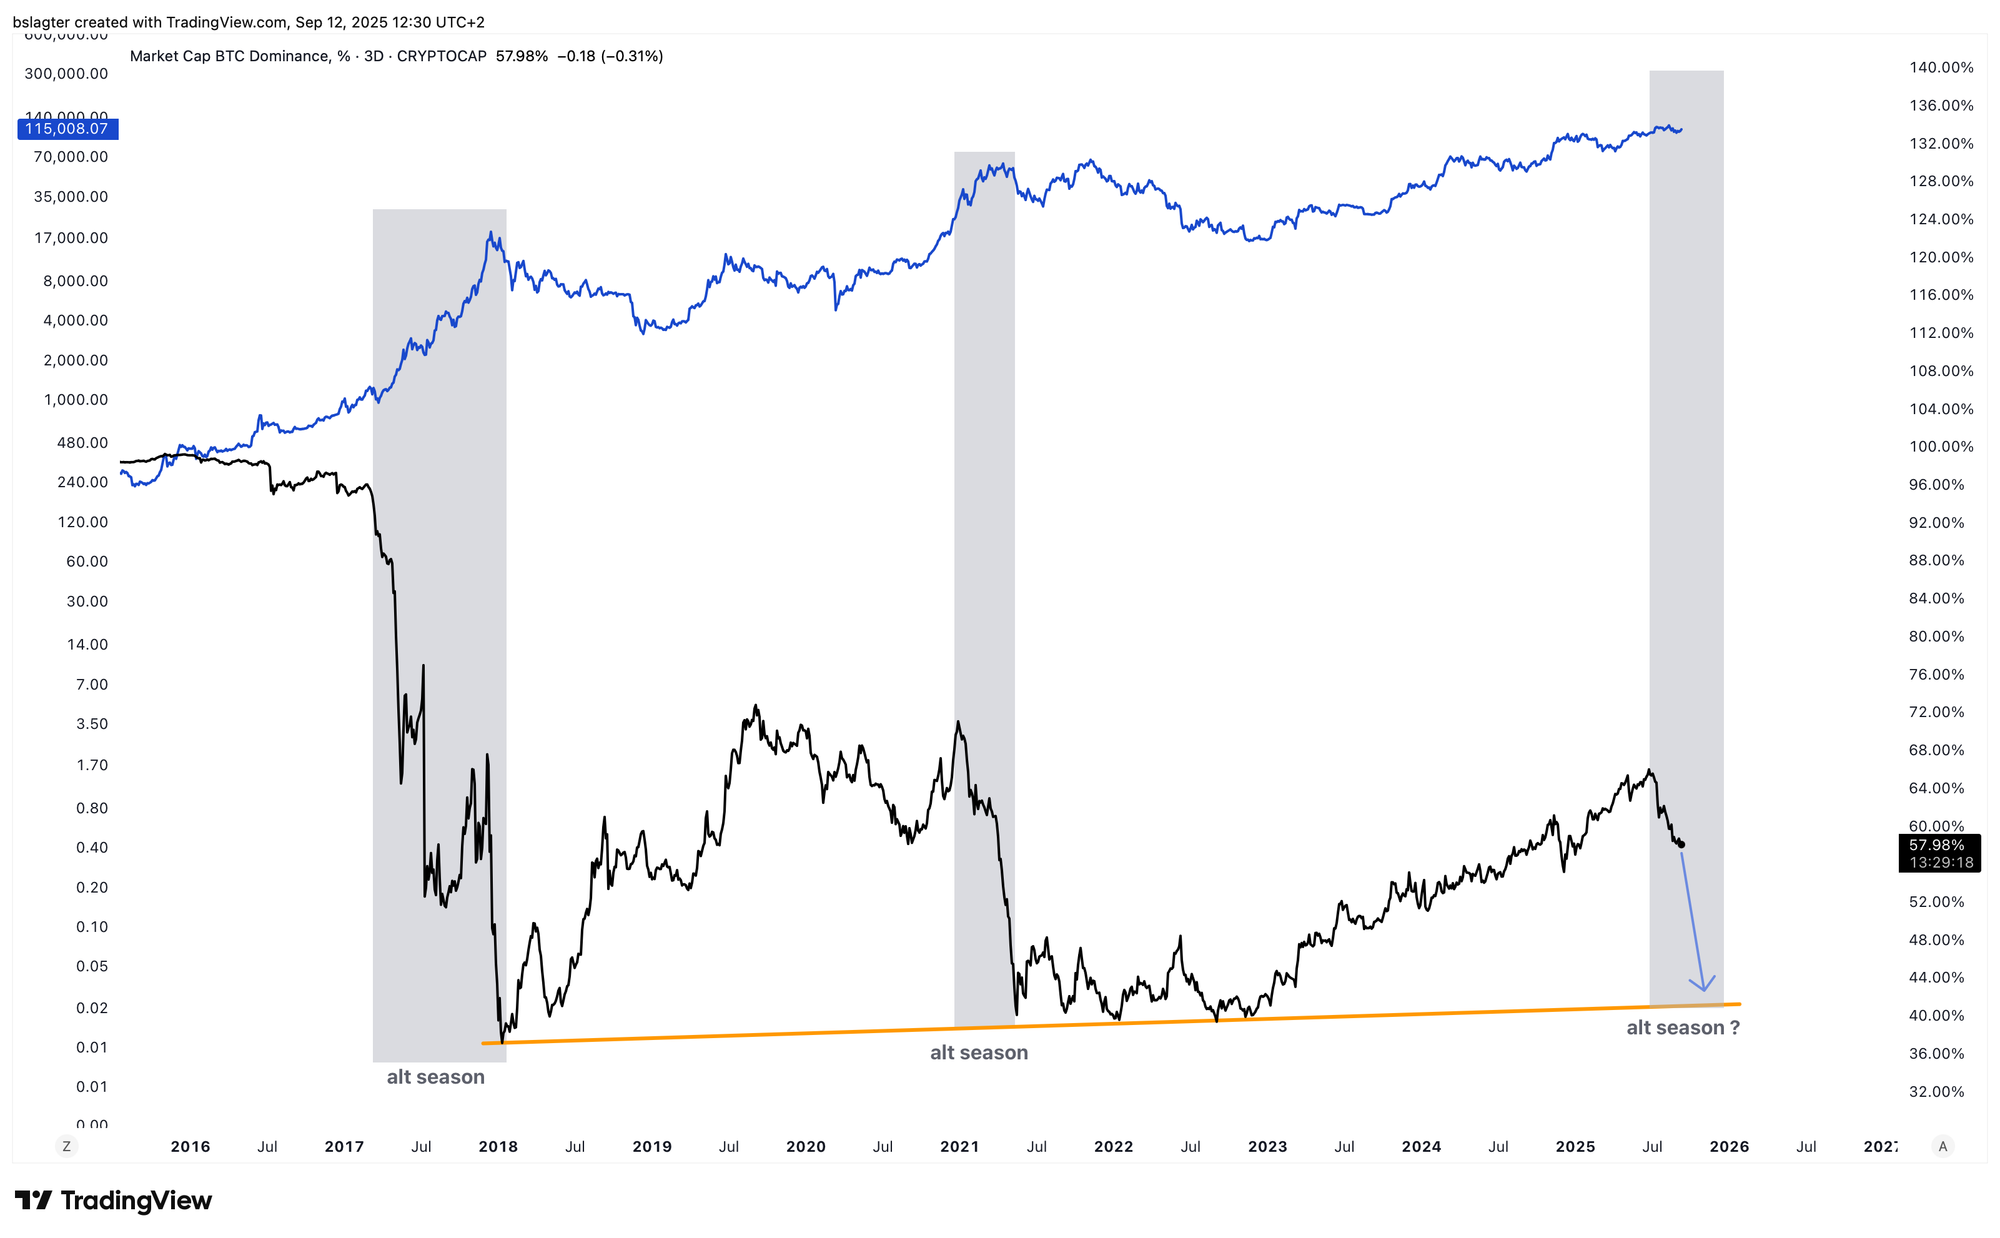
This relative strength in altcoins is also evident in bitcoin dominance. A downtrend seems to be forming there, indicating that altcoins are performing relatively better than bitcoin.
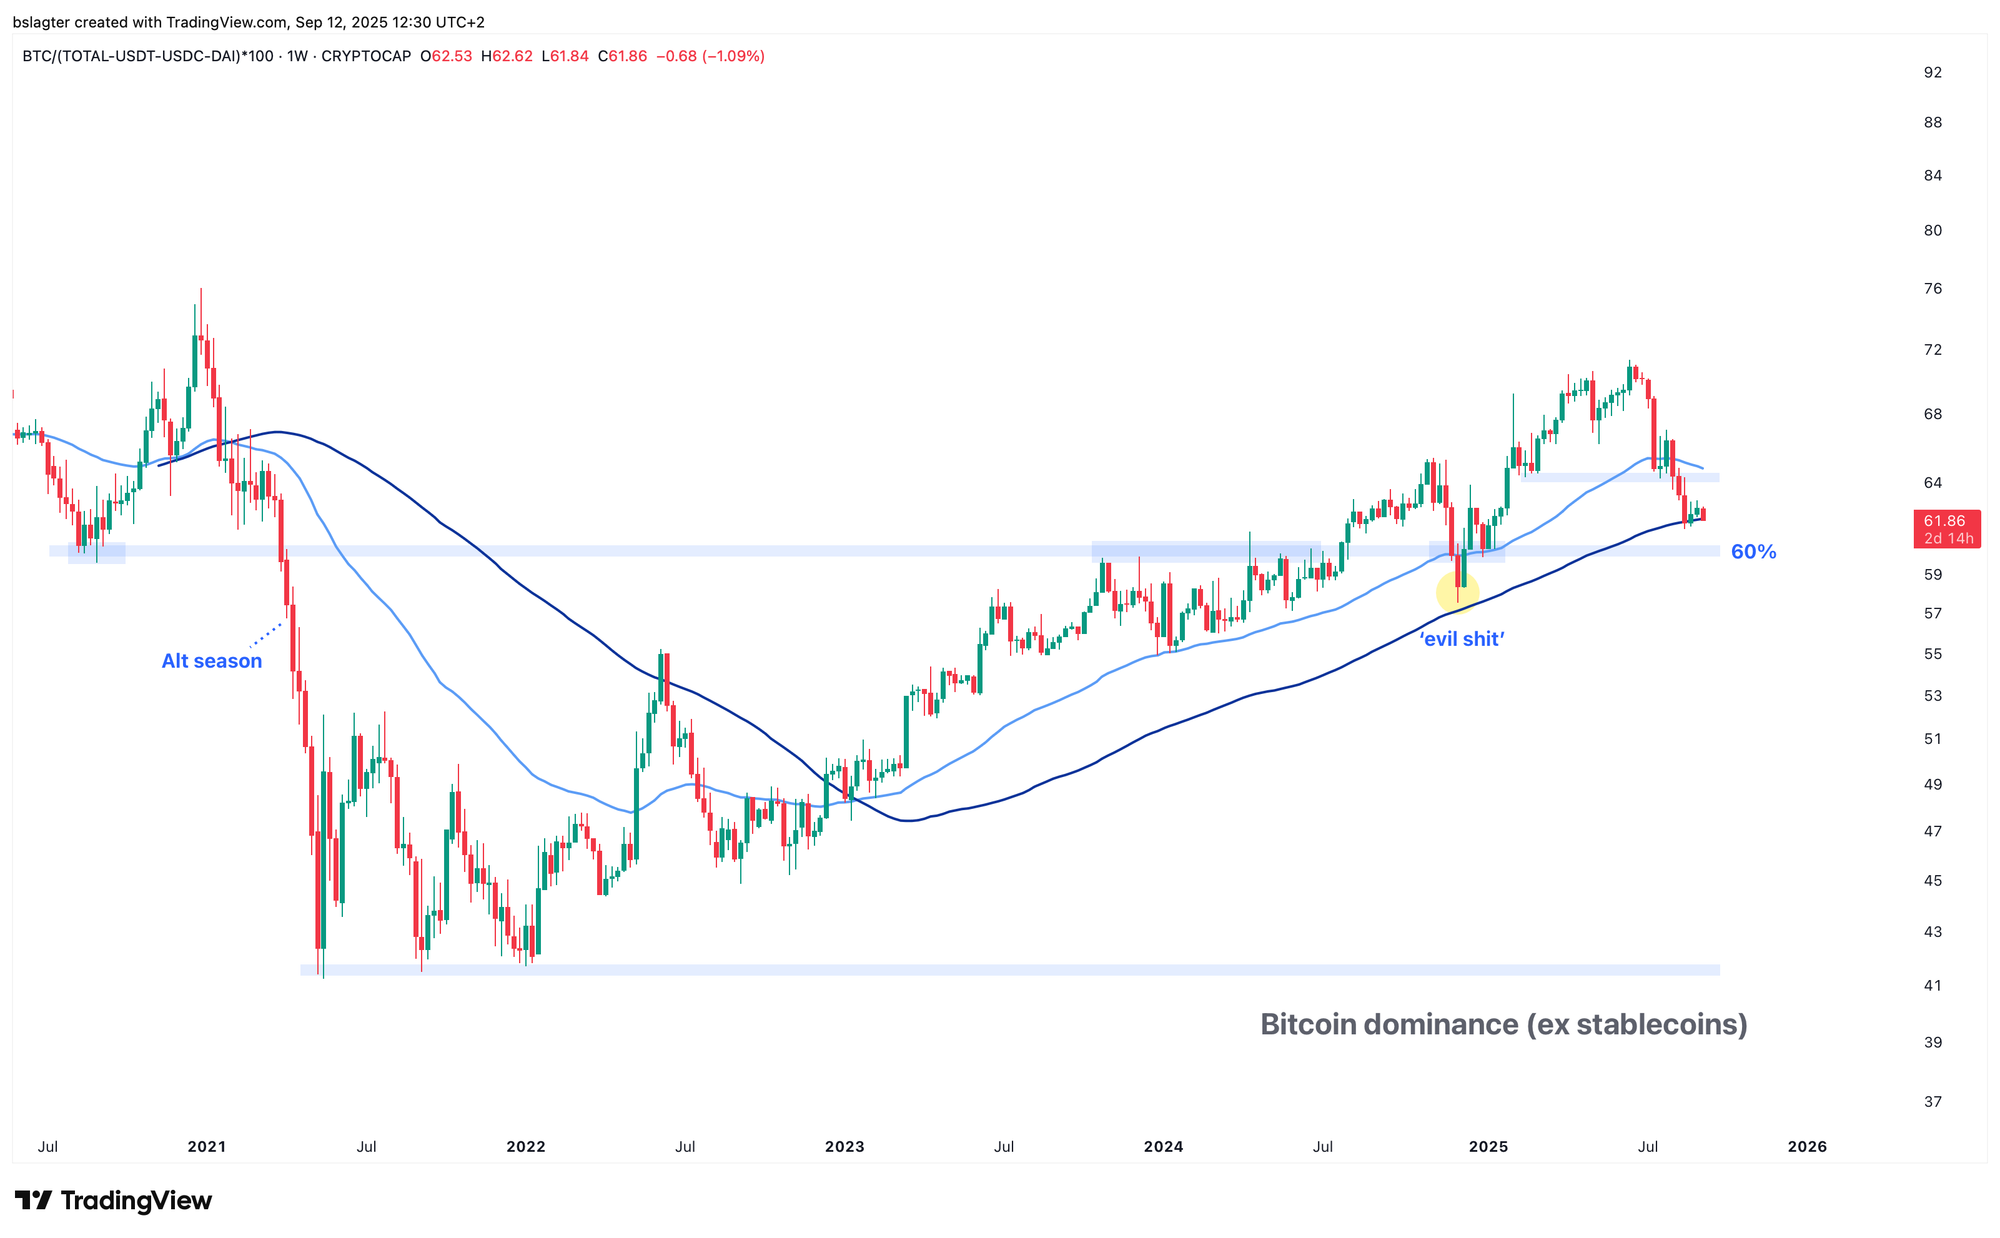
Could we cap off the bull market once again with an ‘altcoin season’ similar to those seen in 2017 and 2021? It might then look something like this.
For many, the typical image of an alt season is one where every altcoin rockets upward effortlessly, making everyone rich. In our view, that scenario is unlikely; the opportunity is too diluted for that to occur. We expect that if "the rest" does indeed perform better than bitcoin, the strength will be concentrated in a select group of winners. Alternatively, the strength could ripple through the market, first benefiting one group and then another.
If you're inclined to speculate on an alt season, this phase of the market cycle offers the best chance. However, exercise caution—limit exposure to a small portion of your portfolio, avoid excessive leverage, and be sure to take profits on time.
A realistic outlook would see the numbers ranked 2 through 125 triple, while BTC rises to $170,000. This scenario would bring bitcoin dominance to 41%, which aligns perfectly with the trend line in the chart above.
Thank you for reading!
To stay informed about the latest market developments and insights, you can follow our team members on X:
- Bart Mol (@Bart_Mol)
- Peter Slagter (@pesla)
- Bert Slagter (@bslagter)
- Mike Lelieveld (@mlelieveld)
We appreciate your continued support and look forward to bringing you more comprehensive analysis in our next edition.
Until then!