Does this rally prove the bear market is over?
Bitcoin is up over 30% from its $60,000 bottom on February 6. Yet it's too early to declare a new bull market. This could very well be a bear market rally.

Immediately after the initial attack on February 28, the Middle East war put pressure on equity markets. Higher energy and commodity prices could lead to higher inflation, lower economic growth, and lower corporate earnings. Especially if the war escalates and drags on.
Of course, there are always sectors that benefit from such a war, like the energy sector, but that's insufficient to offset losses in the rest of the economy or the broad stock indices.
The decline lasted just over a month. By March 30, the major U.S. stock indices were about 8% below the closing price of February 27, and between 10 and 15% below the January highs.
It was a clear crossroads with two options: further decline or the start of a new period of gains. In the Alpha Markets edition of April 3, we described it as follows:
On the brink of a serious shift into a bear market, but also ready for a new period of gains. The S&P 500 now has a similar setup to October 2023.
It turned out to be the bottom. The rally that followed has been spectacular. We wrote about it in the Alpha Markets edition of April 17, when the indices had just returned to their record highs:
Another driving force behind the rally of recent weeks is AI. And not the promise of future productivity, but the money being made from current usage and the investments being made right now: chips, networking, storage, data centers.
We have the sense that the market will look through the concerns in the coming months, and indeed begin a longer period of gains.
That turned out to be quite accurate. The broad tech index Nasdaq 100 is now 10% higher than on April 17. ETFs tracking the chip industry, like SMH and SOXX, gained as much as 20%.
The driving force behind the stock market 'melt-up' is clearly the overwhelming demand for computing power, data storage, networking, and other AI infrastructure. The best performers in 2026 among the 500 stocks in the S&P 500 are Sandisk (+464%), Intel (+197%), Seagate (+178%), and Western Digital (+169%).
The lifespan of these kinds of explosive rallies is limited. But it's entirely possible that other (sub)sectors pick up the baton afterward. All in all, a strong bull run can easily last 12 to 18 months.
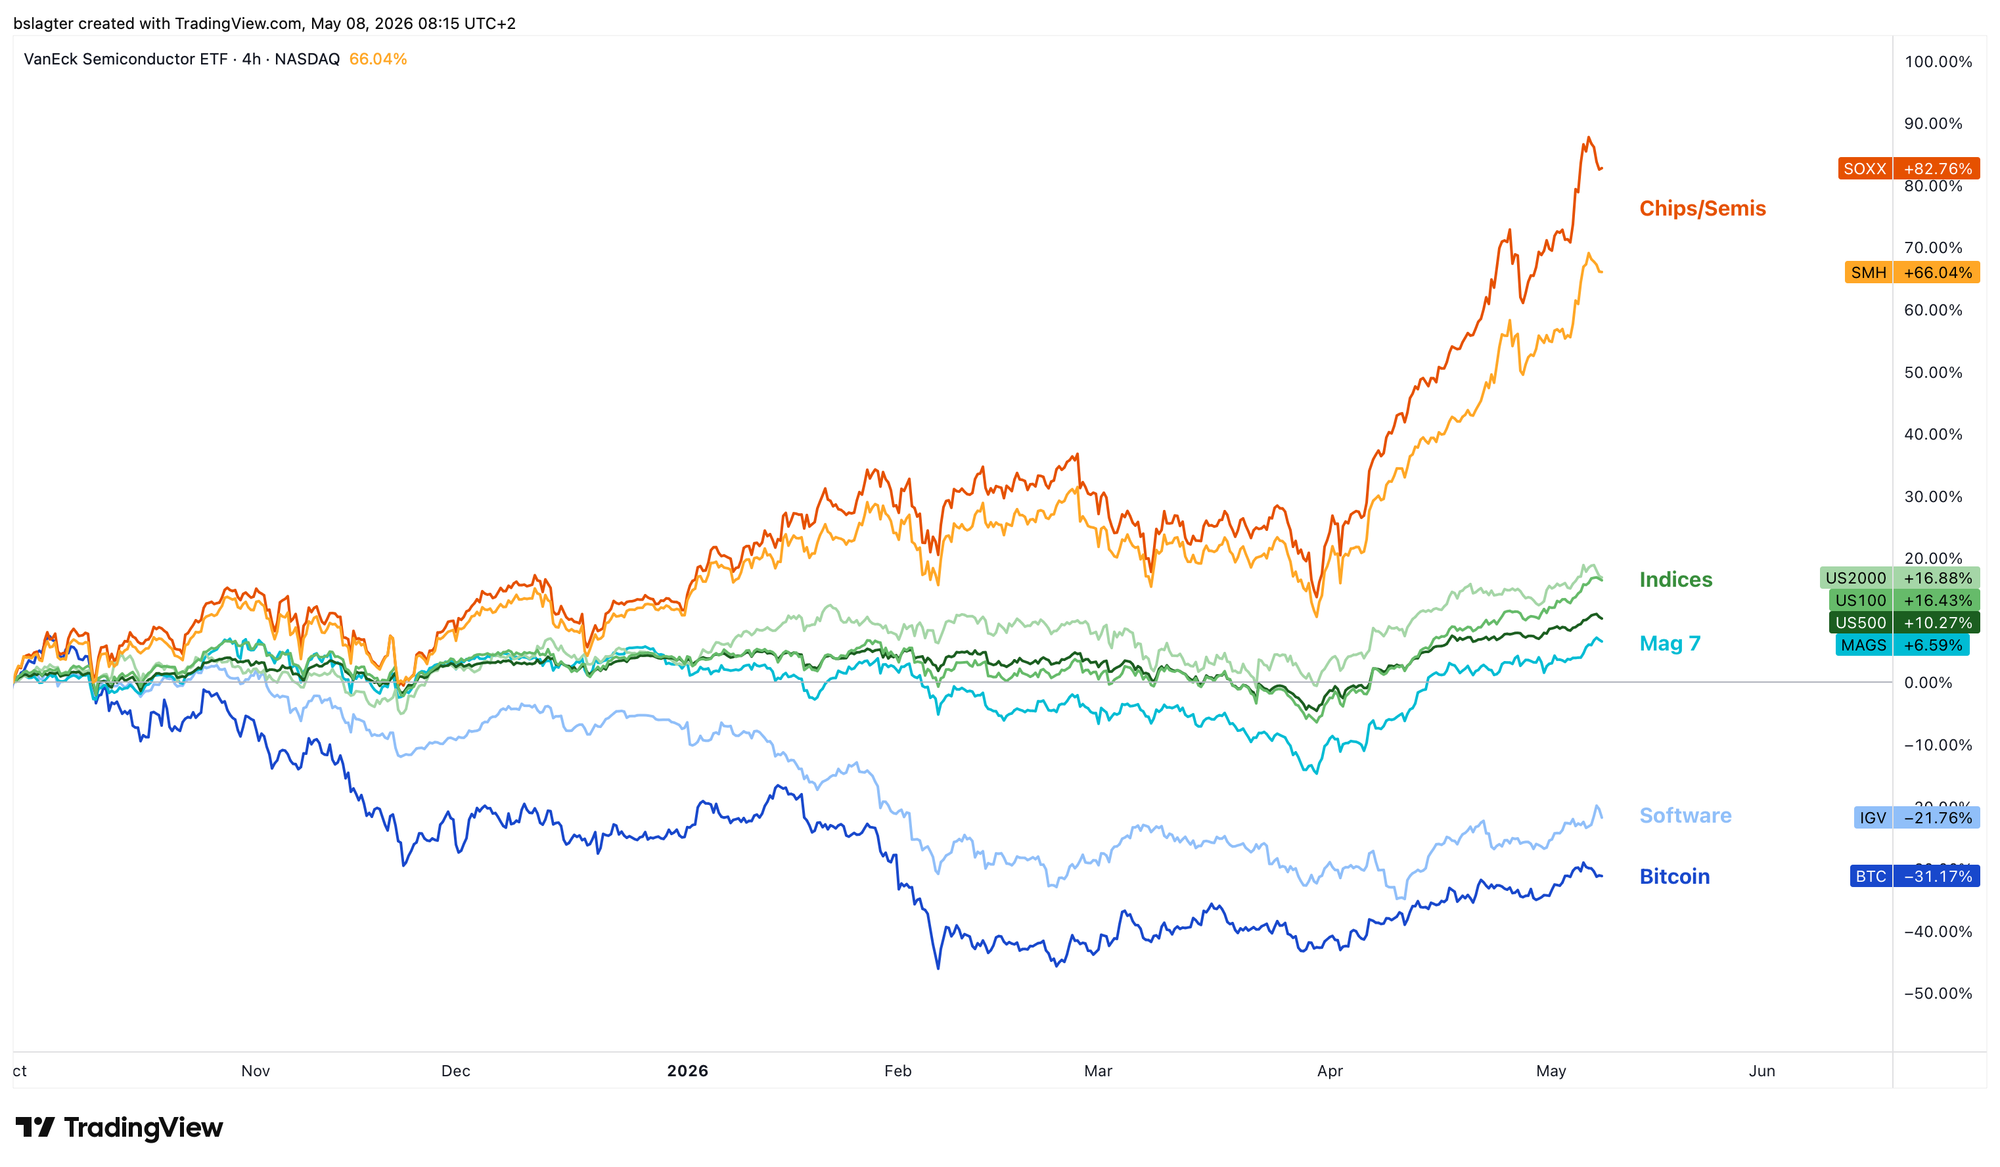
The starting point in the chart above is October 1. During October, many assets sensitive to liquidity and risk appetite peaked. For example, ETFs for software, cloud computing, robotics, and e-sports, while even the Magnificent Seven ETF has only now just reached its October 29 high.
For bitcoin, the top was on October 6, at a price of $126,000. The decline led to a bottom of $60,000 on February 6, a loss of 52%.
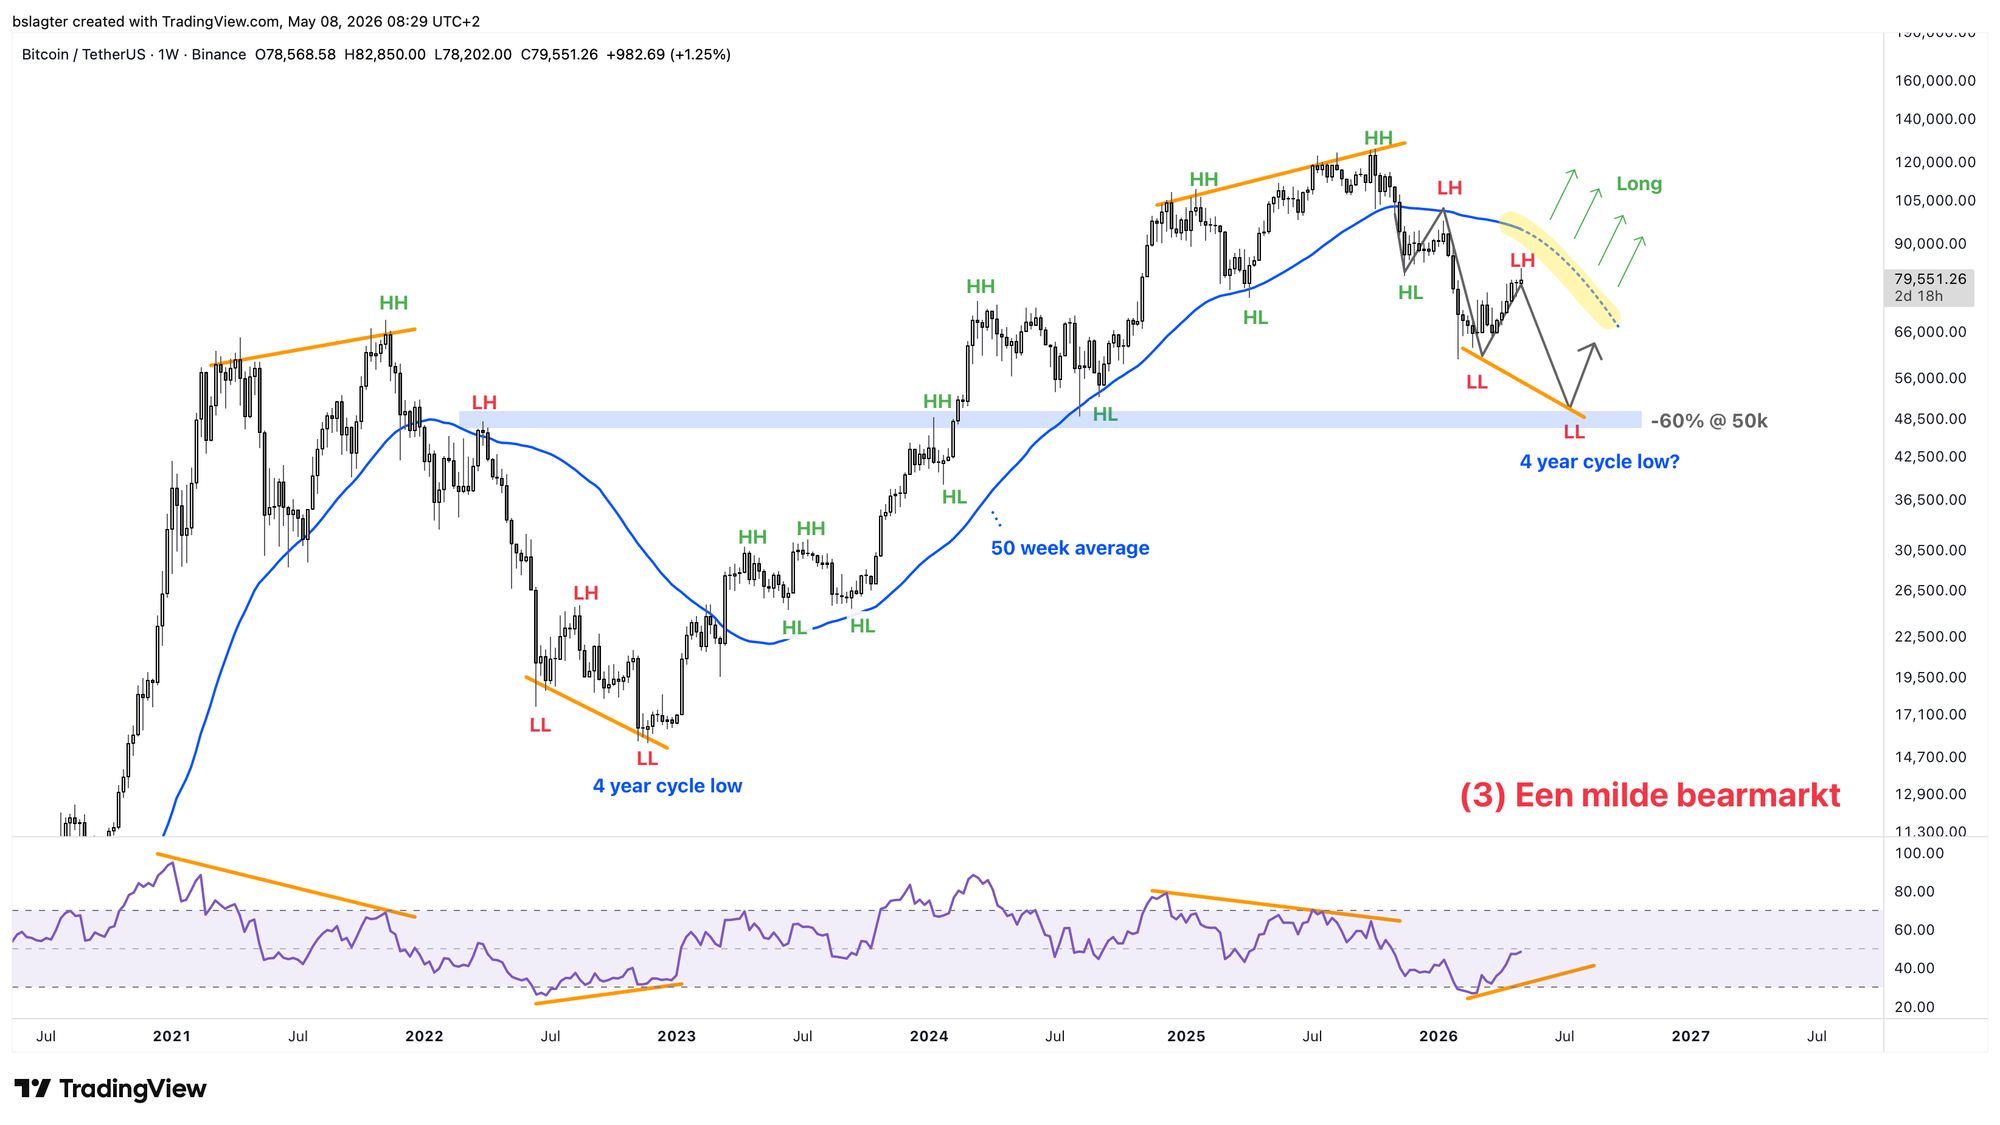
That's not a correction within a bull market. The trend on the weekly chart has shifted from rising to falling. We see lower highs (LH) and lower lows (LL), the price sits below the 50-week moving average, and that average is declining. We are in a cyclical bear market, the final phase of the market cycle in which strength and weakness alternate with a rhythm of roughly four years.
We recognize a new cyclical bull market by a new uptrend on the weekly chart:
- A higher high (HH) above the $98,000 from January 14
- A higher low (HL) above the $60,000 from February 6
- A weekly close above the 50-week moving average at $95,000
- A directional change in that average from declining to rising
We don't see any of that yet. But by the time we could check off these characteristics, the uptrend would have effectively already begun some time ago. That's why it's interesting to look for indicators that predict a trend reversal, such as bullish divergence.
In the chart below, you can see that the previous three trend reversals showed clear divergence between price and RSI. We also saw that divergence in other technical indicators, on-chain indicators, and even the Fear & Greed index. Right now, it's not there yet.
Our base case remains that we are in a mild bear market and that the bottom still lies ahead. That means we interpret the rally of recent weeks as a bear market rally.
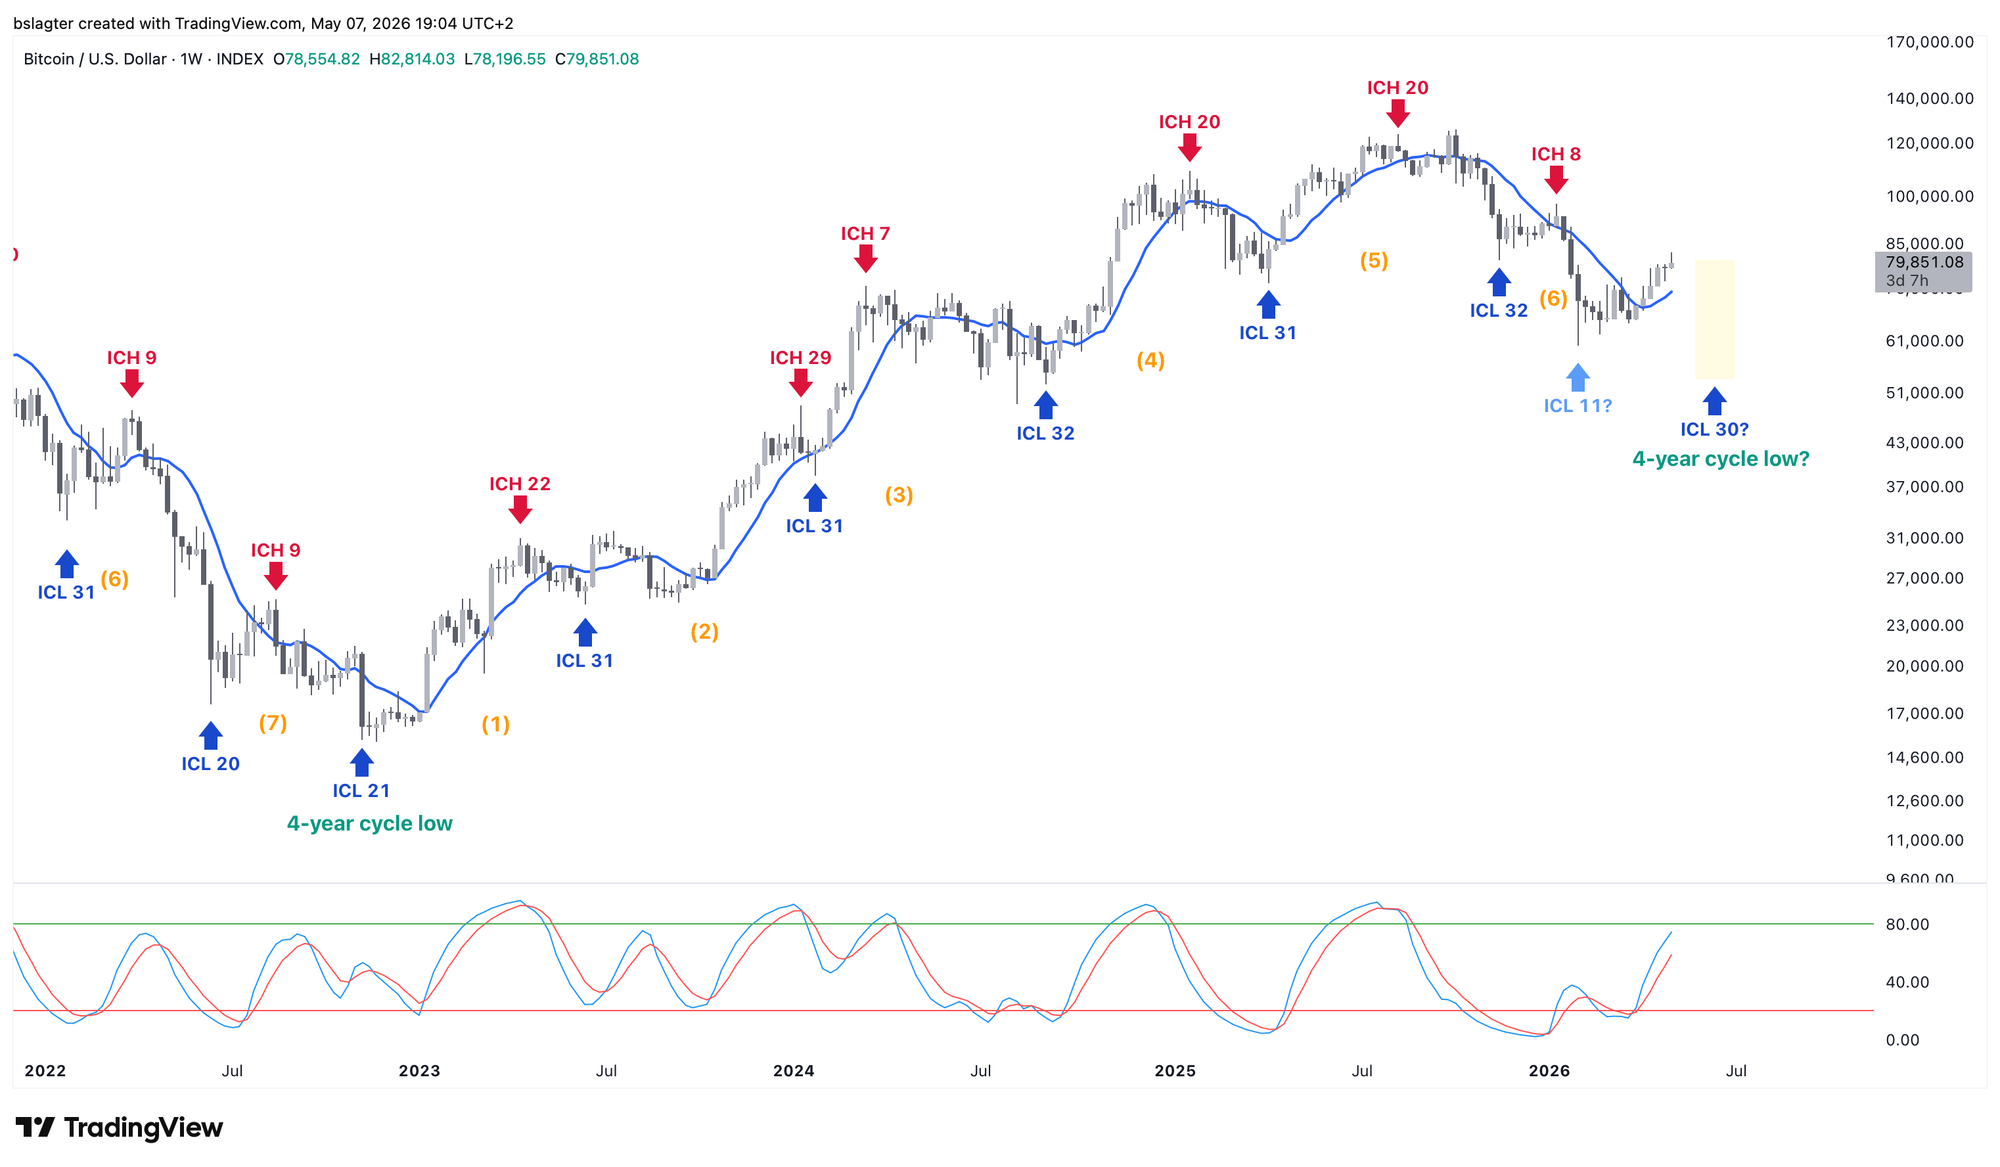
From a cycle analysis perspective as well, it would be very early if the $60,000 on February 6 turns out to be the yearly cycle bottom. That would be in month 39, while the bottom fell in month 47 the previous two times. Cycle analysts typically consider a deviation of +/- 10% (June 2026 – February 2027) as normal.
It also doesn't fit well with the rhythm of the weekly cycles. The November 21 bottom has all the characteristics of a weekly cycle low (ICL). The yearly cycle low (YCL) is always also an ICL. If February 6 were the bear market bottom, then between November 21 and February 6 there would be an extremely short weekly cycle of just 11 weeks, where 30 weeks has been the average in recent years.
In short, from multiple perspectives, the scenario that the bear market bottom still lies ahead remains the most likely.
At the same time, we must acknowledge that the strength bitcoin has shown in recent months is unusual for this phase of the bear market. You would expect more weakness here. Perhaps the strength lifting stocks to new all-time highs is manifesting in bitcoin as a shallow bear market.
We won't have to wait long for more information. We are now in week 24 of this weekly cycle. Before the end of the quarter, we'll know more.
In our view, it's still too early to consider this bear market complete. The bounce we're seeing now has the hallmarks of a bear market rally. Only with a convincing breakout above the dominant moving average will our base case go out the window, and will we assume a new bull market has begun.
We continue with the following topics for our Alpha Plus members:
- Gold and MSTR as predictors for bitcoin?
- A window of opportunity in altcoins
- First crack already appearing in Warsh's narrative on AI, inflation, and rate policy
- Strong data, weak sentiment: who will be proven right?
1️⃣ Gold and MSTR as predictors for bitcoin?
Bert
The most important chart is the price of bitcoin in dollars. That's the currency in which the majority of trading and analysis takes place. Sometimes it's interesting to look at other expressions of the bitcoin market. Such as the price of derivative products or bitcoin denominated in another currency.
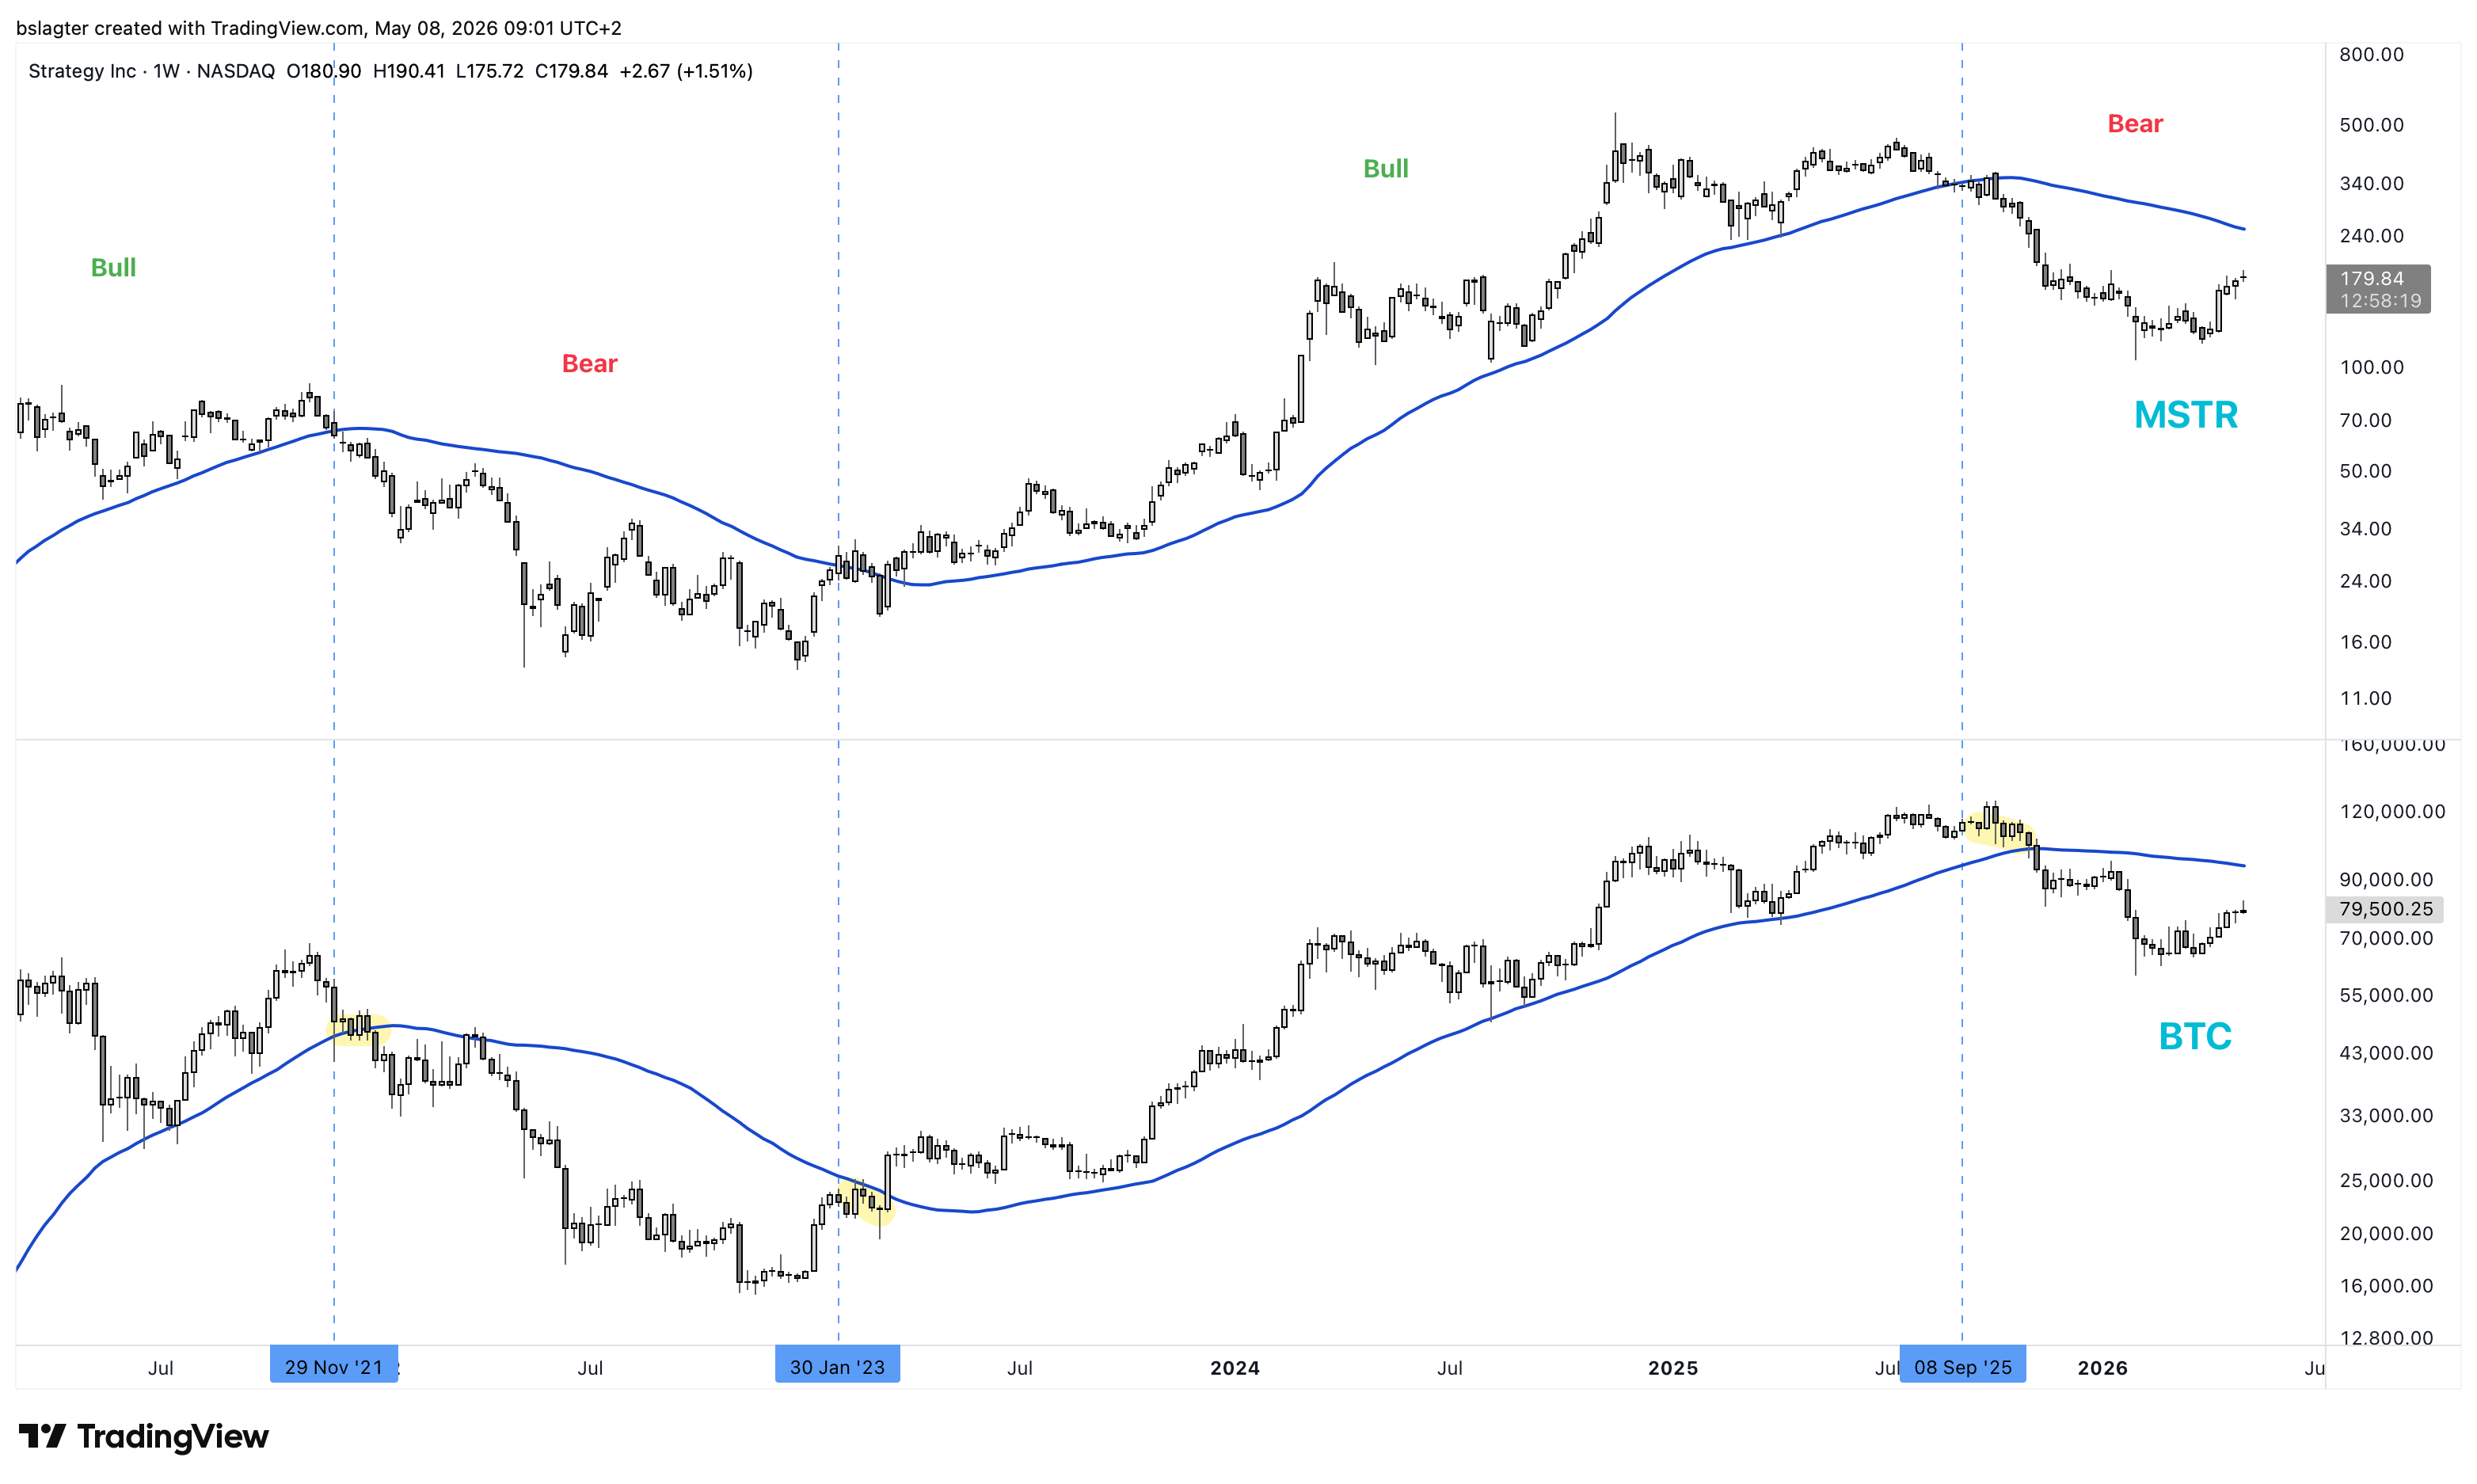
The stock MSTR (Strategy) is one such derivative product. That its rises and falls are more pronounced is no surprise. But it appears that MSTR also tends to be slightly earlier in starting a new trend.
The chart below shows the price of MSTR and BTC one below the other. The vertical dotted lines mark the moment MSTR had its first weekly close below/above its 50-week moving average. BTC follows each time a few weeks later.
Would that be the case again at the start of the next bull market? Perhaps. But for now, that signal has not yet been given. Both MSTR and BTC are still roughly equally far below their 50-week moving averages.
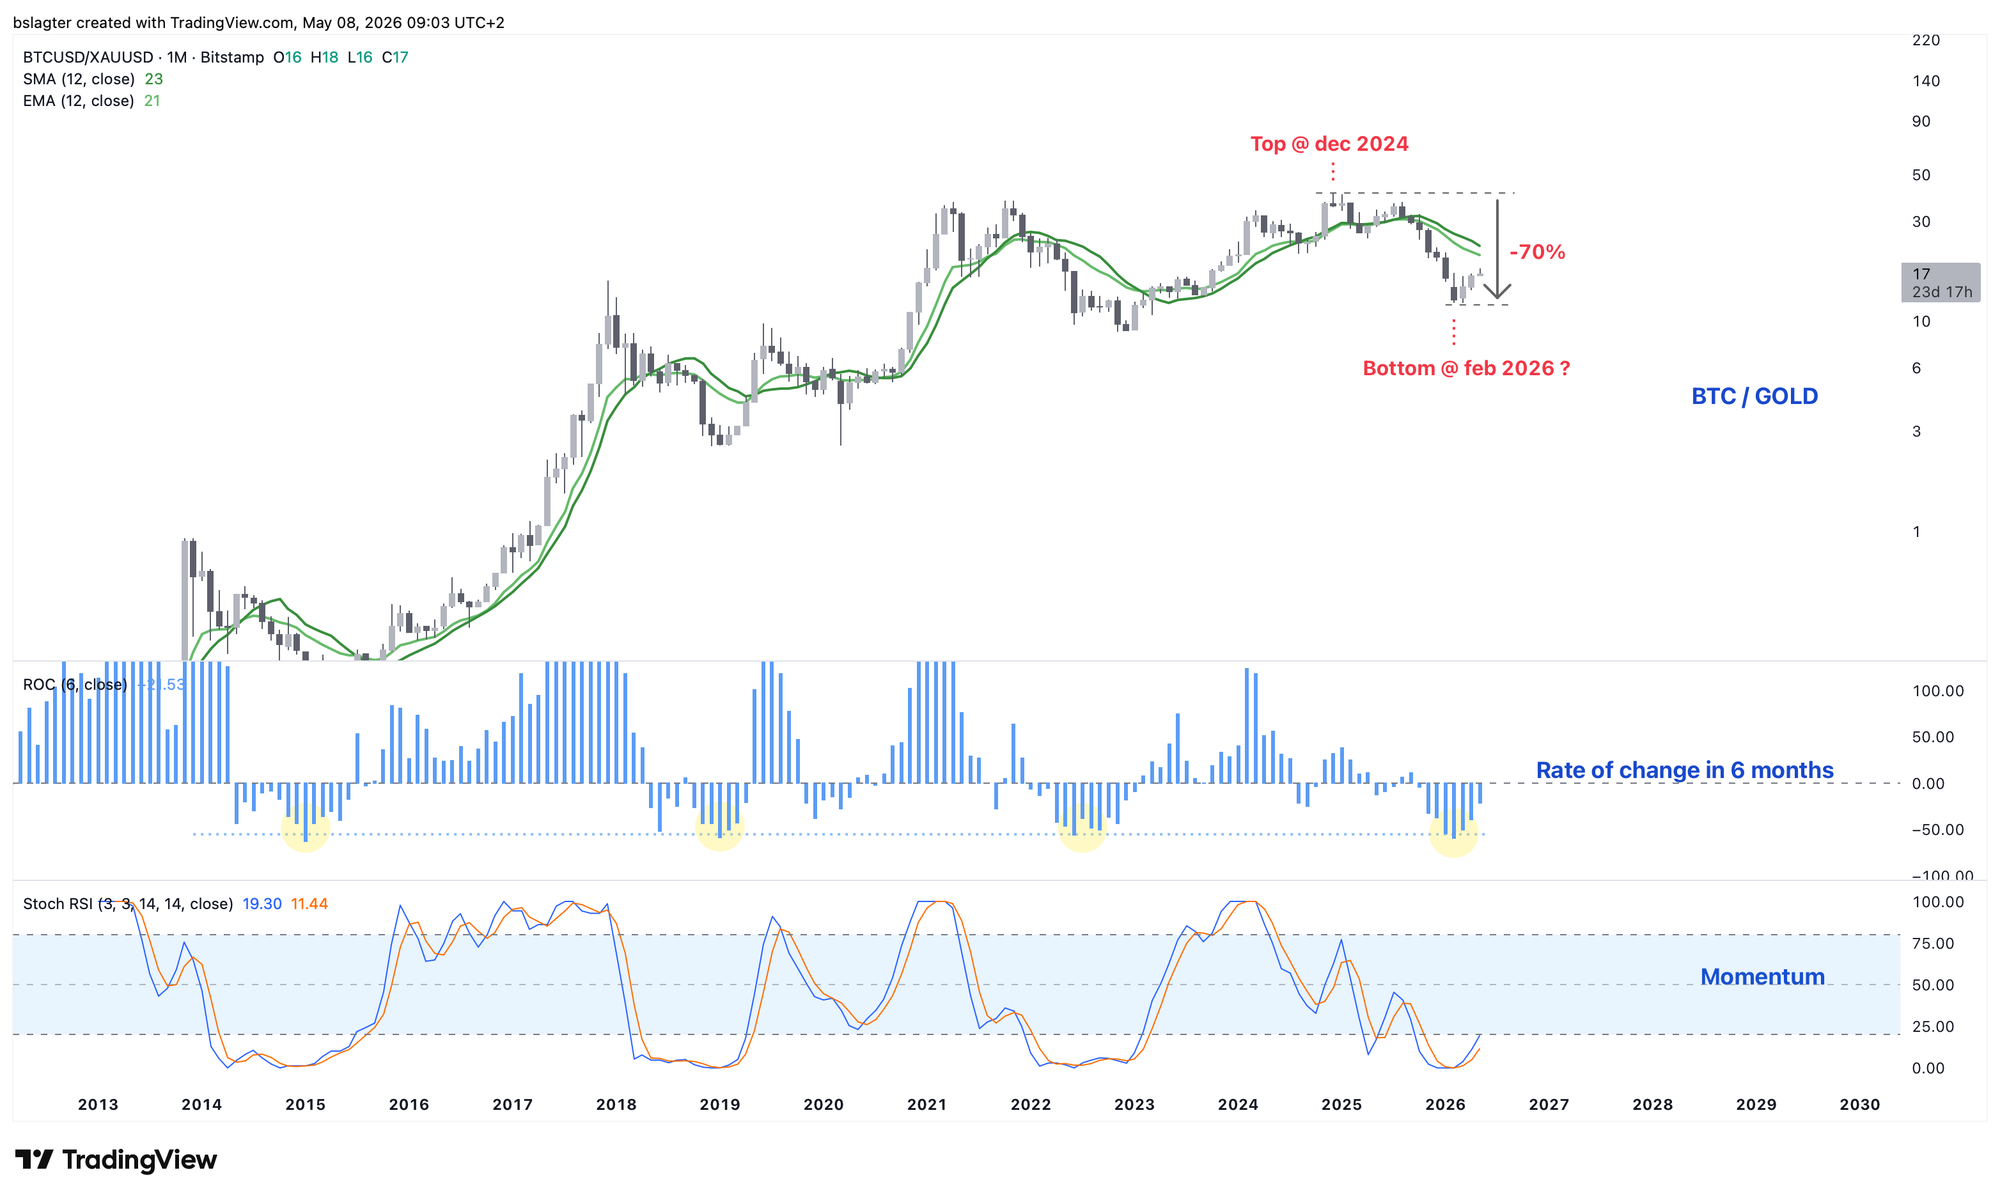
We also regularly look at bitcoin denominated in gold. That ratio peaked as early as December 2024, and then declined 70% to a bottom 14 months later in February 2026.
If the month of May were to close around this price, technical indicators suggest there's a good chance the bottom is in. But BTC/GOLD is also not yet above its 12-month moving average.
We examined two charts that could potentially indicate this is not a bear market rally after all, but a new bull market. Both are not yet giving a signal. And that means we need to be more patient.
2️⃣ A window of opportunity in altcoins
Sam
Since late March, bitcoin has been in a nice, steady uptrend from $65,000 to above $80,000. There were few sharp jumps upward, but on the flip side, the pullbacks have been limited as well.
The orange line in the chart below shows that $79,250 served as resistance on multiple occasions. With the breakout above it, it's therefore a good benchmark to remain positive as long as price stays above this level, and to become more cautious if price falls back below it.
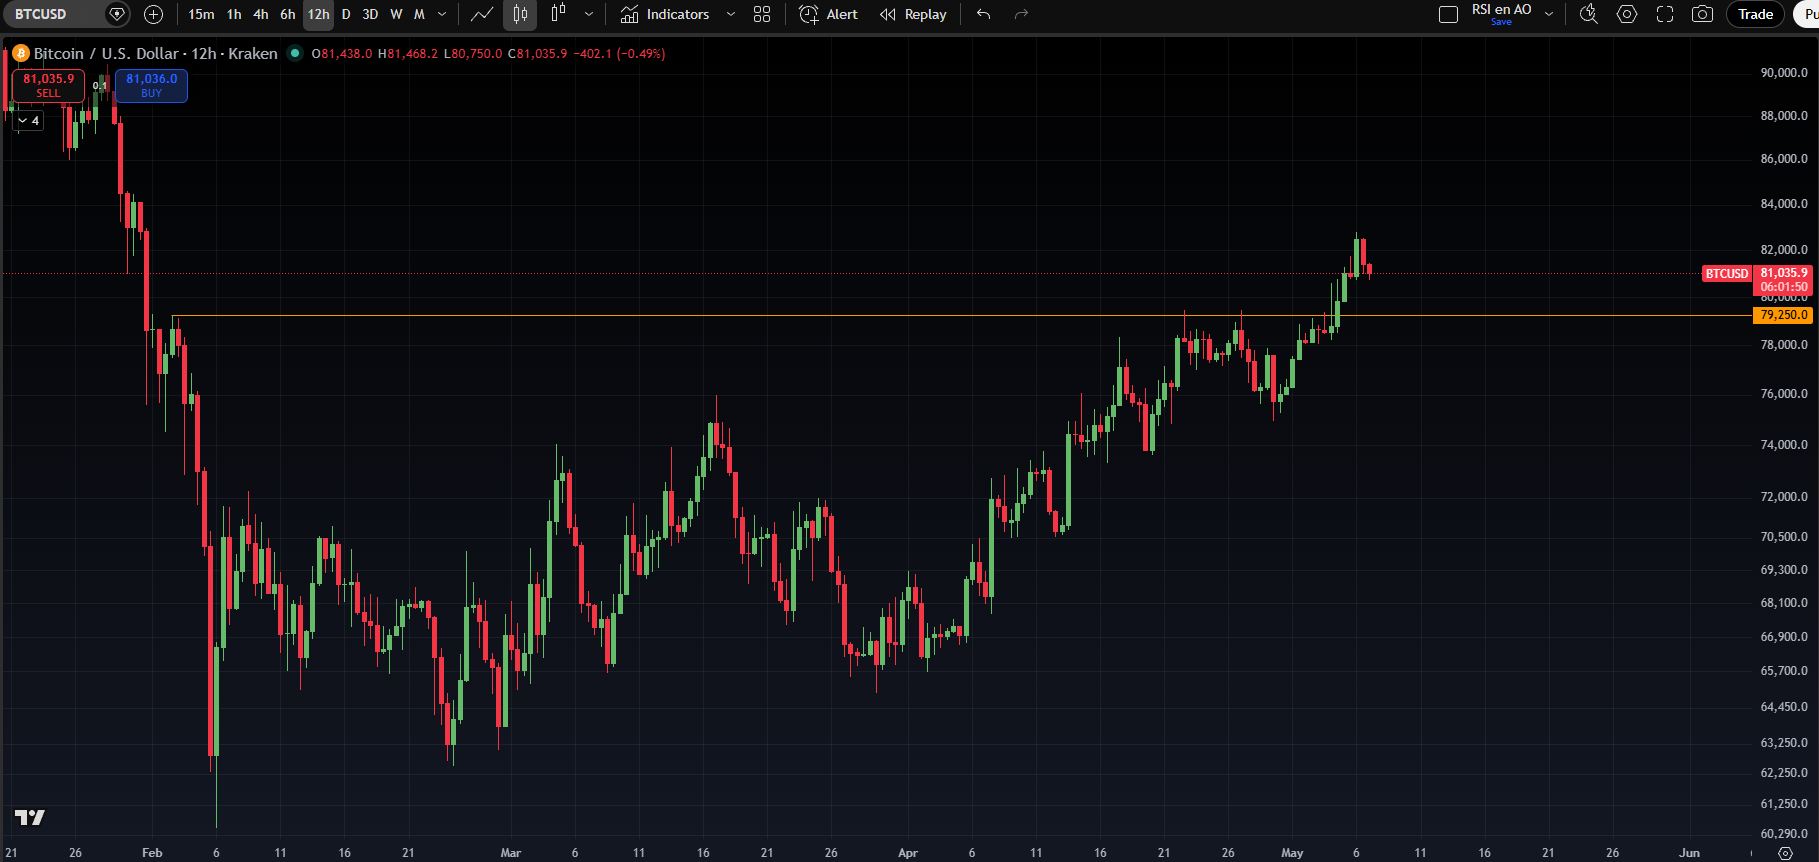
For now, price remains above this level and we can therefore approach the crypto market with a positive bias. Zooming out, however, bitcoin is still in a downtrend and thus increasingly entering zones of potential resistance.
While bitcoin has been moving upward for some time, many larger altcoins are lagging behind. The key question is whether this represents lasting weakness or whether they're about to play catch-up.
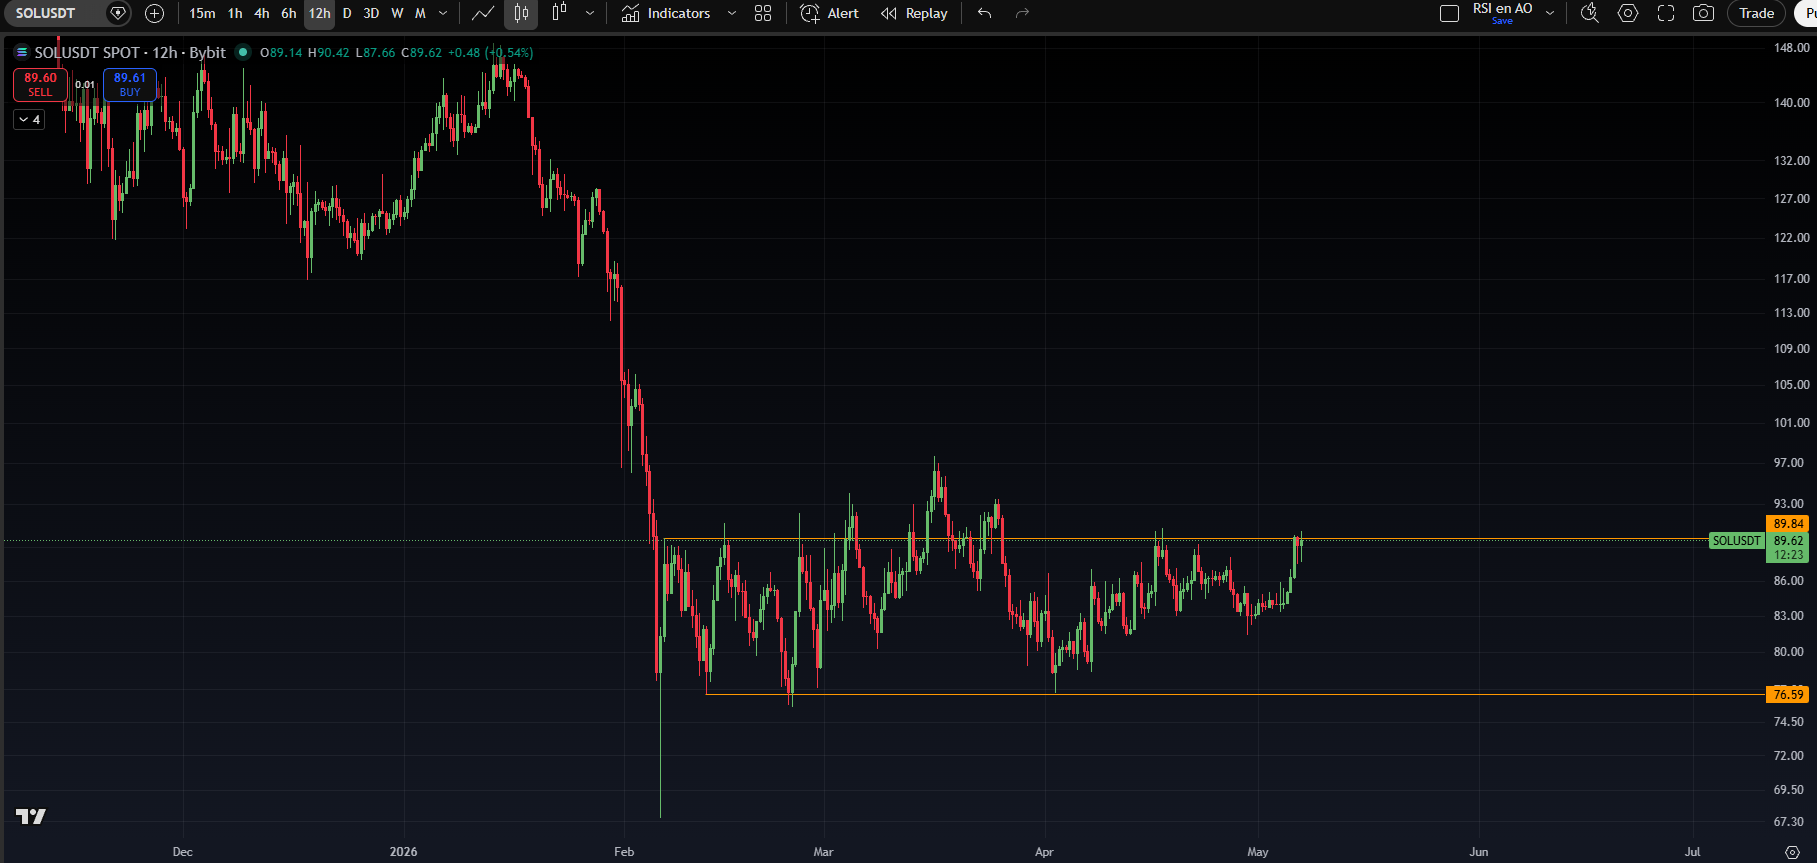
Looking at several large altcoins that have survived multiple market cycles, such as ETH, LINK, XRP, SOL, and DOGE, we see that after the early February bottom they mostly moved sideways. DOGE has since broken out of its range to the upside, but the rest, despite repeated attempts, have not yet broken through the top of their range.
The more often resistance is tested, the weaker it becomes. Since bitcoin and a number of altcoins have already broken out, it's not unreasonable to expect that more altcoins will follow. This is contingent on bitcoin staying above $79,250.
The downward move from mid-January to early February was very strong and found little support. That increases the likelihood that on an upside breakout there won't be much resistance either, and that price could make a significant catch-up move in a short time.
The takeaway from the above is that the combination of a one-sided move down and repeated testing of the top of the range works in favor of a catch-up rally for a number of altcoins. However, we're not there yet. Resistance is and remains resistance until proven otherwise.
3️⃣ First crack already appearing in Warsh's narrative on AI, inflation, and rate policy
Thom
Before Trump's appointed new chairman Kevin Warsh has even started, a first publicly voiced counterargument against his thinking is already coming from within the U.S. central bank.
Where Warsh argues that artificial intelligence can boost productivity so significantly that inflation falls and the Fed gains room to cut rates, Chicago Fed President Austan Goolsbee warns of precisely the opposite risk.
According to Goolsbee, AI may well be a major economic breakthrough. If the technology proves as good as promised, "that would be lovely" and would make the economy richer.
But that's precisely where the danger lies, according to him. If businesses and consumers start spending now based on future productivity gains, while that productivity isn't yet visible in the data, then the economy could overheat.
In that scenario, the Fed shouldn't necessarily cut rates, according to Goolsbee. In fact, the central bank might actually need to raise rates to combat inflation.
That represents an important departure from the narrative that has become increasingly popular in recent months around Kevin Warsh.
The idea is that AI will create a new productivity wave, comparable to the 1990s. Higher productivity would then mean more economic growth, lower inflationary pressure, and ultimately lower rates. That would be favorable for stocks, tech companies, and risk assets like bitcoin.
Goolsbee points out, however, that the difference lies in timing. In the 1990s, productivity growth was already showing up in the economy, while inflation stayed low and profits rose. Now the risk is that the market is primarily front-running productivity that has yet to materialize.
He compares the current AI hype to the expectations around self-driving cars. There too, people thought for years that professional drivers would quickly disappear, but the technology ultimately ran into limitations and delays.
For investors, this is relevant. If AI primarily promises future growth but is already driving enormous investment, higher spending, and rising wealth expectations today, then that could actually be inflationary. In that case, it becomes harder for the Fed to cut rates.
This means that even before Warsh has started, an important debate is already emerging within the Federal Reserve. Is AI a deflationary productivity machine, or first and foremost a source of economic overheating and inflation?
The honest answer is that nobody can say with certainty at this point. Goolsbee does make clear with this argument that Warsh won't simply get a free pass to push through rate cuts at the U.S. central bank.
4️⃣ Strong data, weak sentiment: who will be proven right?
Thom
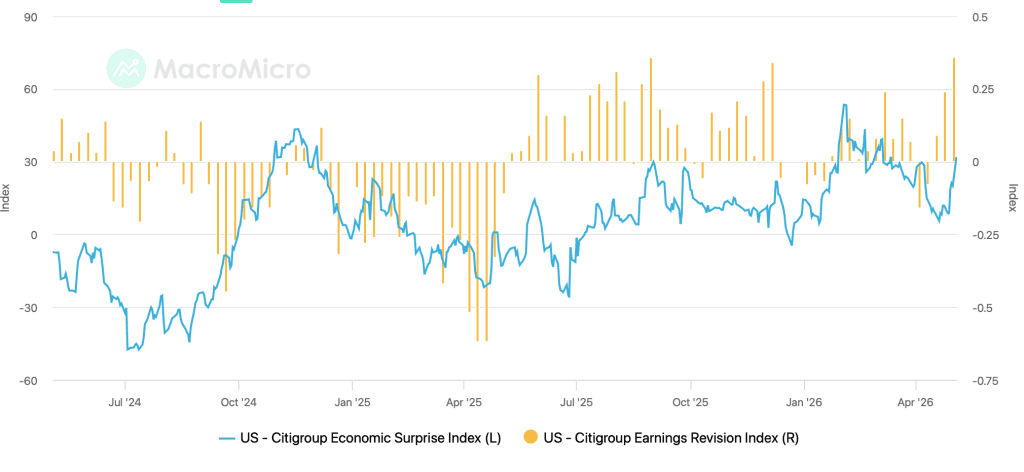
Although the Iran war continues to hang over the market like a dark cloud, financial markets keep rising. This week, U.S. factory orders formed yet another positive surprise on the economic front. Meanwhile, quarterly earnings from publicly traded companies are also coming in well above expectations.
This creates an ever-growing contrast between the hard economic data (positive) and the soft data, such as consumer confidence (negative). The narrative is that the economy is faltering, political polarization is increasing, and investors should be cautious. But meanwhile, factory orders and retail sales figures remain solid.
If the economy were actually weakening quickly, you'd expect that to eventually show up in the data. So far, that's barely happening.
The fact that financial markets are experiencing this strong period despite the Iran war is, to me, a powerful signal. The war remains a clear drag on sentiment, but apparently the underlying economic strength is large enough to absorb that uncertainty for now.
Donald Trump is probably deeply regretting his decision to invade Iran right about now. Without that war, the picture for markets could have been even more favorable.
Iran is the big "but" in many bearish analyses. The conflict poses a risk not only to oil prices, inflation, and consumer confidence, but also to Trump himself heading into the November 2026 midterm elections.
The war obviously shouldn't drag on too long. But if the conflict ends at a point where the market manages to maintain this momentum, then that could well become the tipping point for bitcoin from bear market to bull market.
In closing
All previous editions of Alpha Markets can be found in the archive. Questions, comments, and suggestions are always welcome in the community.
Thank you for reading!
To stay informed about the latest market developments and insights, follow our team members on X:
- Bart Mol (@Bart_Mol)
- Peter Slagter (@pesla)
- Bert Slagter (@bslagter)
- Mike Lelieveld (@mlelieveld)
We appreciate your continued support and look forward to bringing you more comprehensive analysis in our next edition.
Until then!