Crypto Market at a Crossroads
Bitcoin struggles to crack 100k after eight months, with 5.4M BTC traded near that mark. A sharp surge to 123k sparks debate: is bitcoin's strength emerging or is the dollar weakening? Meanwhile, altcoins rally and liquidity surges hint at a brewing market shift.

Bitcoin has been struggling to break through the magic $100,000 barrier for eight months now. It’s no longer just about see the orders placed exactly at 100k in the order book; that milestone is long behind us. However, for many investors, this price level is attractive enough to sell some of the sats they’ve held onto for years.
Last week, we estimated that around 5.4 million bitcoin changed hands at prices near 100k. This represents a massive shift from old to new investors.
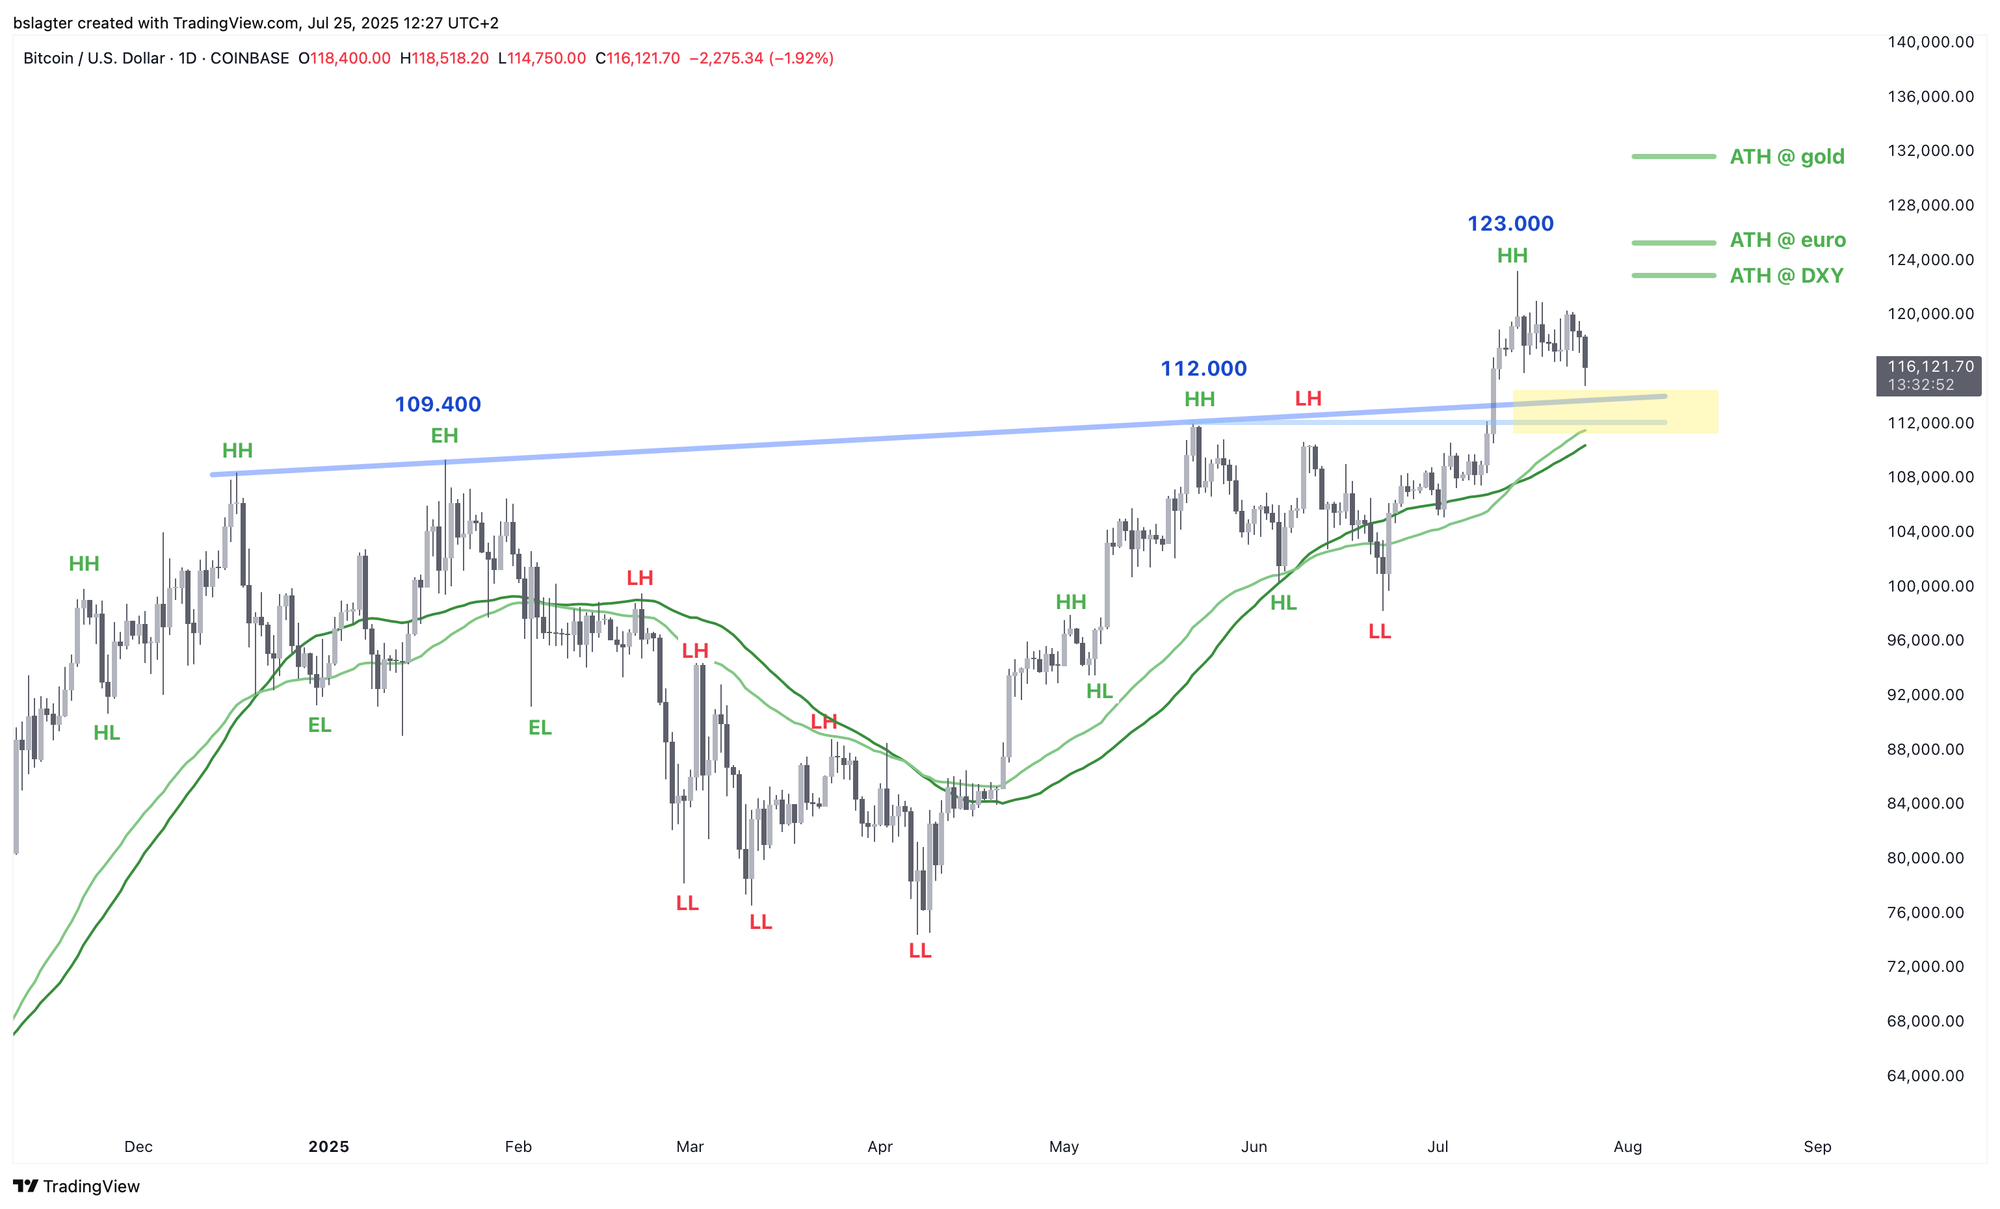
Two weeks ago, BTC soared from $108,000 to $123,000 within a few days before settling just below that level. This marks an important milestone, following incremental all-time highs of $108k in December, $109k in January, and $112k in May.
Yet this is still not enough to fully put the battle with 100k behind us. After all, does this surge reflect bitcoin’s strength or the dollar’s weakness? It isn’t until bitcoin goes above 123k that we also break the record in the dollar index (DXY), and above 125k the euro record crumbles.
We’ve been holding our breath over the past two weeks as prices trade in a tight range around $119,000. A move toward $130,000 would be welcome, but real comfort will only come with a rise above $150,000.
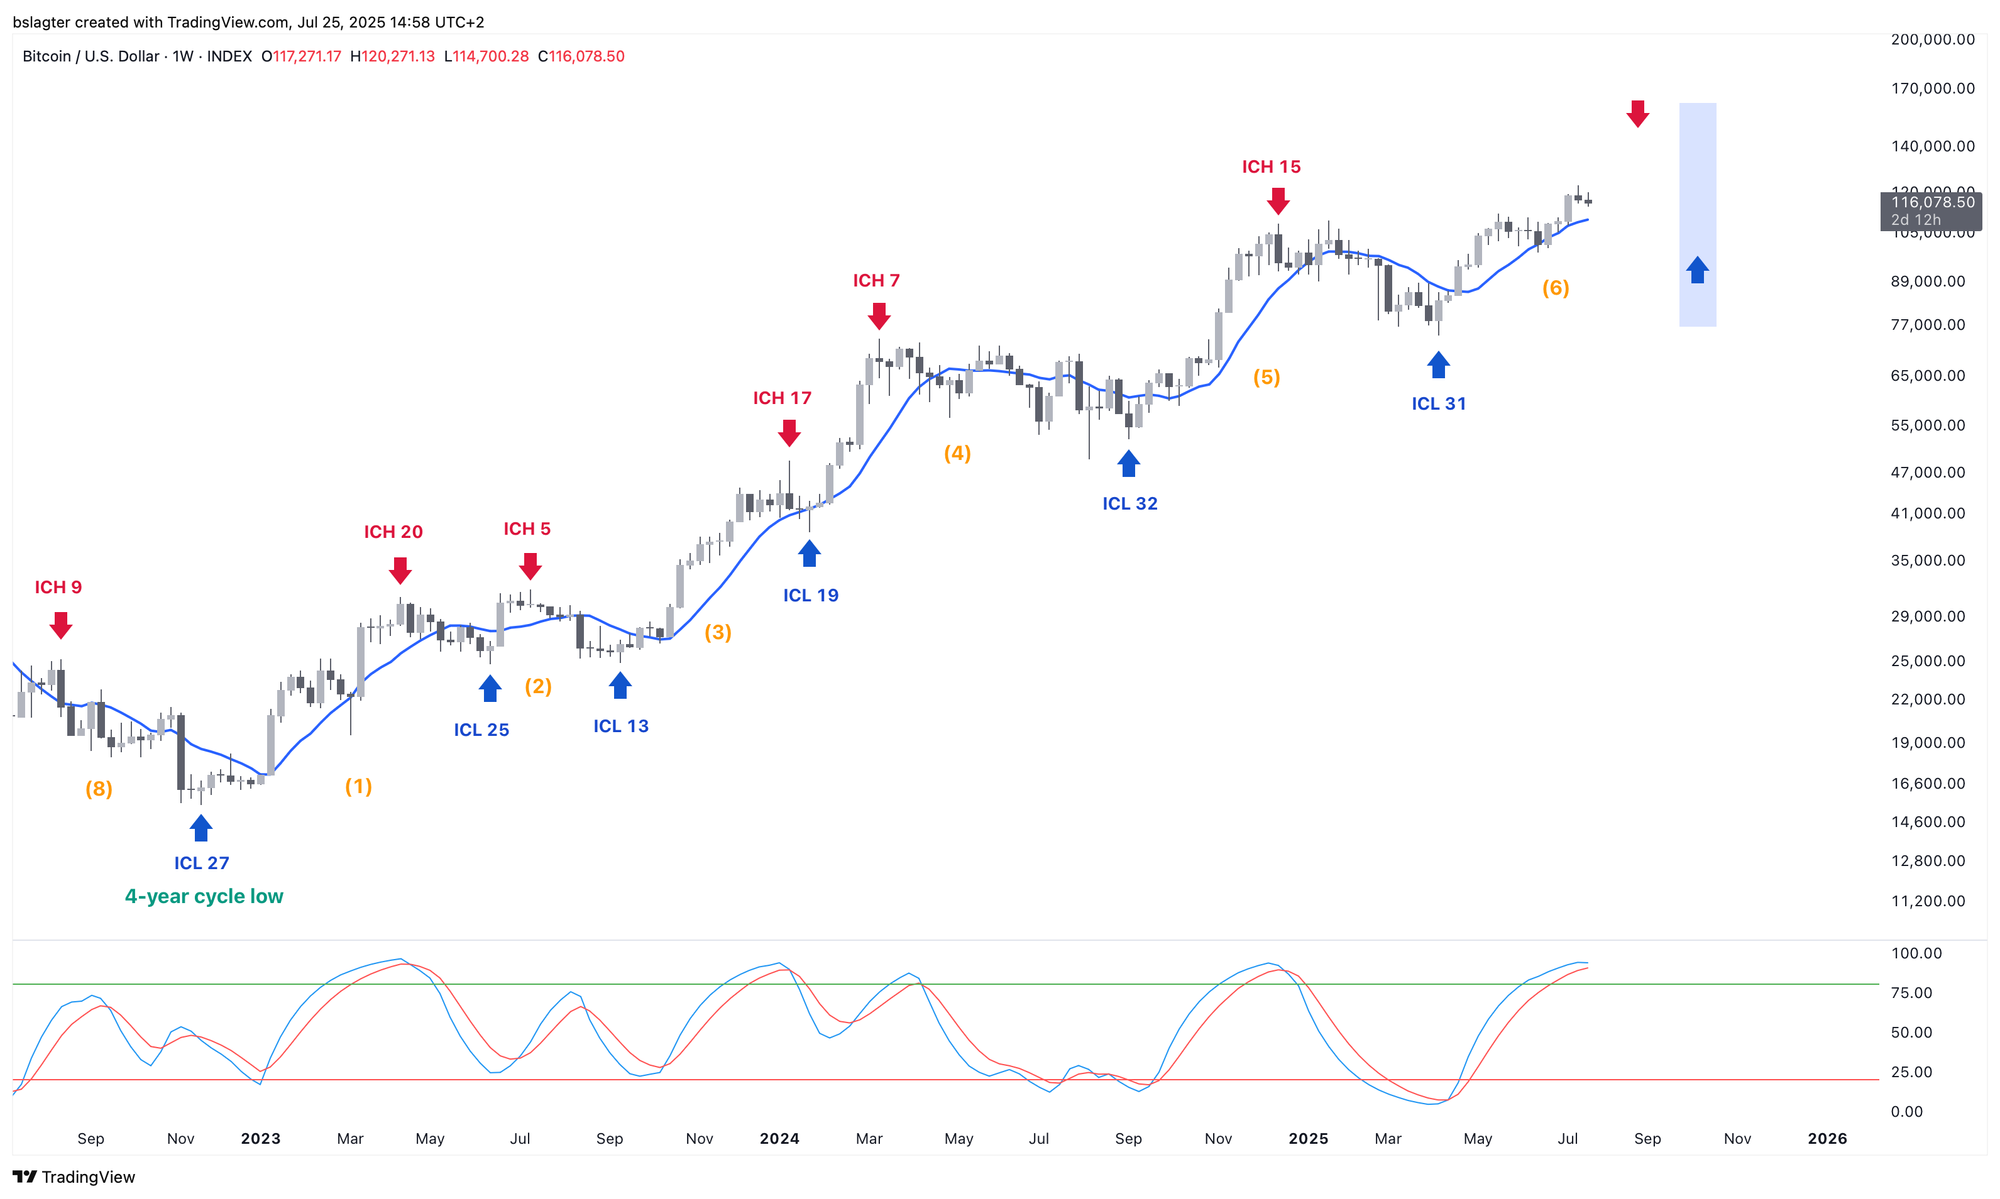
Our basic scenario remains that the current weekly cycle will carry us to that level in the coming weeks.
In recent years, after a major breakout we often saw a few days or weeks of consolidation, followed by a steady upward move without retesting the breakout level.
This time, it seems different. Last night, the price dipped to $114,750, coming very close to the zone where earlier horizontal resistance and the neckline of the inverted Head & Shoulders pattern are located. We have highlighted that zone in yellow on the chart.
When we broke above $112,000, the price quickly climbed to $115,000, with very little trading occurring between 112k and 115k. It’s quite possible that this gap will be filled first. There’s nothing wrong with that—only if a day closes below $112,000 must we reconsider our outlook.
The drop in bitcoin’s price seems to have a cause specific to bitcoin. Rumor has it that an old investor is unload a large position through Galaxy. The price movement indeed has the characteristics of a TWAP—a large order being sold off bit by bit every few seconds or minutes.
We also see minimal weakness in many altcoins; in fact, some alts are showing significant gains. Bitcoin dominance is declining—a trend you wouldn’t expect in a market gripped by widespread fear or uncertainty.
Today's dip somewhat overshadows the unique market position we now face:
- Bitcoin, at $120,000, is on the verge of leaving behind the 100k struggle.
- Many altcoins, after significant catch-up gains, have reached points where they could break a trend—turning from a downtrend to an uptrend or breaking out of a trading range.
- The market’s enthusiasm and optimism have returned, though they haven’t yet escalated into full-blown excitement, sensation, and hype.
A crossroads lies ahead, with two potential paths:
The first option is a continuation of the old regime, where bitcoin makes occasional moderate, controlled upward moves while altcoins trend downward relative to bitcoin, further bolstering bitcoin dominance.
The second option is a shift to a new regime where bitcoin rises but many altcoins surge even more, marking the onset of the bull market’s manic phase. In this scenario, bitcoin dominance reverses course and declines.
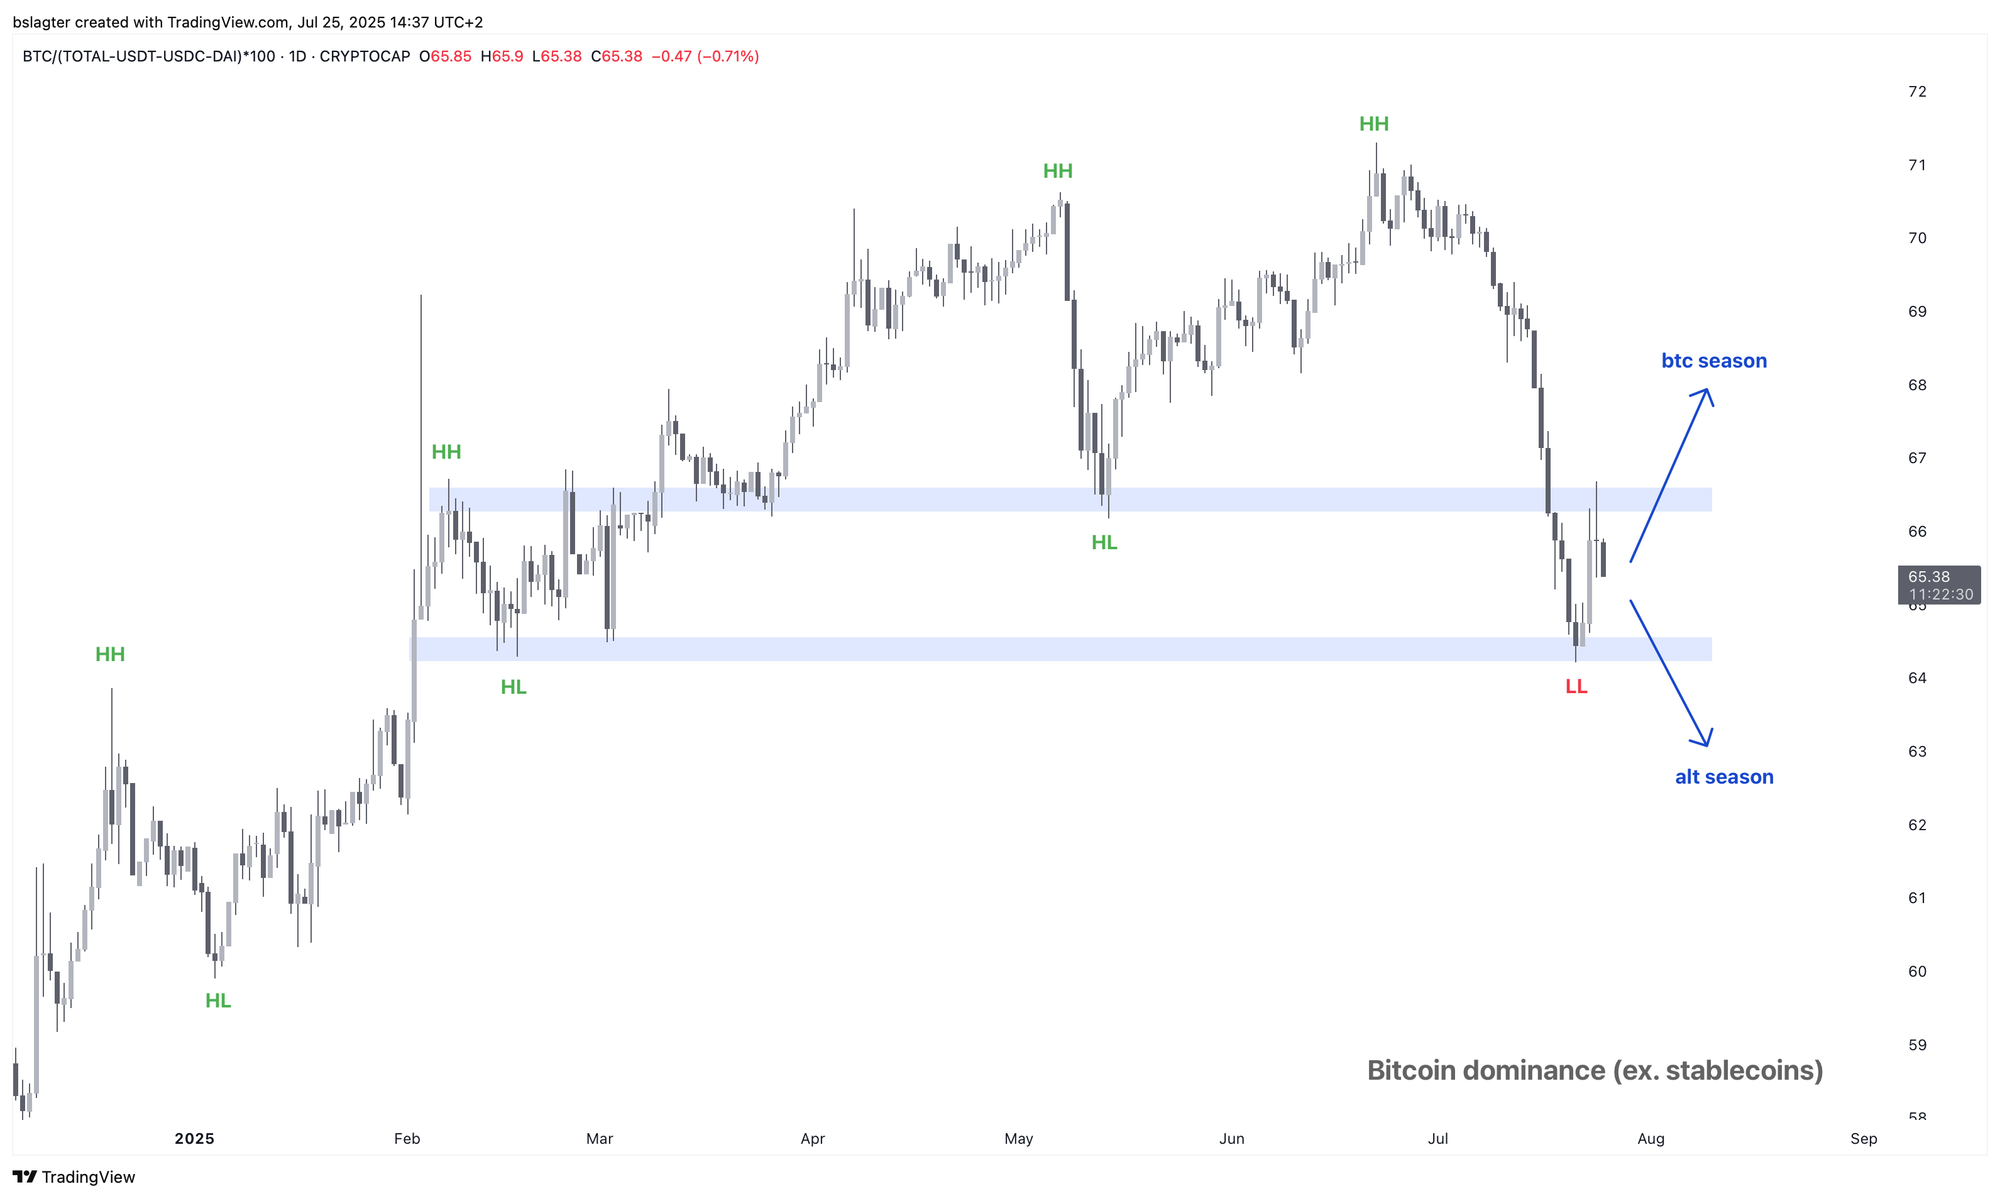
We expect a decision to unfold in the coming week. With a packed schedule of events that could move markets—including interest rate decisions from the US and Japanese central banks and the presentation of the presidential report on the first 180 days of crypto policy—investors will likely reveal their positions.
It’s possible that we won't have to wait until Wednesday. The ETH market, in particular, appears impatient. After a 50% rise in two weeks, there has only been a 9% correction so far, indicating strong demand for the Ethereum network’s asset.
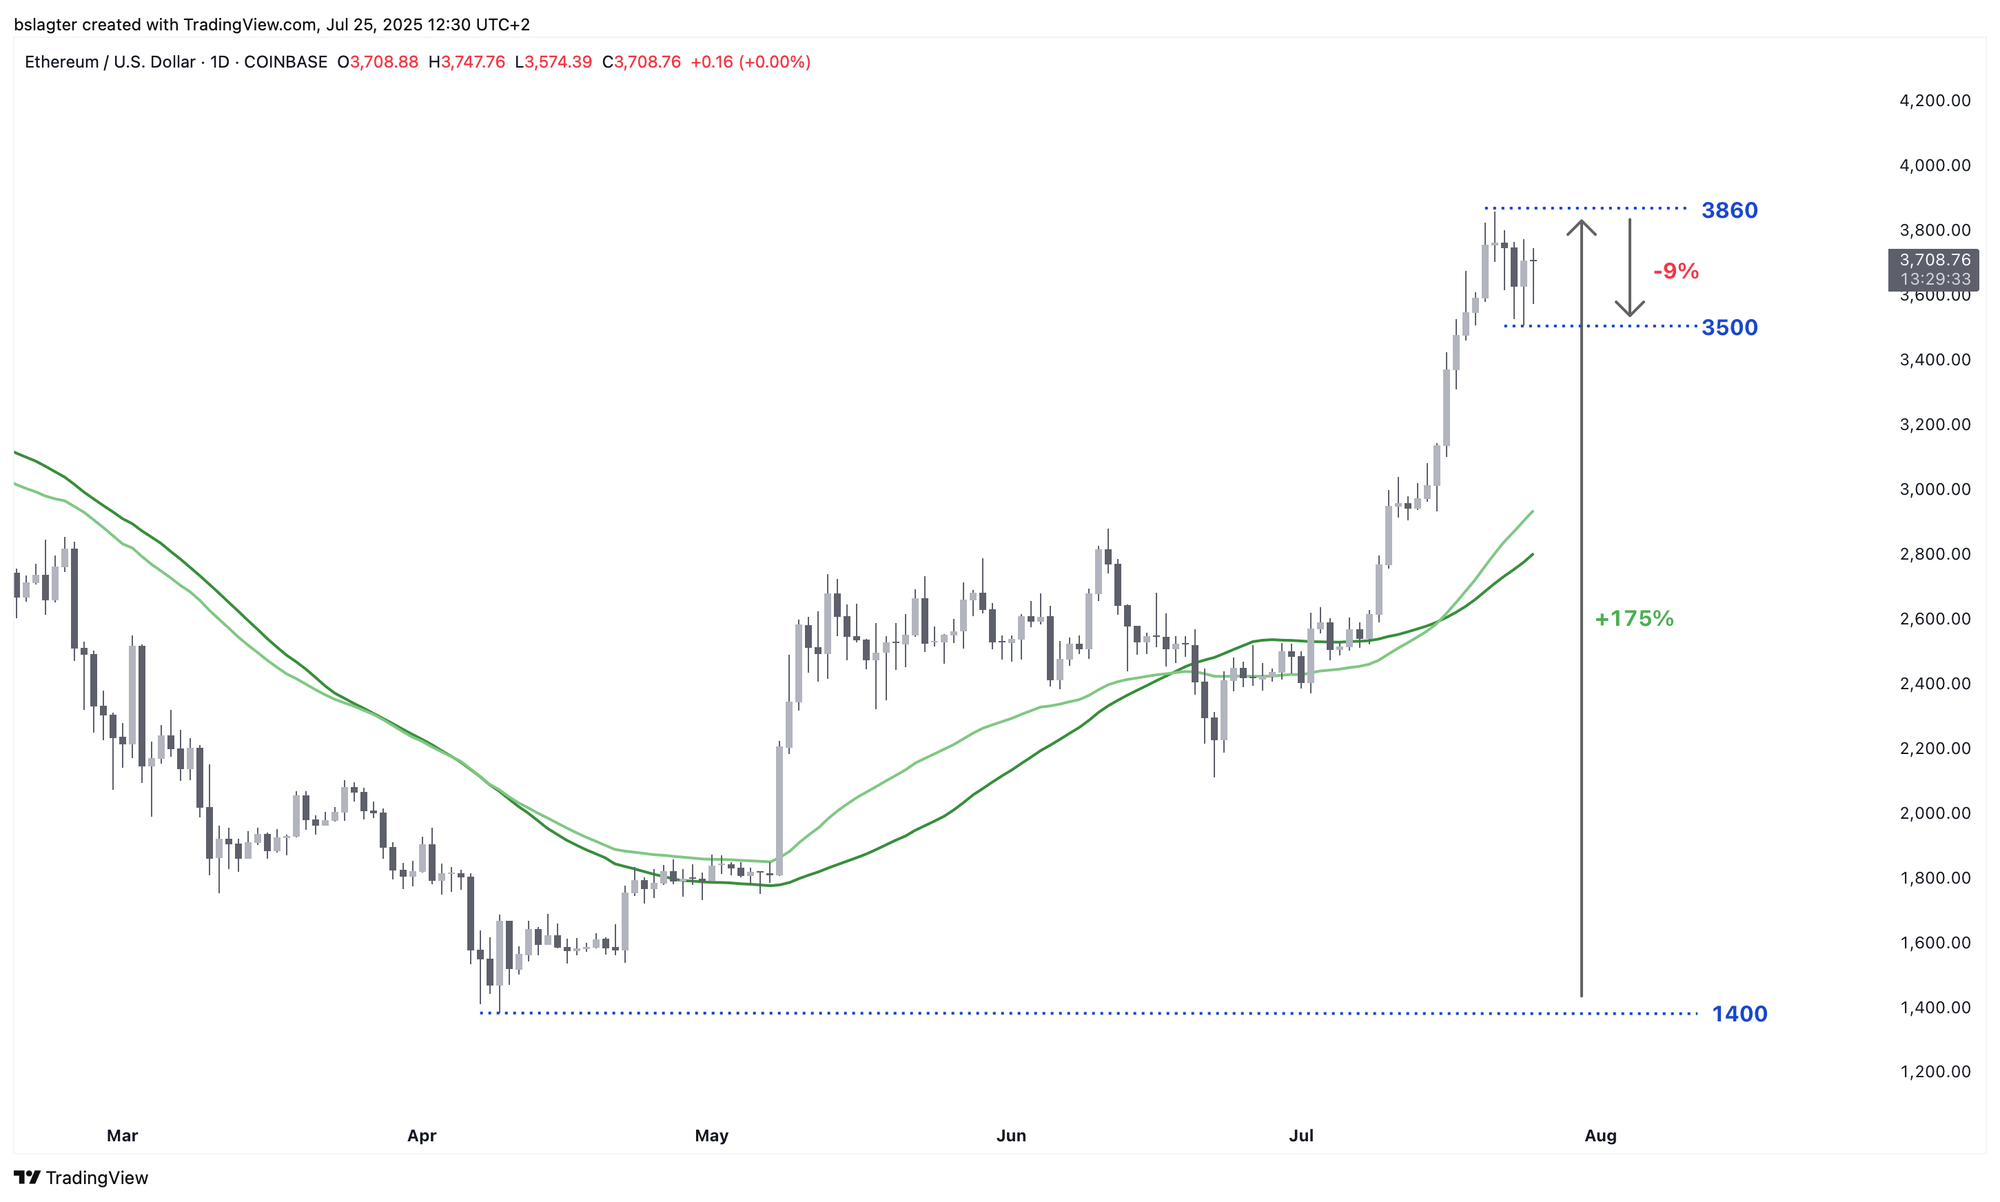
ETH’s rally is more than just a short squeeze. Inflows into ether ETFs over the past two weeks have exceeded those into bitcoin ETFs. On-chain data shows new investors entering the market. While existing investors are taking significant profits, the supply of ETH is being snapped up so quickly that the price hardly drops.
This is a bullish sign and indicates an early trend reversal compared to the long-term weakness seen in ETH in recent years.
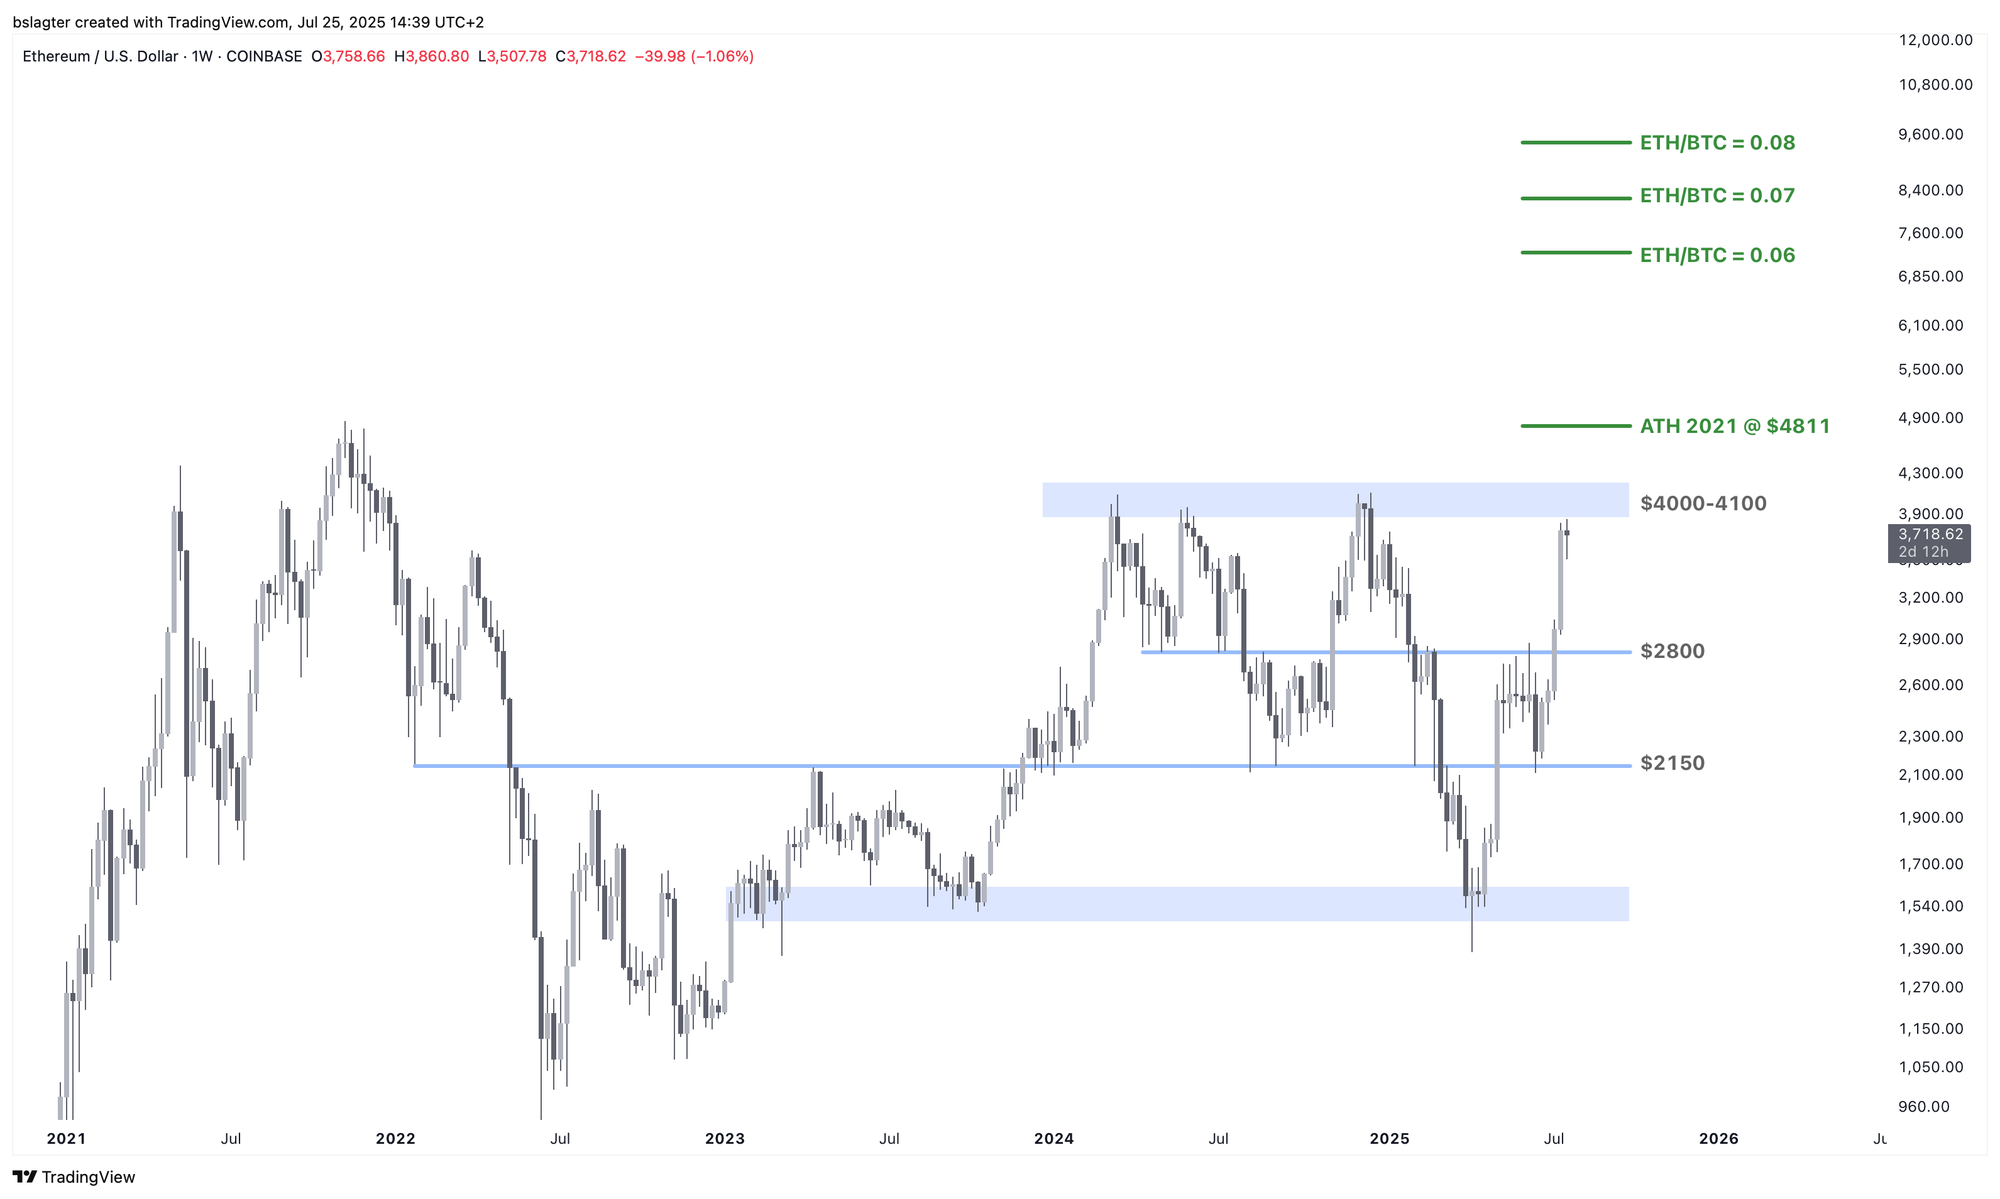
We have now reached the $4,000 mark for the fourth time in a year and a half. Significant resistance should be expected there. Only if we see clear acceptance above $4,100 will we look upward from there, with the all-time high of $4,800 waiting at the next level. The range between $4,000 and $4,800 could very well be as significant for ETH as BTC’s 100k level—where old investors are inclined to sell part of their position.
According to Udi Wertheimer, this supports his thesis that bitcoin will continue to outpace the rest of this bull market. The old bitcoiners have already sold what they wanted to, but altcoin investors are still waiting for prices to rise above the 2021 peak and will add significantly more supply at that point.
How this will play out remains to be seen; for now, the data suggest a different regime for ETH than what we’ve observed in recent years.
We continue with the following topics for our Alpha Plus members:
- Ambiguous daily cycle
- No, it’s not just about the US central bank’s interest rate policy
- The big picture remains bullish for bitcoin
1️⃣ Ambiguous daily cycle
Bert
Our Discord members asked about the daily cycle—an excellent question that warrants a somewhat longer answer than usual. The daily cycle chart is ambiguous, allowing for two valid interpretations.
First, if we consider June 5 as the daily cycle low (DCL), we are now on day 50 with little room left for another significant move upward. It’s likely that the $123,000 on day 39 was the daily cycle high (DCH), and we’re now heading toward a DCL sometime in early August.
This interpretation is challenging because technically we experienced a “failed cycle” with the $98,000 on June 22. That surge to 123k doesn’t quite fit the pattern—in fact, one might expect more prices below 98k to follow.
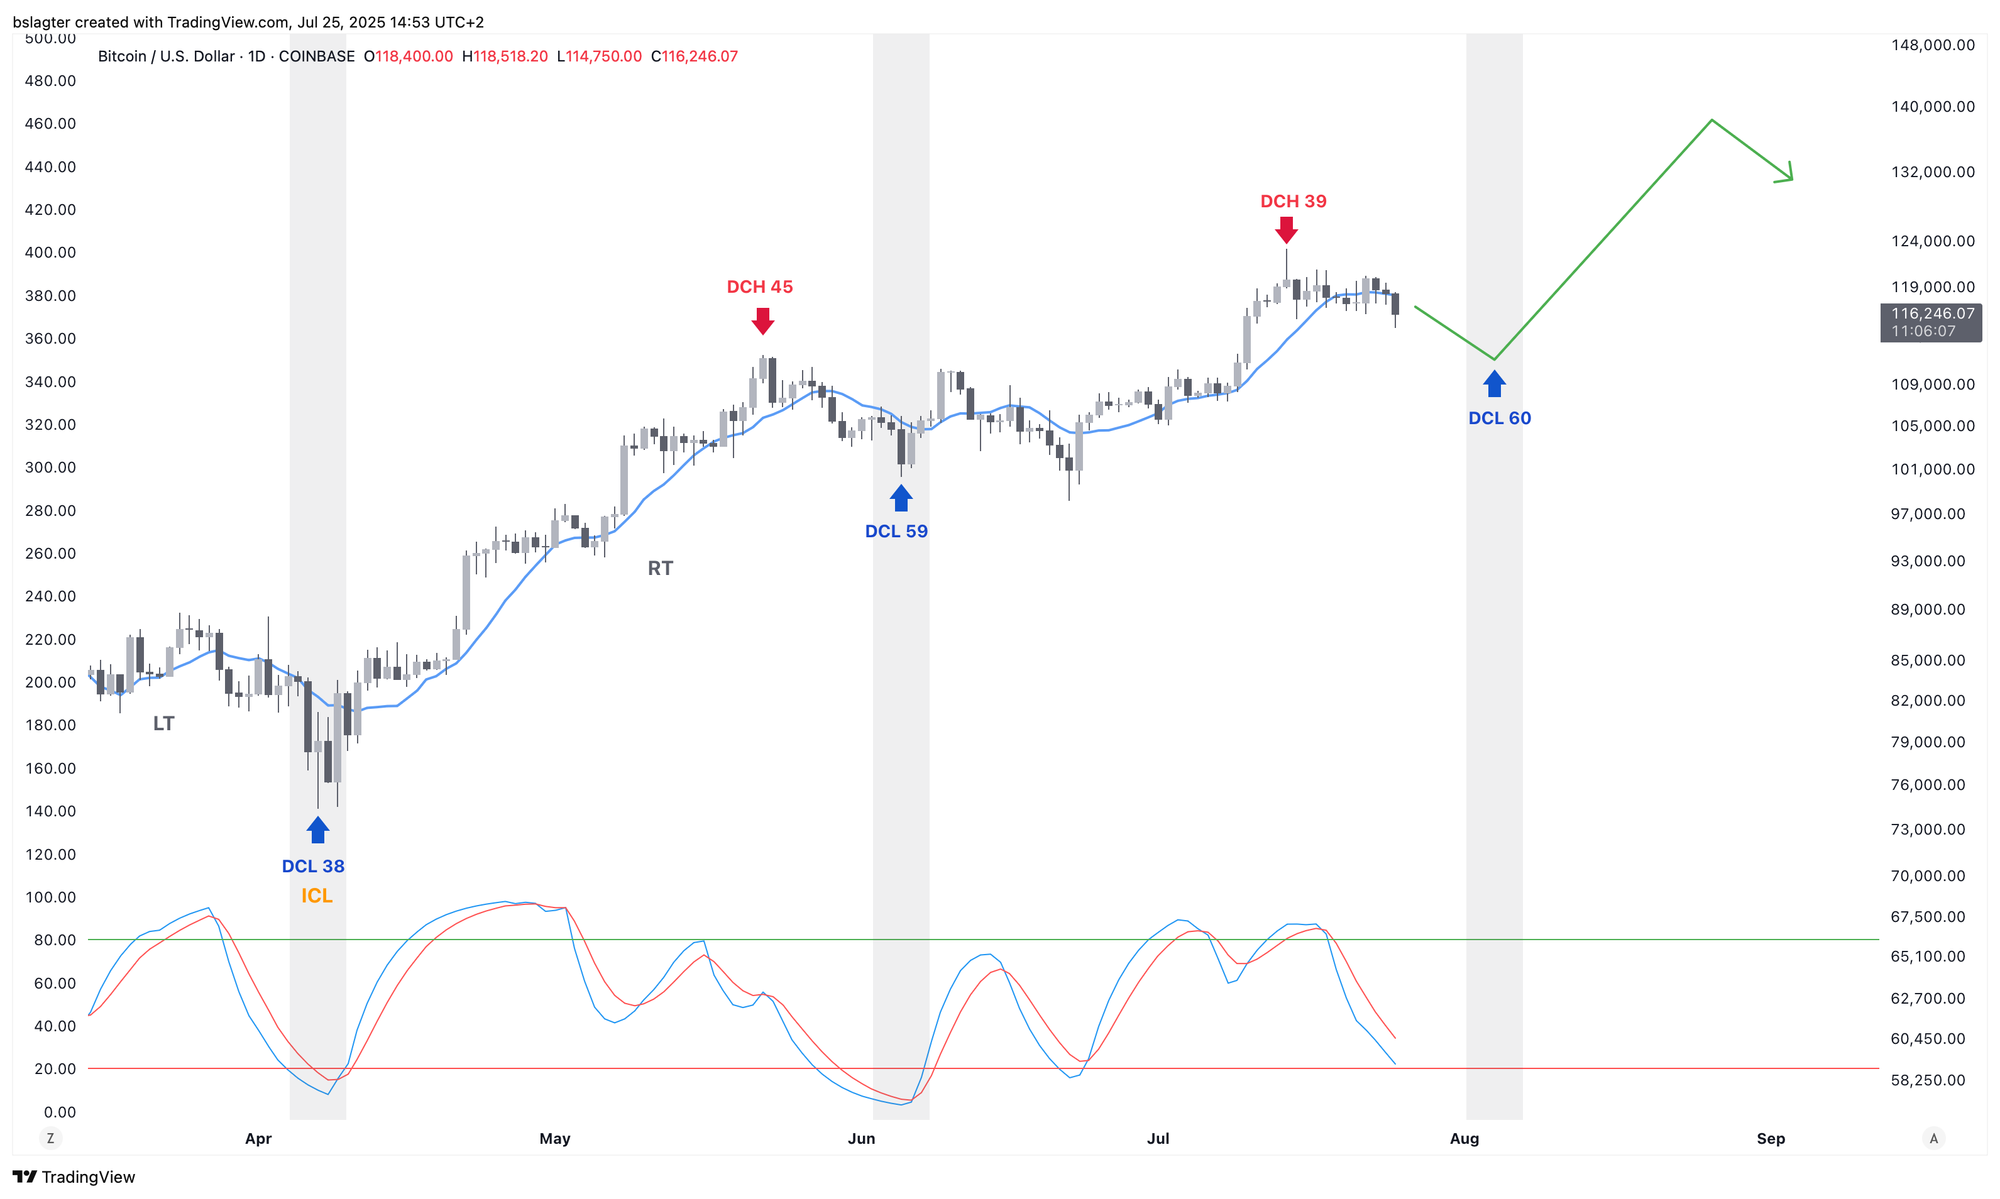
Alternatively, if we take June 22 as the DCL, we are now on day 33. The current price stagnation could be seen as a mid-cycle pause, with an anticipated upward continuation toward the DCH sometime in early August over the next two weeks. The following daily cycle would then carry us to the top of this weekly cycle in September.
This view is challenging because a 76-day cycle is quite extended, and the low on June 5 actually meets all the criteria of a DCL. One mitigating factor is that the previous long cycle came after a short 38-day cycle—a combination we’ve seen more frequently, especially following external shocks like the tariff war and the conflict between Israel and Iran in February and March.
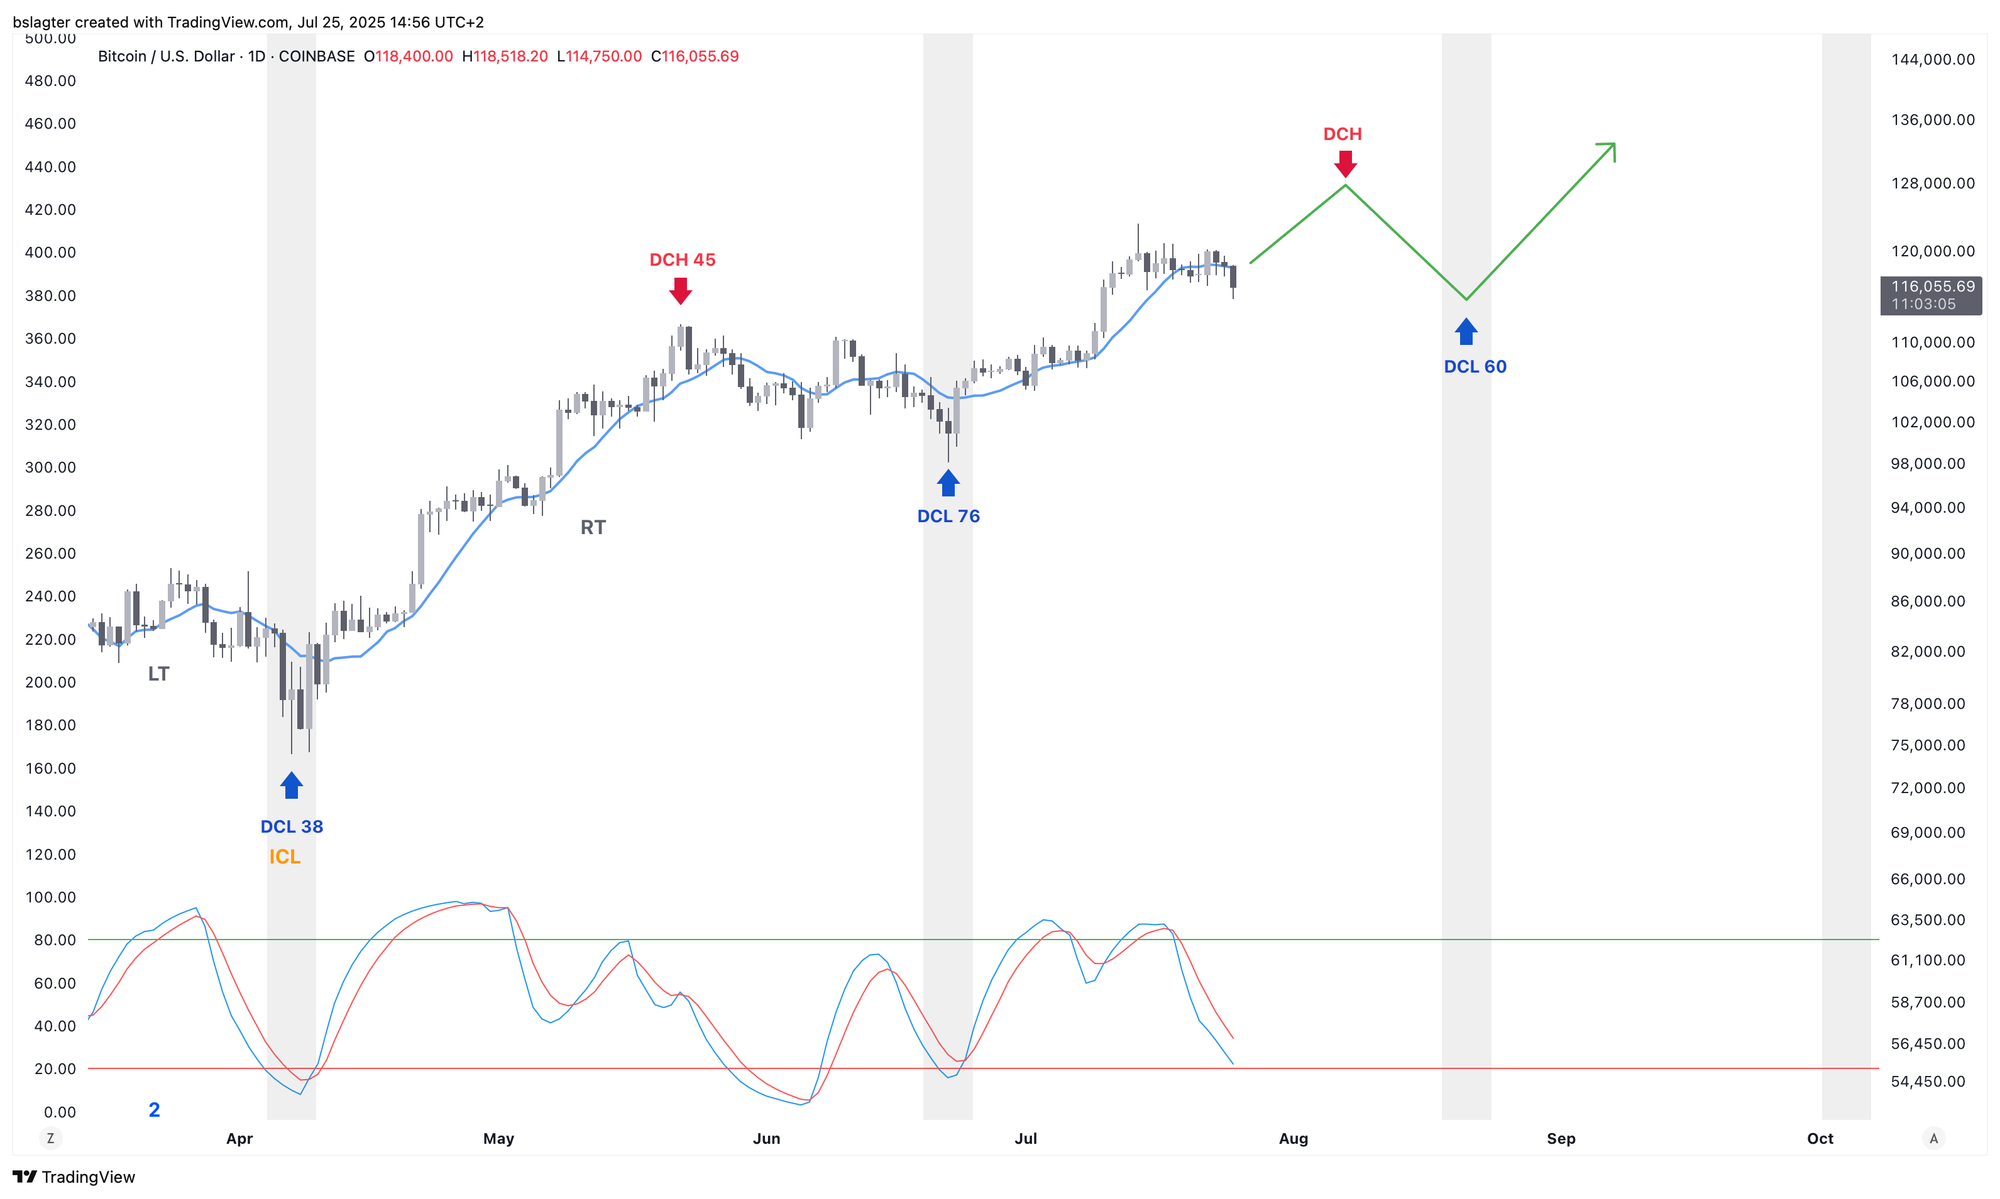
Both interpretations have their merits and drawbacks. Over time, the data will clarify which scenario is more likely. In the meantime, we can focus on the weekly cycle, which remains intact and is expected to continue its upward trend for the next 5 to 8 weeks—regardless of which daily cycle interpretation turns out to be correct.
2️⃣ No, it’s not just about the US central bank’s interest rate policy
Thom
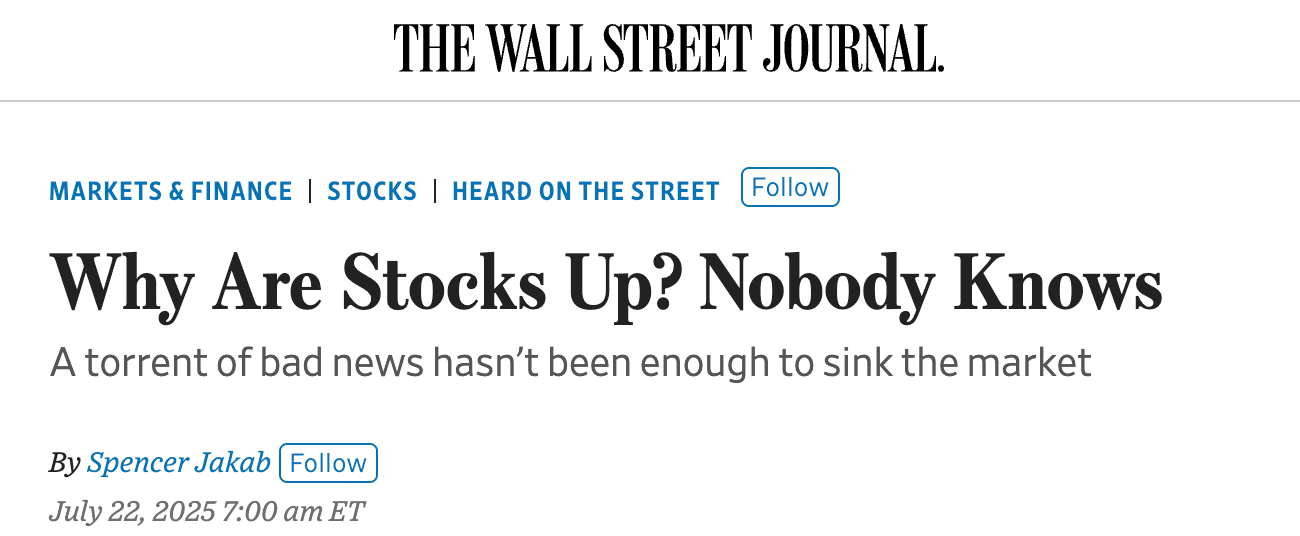
“Why are stocks rising? Nobody knows,” headlined The Wall Street Journal on July 22, with a subheading noting that “a stream of bad news was not enough to bring the market down.”
The article mentions the tariff war and highlights that 33% of the economists surveyed by the Journal expect a U.S. recession within 12 months—up from 22% at the start of 2025. It also notes that earnings expectations for the S&P 500 have fallen 3% since the beginning of the year.
Yet the S&P 500 has risen 8.6% since the start of 2025 and about 25% since the tariff bottom in April. How can asset prices keep climbing despite these headwinds?
The answer is that it’s not merely about the US central bank’s interest rate policy, Trump’s tariff war, or economists’ relatively high recession expectations. A key factor is Financial Conditions—that is, how easily capital can be borrowed at any given moment.
These conditions are crucial for global liquidity, which is the amount of capital available worldwide for investments. When liquidity increases, asset prices in financial markets typically rise.
Looking ahead, we see two important developments.
First, Trump has abandoned the plan to cut spending and now wants to give the economy a robust boost. Other global powers are following suit. This builds confidence in the economy, creates the expectation that companies can meet their obligations, and makes lenders more willing to provide capital—all of which stimulate economic growth and support rising financial markets.
Second, the US central bank is expected to implement another 25 or 50 basis points of rate cuts later this year, further encouraging market risk appetite. Although inflation is warming gradually—which might typically prompt a tighter stance from the central bank—Trump appears to be undermining its political independence. That’s not how it should ideally work, but for investors it creates very favorable conditions.
In my view, this is what’s driving the markets—and it could continue for weeks, months, or even a year.
3️⃣ The big picture remains bullish for bitcoin
Thom
In the short term, various factors could cause a price dip:
- US inflation is on the rise.
- Trump’s trade war is back in the news. Ongoing “deals” remind us that the global economy must adjust to higher costs for international trade.
- Long-term interest rates are climbing, which will eventually dampen economic growth.
All this is happening against the backdrop of a market that has skyrocketed over the past few months. Investors are dazzled by those numbers and see little danger, which typically makes the market more vulnerable to even a small headwind.
If prices dip slightly as investors take profits—for instance, due to concerns over rising inflation and interest rates—the long-term outlook remains very positive. The US economy continues to be supported by a robust consumer base and a strong labor market. Analysts sometimes note that the labor market only remains buoyant thanks to government intervention.
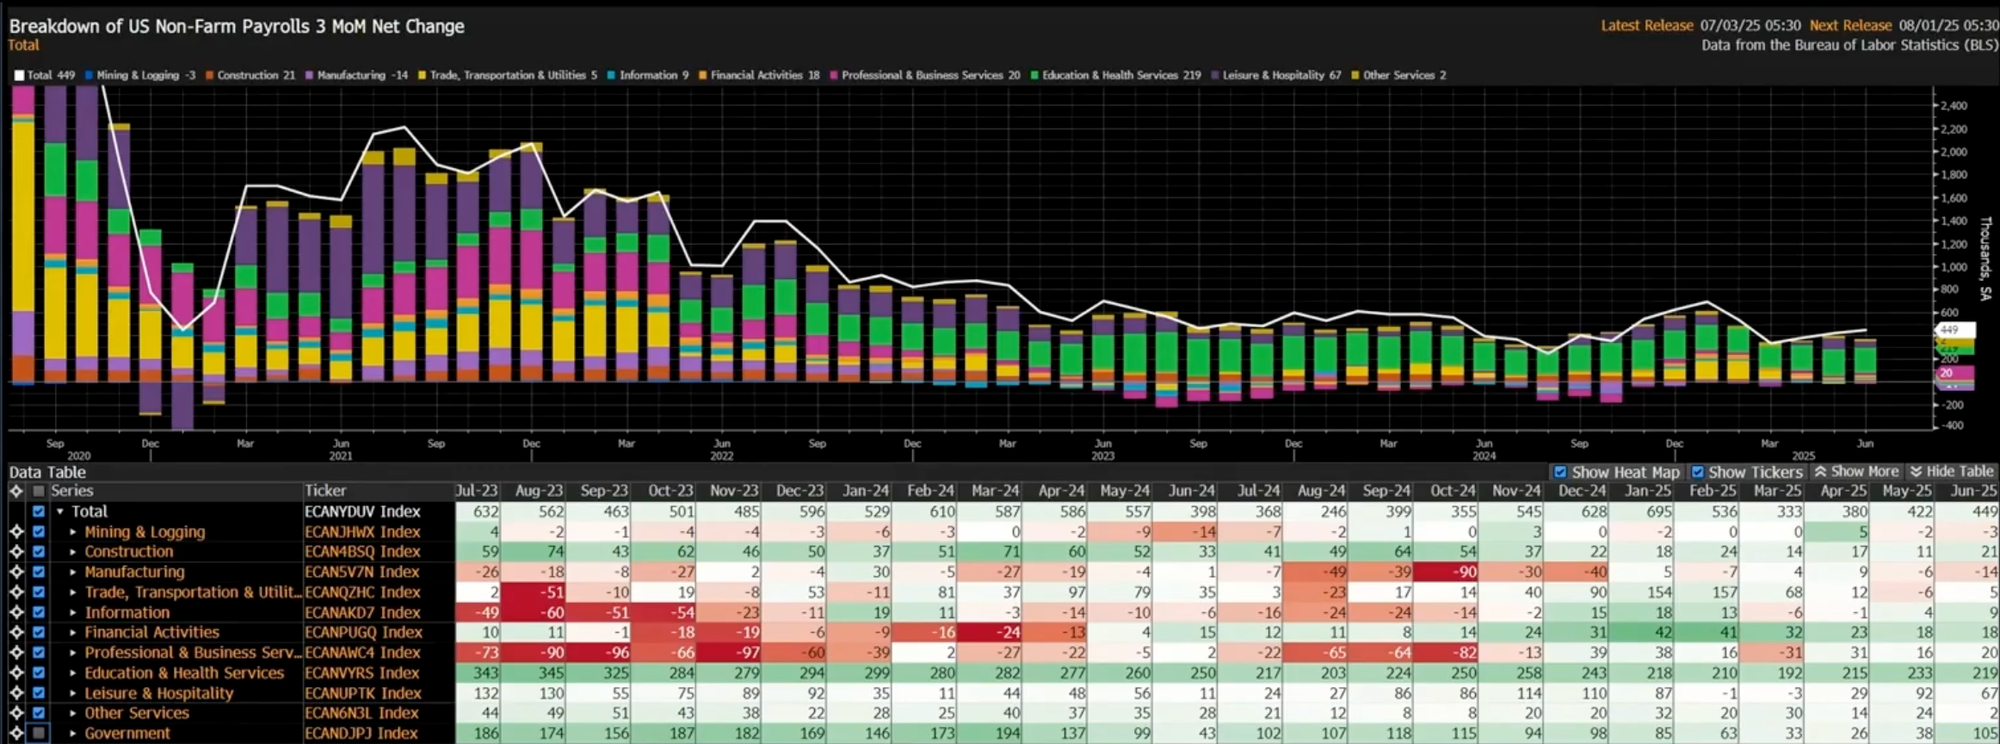
Of course, the enormous budget deficits of the Trump administration also play a role, but the Bloomberg chart below shows that the private sector continues to add jobs.
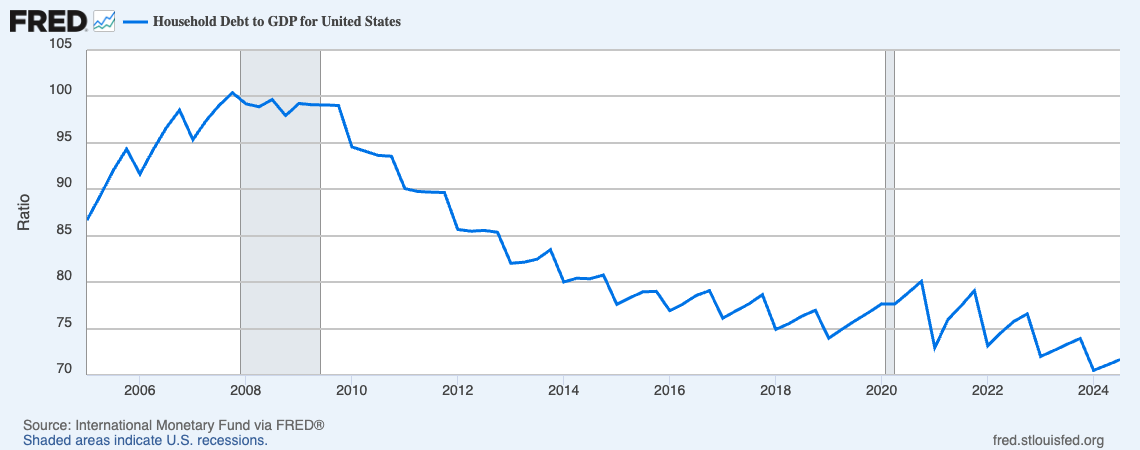
Job growth not only signals a favorable climate for the American consumer, but the ratio of household debt to income has also dropped significantly since the 2008 financial crisis.
A similar picture is seen when looking at interest payments as a percentage of income in the United States.
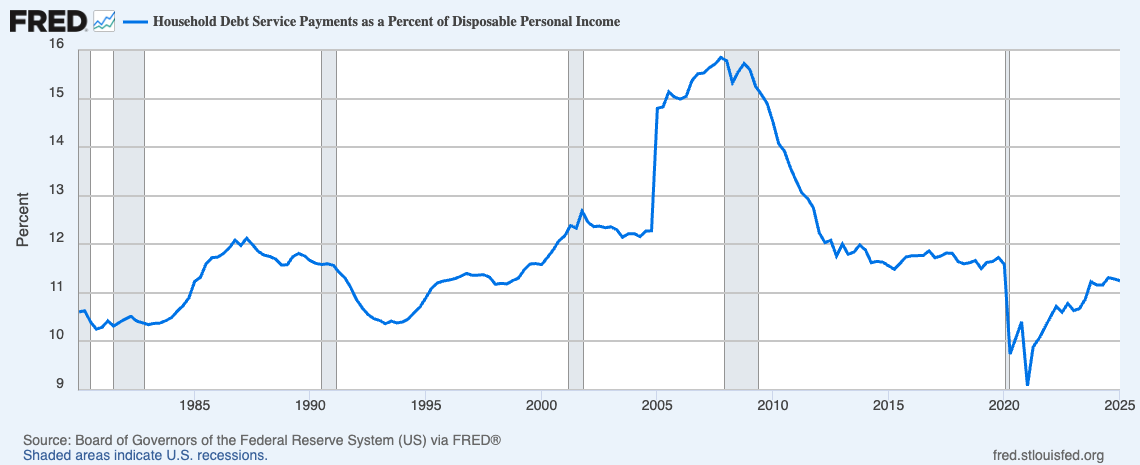
Simply put, from a consumer’s perspective it’s hard to argue that a rough patch is imminent. That could always happen, of course, but it’s not evident in the numbers yet.
Moreover, the risk appetite among investors suggests a robust economy. Beyond bitcoin, more and more risky financial assets are performing well. Within the crypto sector, altcoins like ETH and XRP are showing significant gains again.
This may be temporary, but it certainly indicates that investors are becoming more willing to take risks—something rarely seen when the economy is struggling, as investors tend to flock to safer assets then.
In summary, the macroeconomic climate exudes confidence about the future. There’s little fear of a recession or other economic hardships; companies face few obstacles, and as a result, the market is willing to invest. The risk appetite remains high.
Consequently, we’re experiencing an influx of liquidity—a trend reflected in the rising prices of risk assets, including bitcoin and stocks. As long as this continues, the path of least resistance is upward, and that could persist for weeks, months, or even a year. For now, I remain bullish.
Thank you for reading!
To stay informed about the latest market developments and insights, you can follow our team members on X:
- Bart Mol (@Bart_Mol)
- Peter Slagter (@pesla)
- Bert Slagter (@bslagter)
- Mike Lelieveld (@mlelieveld)
We appreciate your continued support and look forward to bringing you more comprehensive analysis in our next edition.
Until then!
