Caught Between Bulls and Bears
Bitcoin steadies at $84K after volatile weeks, caught between short-term lows and a long-term bull run. Can a push past $92K trigger a reversal? Plus, Trump's aggressive tariffs fuel an intense global trade showdown. Will Bitcoin emerge as digital gold—or a risky tech play?
After several turbulent weeks, the bitcoin market calmed down this week, with prices stabilizing around $84,000. Over time, Bitcoin is increasingly caught between a short-term downtrend and a long-term uptrend.
On March 28, we discussed two key premises:
In the long run we remain in a bull market until proven otherwise, with a key indicator being prices falling below the 50‑week average (the handbrake).
In the short term we are in a downtrend until evidence suggests otherwise, notably when prices exceed $92,000.
This analysis still holds today. In the three weeks that followed, the short-term downtrend persisted, with a provisional low of $74,420 reached on April 7. Meanwhile, the long-term uptrend remained intact; even though the price briefly dipped below the 50‑week average, the weekly range stayed above it.
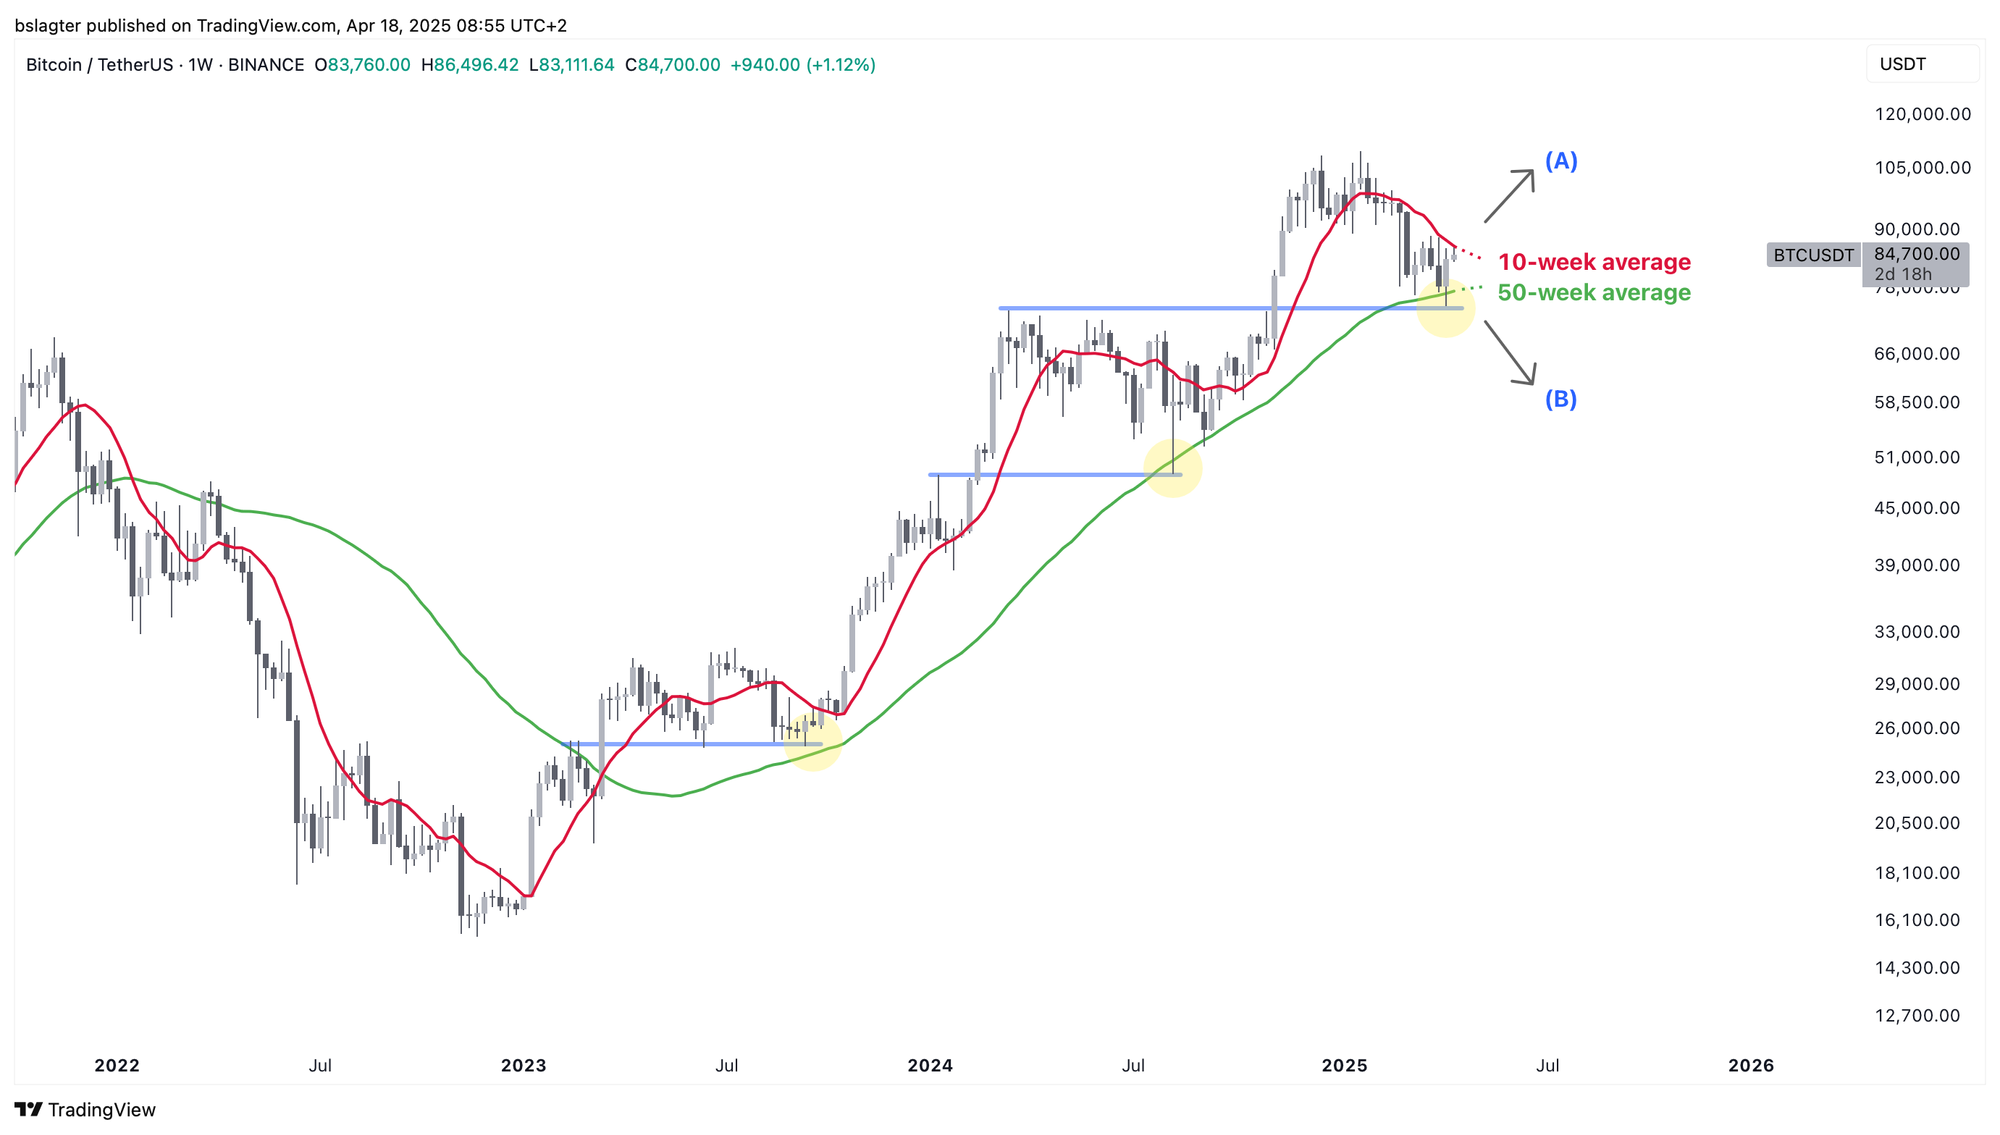
The chart below illustrates the steadily narrowing gap between the 10‑week and 50‑week averages. The former reflects the short-term trend, while the latter signals the long-term trend.
The similarities to August 2024 are striking. At that time, a bottom just below the 50‑week average marked the correction’s nadir, followed by a remarkable surge of more than 100% – rising from $52,000 to $109,500.
From here, two paths emerge:
- In the coming weeks, the short-term trend might reverse from a downtrend to an uptrend (A). This could signal the start of a surge similar to that seen in fall 2024, although a prolonged period of sideways movement is also possible.
- Alternatively, prices might continue to fall in the coming weeks (B). In that case, the long‑term trend would reverse from up to down, and the market would be treated as bearish.
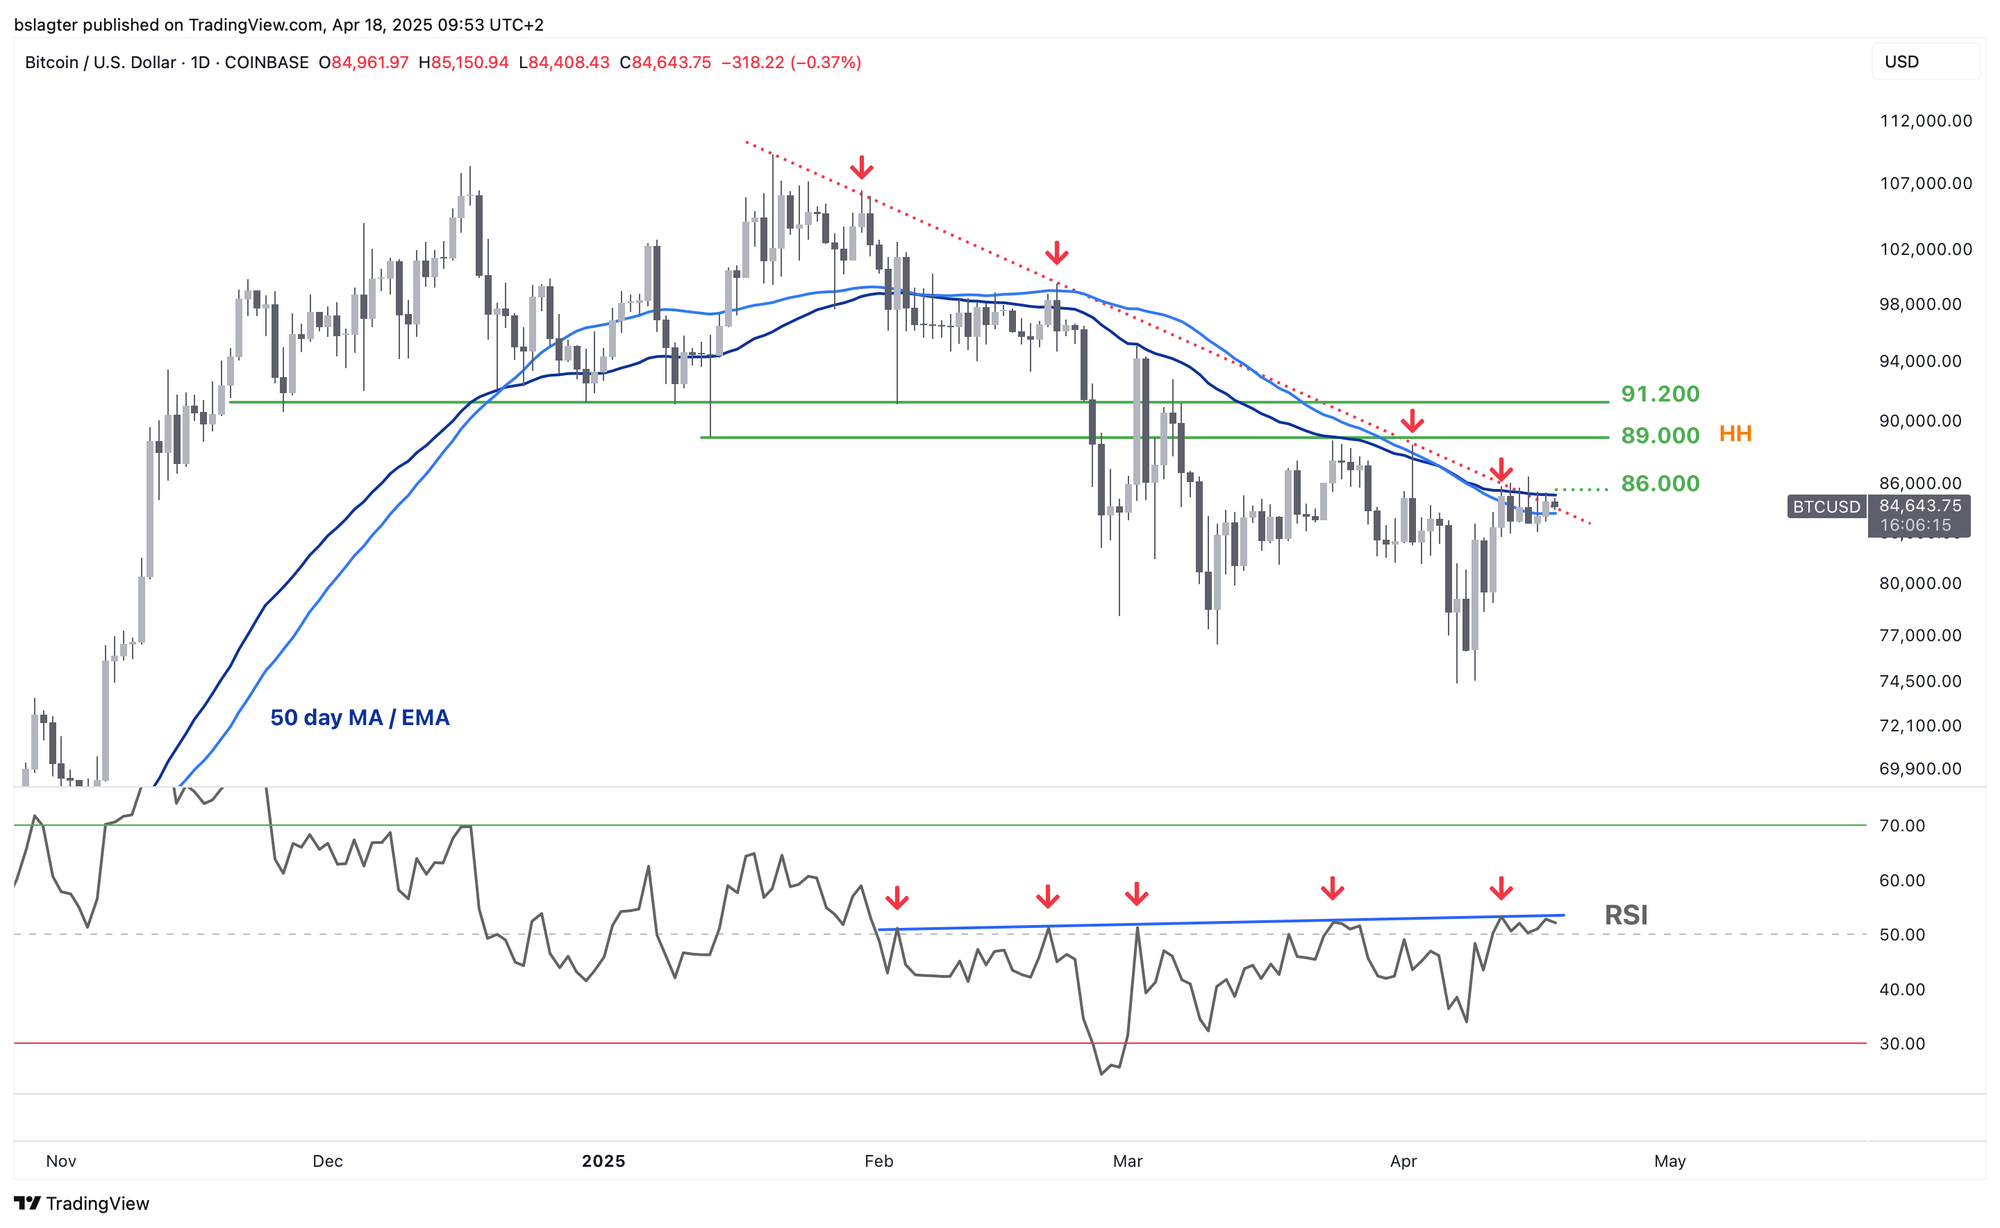
Throughout the week, prices were pushed upward from below, countering the downtrend, yet no breakout has materialized. A reversal of the trend could unfold in three steps:
- Above $86,000: Reaching this level would put us above the 50‑day averages as well as the downtrend line. It’s an early indicator, though not particularly reliable.
- Above $89,000: This would surpass the March 24 peak, marking the first higher high after a series of lower highs.
- Above $92,000: Achieving this level would return us to the price range observed from November to February, indicating that the decline following the double top is over.
If we stall at the first step, we will likely search for the next bottom within the downtrend. A positive sign would be if that bottom holds well above $76,000, marking the first higher low after a series of lower lows.
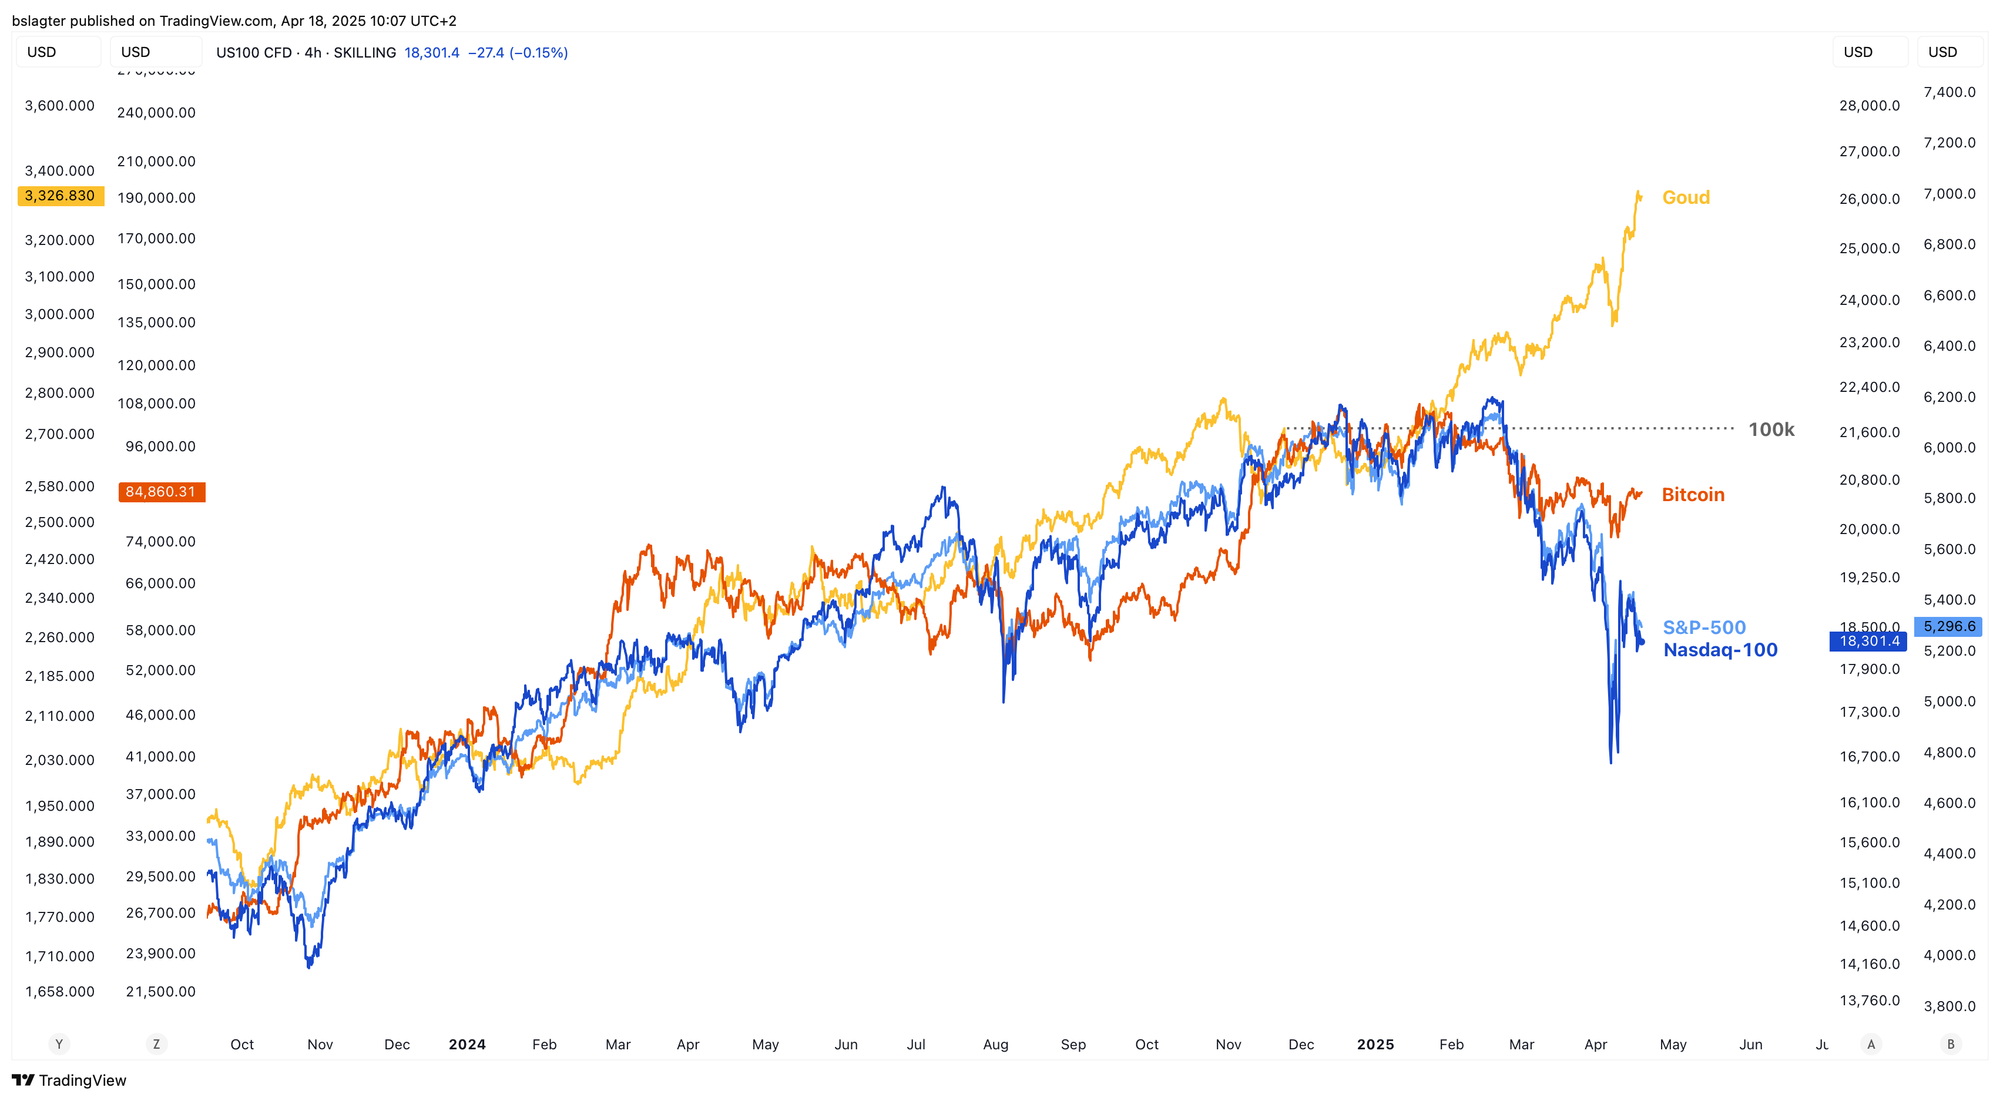
For investors, Bitcoin has a dual role. On one hand, as digital gold and the sole form of digital outside money, it serves as a safe haven during geopolitical turmoil. On the other, as an emerging technology, it acts as the portfolio’s “hot sauce.”
If Bitcoin were to fully embrace its digital gold traits, now would be a fitting time. More than ever, the focus is on the decoupling of tech stocks and Bitcoin’s role as a strategic reserve.
However, this isn’t yet reflected in the price. Last week, gold surged once again, climbing above $3,300 and further widening the gap between stocks and Bitcoin. For Bitcoin to bridge the gap between stocks and gold, its price would need to climb to around $100,000.
We will continue with the following topics for our Alpha Plus members:
- Sentiment or data: Who is right?
- Donald Trump wants to isolate China
- Altcoins lag behind
- On‑chain: Investors more optimistic