
Bitcoin's Relative Strength Feels 'Very Grassroots'
ETFs and Strategy are selling bitcoin, yet we see relative strength. It all feels "very grassroots," says analyst Charles Edwards. This new character fits other early signals of a potential bottom forming.

In financial markets, we often look at the closing price. The last price of the day, week, or month at which something was traded. That may seem arbitrary, especially in a market that's open 24/7, like the crypto market. Yet it serves a purpose there too: it separates noise from signal.
Not all price movements are meaningful. Shocks, rumors, and herd behavior can temporarily push a price away from the underlying trend. By focusing on closing prices, you reduce the chance that temporary spikes distort your view of the trend.
Daily close, weekly close, monthly close: the larger the timeframe, the more likely you're looking at pure signal. That's why we always pay special attention to the monthly close.
Let's take a look at June. Bitcoin closed the month at $58,500, down 20% from the end of May. This marked the lowest monthly close of this bear market — by a significant margin. The previous low belonged to February, at $67,000.
June's monthly close sits in a zone where many significant closing prices cluster: the 2021 highs and the extended consolidation in 2024 following the launch of the U.S. spot bitcoin ETFs. In the chart below, we've highlighted that area in blue.
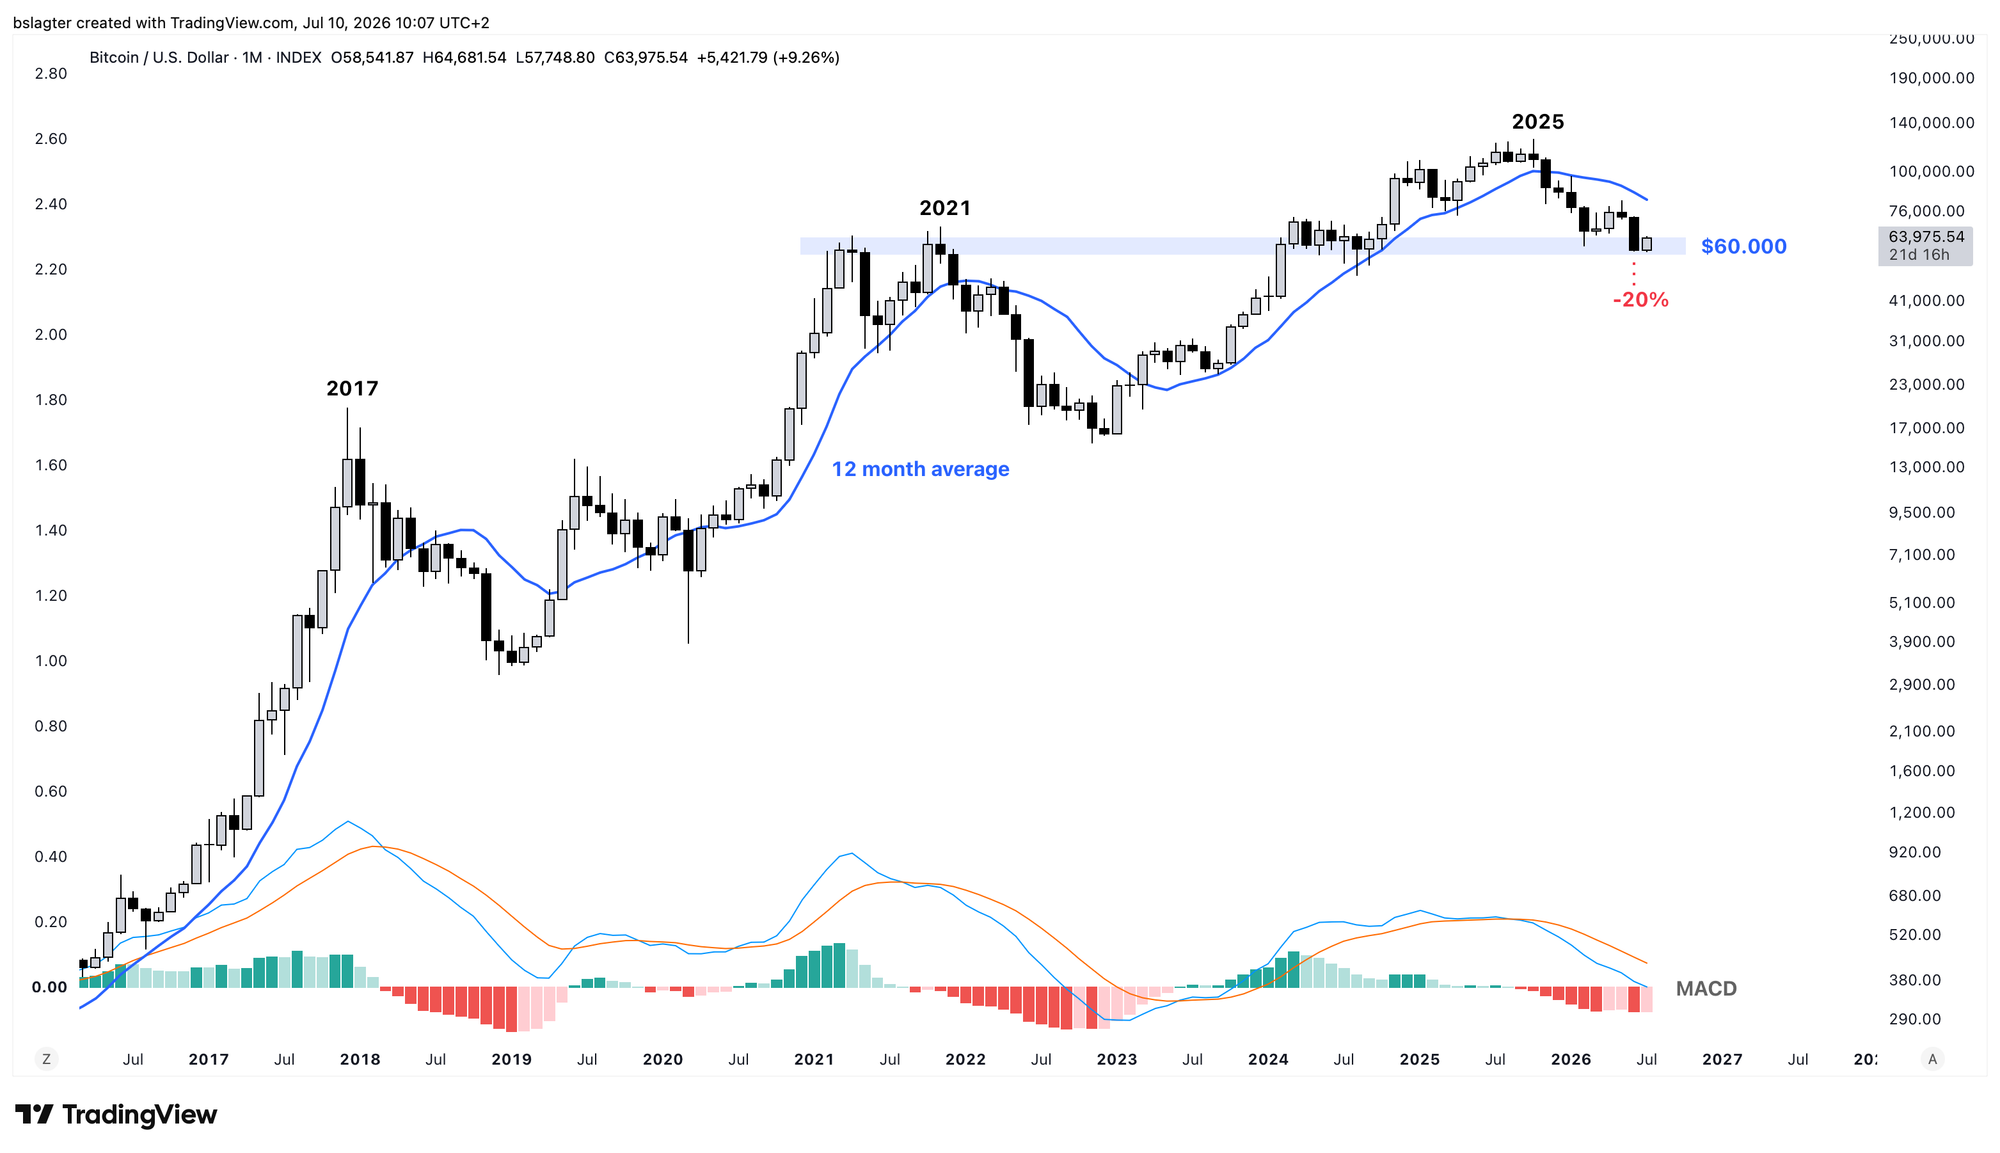
For the coming bull market, it would be excellent if this zone provides support. Resistance in 2021, support in 2024, and support again in 2026.
It's not a disaster if price dips below it intra-month. In August 2024, we saw a nasty wick down to $49,000 when the yen carry trade came under pressure. But ideally, the monthly close would land back within the blue band.
The market would thereby signal that $60,000 is a fair valuation. A price at which all the froth has been squeezed out of the bubble. That investors with conviction and a long-term vision are happy to buy at this level.
That would be the signal if we find support here at the monthly close level. It will take a few months to see whether that actually plays out.
In last week's Markets edition, we discussed the progress of the bear market:
A bottom at $57,700 in July 2026 would be credible in terms of both time and price for a market cycle bottom.
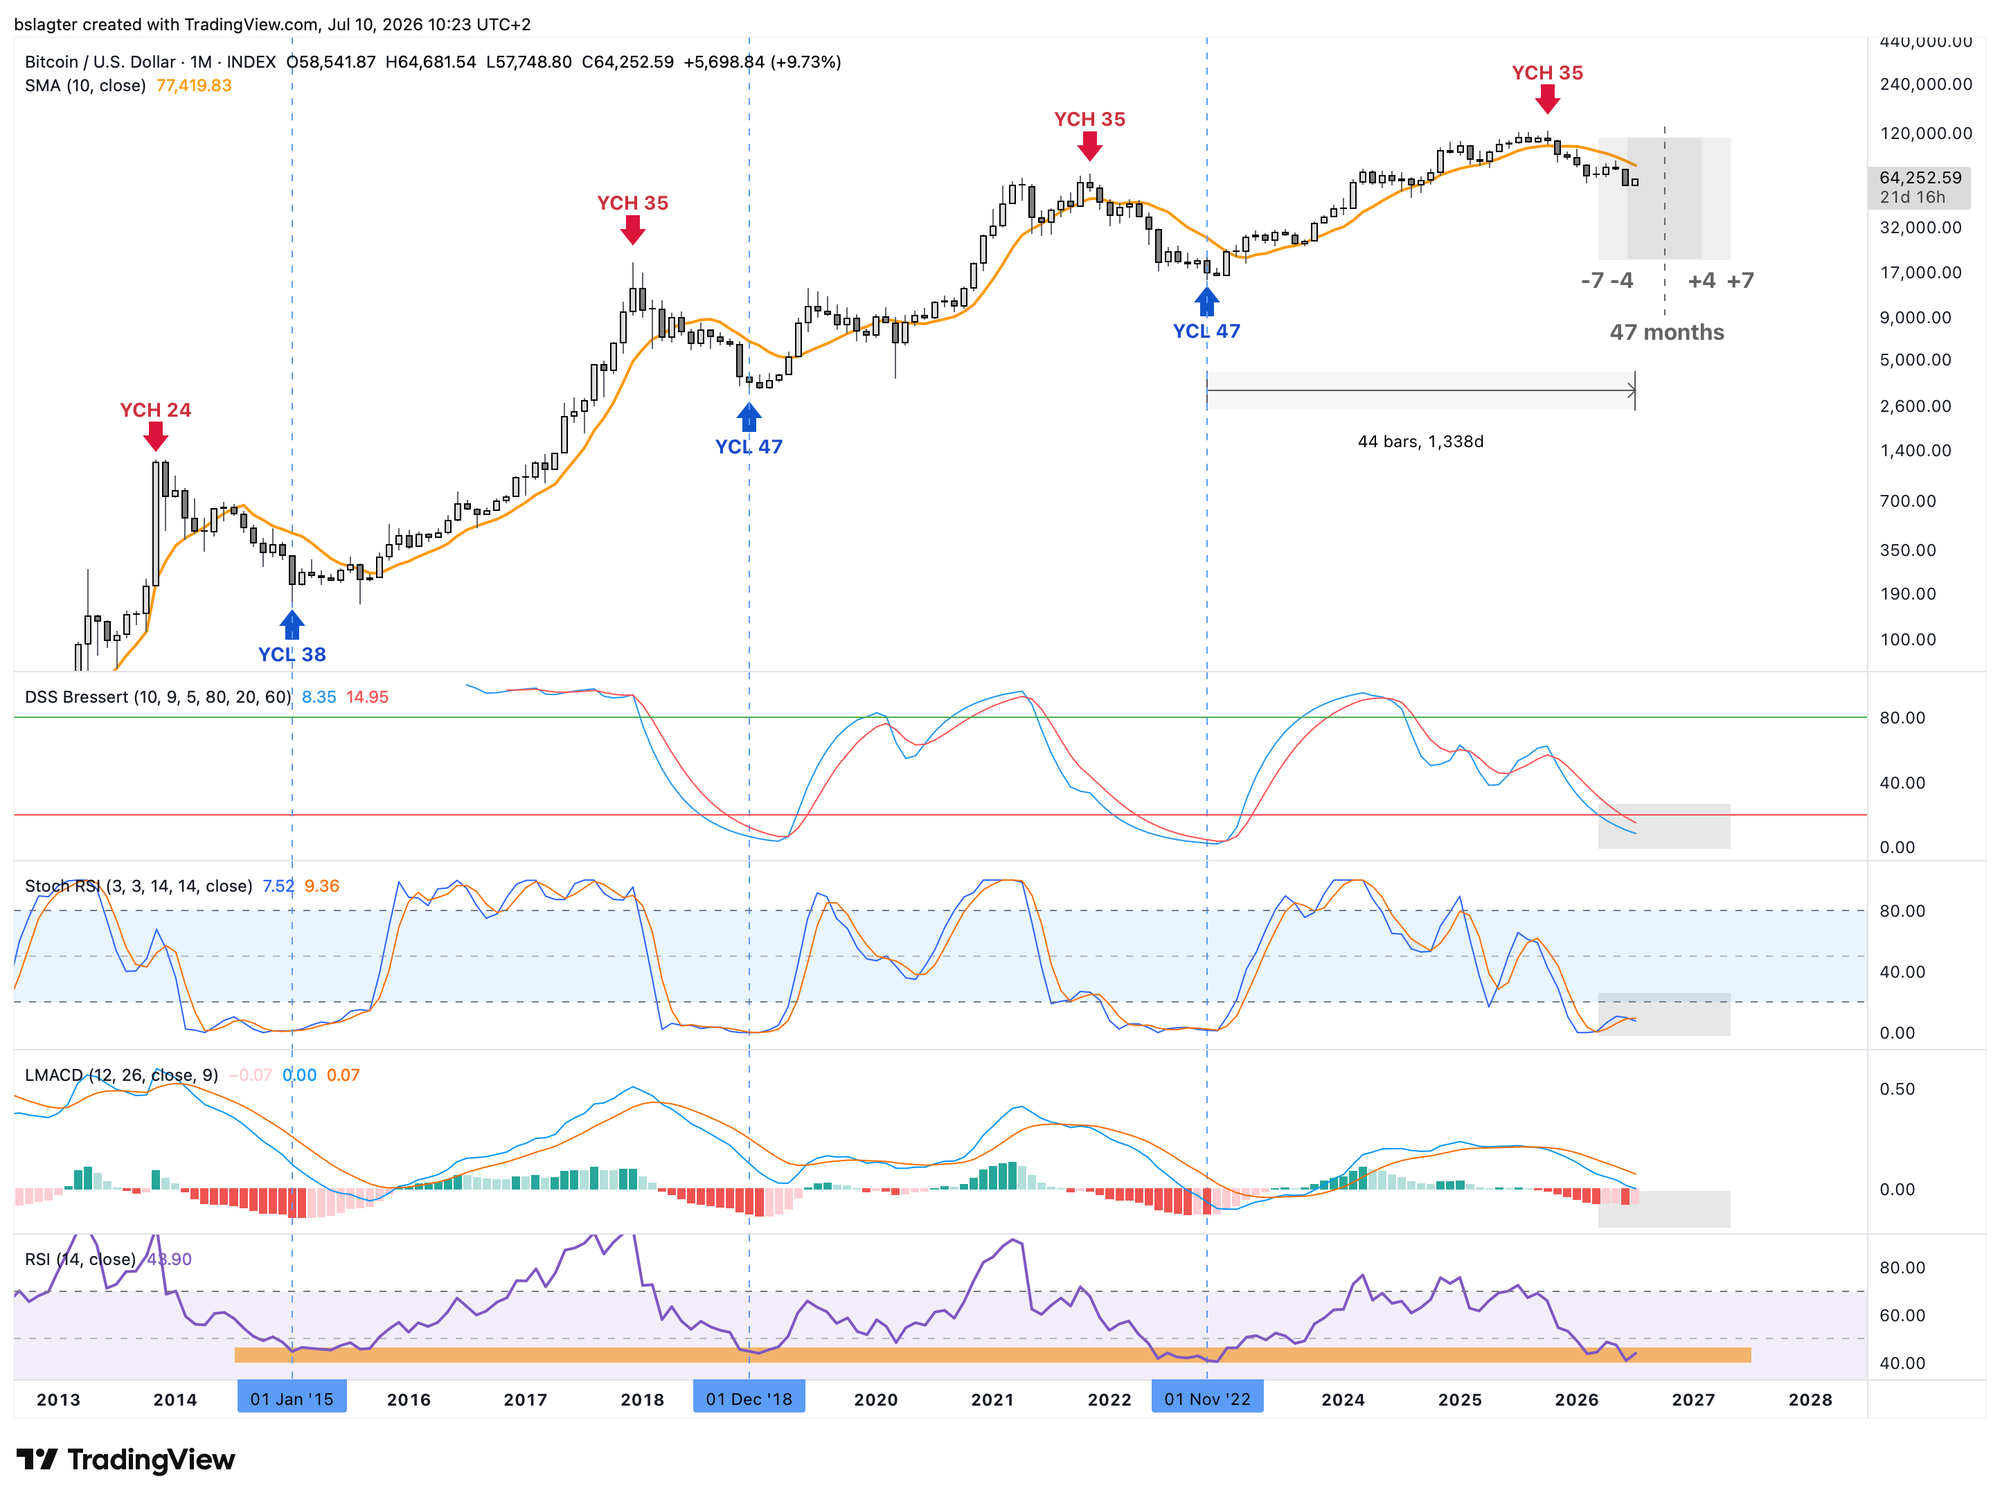
We can see that in the monthly chart below as well. It shows the yearly cycle — also known as the market cycle or four-year cycle. Over the past two rotations, it had a length of 47 months, and according to the mythology of the four-year cycle, this time should be no different.
There is no fundamental reason for a yearly cycle of exactly 47 months with a top in month 35. It could happen again, but the best explanation would then be that we're looking at a self-fulfilling prophecy.
In cycle analysis, we often use a spread of 10% around the average cycle length as probable, and 15% as plausible. With a length of 47 months, that points to a window from June 2026 through February 2027 as the logical period for the bottom.
Momentum indicators and oscillators can provide supporting evidence. The chart below shows four of them. All have arrived in the zone where you'd expect the bottom to form.
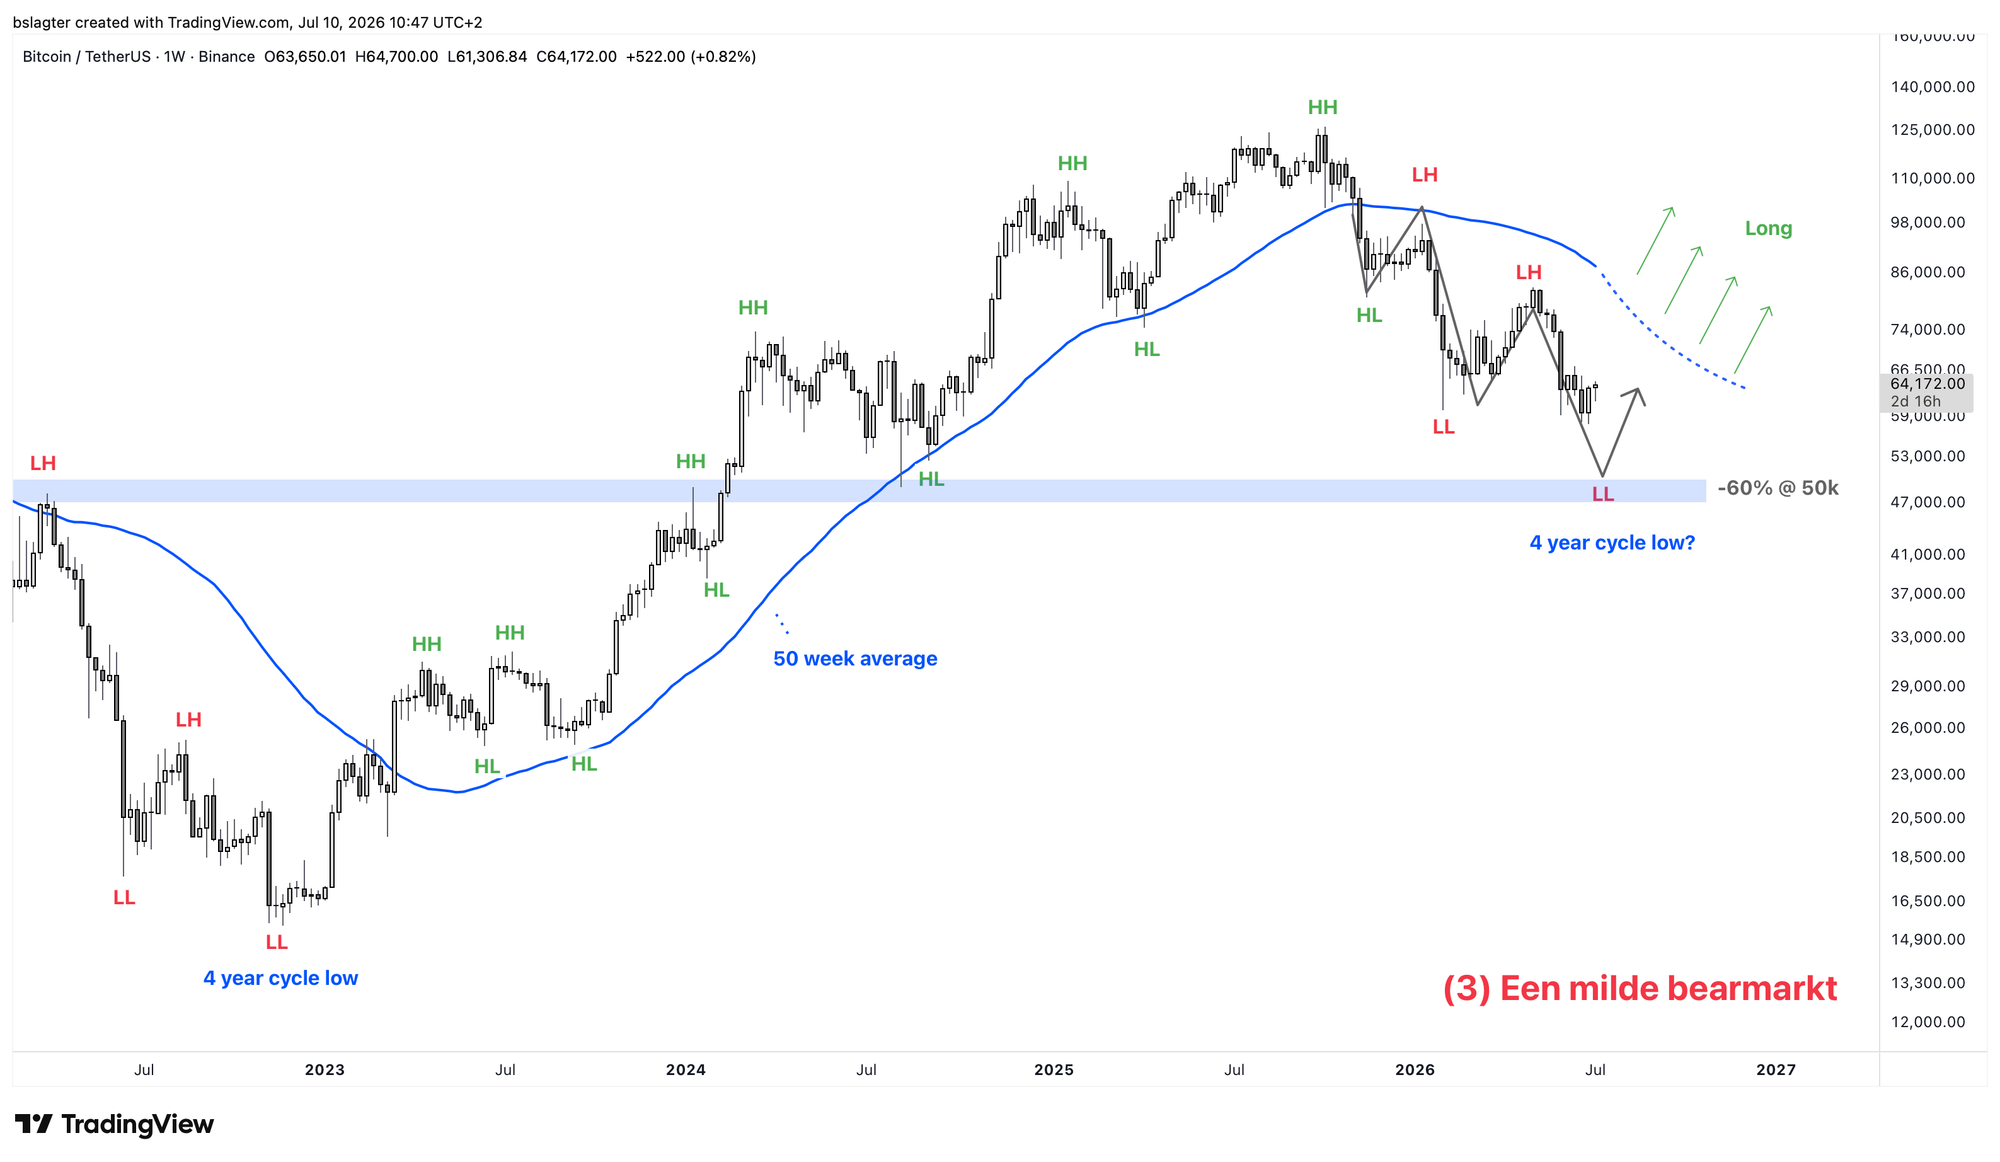
With that in mind, it's interesting that over the past few weeks we've seen the first serious early signs in this bear market of a potential shift from a downtrend on the weekly chart to a new uptrend:
- Positive divergences on the weekly chart, such as with the RSI and the fear & greed index. We discussed that last week in Markets.
- Signs of accumulation by long-term holders. We covered that on Monday in the News.
We're seeing a different character. Strength in bitcoin while AI stocks show weakness. Strength in bitcoin on the day Strategy announces its largest bitcoin sale ever. Serious defense of the $60,000 zone: $60k, $59k, $58k, $57.7k — but no free fall.
Charles Edwards said on X that it felt "very grassroots" to him. Wall Street isn't buying bitcoin, given weeks of outflows from crypto funds. Strategy isn't buying bitcoin — in fact, they're selling. And yet there's strength. That must be coming from the ground up, he suggests, from hodlers and individual long-term investors.
Up on Saylor selling. Up on AI trade falling. [..] Very grassroots and a lot more work needs to be done, but this is how you want to see price respond to such events.
But "a lot more work needs to be done," Edwards rightly adds. Let's pull up our checklist once more:
⏹️ A higher low (HL) above the $57,700 of July 1
⏹️ A higher high (HH) above the $83,000 of May 6
⏹️ A weekly close above the 50-week moving average at $87,500
⏹️ A directional change of that average from falling to rising
Still zero checkmarks. The trend is down; we're in a bear market. There's no hard evidence yet of a new uptrend — a bull market. But the fact that more and more positive early signals are emerging gives reason for hope!
Let's move on to the following topics:
- Daily & weekly cycle update
- Alt season vibes with Micron and Sandisk
- While AI shines, gold and bitcoin are (unfairly?) forgotten
- Bitcoin holds its ground as Warsh challenges the markets
1️⃣ Daily & weekly cycle update
 Contribution by
 Bert
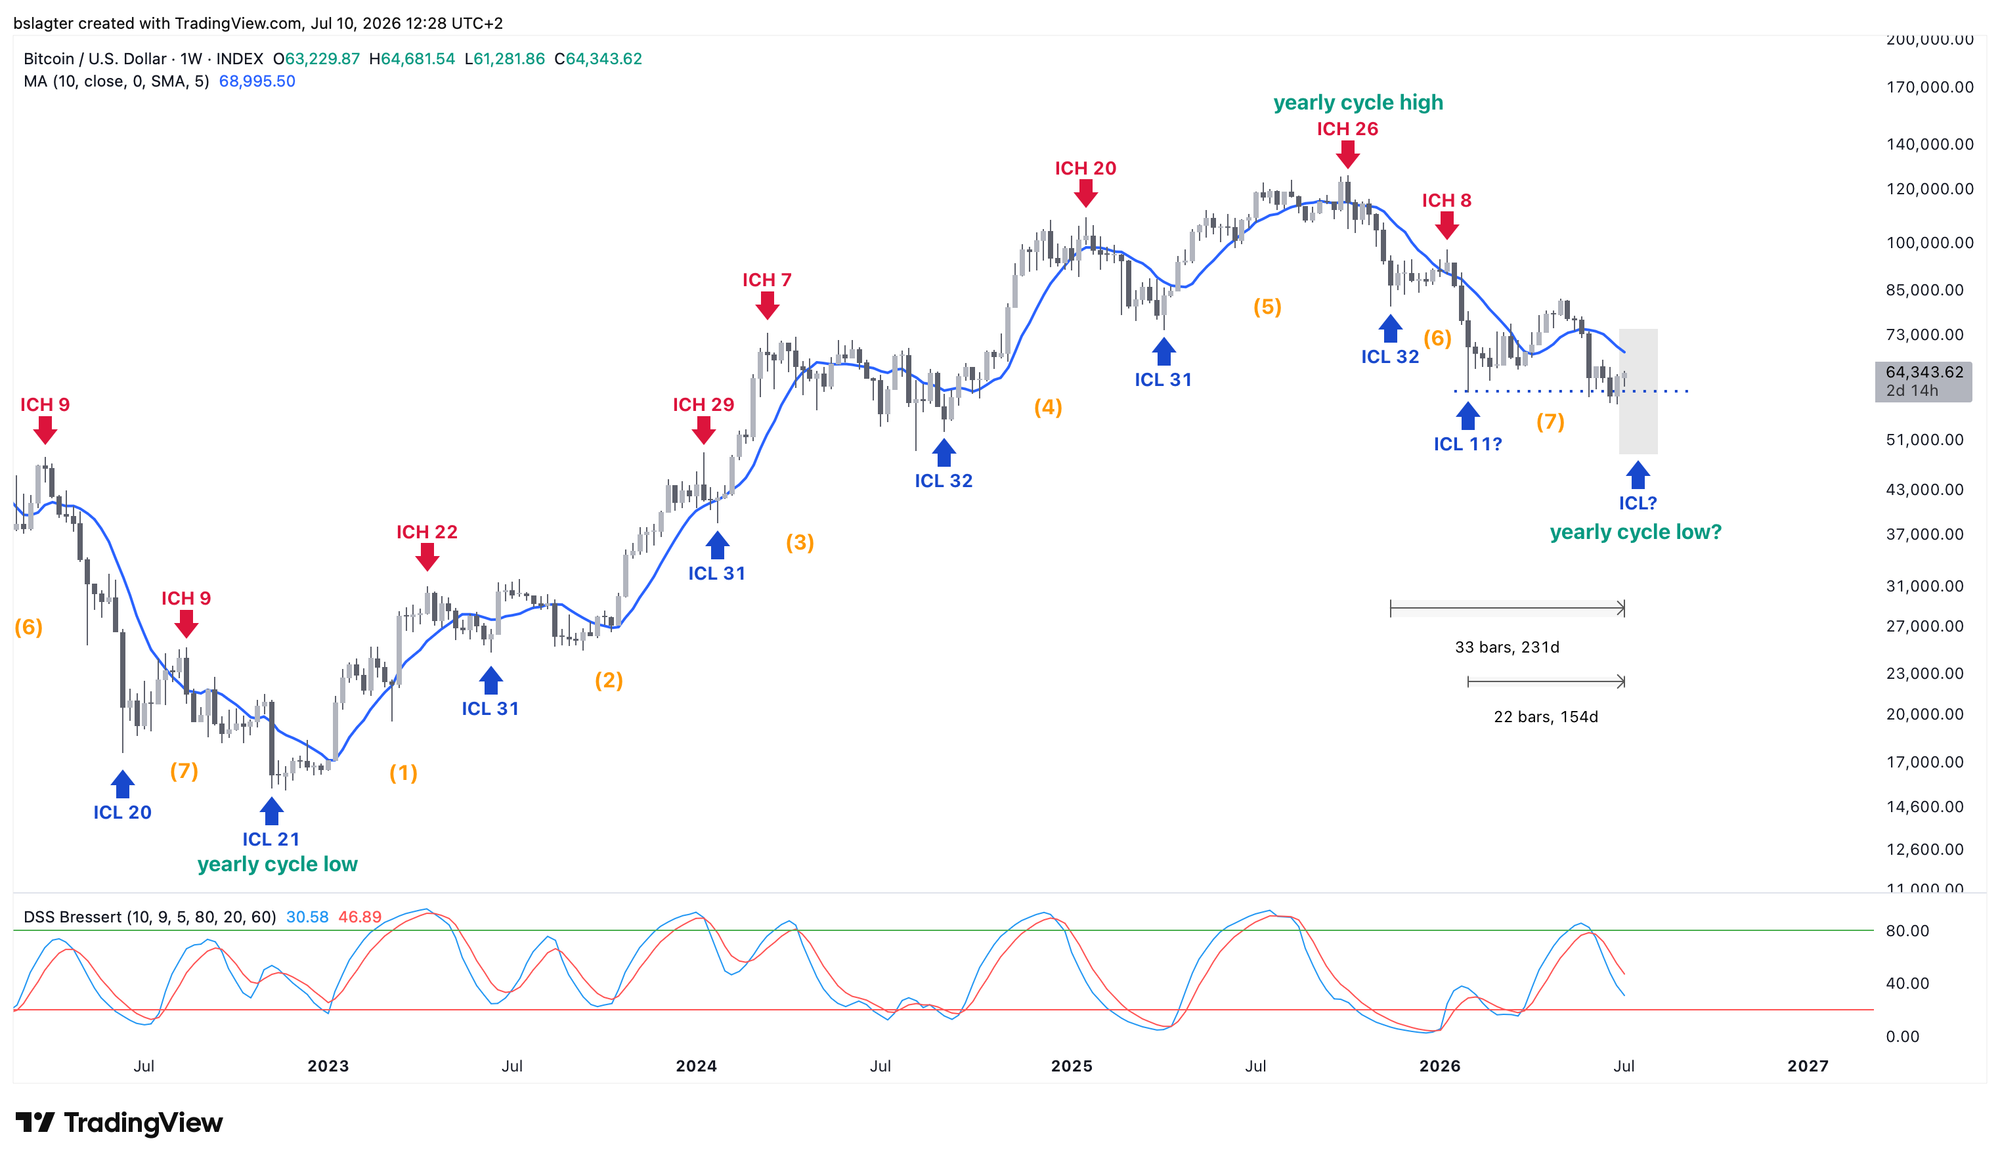
We're on day 35 of the current daily cycle. On average, it lasts 60 days, but since the previous one ran a bit longer, it wouldn't be unusual for this one to be somewhat shorter. The cycle has already "failed," meaning price has already traded below the starting price. It therefore stands to reason that the end of this daily cycle will be somewhat lower still.
If we take 60 days as the length, the next daily cycle low (DCL) would fall in early August.
If price takes a significant step down at that point, the upcoming DCL could also serve as the weekly cycle low (ICL) and yearly cycle low (YCL). In other words: the bear market bottom.
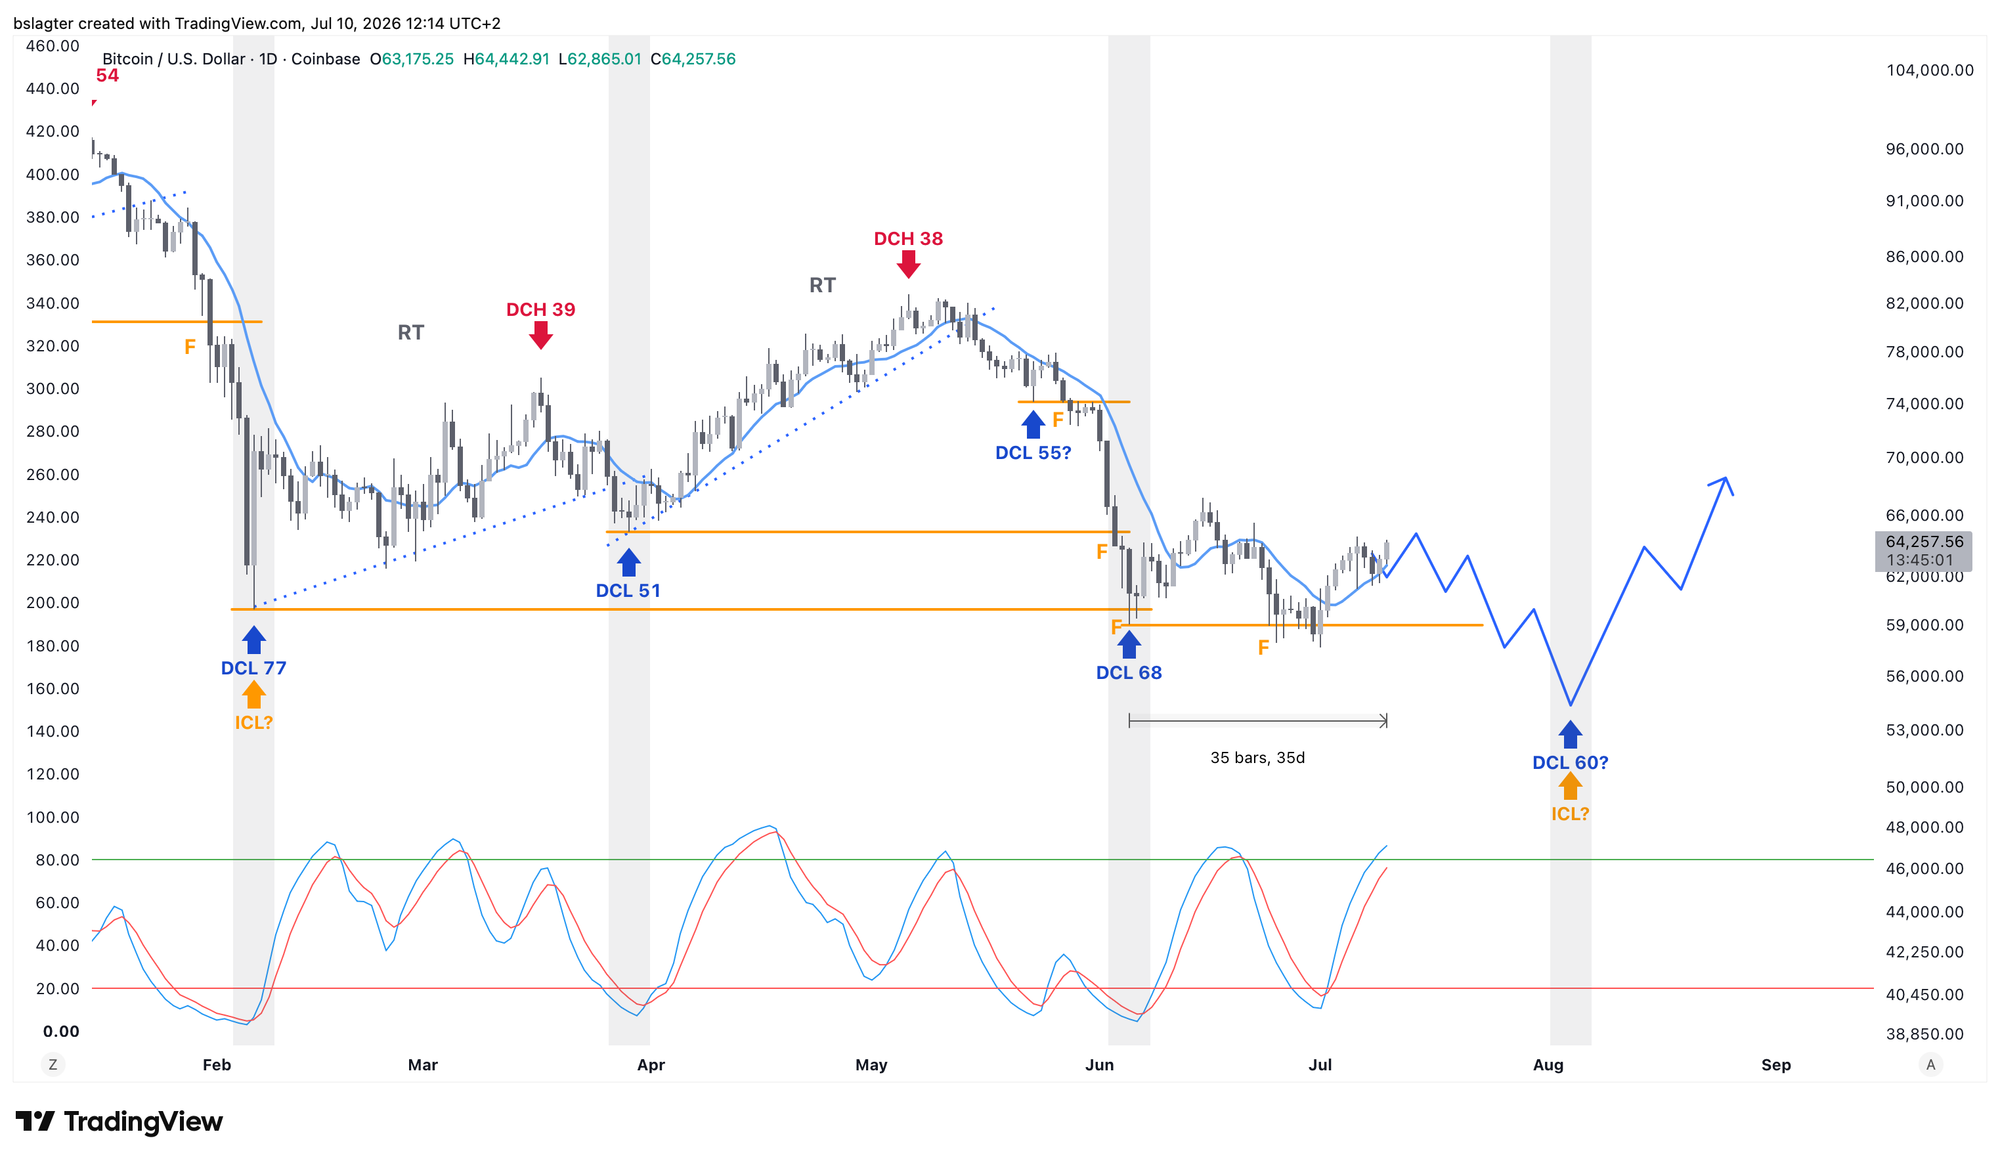
For the weekly cycle, two interpretations remain possible, with the key question being whether February 6 was a weekly cycle low (ICL) or not:
- It was an ICL on February 6: we're now in week 22 of the average 32, which would be fairly early for the next ICL.
- It was not an ICL on February 6: we're now in week 33 of the average 32, which is fairly late for the next ICL.
At this point, it doesn't matter much anymore. If the upcoming DCL does indeed double as the ICL, then in both interpretations it falls within the time window where bottoms commonly occur. Week 24/25 is a bit early and week 35/36 a bit late, but both are possible.
2️⃣ Alt season vibes with Micron and Sandisk
 Contribution by
 Sam
It hasn't escaped most investors that in recent months, a great deal of attention (and capital) has flowed toward the share prices of memory chip manufacturers. Driven by rapid developments in AI and the massive investments that come with them, the stock prices of companies like Sandisk and Micron have exploded.
Micron supplies chips to major customers such as NVIDIA, Amazon, and Google. Without Micron, AI data centers would lose a significant portion of their performance.
Sandisk focuses almost entirely on flash memory (NAND) and the storage products built on it. Demand for fast storage in data centers has been growing rapidly, and Sandisk serves that demand.
Both companies are therefore benefiting from the enormous investments in AI and data centers. This has led Sandisk's stock to rise roughly 865% peak-to-peak this year, while Micron has gained approximately 325%.
These kinds of eye-watering gains over a relatively short period bring back memories for crypto investors — alt season in late 2017, or 2021 when DeFi delivered similar returns.
A direct comparison obviously doesn't hold, since these companies generate actual products and profits. However, in both cases we're looking at a parabolic price rise, and those very often end with a sharp correction.
Micron's and Sandisk's current prices also bake in future expectations, and there may come a point when reality turns out to be less rosy than what investors have priced in.
Over the past few weeks, Micron and Sandisk have both fallen roughly 30%-40% from their highs. Is that an indication that we've seen the top? Let's examine both.
First, Micron. Since April, the daily chart shows higher highs and higher lows, and this uptrend remains intact as long as there's no daily close below roughly $850. Additionally, the EMAs on higher timeframes are still pointing upward, and price remains above them.
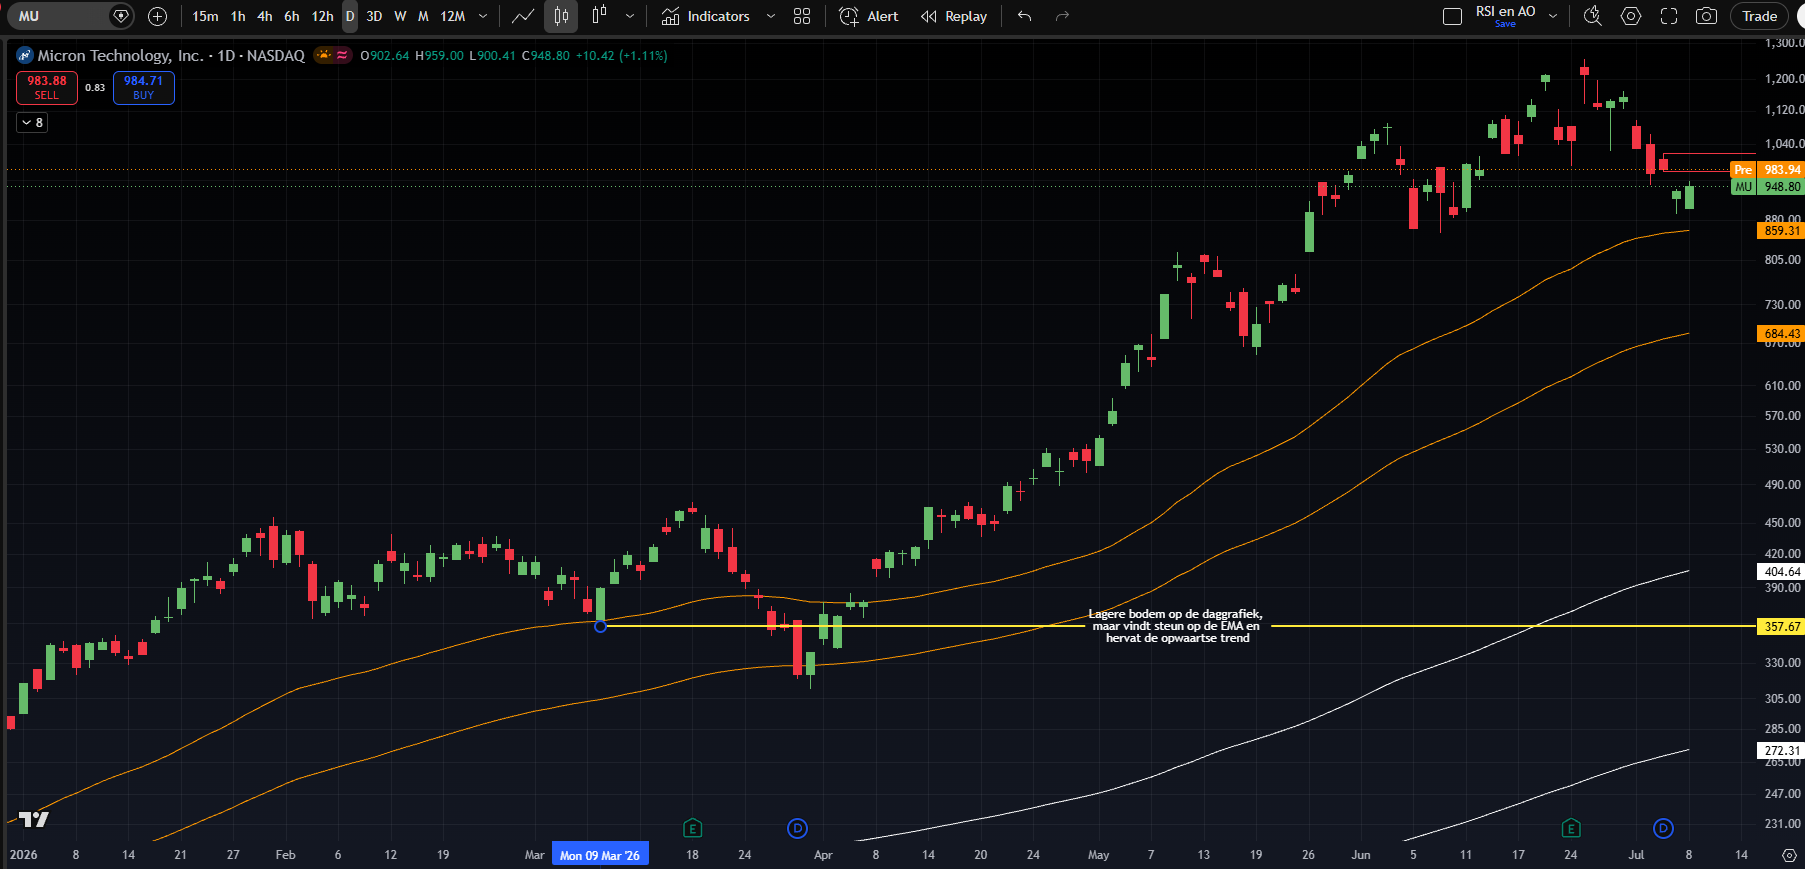
Based on this, the base case is that the uptrend continues for now. A change to this base case could come if a lower high is set over the coming days/weeks, followed by a string of strong red candles dropping below the orange EMAs and the $850 level.
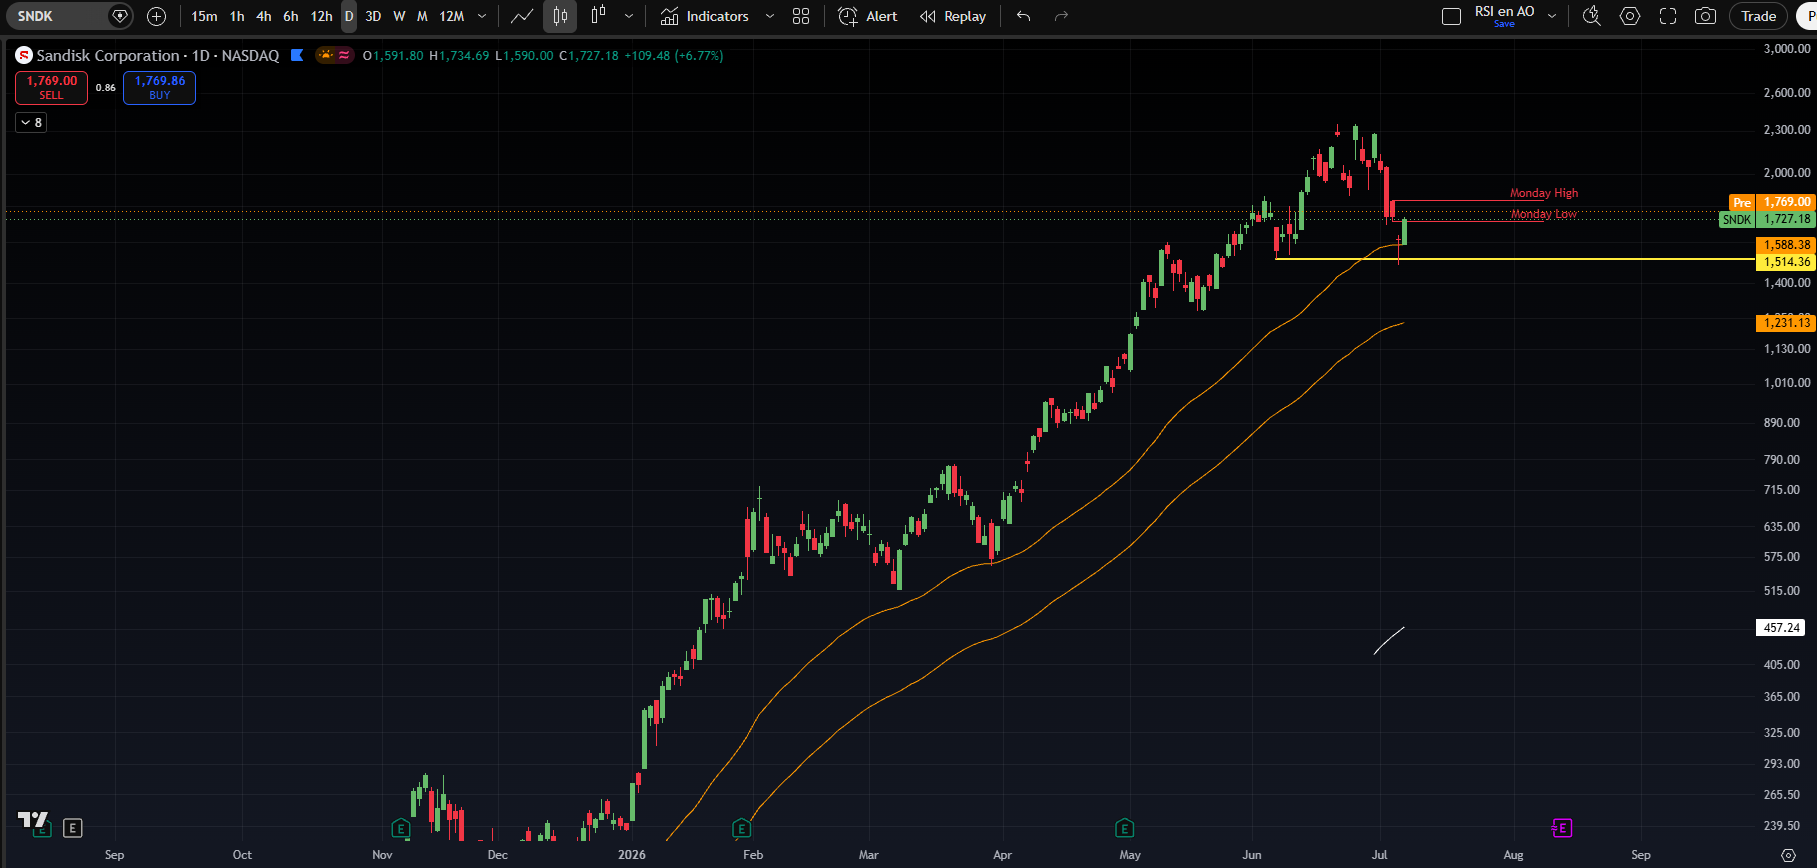
Looking at Sandisk, we see many similarities with Micron. Sandisk is also trading above its EMAs, and the bullish market structure on the daily chart remains intact.
A daily close below $1,514 would constitute a lower low. Price has already traded below that level, but it closed above it. If a few days or weeks pass, the orange EMAs may by then have moved to or above $1,514. In the case of a lower low below the orange EMAs, that would be a strong warning of a (local) top.
Although the corrections for both companies have been steep in recent weeks, the charts don't yet provide strong arguments that the top is in. The base case therefore remains a resumption of the uptrend. How long this trend can sustain itself after such dramatic gains is, of course, the million-dollar question.
3️⃣ While AI shines, gold and bitcoin are (unfairly?) forgotten
 Contribution by
 Thom
Gold has traditionally served as a hedge against inflation and, more broadly, against the growth of the global money supply. For me, gold is primarily interesting because it represents a form of scarcity that is relatively independent of politics and shifts in economic power. For gold, it matters relatively little where in the world the center of economic gravity lies. For stocks of companies like Apple and Nvidia, that's obviously a different story.
Since its peak of nearly $5,600 per ounce in January, the gold price has corrected sharply. That decline followed a period of intense speculation and euphoria around precious metals. The euphoria went so far that gold overshot itself — the price rose significantly faster than the global money supply.
Then we saw exactly the opposite. Structural gold investors likely started taking profits first, after which speculators panicked for the exits. The result is a gold price that now lags behind the growth of the global money supply.
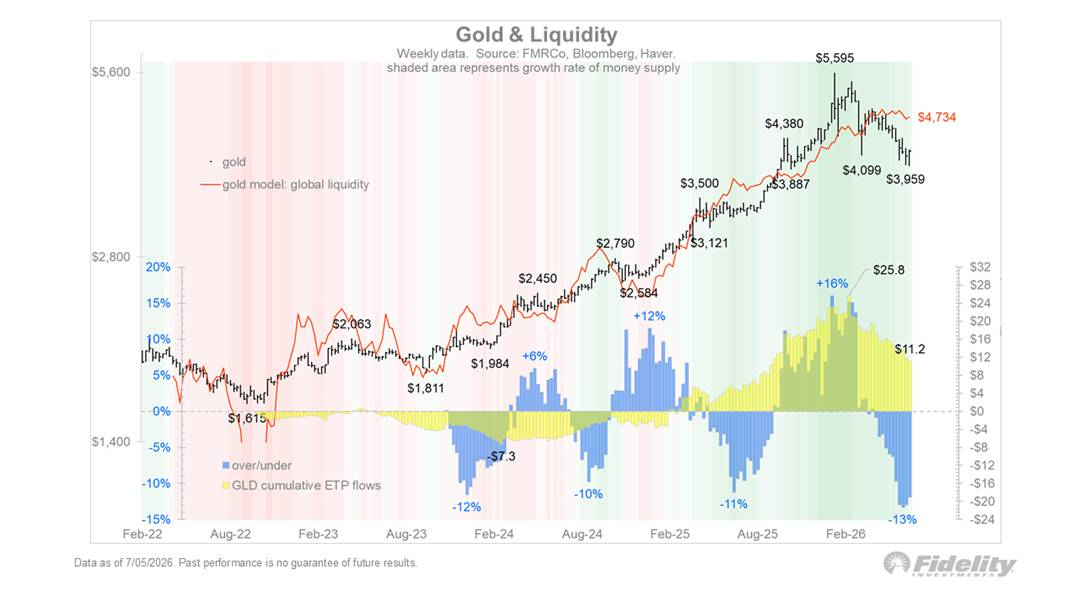
The speculative energy we saw in gold earlier now appears to have migrated into the AI complex, where valuations of some companies have stretched quite far. That's precisely why I find this an interesting period to cautiously start accumulating gold again. Not because gold has already made a convincing technical breakout, but because the relationship between price, sentiment, and fundamental role is starting to look attractive again.
Broadly speaking, the same applies to bitcoin. Bitcoin shares clear similarities with gold, but with one important difference. Gold has had an established place in the financial system for centuries, while bitcoin still needs to earn that position. It doesn't sit in central bank vaults, and institutional adoption has really only gained momentum since the launch of the U.S. Bitcoin ETFs in January 2024.
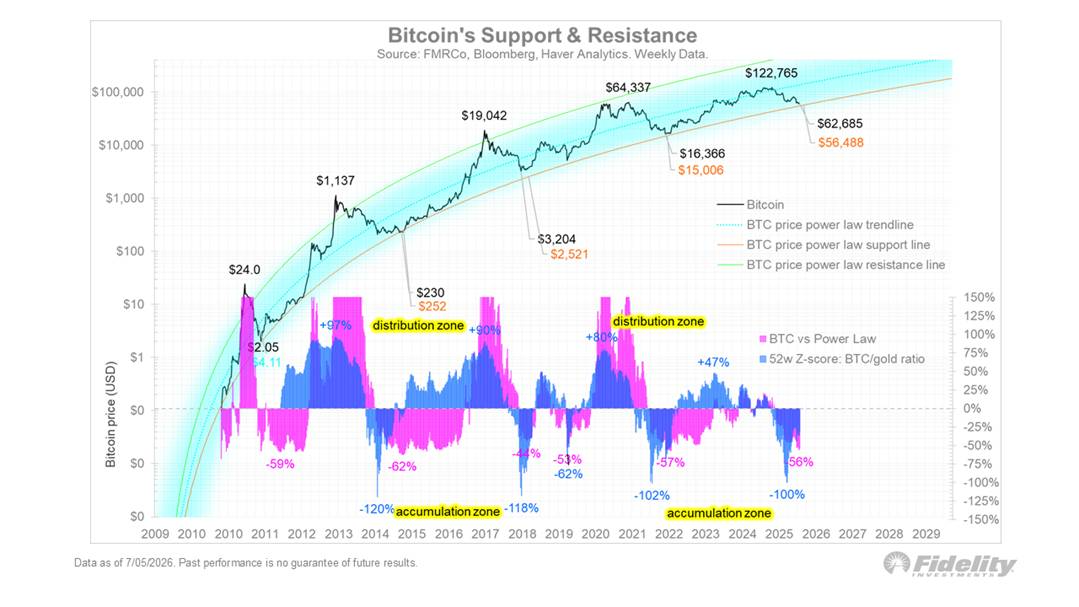
I therefore see bitcoin primarily as an investment in the option that it could eventually play a similar role to gold. Around a price of $60,000, that option starts to look interesting again in my view. There appears to be significant support around this level, while bullish divergences are visible across multiple timeframes. The Realized Price and the Power Law support line are also approaching.
4️⃣ Bitcoin holds its ground as Warsh challenges the markets
Contribution by Thom
This week initially seemed entirely dominated by the FOMC minutes. Investors were looking forward to the minutes from the first rate decision meeting under the leadership of Kevin Warsh, the new chairman of the Federal Reserve.
After the rate decision on June 17, which the market interpreted as hawkish, the number of expected rate hikes for 2026 and early 2027 rose further. In principle, that's unfavorable for bitcoin. The digital asset yields no interest, which means higher rates make savings accounts and government bonds more attractive.
Yet attention quickly shifted to another theme. From the start of the week, the renewed escalation of the conflict with Iran took center stage.
Donald Trump's communication remains difficult to parse at times. The facts, however, leave little room for doubt. As long as the United States and Iran continue to strike each other, there is no real de-escalation. A lasting peace appears far off for now.
So far, the latest round of attacks has led to only a modest rise in oil prices. That could change quickly if the conflict escalates further or supply from the Middle East comes under pressure again.
A sustained rise in oil prices would push inflation expectations higher once more. That in turn increases the likelihood that the Federal Reserve feels compelled to raise rates further.
That exact risk was front and center in the minutes published this week. They revealed that inflation is currently the Fed's primary concern. The flare-up of the Middle East conflict will likely have only reinforced that focus.
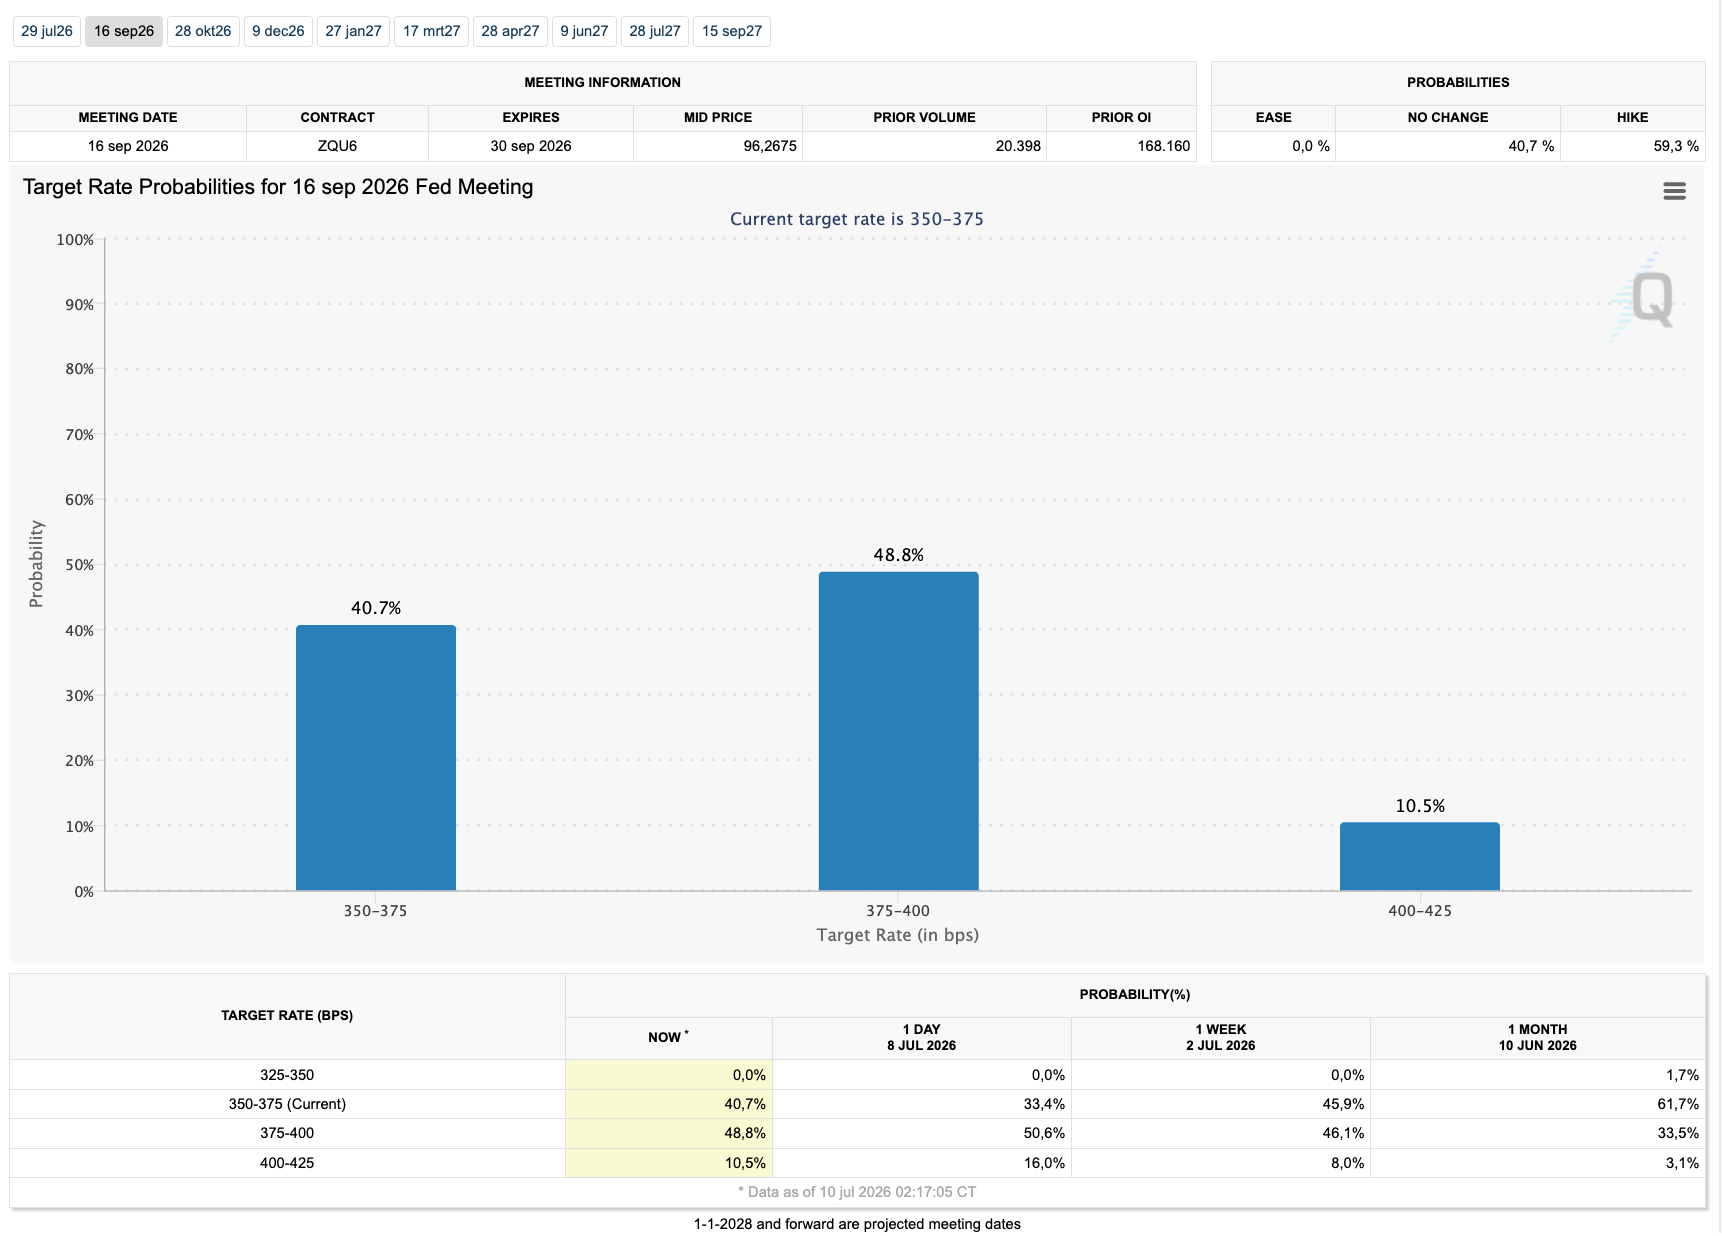
We saw that reflected in rate expectations as well. For September, the market now sees a greater than 50 percent chance of a Fed rate hike.
However, I would be surprised if the Fed actually opts for rate hikes in response to a new surge in oil prices. After all, it's a supply shock. Higher rates won't produce more oil, but they do risk dampening demand and unnecessarily damaging other parts of the economy.
On paper, the combination of higher oil prices, rising inflation expectations, a stronger dollar, and potential rate hikes is unfavorable for bitcoin. Nevertheless, the price is holding up remarkably well for now. The market seems to be reacting less and less violently to Trump's unpredictable communication.
At the same time, some analysts view this week's minutes as confirmation that Kevin Warsh genuinely intends to chart a new course. No more promises, no extensive forward guidance on future rate policy, and no automatic safety net for Wall Street when markets come under pressure.
Based on what we've seen so far, I think it's too early to conclude that we're dealing with a fundamentally different Fed. It's relatively easy to come across as strict and resolute while Wall Street is trading near record highs. That becomes a different story when the stock market corrects 20 to 30 percent.
Especially when political pressure intensifies in such a scenario and economic growth has become heavily dependent on the AI complex. That's why I'd be surprised if inflation truly remains the top priority under all circumstances and the market is left entirely to its own devices.
In closing
All previous editions of Alpha Markets can be found in the archive. Questions, comments, and suggestions are always welcome in the community.
Thank you for reading!
To stay informed about the latest market developments and insights, follow our team members on X:
- Bart Mol (@Bart_Mol)
- Peter Slagter (@pesla)
- Bert Slagter (@bslagter)
- Mike Lelieveld (@mlelieveld)
We appreciate your continued support and look forward to bringing you more comprehensive analysis in our next edition.
Until then!