Bitcoin slips below $80K
Bitcoin tumbled 20% from $98K to $78K in just one week—the steepest drop since FTX's collapse. With U.S. spot traders driving the decline and no clear market narrative, is this a bear market warning or a healthy correction? Key levels and a critical handbrake now determine the next move.

“It seems we’ve already exhausted this price range,” we wrote two weeks ago. “Investors need significantly higher or lower prices to get moving again.”
That shift has now occurred. Over the past seven days, the price dropped 20% from $98,000 to $78,000. Some indicators suggest it’s the sharpest decline since FTX collapsed in November 2022.
The primary drivers behind these lower prices are U.S. spot market investors, including those involved in spot bitcoin ETFs. One sign of this is a notable discount on Coinbase, where prices are considerably lower than on major Asian exchanges.
There isn’t a single, clear reason for this decline. In our view, the Bybit hack isn’t a major factor. Instead, it’s a mix of a lack of a compelling narrative and challenging conditions, such as:
- On the macroeconomic front, we’ve been facing headwinds since the end of December, with higher inflation expectations, a stronger dollar, and rising 10‑year yields.
- Global liquidity has declined partly because of the more expensive dollar, and the crypto market is sensitive to that.
- Trump continues to create disruption and uncertainty. It appears investors no longer have as much confidence in his tendency to drive prices upward.
- In the natural rhythm of the bitcoin market, a weekly cycle low—a trough that tends to occur roughly every six months—is overdue.
Within the crypto world, there hasn’t been a clear narrative to guide the market—whether that’s the emergence of ETFs in 2023 or the end of Biden’s anti-crypto policies in 2024.
Trump’s narrative seems to have run its course. With this decline, the crypto market has undone all the gains made since the election results. This is also true for other investments that were expected to benefit from Trump’s policies, such as Tesla stock.
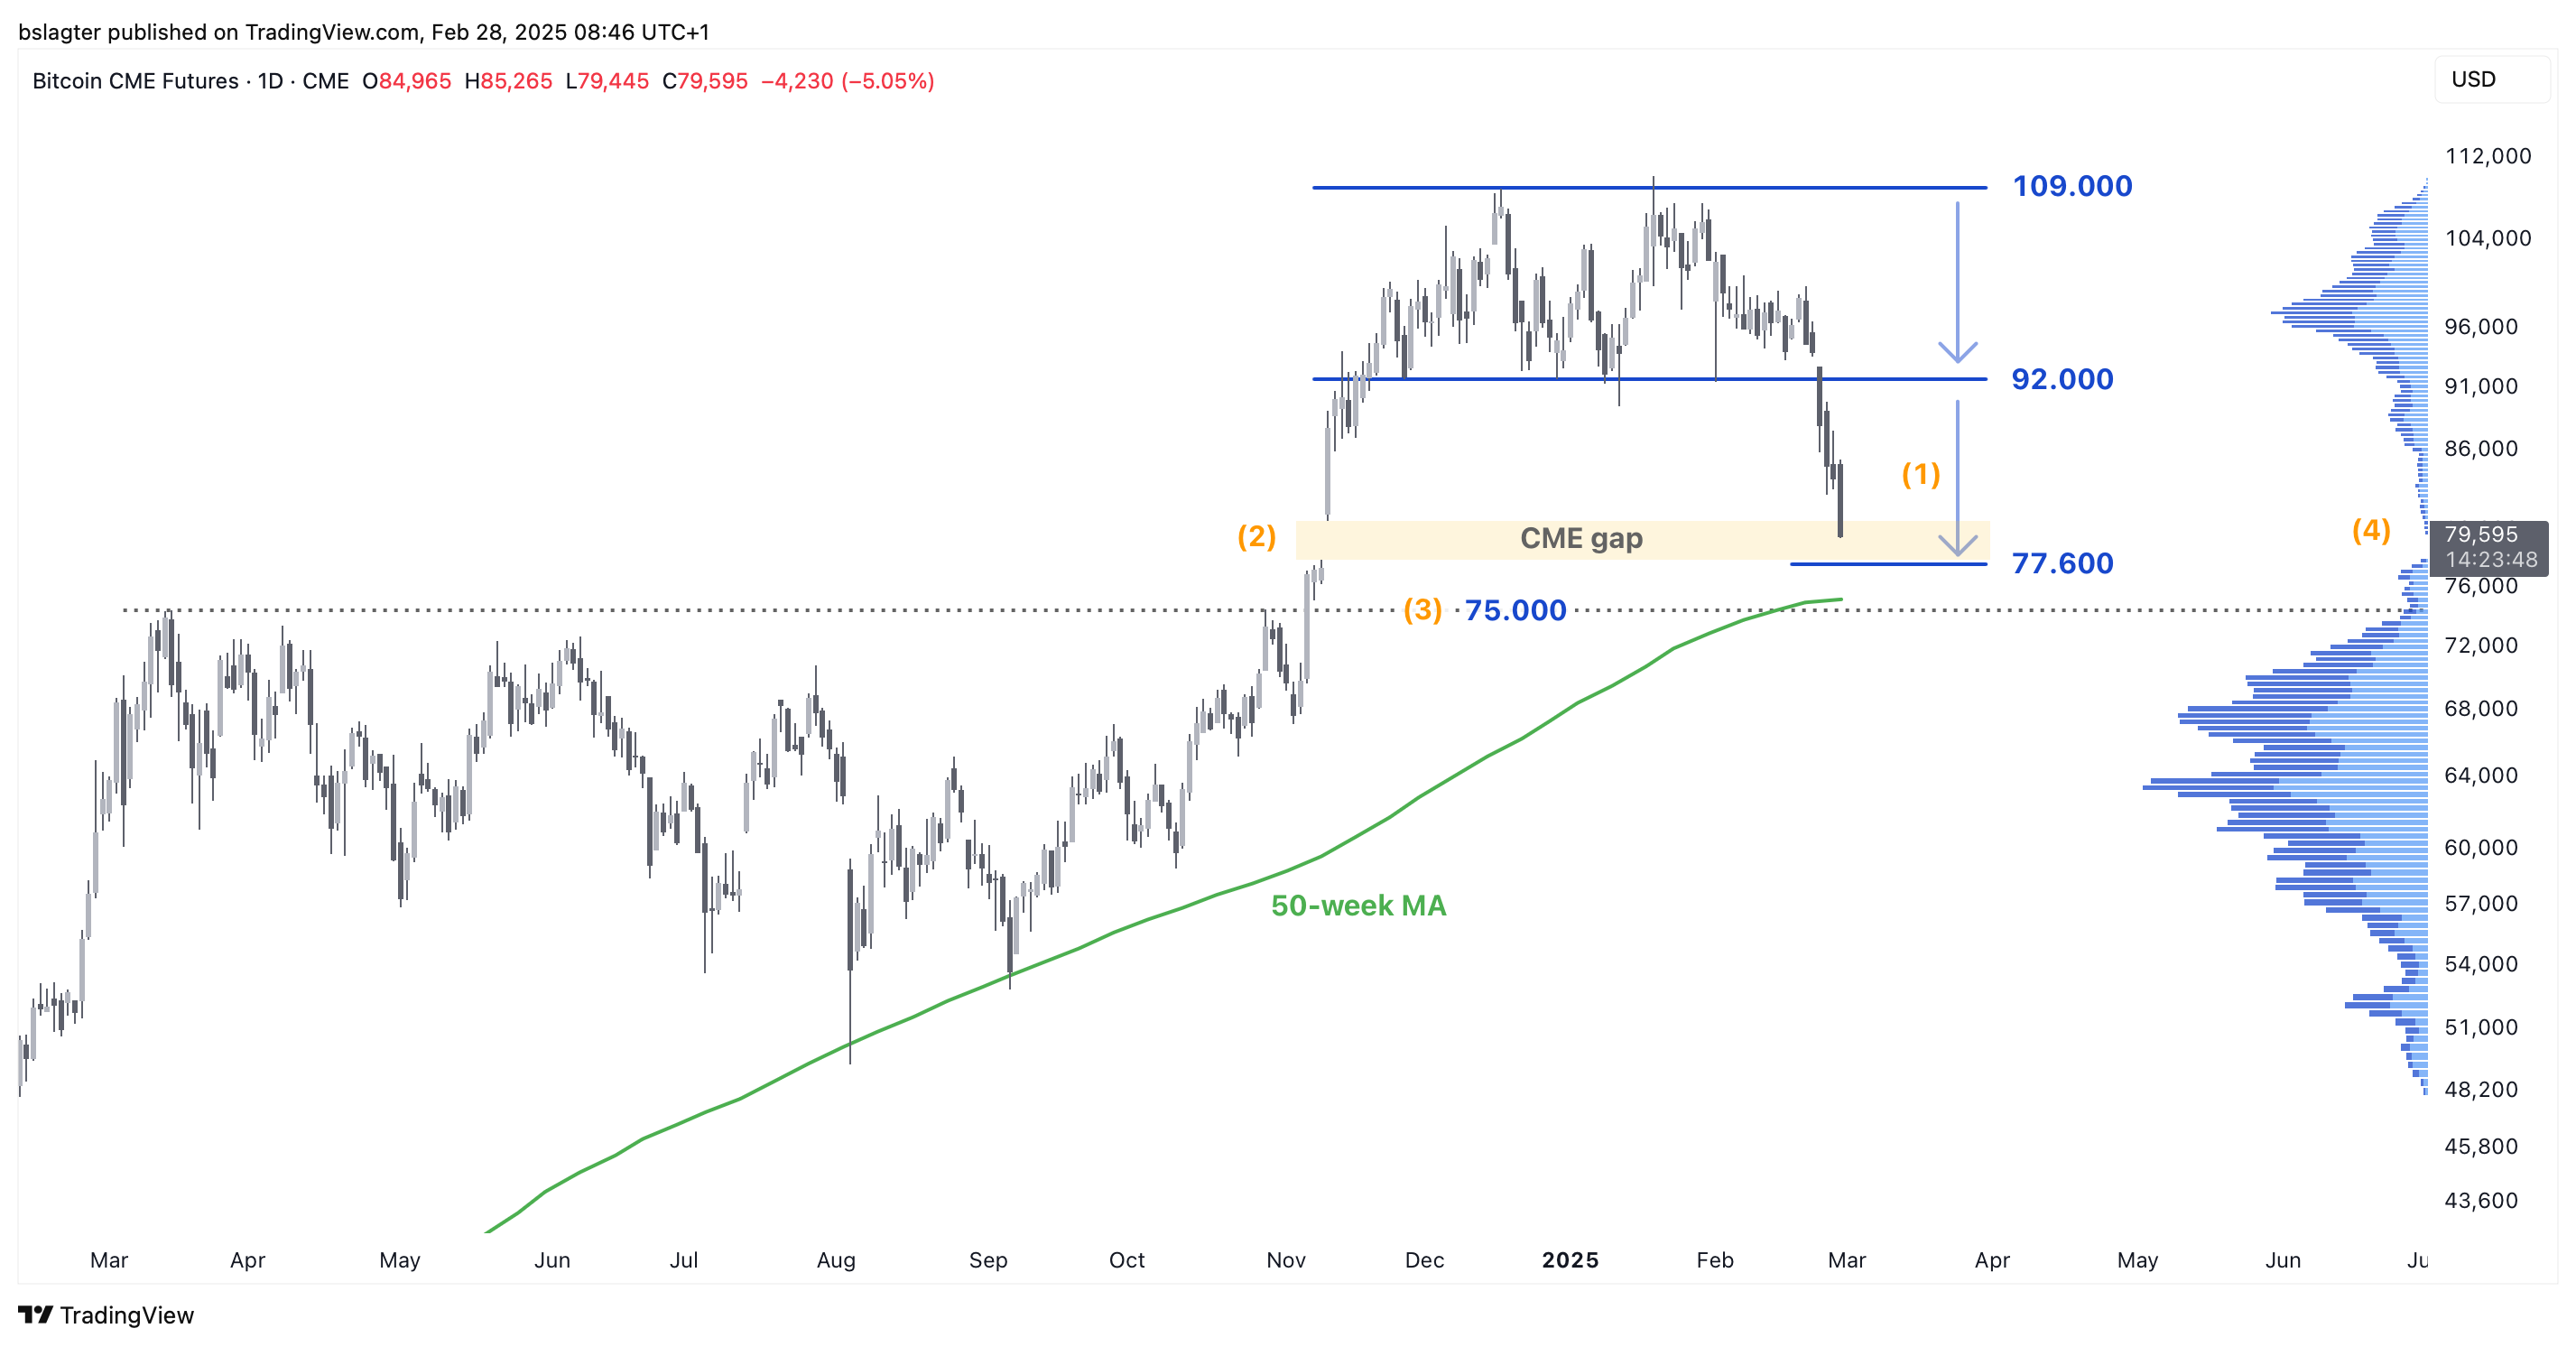
For three months, we traded between $92,000 and $106,000, with occasional brief excursions to the range’s extremes. Earlier this week, the price fell below $92,000 once again, but this time the recovery was not immediate.
As a result, we have entered the “thin” zone (4) between $75,000 and $86,000. In November, prices passed through that area so quickly that almost no trading occurred. When a drop happens, it tends to be very swift.
A logical price target is the range between $75,000 and $77,000. This level is reached if you interpret the peak as forming a rectangle top or double top (1). It also coincides with a much-discussed CME gap (2) and the upper boundary of the previous price range (3).
So, what now? Is this the beginning of a new bear market? Where exactly is that “handbrake” we often mention? What do the coming months hold?
Later—exclusively for our Plus members—we’ll explore these questions in more detail. For now, here's the bottom line:
We’re in a bull market until proven otherwise.
For instance, evidence that this bull market might be ending would be a weekly close below the dominant moving average—the one we also use as a handbrake. Until then, our base scenario is that after this correction, a new growth phase will begin.
Every bear market starts with a correction, but not every correction signals the start of a bear market. While we see a few data points hinting at a bear market, the majority of evidence suggests otherwise. Therefore, we maintain a bullish outlook.
From this perspective, prices between $75k and $80k offer a good entry point. If prices then rally to $110k, that would mean a 40% gain—with potential for even more. And by applying a strict handbrake, any potential losses can be limited.
The chart below shows a solid series of higher highs (HH) and higher lows (HL) since the start of this market cycle. With a bottom of $78,000, this correction is 29% deep—roughly the same as last summer.
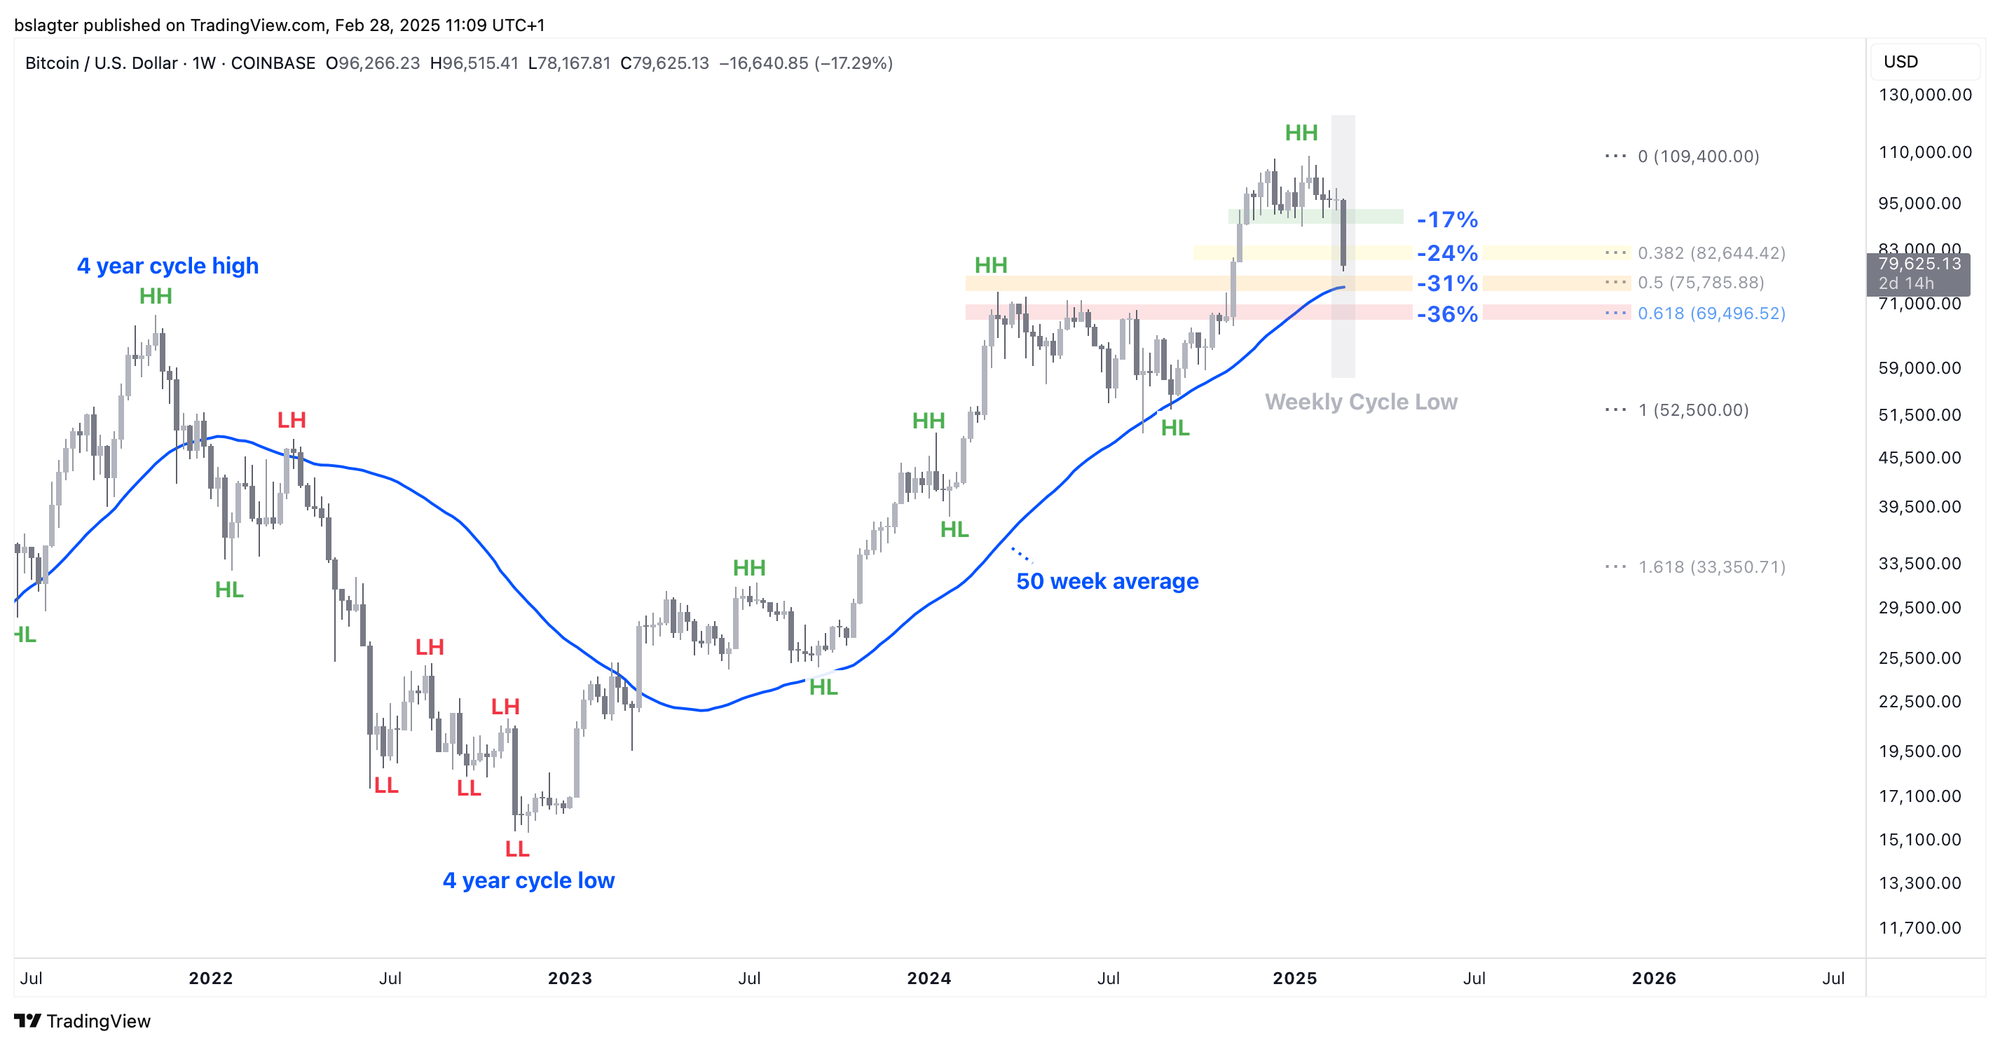
This decline brings us close to the end of the current weekly cycle. We went from $52,000 on September 6 to $109,400 on January 20—a 106% increase, followed by the current 29% correction.
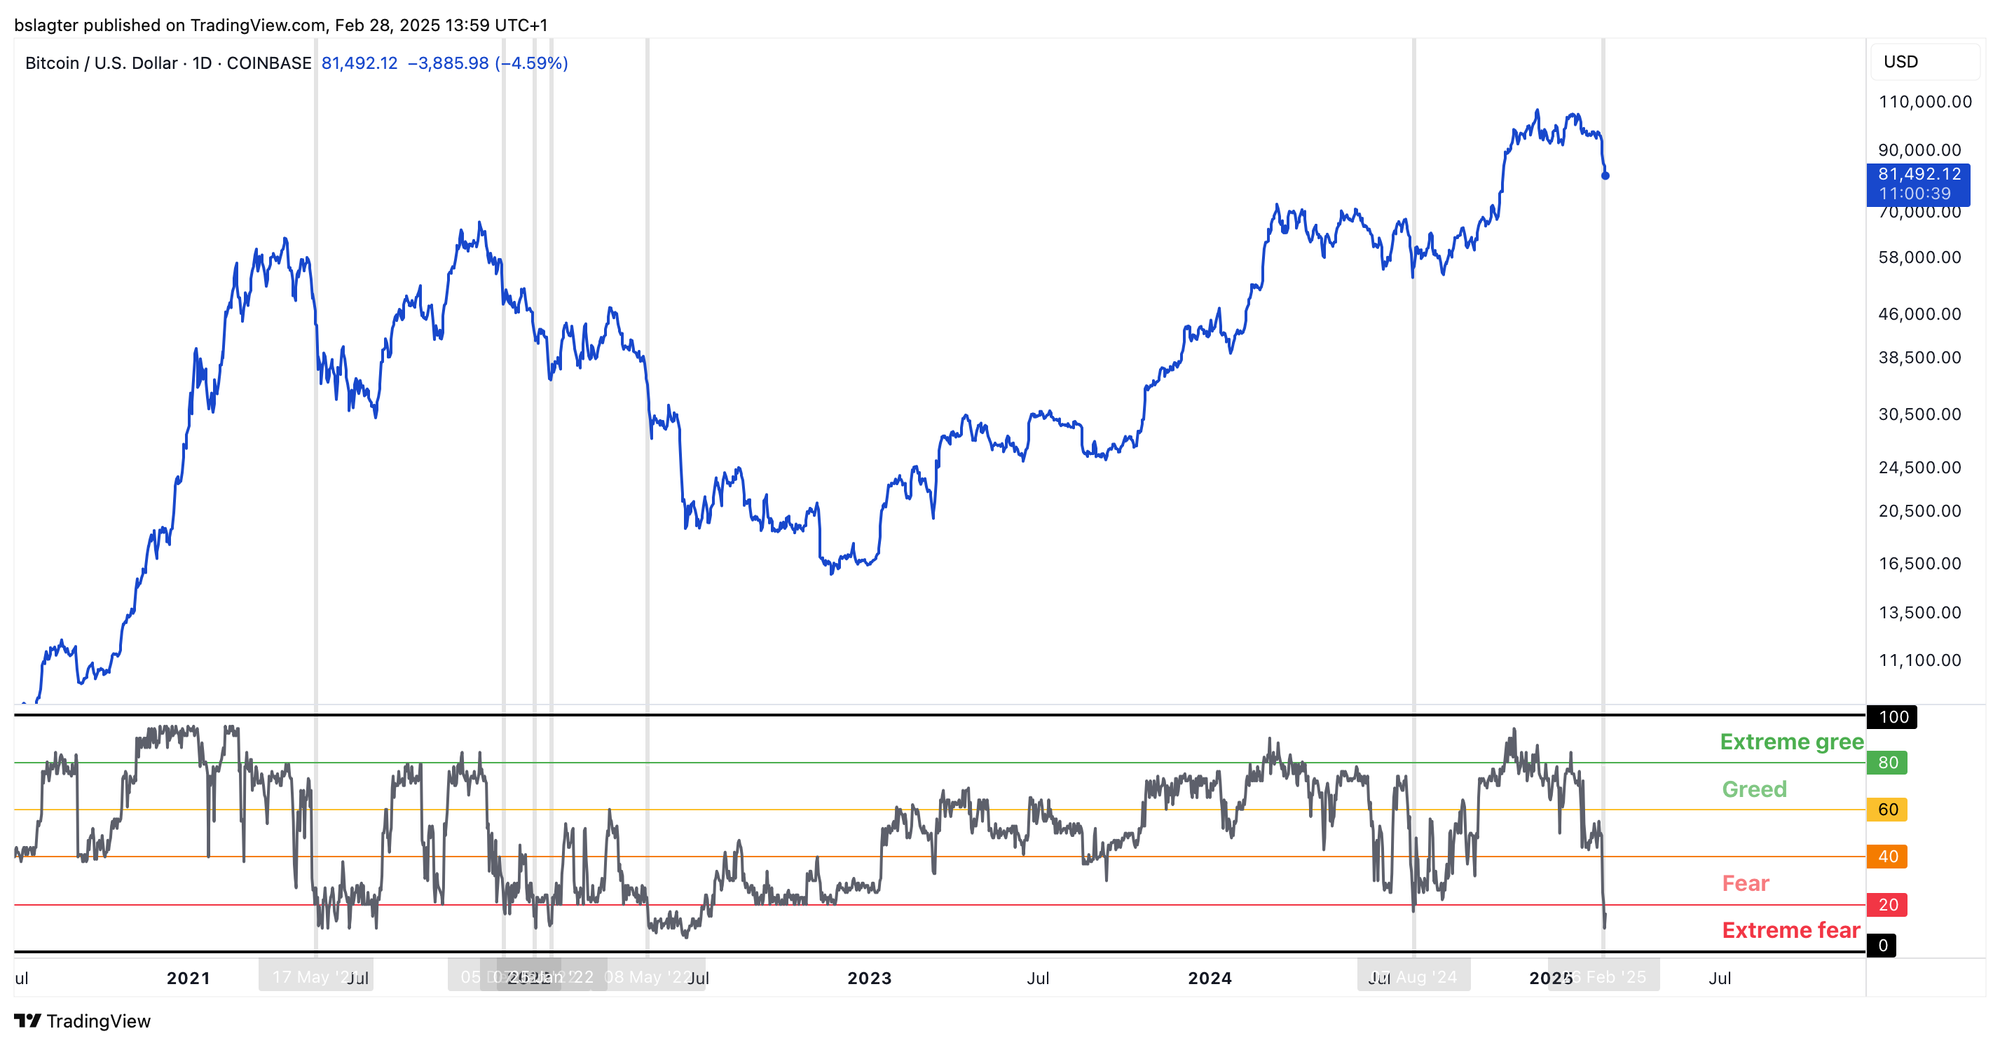
Around the cycle’s low, uncertainty and fear dominate—even in a healthy bull market. This time, it’s more intense than at previous cycle lows. The Fear & Greed index is at “extreme fear” and has reached its lowest level since the mid-point of the previous bear market in 2022.
Incidentally, we also see this fear among stock investors as well. In the weekly AAII survey, 61% of investors were bearish, while the S&P 500 was just 3% below its all-time high at the time.
Most other indicators show values typically seen at a weekly cycle low—such as the weekly RSI, the level of realized losses, and the MVRV.
The coming days are likely to be turbulent. As we head into the weekend, market liquidity usually drops, which can amplify movements—especially with a monthly close on Friday and a weekly close on Sunday. We should know more next week!
We will continue with the following topics for our Alpha Plus members:
- Deceived by Donald Trump
- Who is Selling Their Bitcoin Now?
- Where is the Handbrake?
- Future Scenarios: The Next Weekly Cycle
- Renewed Concerns About the U.S. Economy