
Bitcoin Searches for Room to Run
Crypto slid further this week, with bitcoin sinking to $79,000 and ether to $2,300. One coin bucked the trend: HYPE surged more than 20%. Is bitcoin's red line about to snap, or is this just a pause before the next leg up?

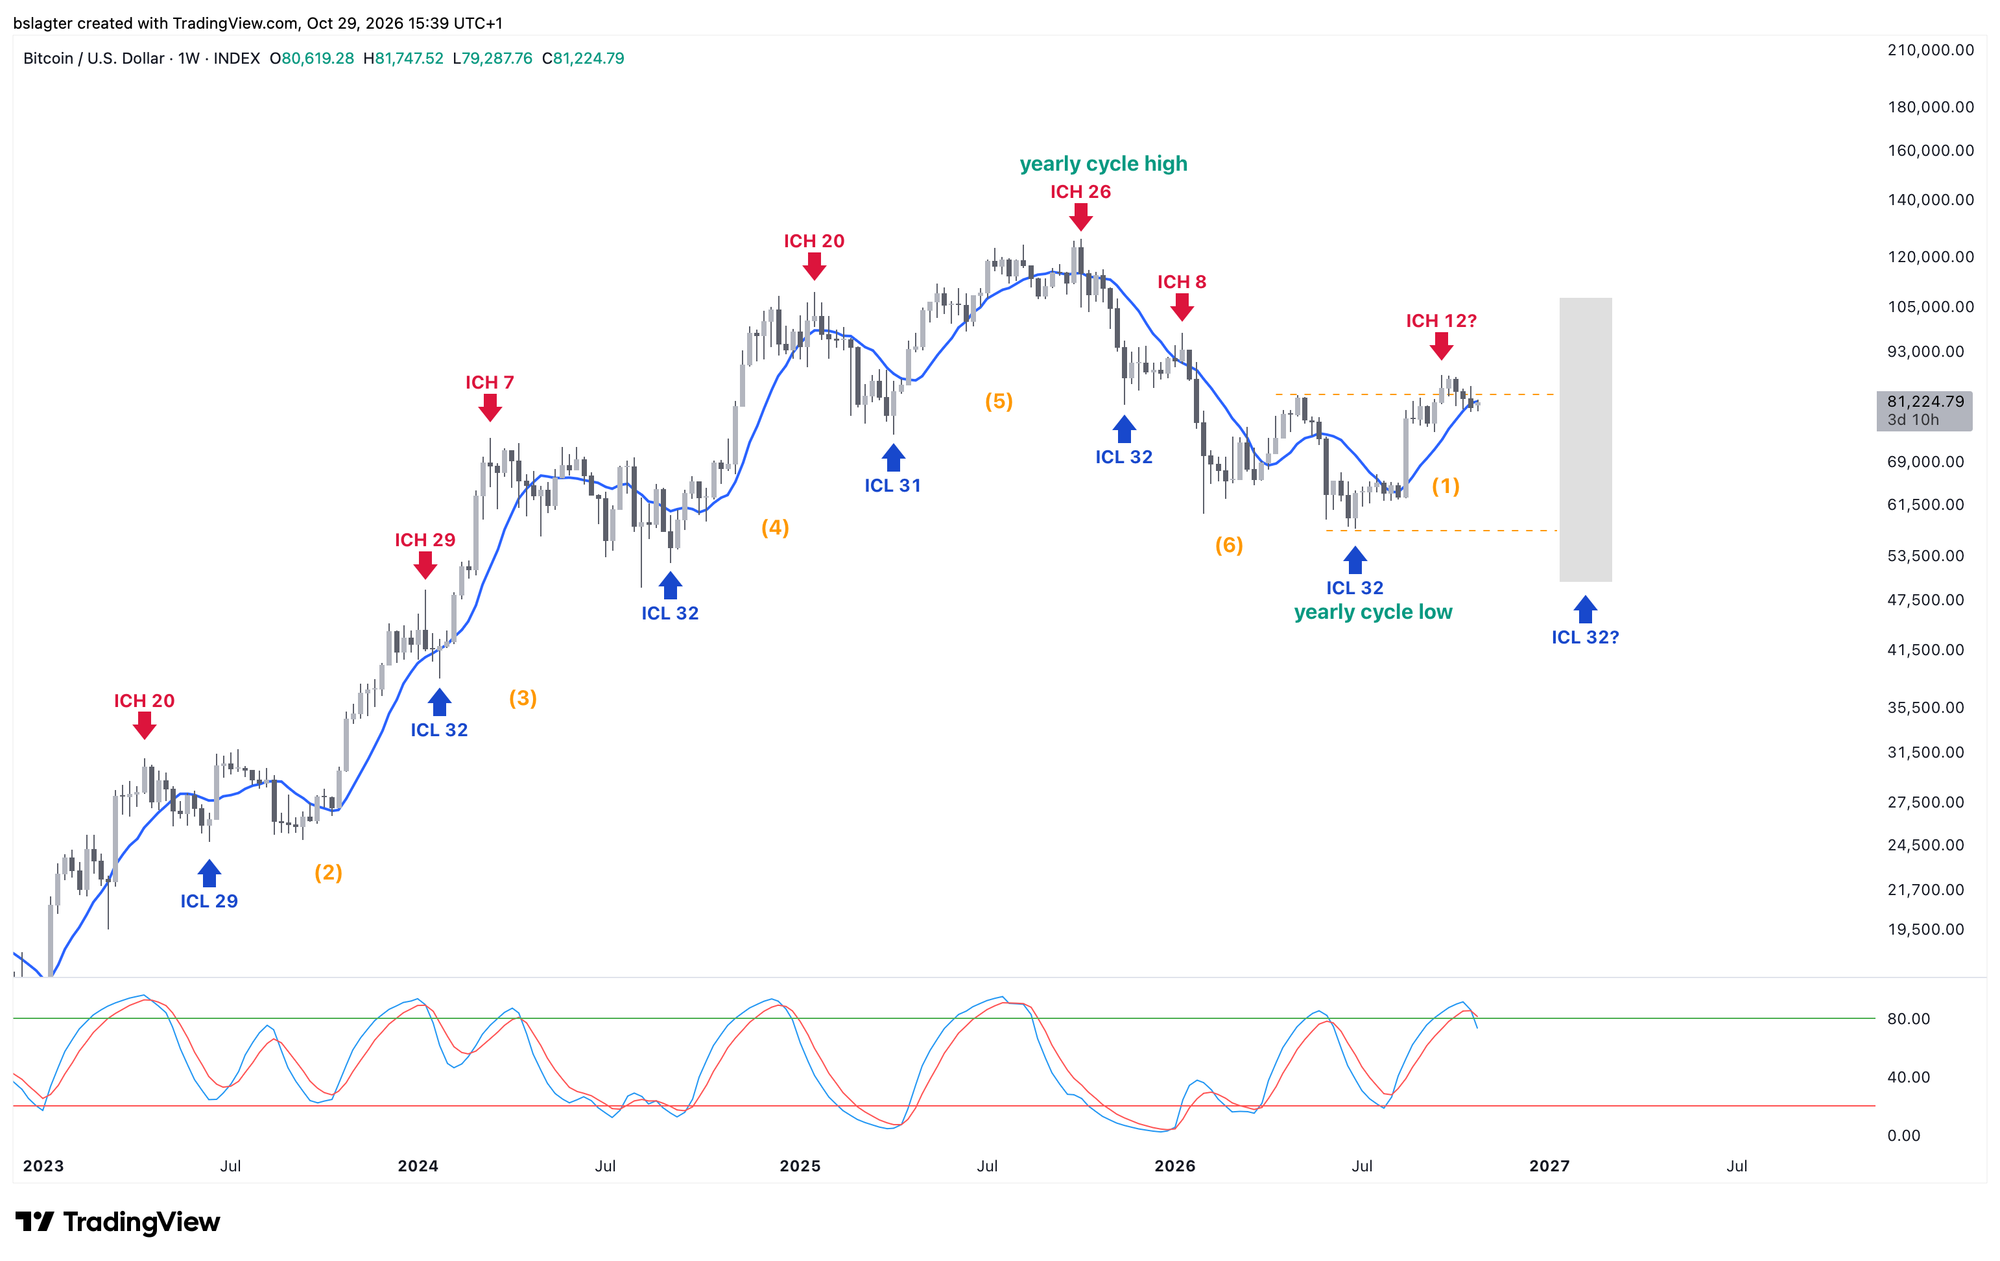
Over the past four years, bitcoin has carved out a neat rhythm on the monthly chart, putting in a significant low every 31 or 32 weeks. Some of those lows are etched in our memory because of the events that preceded them, such as the rapid unwinding of the yen carry trade in August 2024 and the introduction of import tariffs in April 2025.
The moving average with a length of roughly one year has served as a useful dividing line between the rising and falling phases of the market cycle. In the chart below, you can see the 50-week average providing support a few times during the bull market.
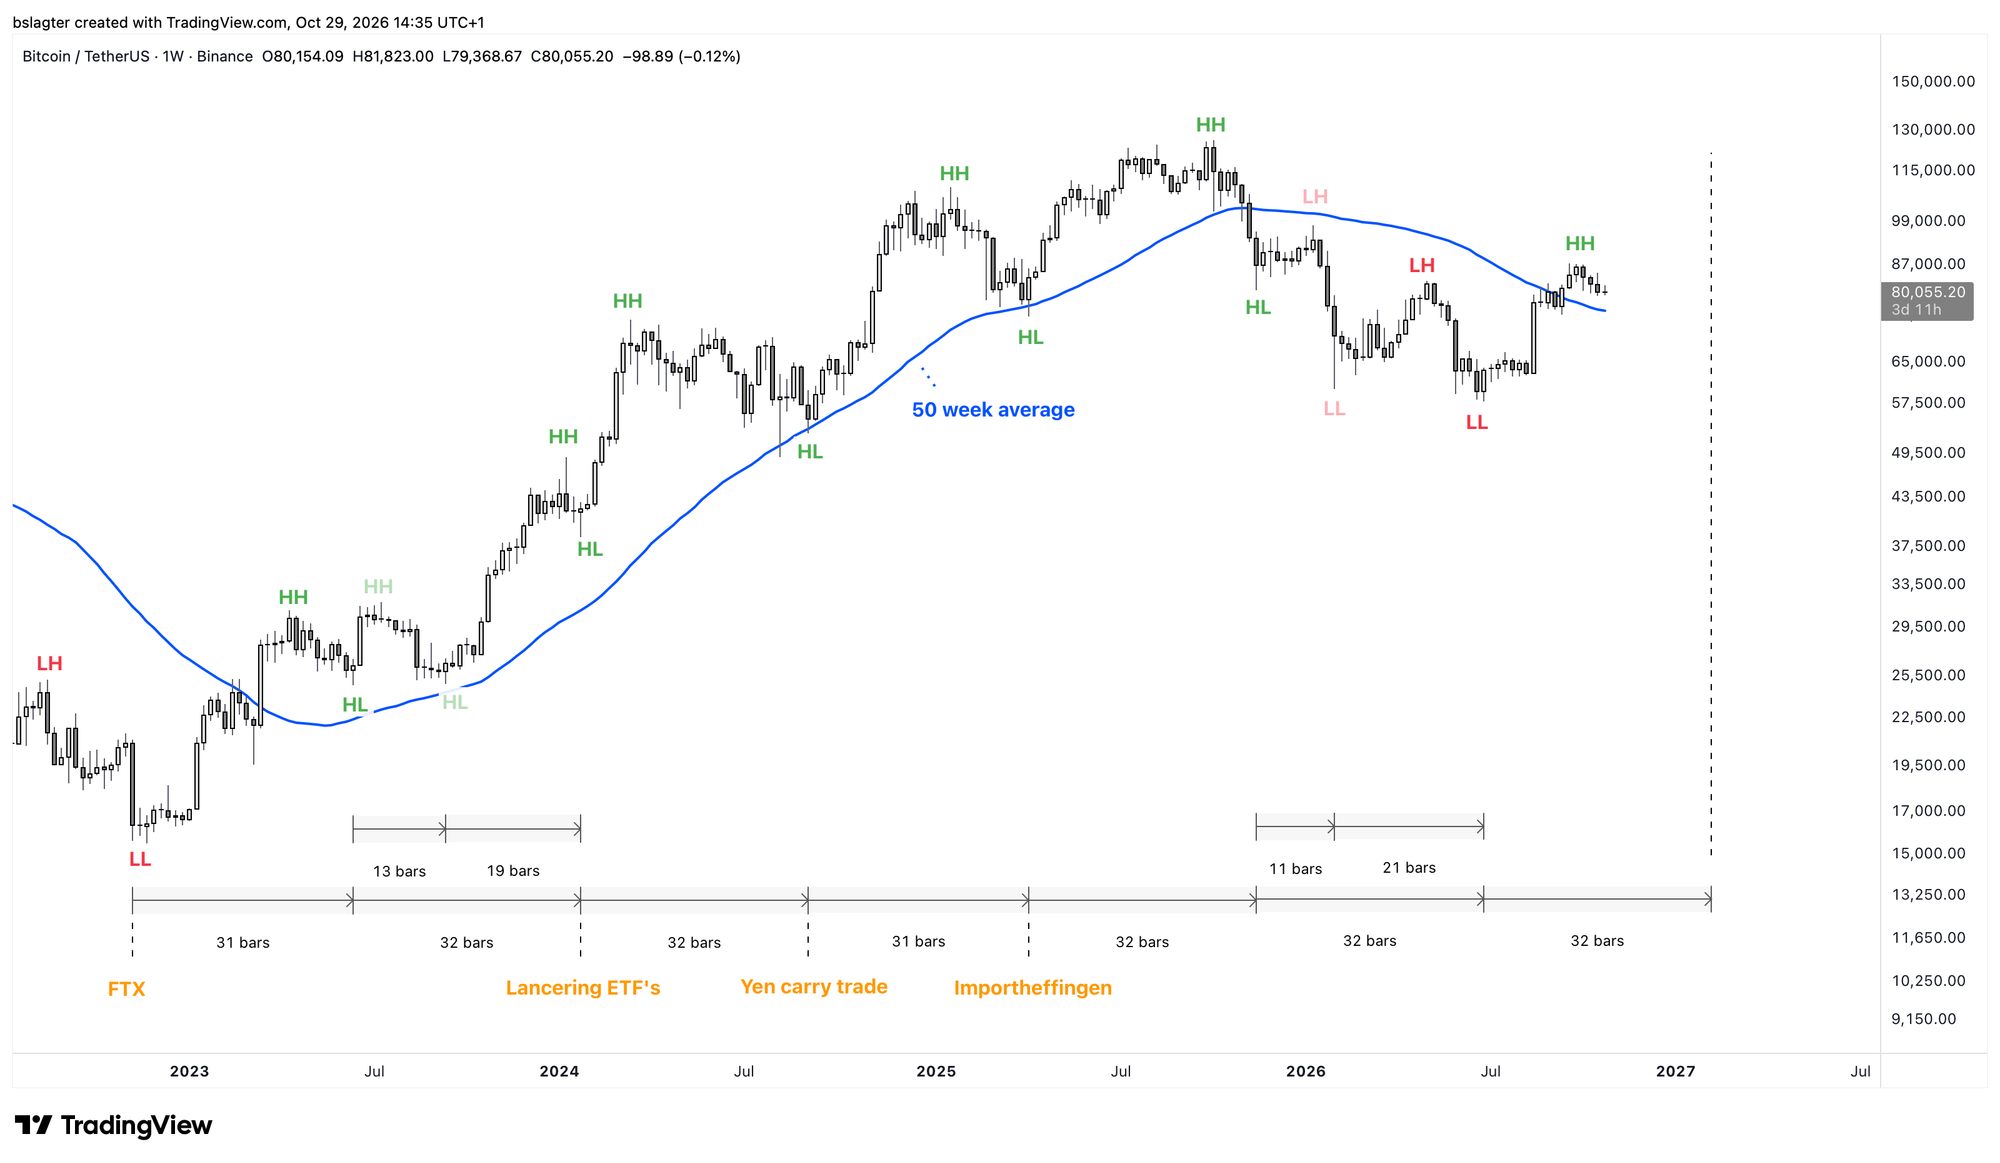
If this rhythm holds, we're only in week 17 and still have some 14-15 weeks to go until the next significant low. That puts us in the middle of the first quarter of 2027.
Working from that assumption, two paths are possible:
- The $87,400 reached on 21 September was the top of this weekly cycle, and we'll spend the coming months consolidating before eventually sliding towards the low.
- There's still another leg up to a higher high. A logical price target would then be around $98,000, with a logical time window of late November or early December.
On a multi-year horizon, it doesn't matter all that much which path we take. What matters is that we then put in a higher low above the $57,700 of 1 July. That would let us tick the third box:
✅ A weekly close above the 50-week average
✅ A higher high (HH) above the $83,000 of 6 May
⏹️ A higher low (HL) above the $57,700 of 1 July
⏹️ A change in direction of that average from falling to rising
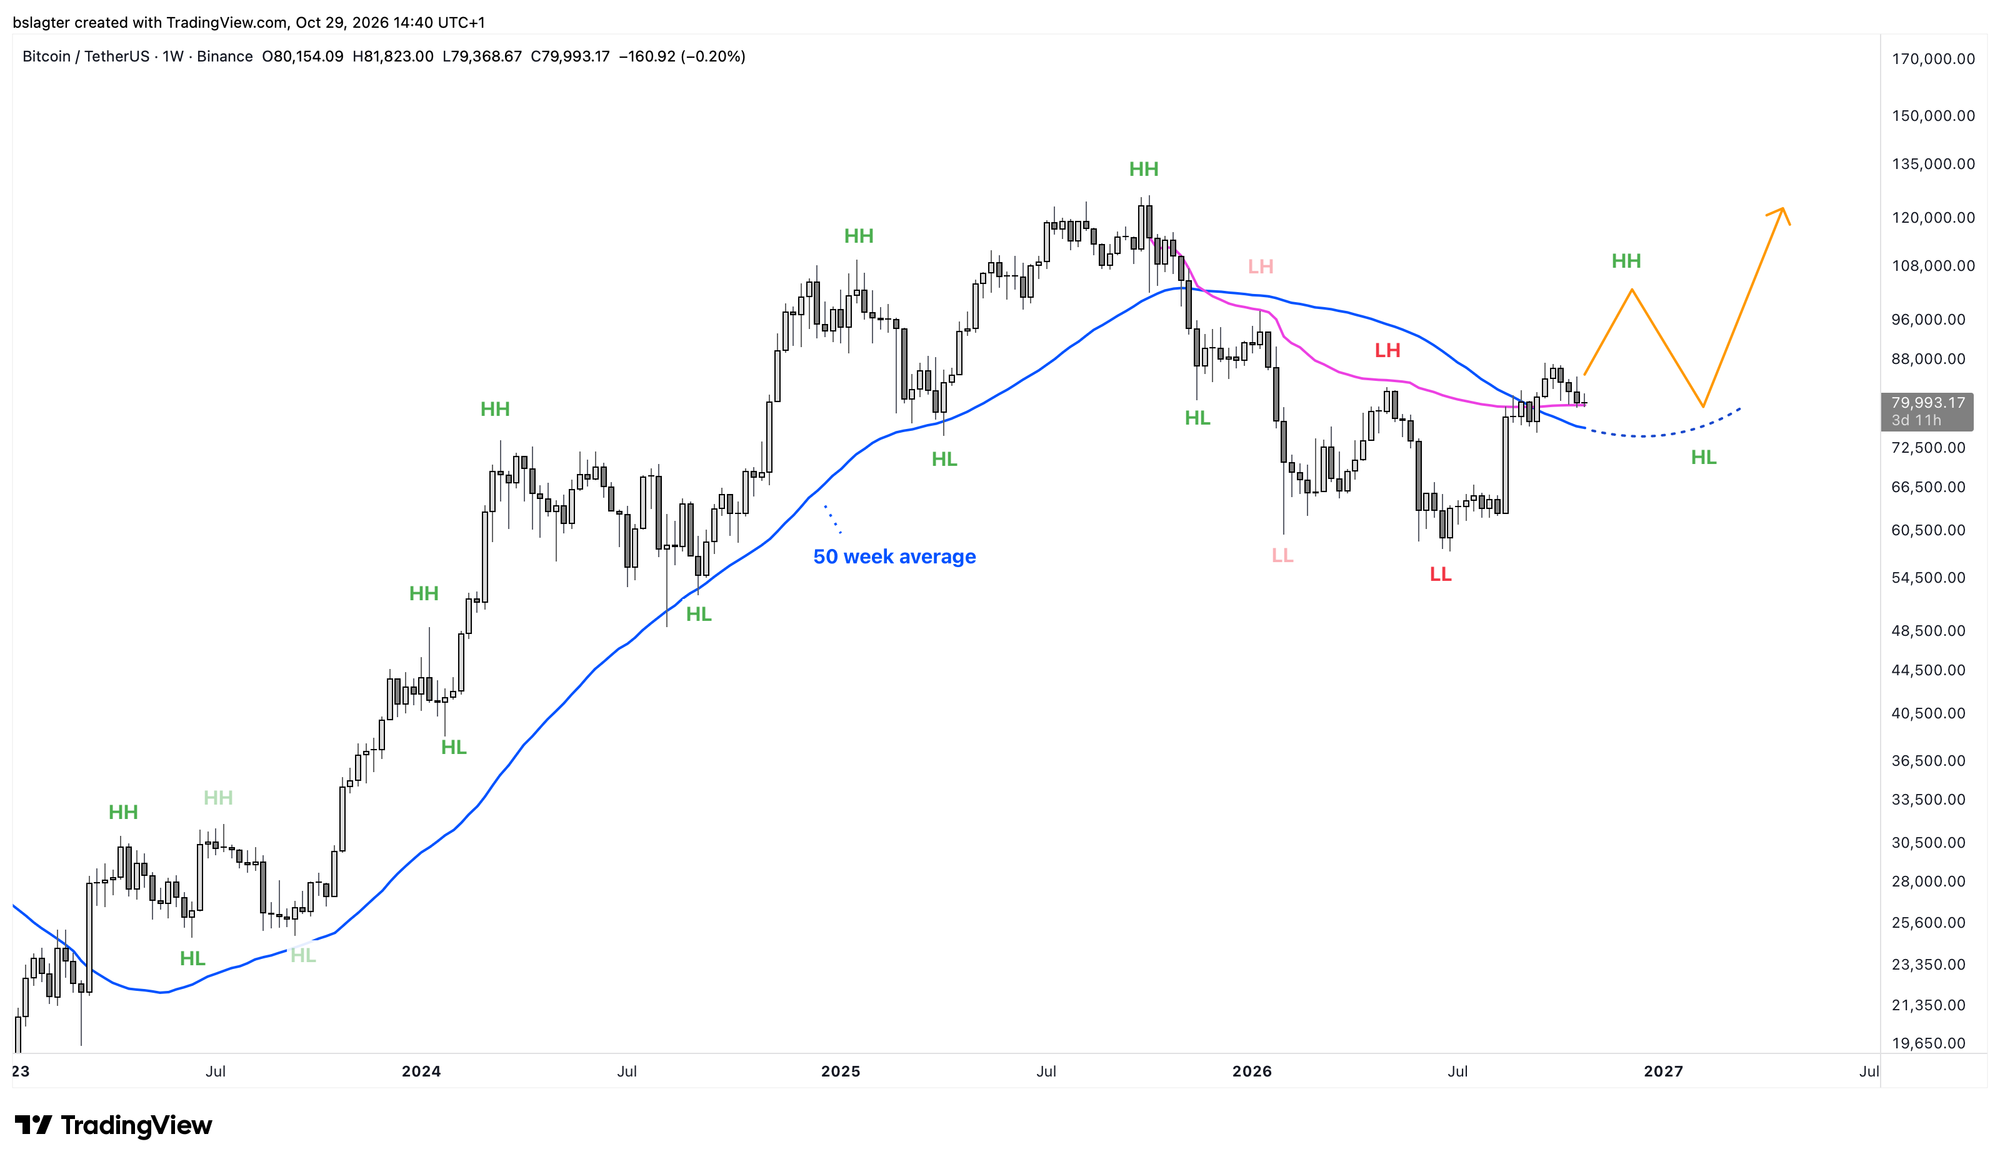
The path with the higher high is strongly preferred, and not just because we simply like higher prices. It would give the price a chance to put some distance between itself and the dominant average, and to start using that average as support in the bull market once again. We've visualised this in the chart below.
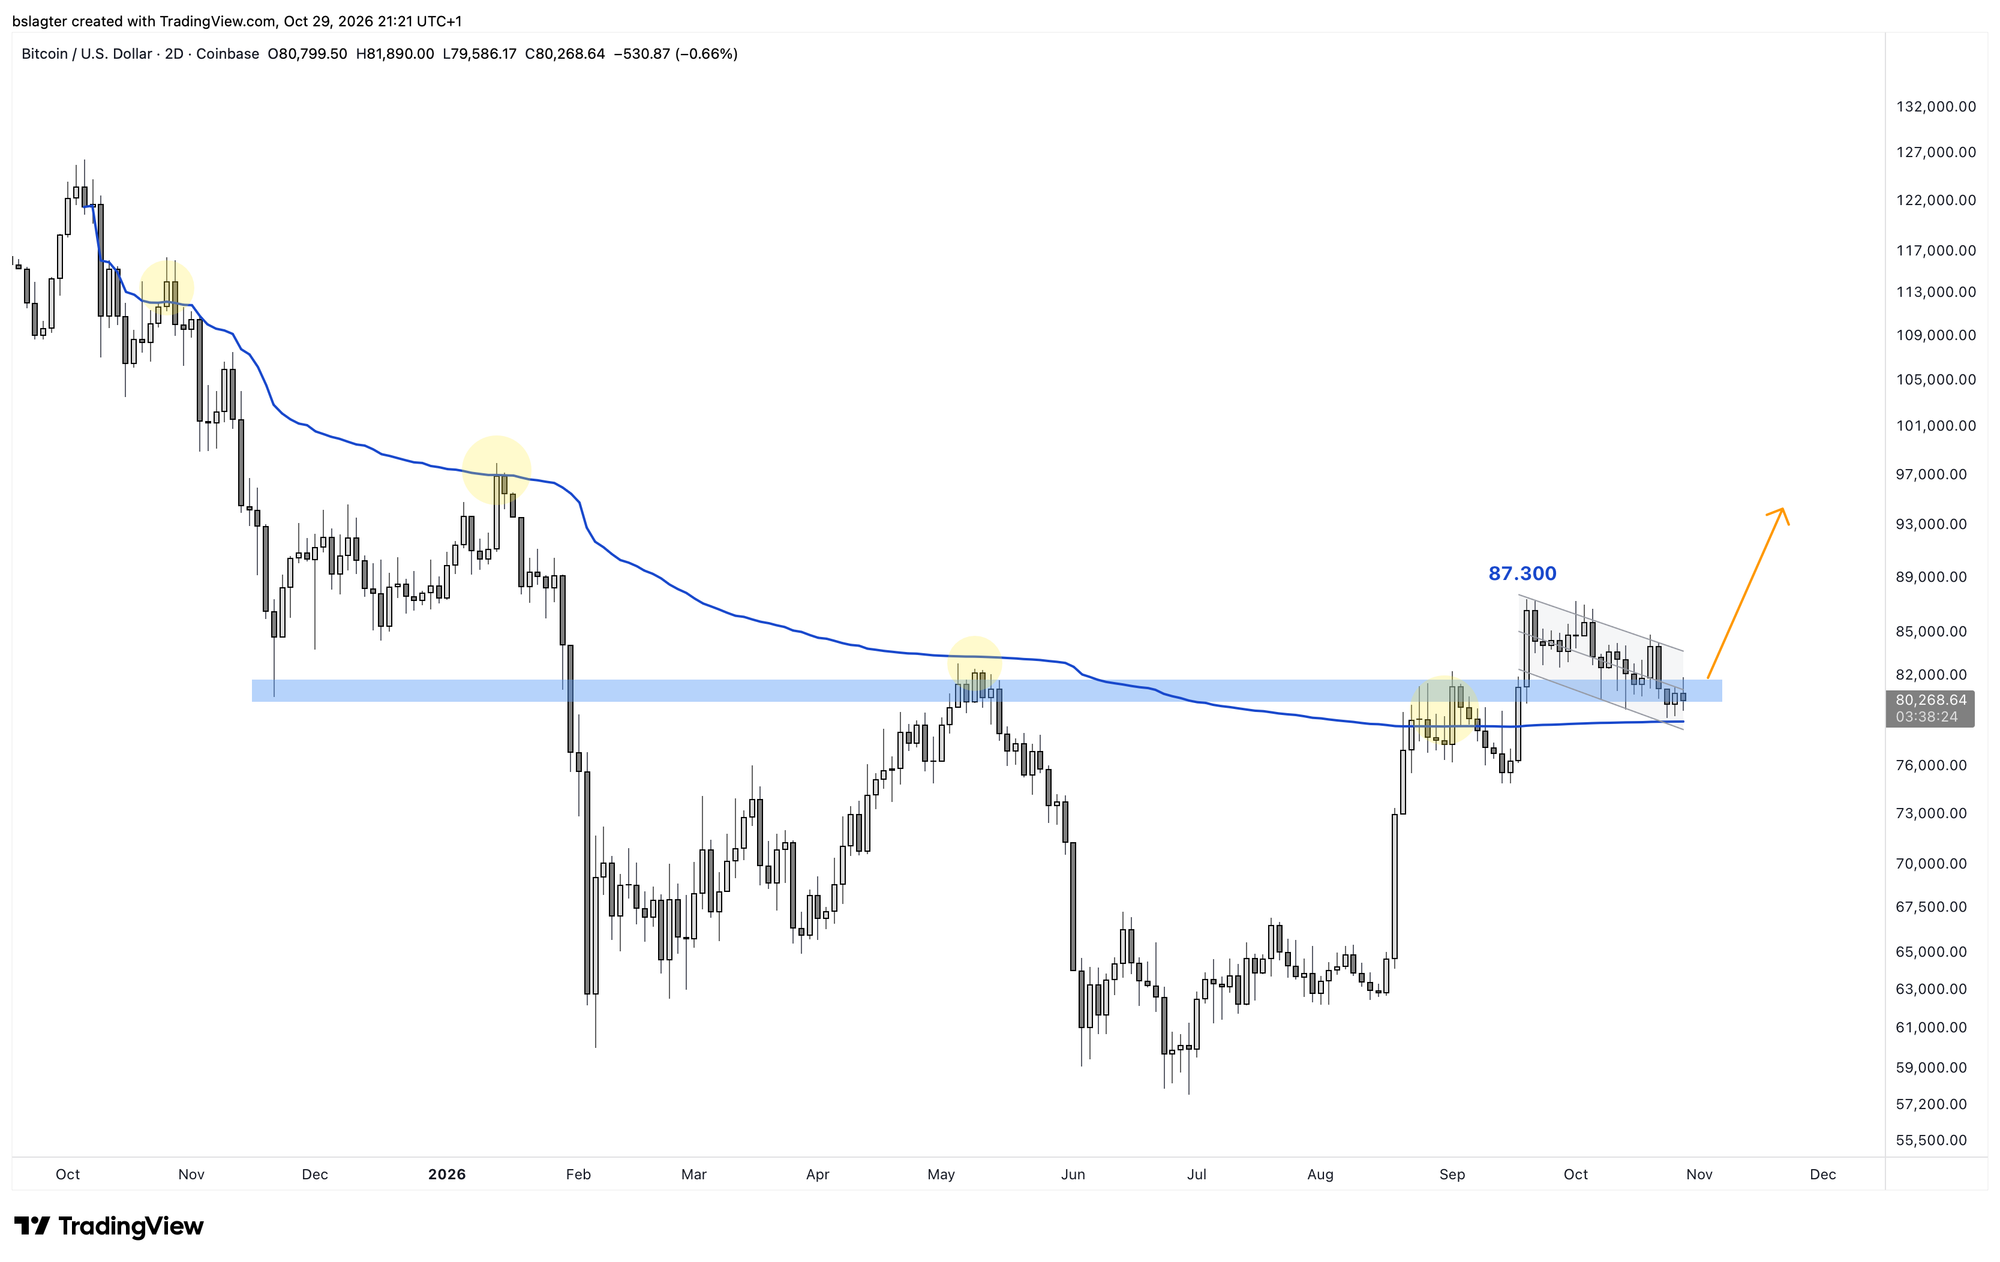
The pink line is the volume-weighted average price (VWAP) anchored to the October 2025 top. It guided the decline during the bear market and could now act as support.
This early in the bull market, crypto is somewhat more sensitive to outside forces. There's no strong narrative of its own and no euphoric party among investors. Trading is idling. No high volumes, no spikes in futures and options open interest, and no lavish ETF inflows.
𝗕𝗶𝘁𝗰𝗼𝗶𝗻 𝗘𝗧𝗙 𝗙𝗹𝗼𝘄 (𝗨𝗦$ 𝗺𝗶𝗹𝗹𝗶𝗼𝗻) – 2026-10-26
— Farside Investors (@FarsideUK) October 27, 2026
TOTAL NET FLOW: 110.3
IBIT: 110.3
FBTC: 0
BITB: 0
ARKB: 0
BTCO: 0
EZBC: 0
BRRR: 0
HODL: 0
BTCW: 0
MSBT: 0
GBTC: 0
BTC: 0 pic.twitter.com/Gio6izpqki
Outside the crypto market, the winds are gusty. All sorts of issues are jostling for attention: war in the Middle East, expensive energy and commodities, the uneven impact of high interest rates on the economy, and the AI hype, where fierce optimism and pessimism trade places within a matter of days.
Across all these fronts, we're seeing news move markets:
- Wednesday brought the US rate decision (unchanged), Thursday Europe's (unchanged), and Friday Japan's.
- Israel held elections this week, and the US midterms take place next Tuesday, with the threat of a 'quick campaign' in Iran looming immediately after.
- We're in the thick of earnings season, and AI companies are grabbing the spotlight one by one. Microsoft and Oracle surprised to the upside, Google to the downside. Is there a common thread, or are these all isolated anecdotes?
- Anthropic has scheduled its IPO for the week of 16 November. The pre-IPO price of $115 points to a market capitalisation of more than $2 trillion.
Bond yields play a major role in many of these concerns. Are they holding back investment and consumption? Are they weighing on government budgets? Are they curbing investors' appetite for risk?
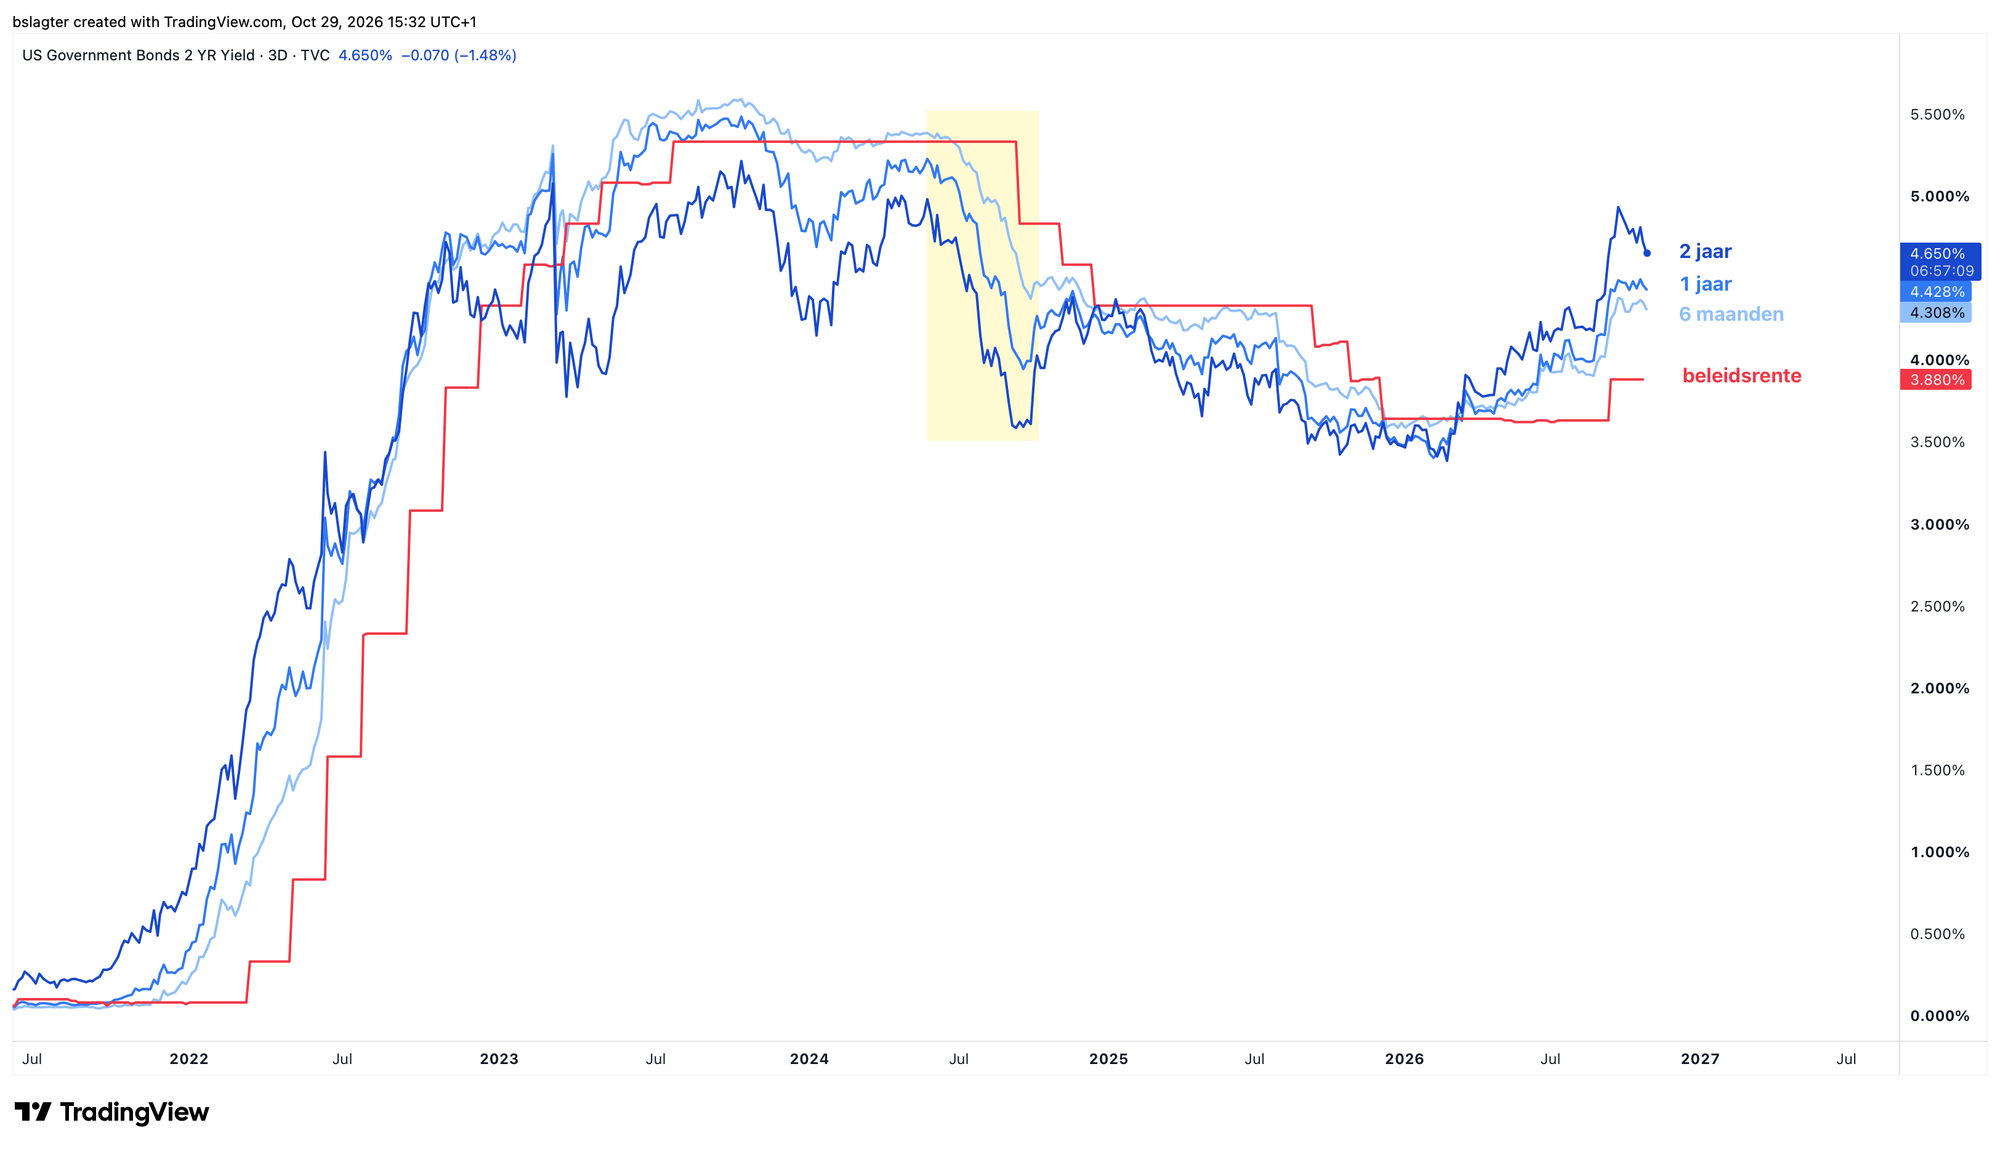
The US central bank ultimately follows the bond market. The chart below shows, in blue, yields on bonds with maturities of 6, 12 and 24 months. When they make room for a hike or a cut, the Fed follows after a while.
Should the central bank go against them, it gets pushed back through the back door. Suppose it cut rates now: chances are that 10- to 30-year yields would actually rise in response to higher inflation expectations.
Some investors point to the peak in yields at the end of September. The 2-year yield has already dropped from 4.9% to 4.6%. The 10- and 30-year yields have also taken a step down. If that decline continues, it reduces the room (and the need) for the Fed to raise rates.
That doesn't mean we should expect a cut to the policy rate any time soon. For that, you'd expect a much deeper drop in longer-dated yields to make room, as in the autumn of 2024. We've highlighted that period in yellow in the chart.
Even without a cut to the policy rate, easing in the bond market is good news for crypto. It takes some pressure off all the rate-sensitive sectors of the economy, including consumers. And lower volatility leaves room for a bit more risk in portfolios. Reason enough to keep a close eye on this over the coming weeks!
We continue with the following topics for our Alpha Plus members:
- The $79,600 red line has been hit. Now what?
- Hyperliquid jumps 30%
- Memory stocks: Lower high or bull market resumption?
1️⃣ The $79,600 red line has been hit. Now what?
 Contribution by
Bert
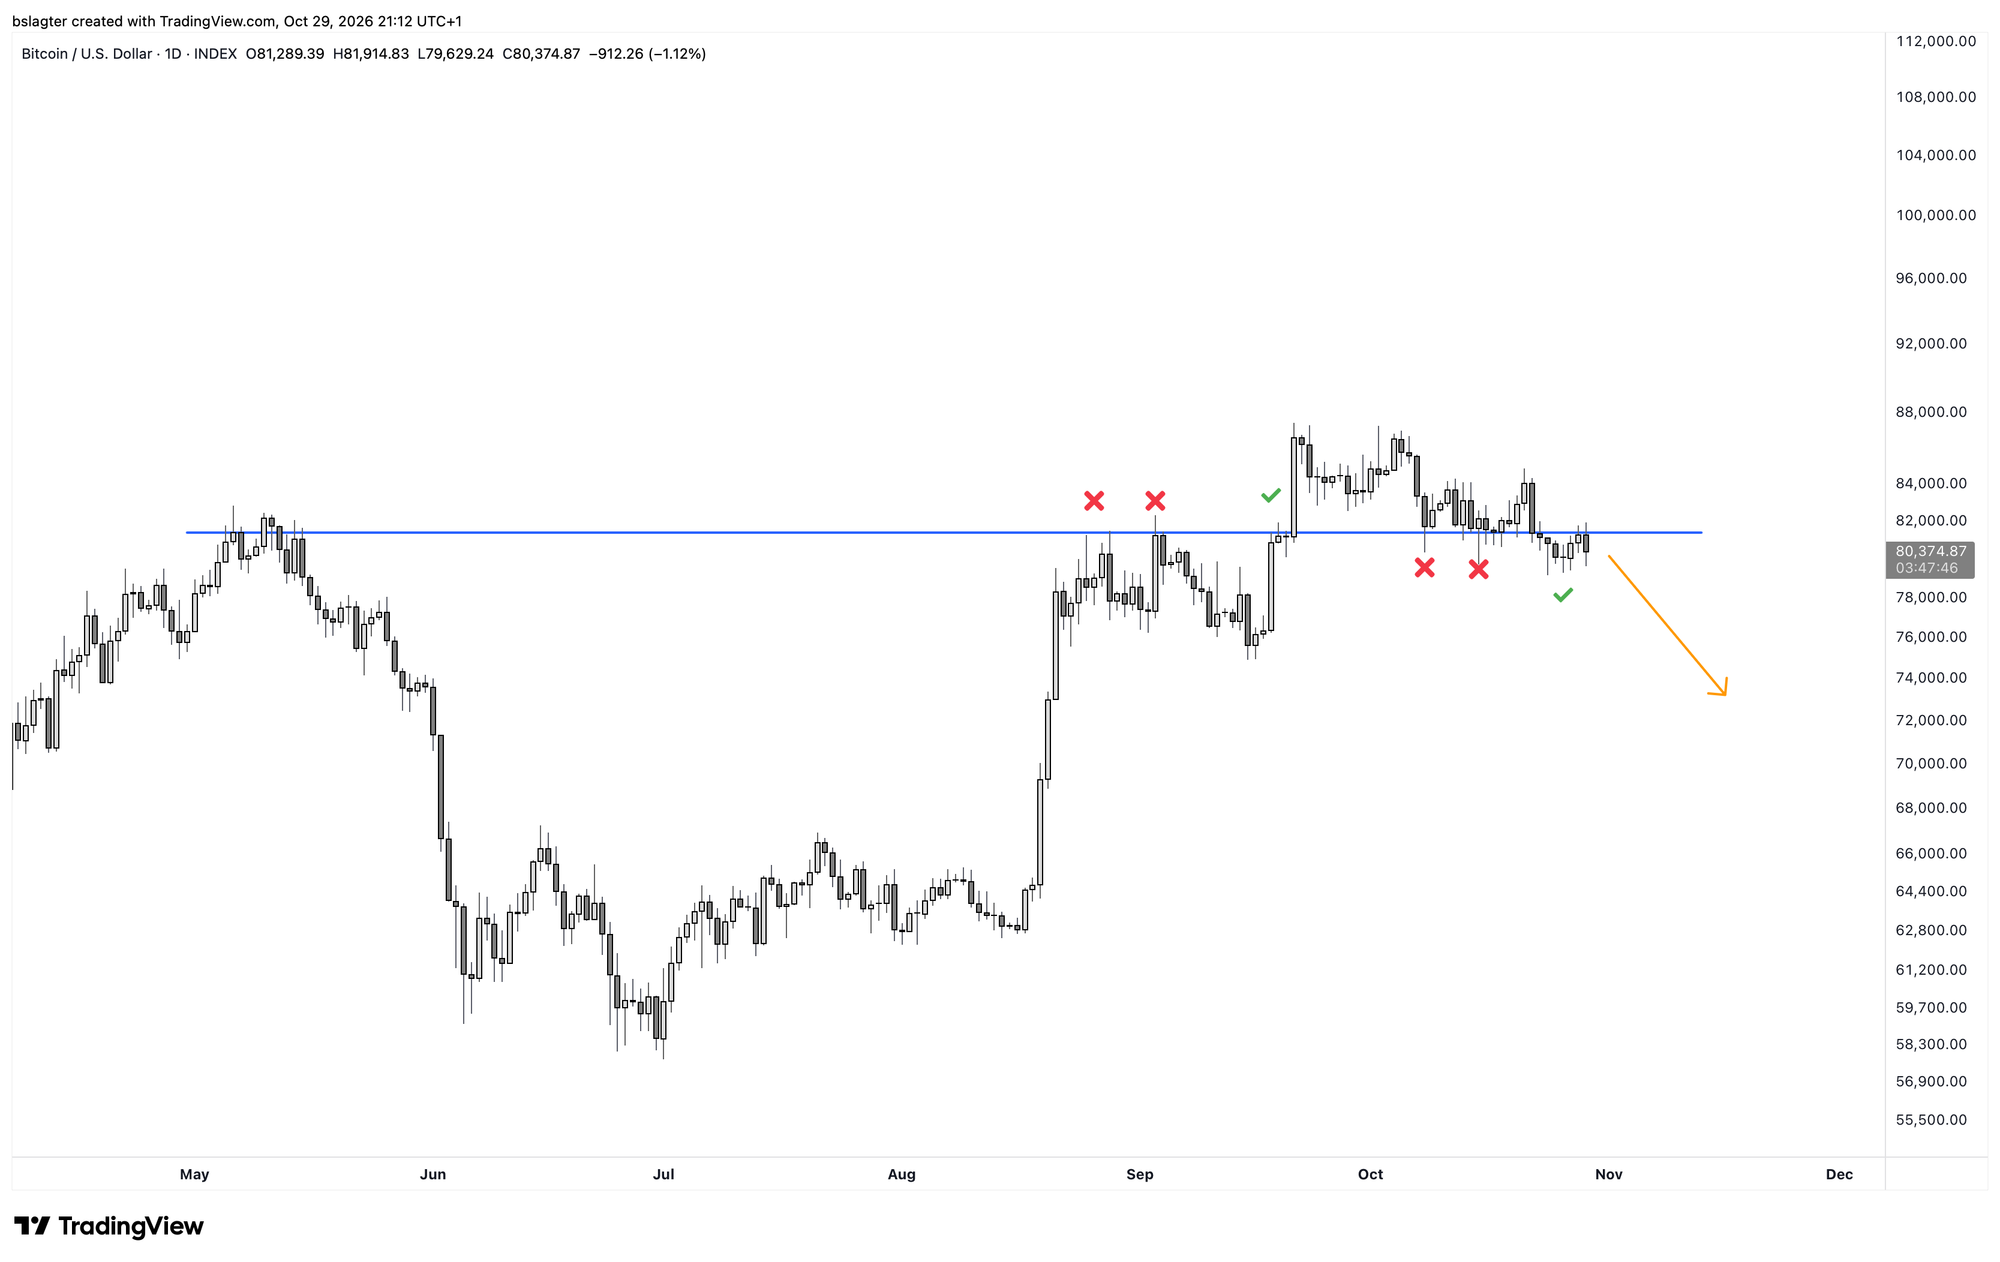
In last week's Markets, we drew a horizontal red line from the starting price of the current daily cycle. We'd rather not see the price drop below $79,600 for the time being. According to the rules of cycle analysis, that would mean a failed daily cycle, a signal that we've entered the declining phase of the weekly cycle.
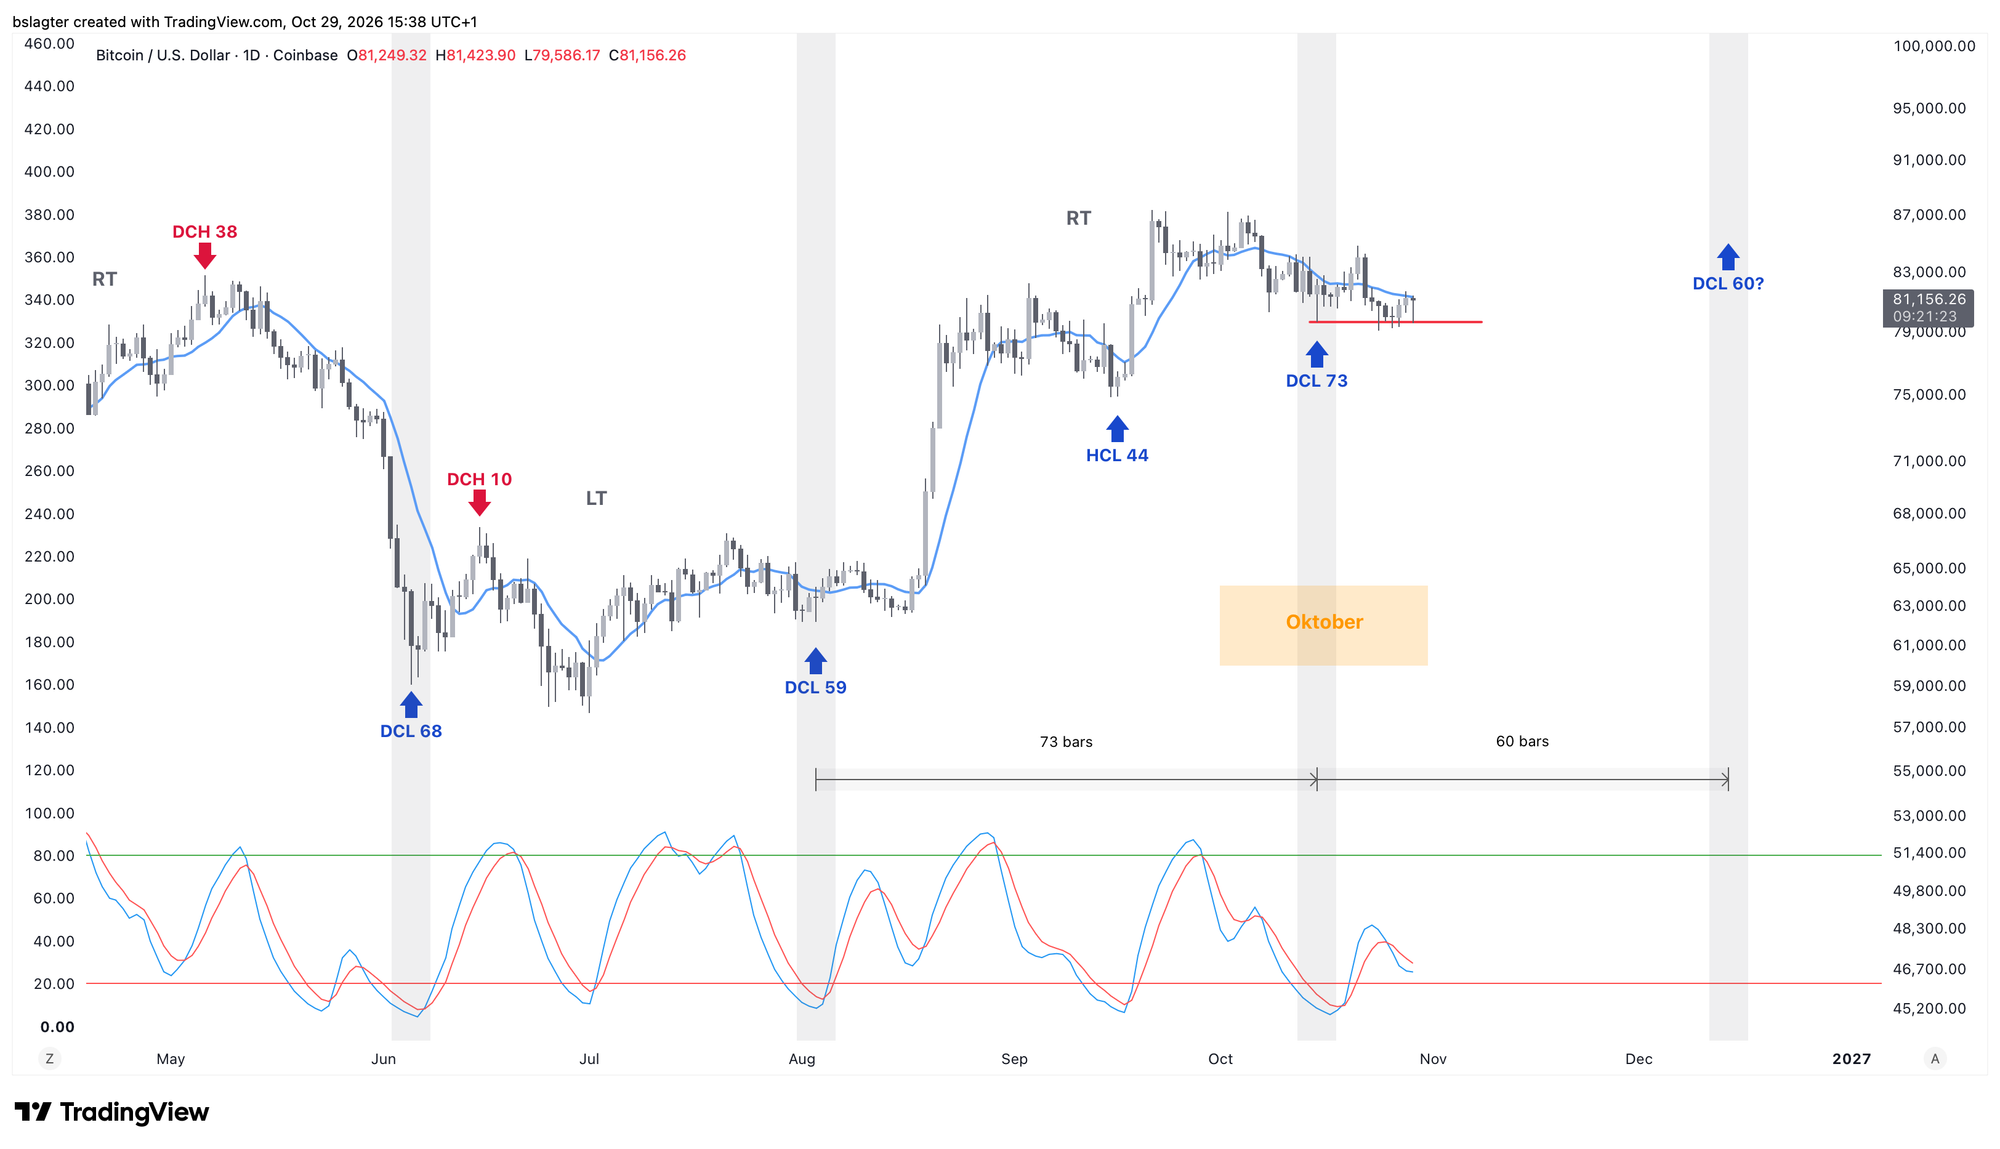
That happened on Saturday, Monday, Tuesday and Thursday. But only briefly during the day; each daily close came in above $80,000. So, what are we supposed to make of that?
Last week I wrote:
You can be generous and use the daily close, but there's no defence against a barrage of missiles on Iran.
We need that same generosity for the weekly chart. Last Monday, we recorded a weekly close ($80,100) just below the 10-week average ($81,100). In principle, that too is a signal that the declining phase of the weekly cycle has begun.
But a signal is not a guarantee. It merely raises the odds. The alternative reading is that we're seeing a 'mid-cycle pause' and will launch the final push from here towards the ultimate weekly cycle high (ICH).
Looking at the daily chart through a technical analysis lens, you can also put two interpretations side by side.
In the first interpretation, we draw a sharp line at $81,400. The bears appear to have reclaimed it, which would point to a continuation of the decline. Will Clemente flipped the chart upside down and made the following observation:
If the bitcoin chart were upside down, everyone would be falling over themselves to go long after a failed breakdown below the lows, followed by a reclaim back above them.
In the second interpretation, we use a slightly broader brush and treat the $79,000 to $82,000 zone as the relevant band, which first acted as resistance and is now being tested as support. The VWAP is the real dividing line.
Both are defensible. The conclusion is as simple as it is unsatisfying: we'll have to wait and see how things unfold!
2️⃣ Hyperliquid jumps 30%
Contribution by Bert
Hyperliquid was in the spotlight twice this past week. After Anthropic announced its planned IPO, the ANT pre-IPO future was listed fairly quickly. It lets investors speculate on the opening price on the first day of trading, expected in the week of 16 November.
On Thursday, one of the largest and most important exchange operators in the world came out with some news. Intercontinental Exchange (ICE) plans to team up with trade[xyz] to use Hyperliquid to offer perp markets to US traders. They cite crypto, equities, commodities, currencies and other real-world assets as examples.
Wall Street legend Stan Druckenmiller posted on X that he is "happy to be involved as an investor in trade[xyz], which together with ICE is bringing 24/7 trading on Hyperliquid to the US market". Elon Musk quoted the post with a one-word comment: "interesting".
Interesting https://t.co/HQiYAlfKWB
— Elon Musk (@elonmusk) October 29, 2026
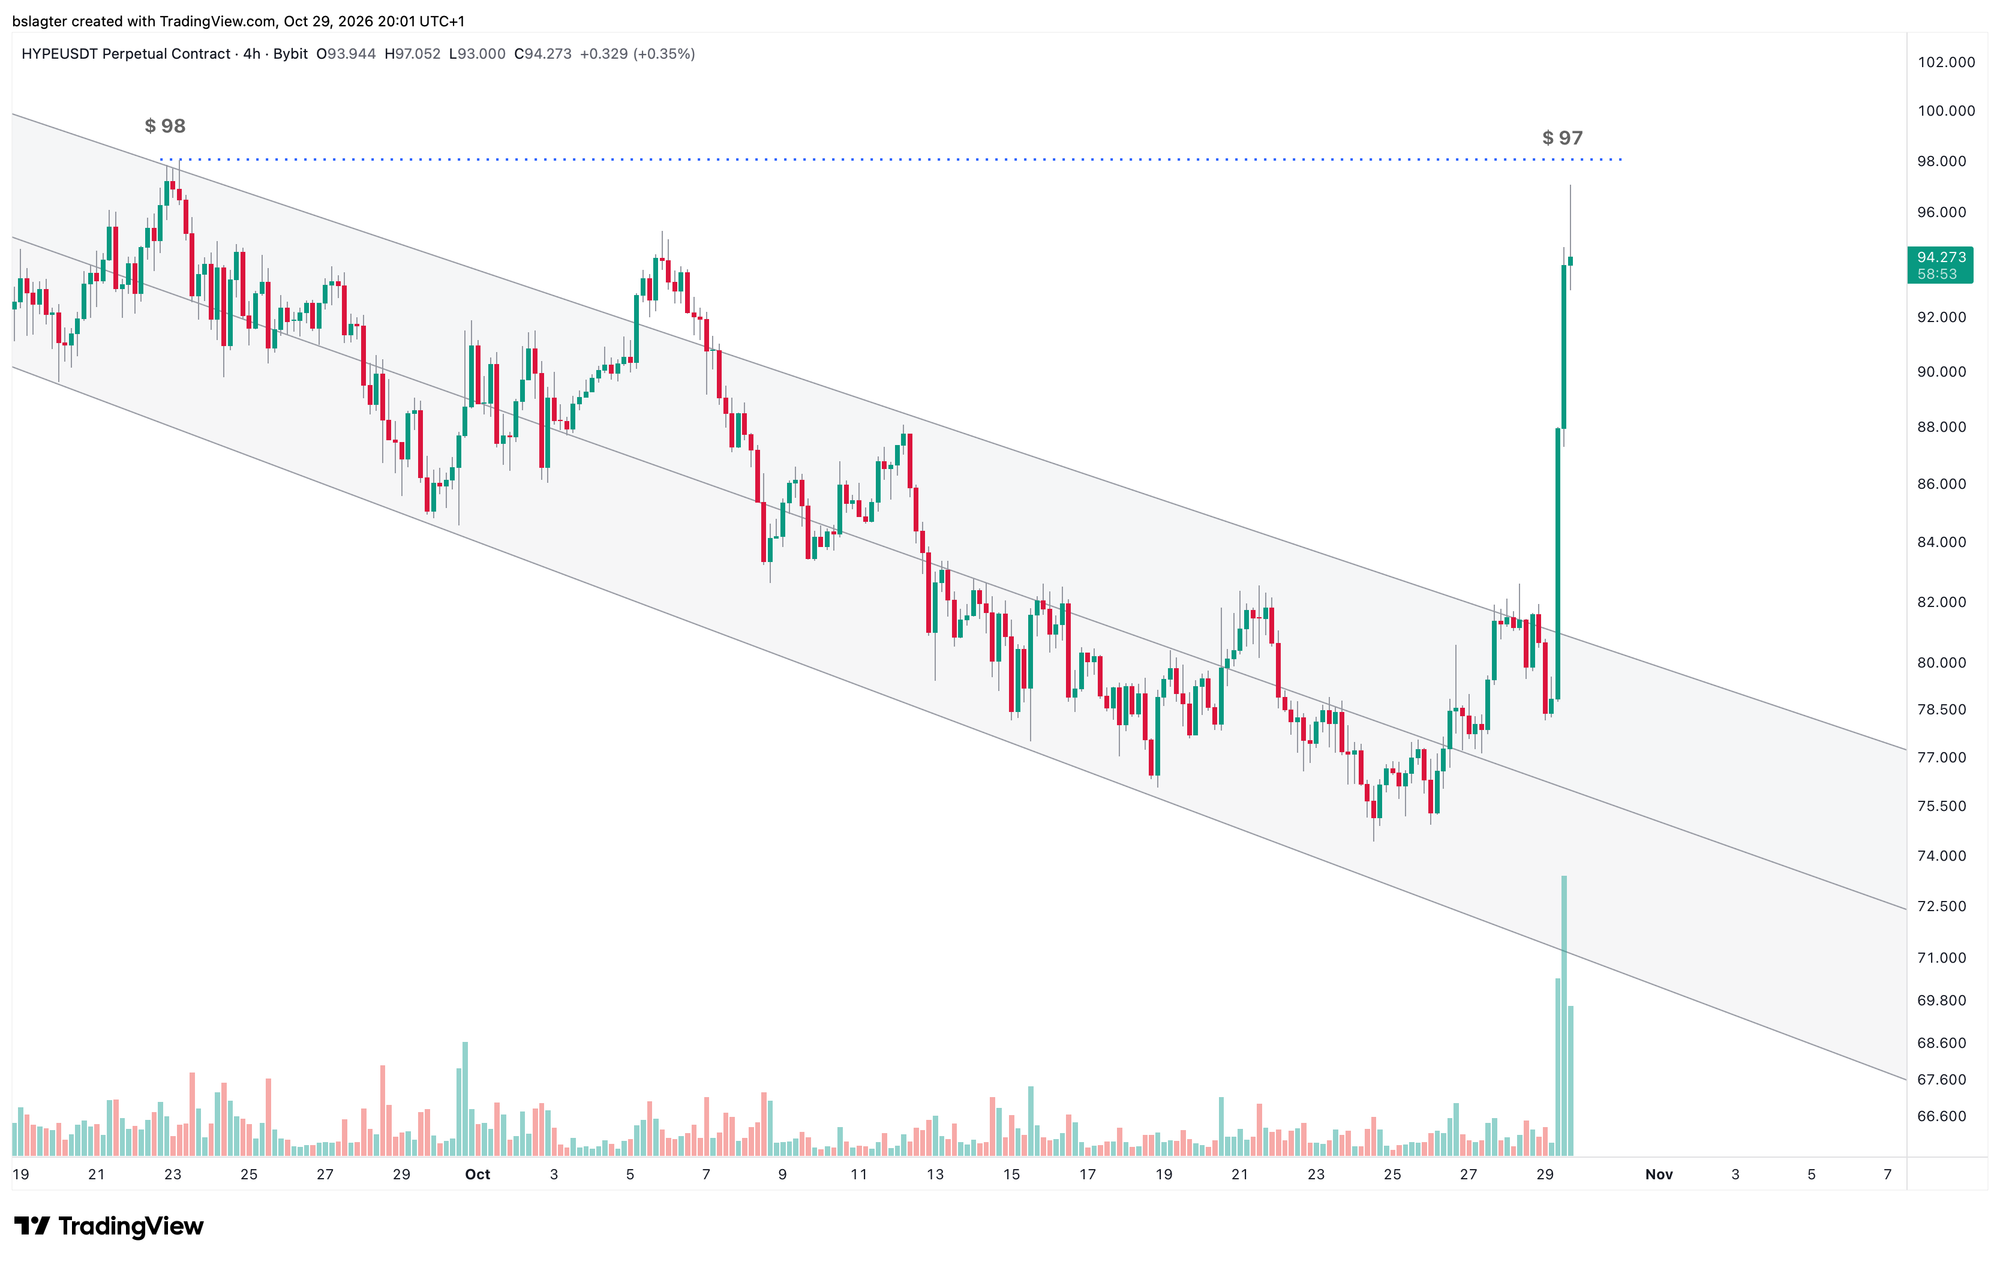
The HYPE price shot up from $74 on Monday to $97 on Thursday, a 30% gain. That's a hair below the all-time high of $98 set on 23 September. A hefty spike in trading volume backs up the move.
Lately, HYPE has often been seen as a weathervane for risk appetite in the crypto market. When HYPE rose, good times usually followed for the rest of the market too. It's very much an open question whether that will last. If Hyperliquid builds its own narrative among an audience beyond crypto investors, it's plausible that HYPE will increasingly chart its own course.
3️⃣ Memory stocks: Lower high or bull market resumption?
 Contribution by
Sam
While bitcoin and most of the crypto market were stuck in a bear market or moving sideways, a lot of attention went to stocks in the chip sector, including memory stocks.
In the Markets editions of 10 and 24 July, we noted that the upward momentum appeared to have broken. Several of these stocks then went on to put in a lower low on the weekly chart. Sandisk, for example, which had rallied 8000% before that. During this decline, Leopold Aschenbrenner's hedge fund, among others, suffered enormous losses.
That turned out to be the local bottom, and it was followed by roughly two months of strong gains. Was it merely a dip in an uptrend, or was the lower low followed by a lower high? It looks to be the latter, as a very large chunk of those gains has been handed back over the past few weeks.
And although the medium-term downtrend has yet to prove itself, there's a good chance that a number of memory stocks will follow silver's pattern: a parabolic rally, followed by a crash, a lower high and further downward momentum.
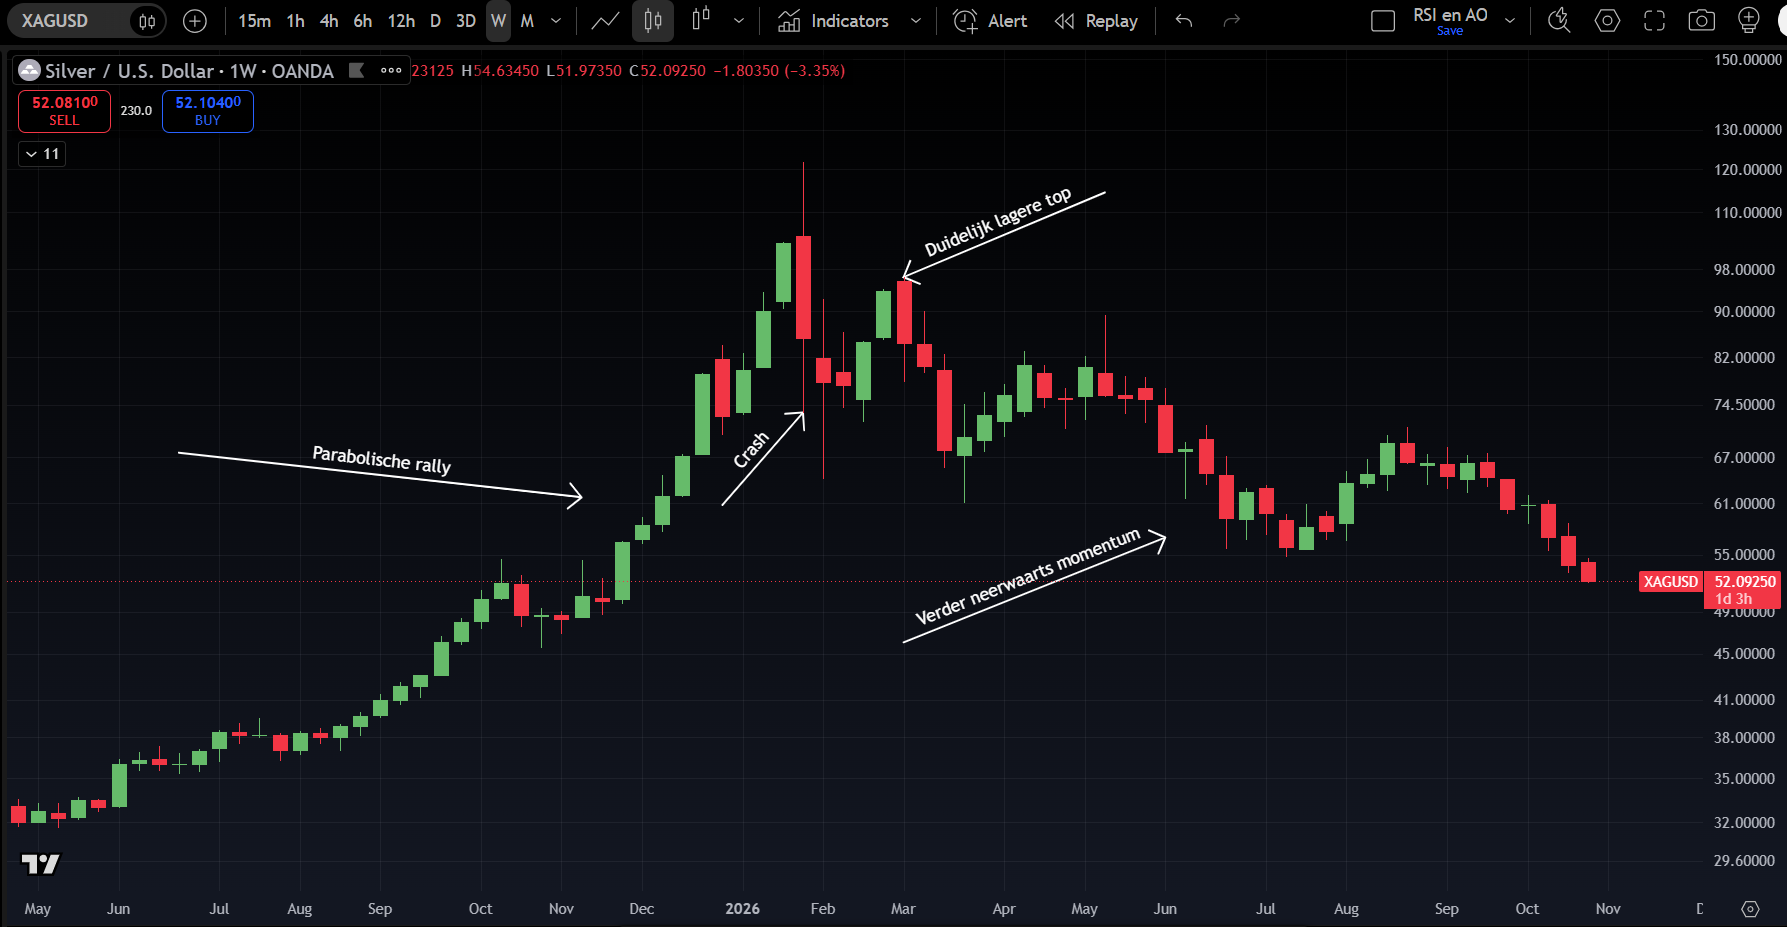
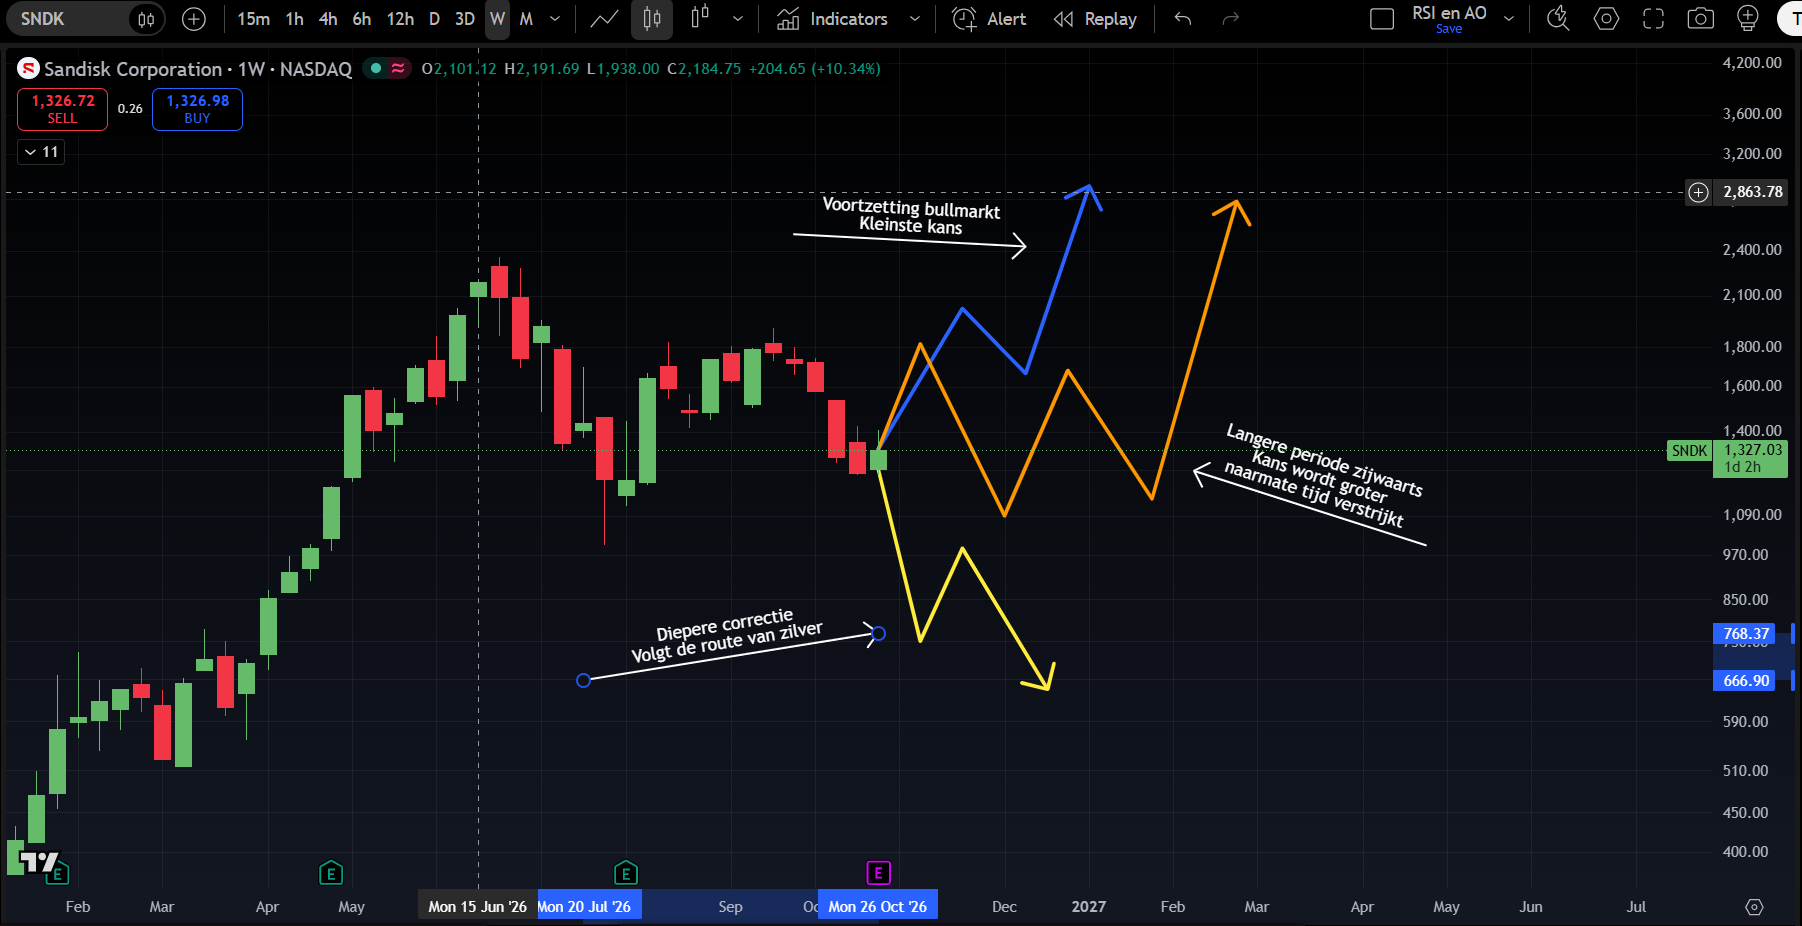
Of course, there's a chance that a higher low will form relative to late July and that new highs will follow. Given the lower low on the weekly chart and the clearly visible lower high, however, this scenario is less likely.
A third option is that the price moves sideways for an extended period before eventually resuming its uptrend. The odds of this grow as time passes without another lower low being set in the meantime.
The three scenarios above are illustrated in the images below, with a further correction (through time or through price) being the most likely outcome.
Wrapping up
All previous editions of Alpha Markets are available in the archive. Questions, comments and suggestions are always welcome in the community.
Thank you for reading!
To stay informed about the latest market developments and insights, follow our team members on X:
- Bart Mol (@Bart_Mol)
- Peter Slagter (@pesla)
- Bert Slagter (@bslagter)
- Mike Lelieveld (@mlelieveld)
We appreciate your continued support and look forward to bringing you more comprehensive analysis in our next edition.
Until then!