Bitcoin Rewards Patience
Bitcoin price outlook 2026: why patience pays off. Analyzing trends, bear market dynamics, and scenarios for the next top — what does this mean for investors?

Sam
Historically, Bitcoin has always rewarded investor trust. For those who bought the top of a bull market, it probably didn't feel that way for a long time — but eventually, even they were rewarded with higher prices.
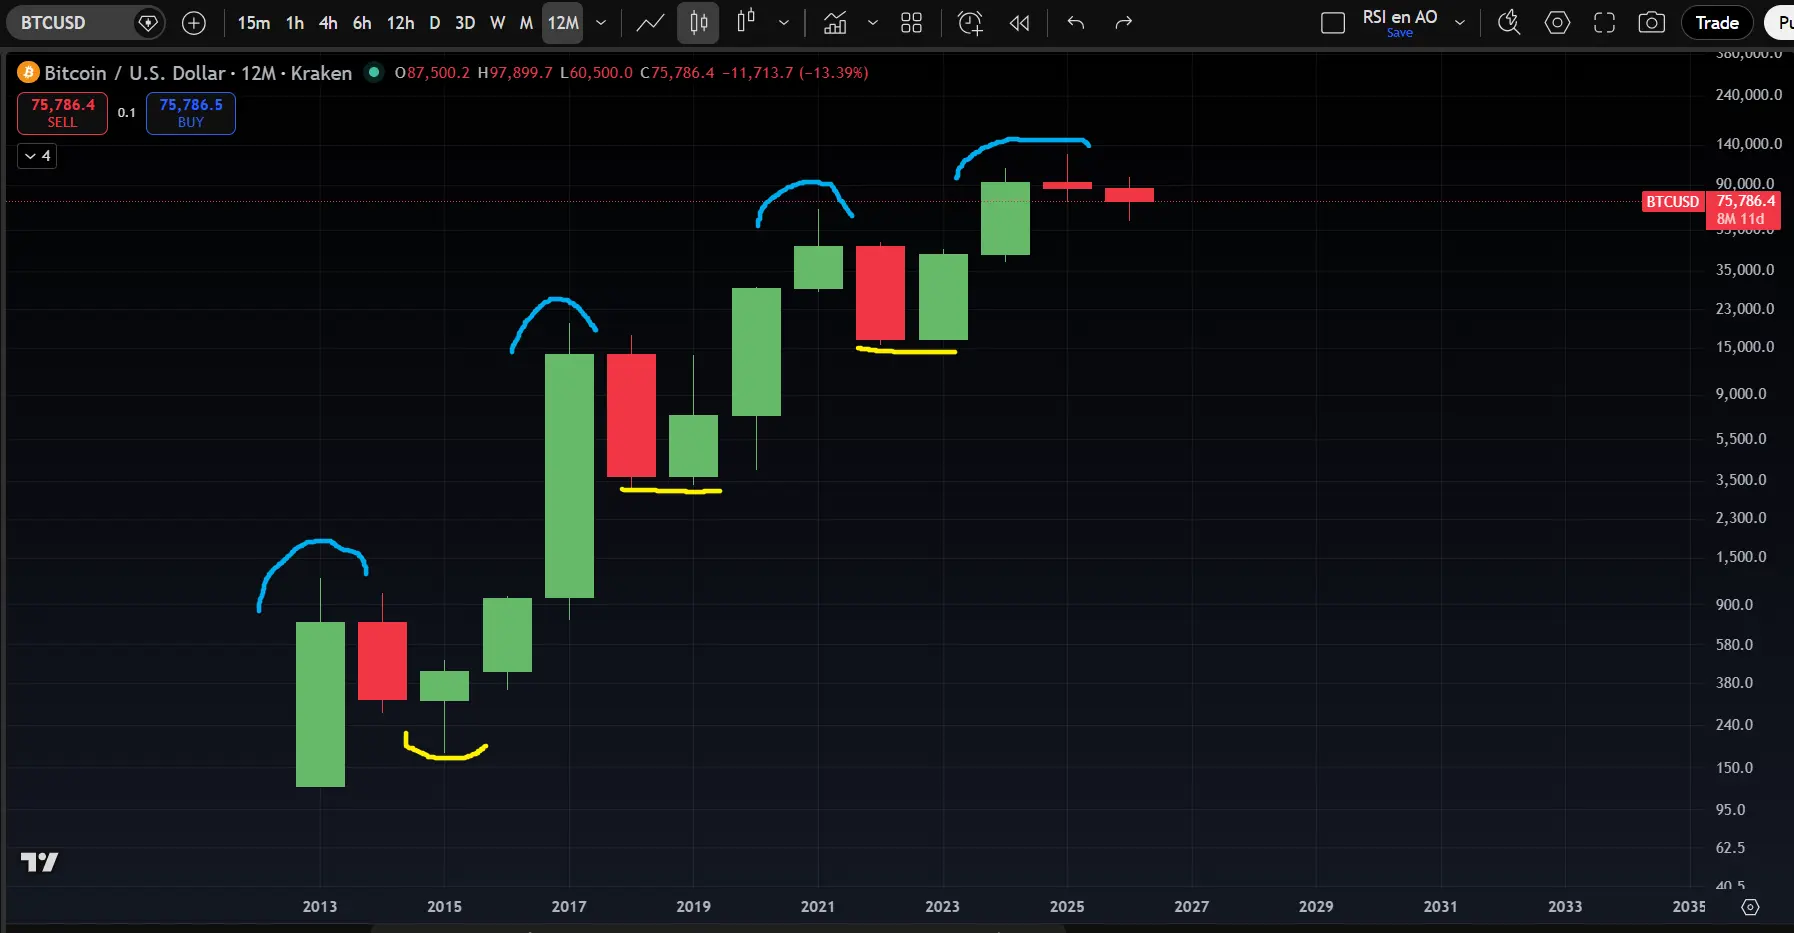
That said, the rewards have been getting progressively smaller in percentage terms due to diminishing returns. Those who bought Bitcoin's 2013 top at around $1,200 were rewarded in 2017 with a price of $20,000 — a gain of over 1,500%.
That was considerably more than the 250% rise Bitcoin made between the 2017 top and the 2021 top (from $20,000 to $70,000). In that regard, this trend continued during the last bull market with the somewhat disappointing top of $126,000.
Although this higher top may have been disappointing in percentage terms, the key takeaway is that it was still higher than the previous top. Not only has every bull run produced higher highs, but every bear market bottom has also been higher than the one before.
Higher highs and higher lows are the hallmark of an uptrend. This uptrend is clearly visible on Bitcoin's yearly chart, and as long as the price doesn't drop below $16,000 during this bear market, the uptrend remains fully intact.
A fundamental principle in technical analysis is that a trend tends to continue — and that's one of the key reasons it pays to remain optimistic about Bitcoin's future price.
While we can be optimistic over a multi-year horizon, the shorter timeframes signal that we'll need to be patient before seeing a new top.
Let's start with the monthly chart. In 2013 and 2017, the final phase of the bull market was so powerful that the market structure on the monthly chart was never broken during the subsequent bear market. In June 2022, for the first time, a lower low became visible on the monthly chart, partly as a result of the Luna implosion. The monthly close was around $20,000, close to the bottom of roughly $16,000.
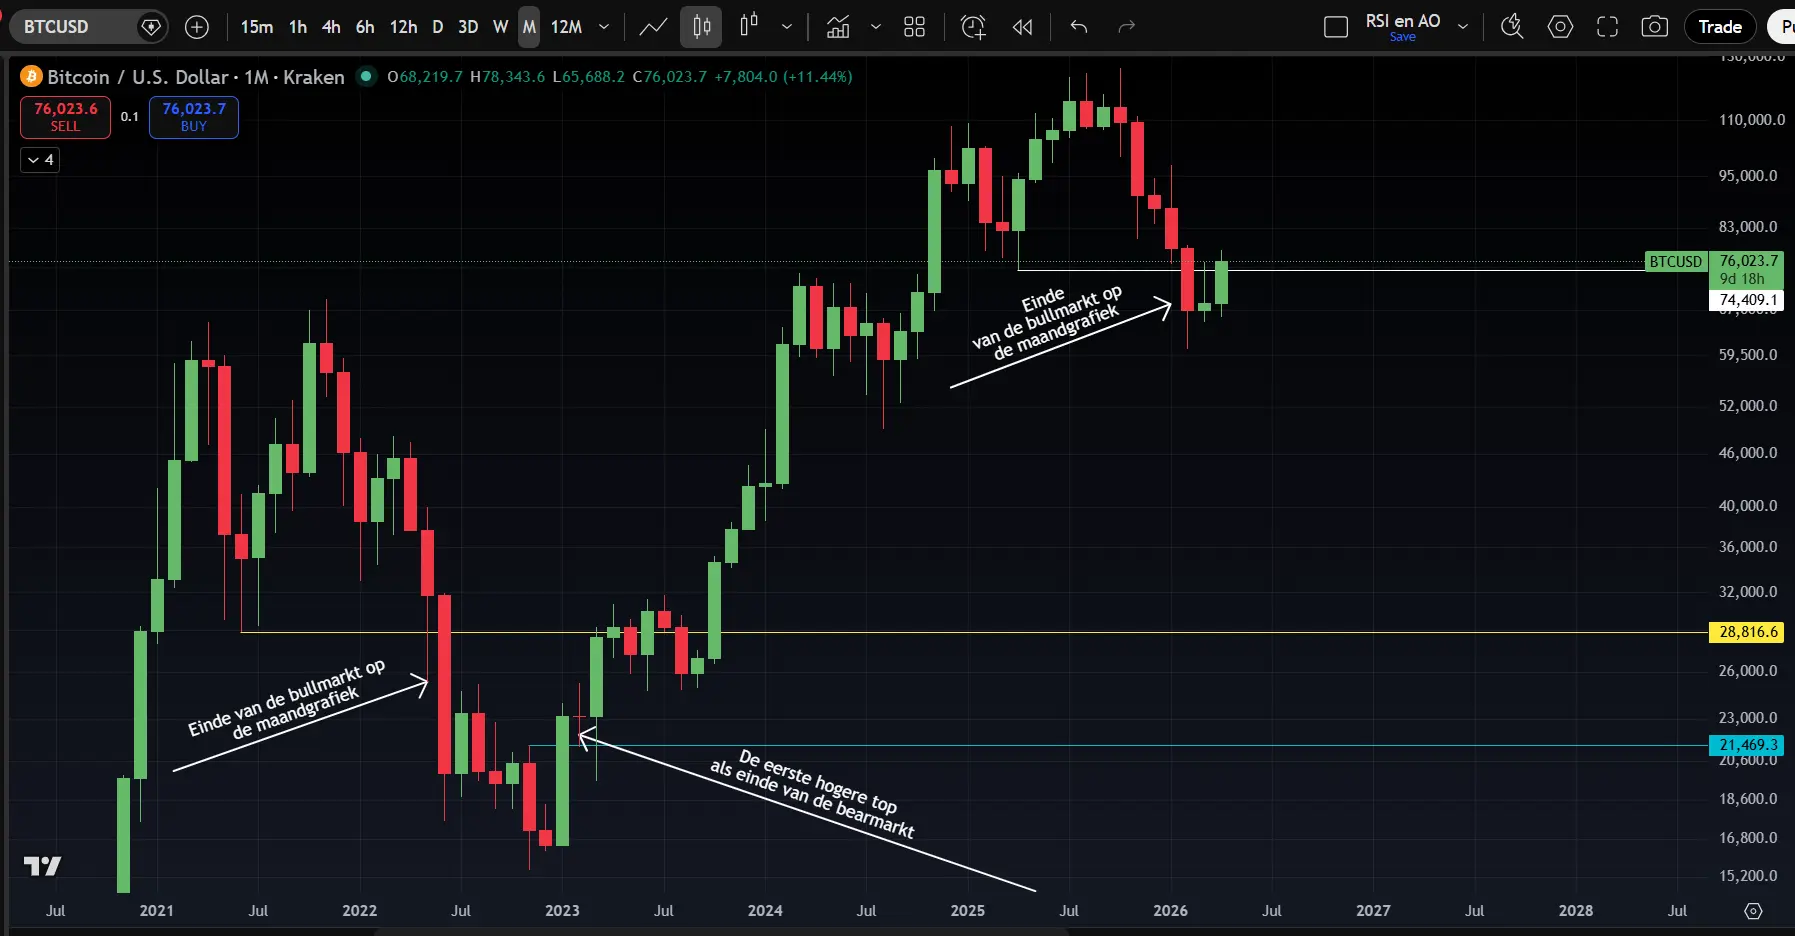
If we set aside the minimal price difference between last October and August 2025, then February 2026 also marks the first lower low on the monthly chart for this bear market. Our base case remains a mild bear market with an expected bottom around $50,000 to $60,000. If you had a plan to sell on a monthly close below the $74,000 low, you may have already captured the lion's share of the decline. That sounds far from ideal.
On the upside, a higher high only forms with a monthly close above $97,000. So while it's useful to understand what the monthly chart is telling us, acting on it feels a bit like closing the barn door after the horse has bolted, given the large price distances involved.
For the most actionable information, we need to move to the weekly chart. We'll do that after the break, where you'll also find two insights from our macro analyst Thom — one on the inflation threat hanging over the market, and one on a regime change at the U.S. central bank.
Alright, time for the promised step down to the weekly chart. It's a highly interesting one for several reasons:
- False breakouts are often followed by a strong move in the opposite direction;
- Nearly every clear top or bottom on the weekly chart is preceded by a false breakout;
- It filters out the noise from smaller, news-driven moves.
Let's start with the first point. An example of such a false breakout is a swing failure pattern (SFP). In this pattern, the price briefly spikes above (or below) a previous high or low, then quickly reverses. It looks like the price is breaking through, but it turns out to be a "false breakout."
In the image below, you can see the weekly chart. Since the April 2021 top, yellow lines indicate that nearly every reversal was preceded by an SFP. Something else also stands out, marked with white arrows: often when these lows were left intact, they were revisited at a later point.
Since Bitcoin has left the clear lows intact since early February, this serves as a strong argument that the current rally will ultimately end with a move back toward $60,000. "History doesn't repeat itself, but it often rhymes," as Mark Twain reportedly wrote decades ago.
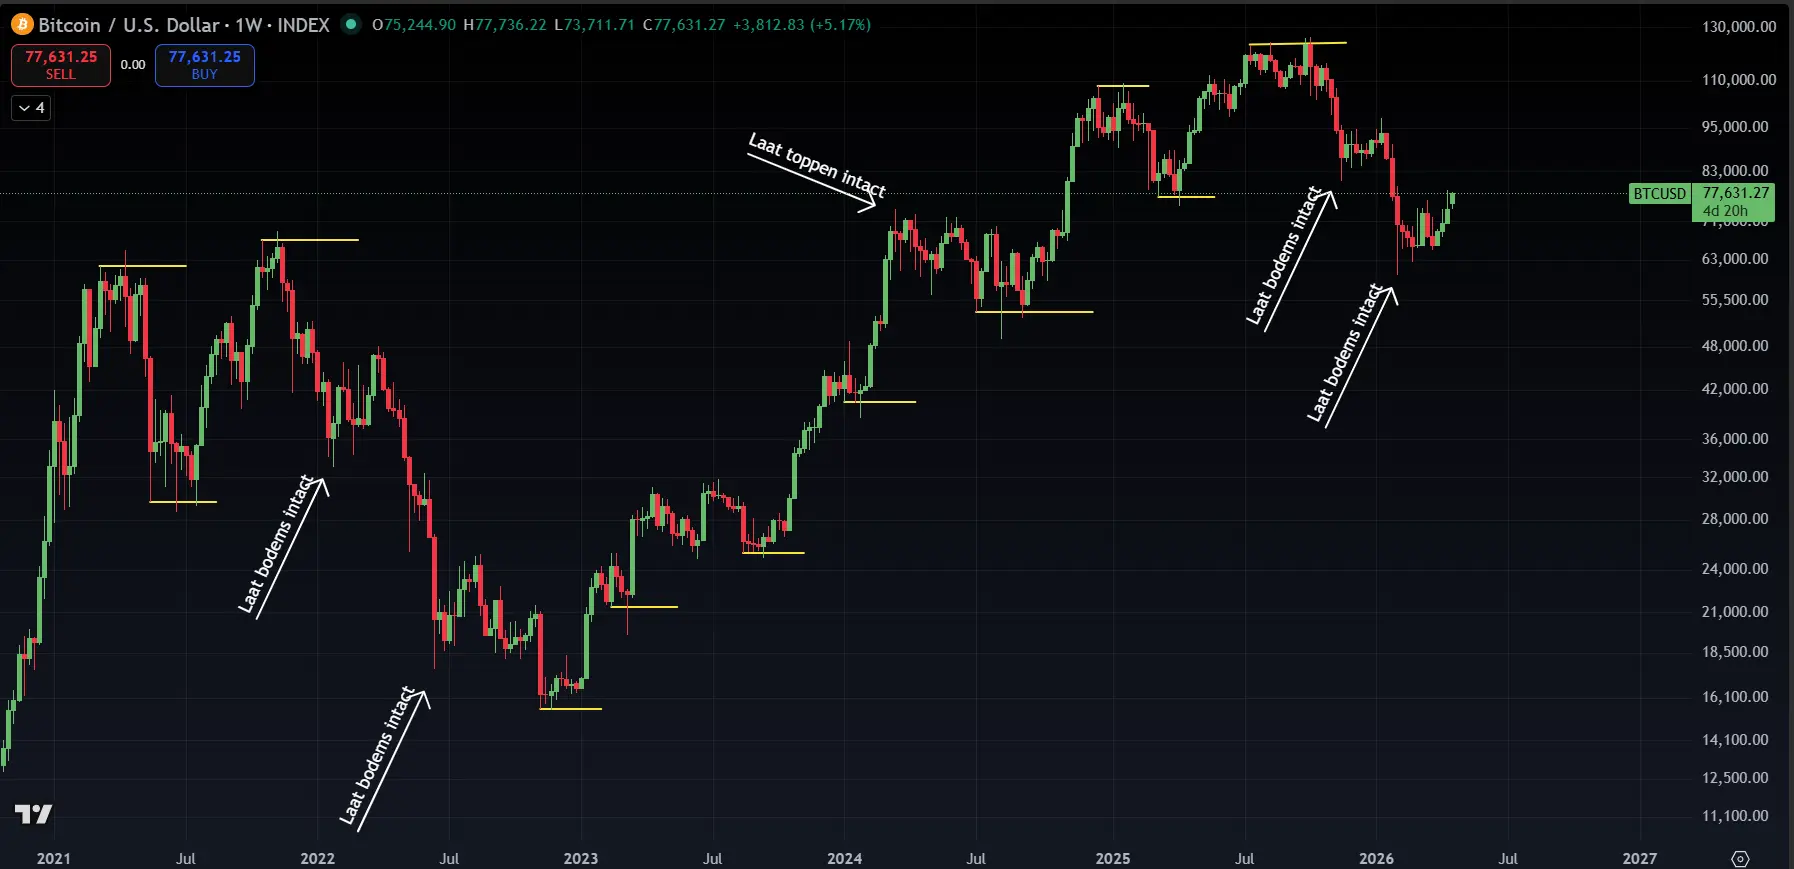
When an SFP at a top is followed by a lower low, this typically leads to a significant move. The same applies in reverse at a bottom. Unlike the monthly chart, this warning becomes visible earlier, and anticipating it can protect against a large portion of the decline when a deeper correction begins. Below, the higher high/lower low is marked with blue lines, along with what happened next.
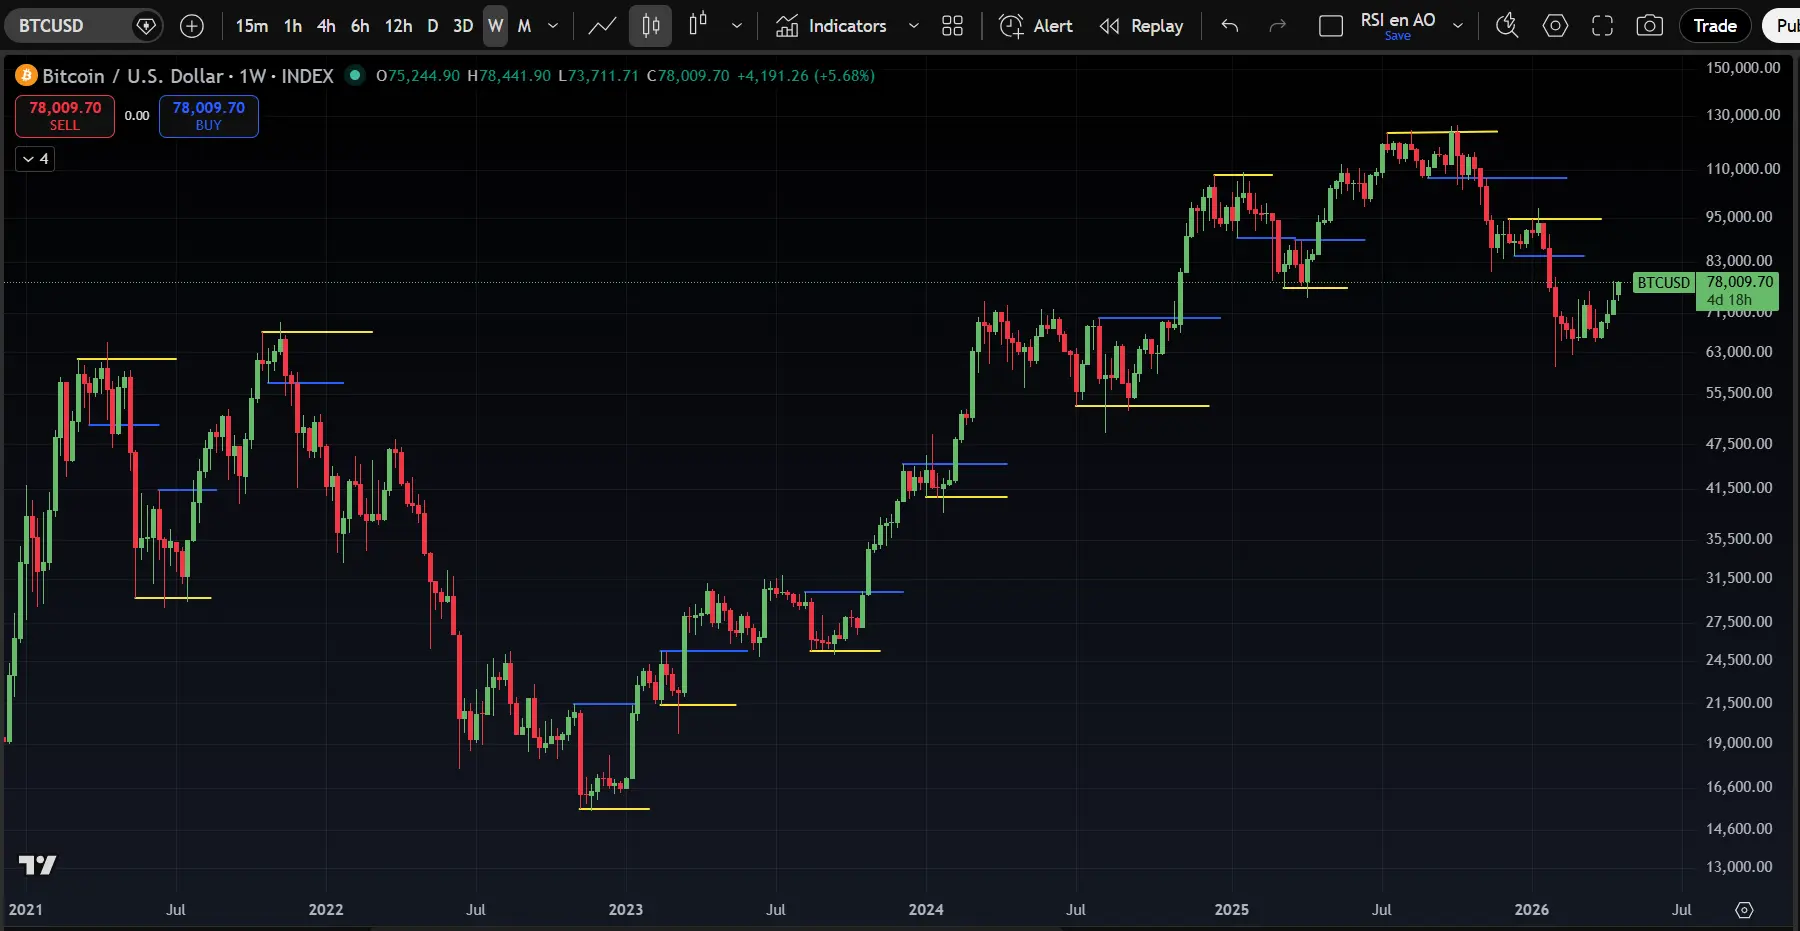
In short, the weekly chart often provides reliable signals. It frequently marks the beginning of a trend reversal or continuation and therefore offers enough room to act on. Finally, there's typically enough time for traders to digest news or economic data before the weekly close, which filters out a significant amount of noise.
As mentioned, our base case is that the price will pull back toward $60,000 in the coming months. A higher high on the weekly chart would be a strong indication that we need to revise our base case. However, this only comes into play with a weekly close above $98,000. Whichever of these scenarios plays out in the coming weeks or months, the underlying thesis remains that we expect a higher top to be set in the next bull market. That's why it pays to maintain a long-term bullish outlook on Bitcoin's price.
In other words: Bitcoin rewards patience.
1️⃣ Inflation looms, but U.S. stock market keeps climbing
Thom
While the Iran war still hangs over the world like a dark cloud, the S&P 500 and Nasdaq hit new all-time highs this month. That's causing bewilderment among analysts, who point out that the U.S. economy is starting to crack in certain areas.
If you look at so-called Retail Sales, the revenue figures from U.S. retail, the numbers don't look particularly alarming at first glance. But they mask the reality. Adjusted for inflation, they've declined for four consecutive months.
Correct. After making proper price adjustments, consumption is no great shakes. Apparel prices rose. Sales at clothing stores? Flat. Food away from prices? Up. Sales at restaurants? Up a tenth. https://t.co/WOhubvusRO
— RenMac: Renaissance Macro Research (@RenMacLLC) April 21, 2026
At the same time, observers point to the fact that the Iran war — potentially one of the biggest energy crises ever — remains unresolved.
Yet the U.S. stock market appears to be shrugging it off entirely. The record highs stand in stark contrast to the clearly weaker performance on European and Australian exchanges, where the energy crisis seems to weigh more heavily on investor sentiment.
Is it just a matter of time before the energy crisis makes itself felt on the U.S. market as well? S&P 500 companies generate roughly 40 percent of their revenue abroad. This supports the idea that markets are overly optimistic and that the real shock is yet to come.
Markets seem to be positioned as though the Iran war will ultimately fizzle out without major consequences for energy markets.

While I believe we need to take this narrative seriously, I also lean toward the more positive scenario. In Bitcoin's case, that doesn't necessarily mean the bear market is over. Still, I consider it unlikely that Bitcoin will seek out a much deeper bottom. In that sense, I'd argue that we're moving closer to the end of the bear market rather than a further extension of it.
The longer the Iran threat persists, the more seriously we need to consider the scenario of a new wave of inflation. However, I think central banks are — and will remain — reluctant to intervene with rate hikes, out of fear of pushing the economy into a recession.
When forced to choose between recession and inflation, history shows that policymakers more often opt for inflation. There's now an additional argument for this, since the Iran conflict could theoretically end tomorrow — making central banks even more cautious about raising rates.
As a result, there's currently downward pressure on real interest rates, as I also discussed in last week's Markets. You get the real rate by subtracting inflation from market interest rates.
When the real rate drops toward zero or even turns negative, it forces investors to take on more risk to protect their capital. For me, this is a key explanation for the rally we're currently seeing in the markets — a rally that many analysts find baffling based on the economic data alone.
That's not to say they don't have a valid point, but the market apparently believes that other factors carry more weight right now. The AI narrative, for instance, with its — to put it mildly — very impressive credit flows.
All things considered, I'm inclined to believe that the current rally is more fundamental and sustainable than many analysts think. That doesn't mean a new Bitcoin bull market starts tomorrow, but the odds of one are increasing.
2️⃣ New Fed chair signals regime change at the U.S. central bank
Thom
During his hearing before the Senate, Kevin Warsh — Donald Trump's nominee to succeed Jerome Powell — made clear that he wants to take the Federal Reserve in a different direction. He advocated for a new inflation framework, less communication with markets, a smaller balance sheet, and closer collaboration with the Treasury Department.
Fed policy is set for structural change
According to Warsh, the post-pandemic inflation wave wasn't bad luck — it was the result of bad policy. With this, he explicitly distances himself from the Powell era. He presents his arrival as more than a routine changing of the guard. In his view, the Fed is on the cusp of a genuine regime change.
Notably, Warsh sees room for lower rates while simultaneously wanting to shrink the central bank's balance sheet. This would represent a break from the pattern markets have grown accustomed to, as rate cuts would no longer automatically coincide with increased liquidity.
He also wants to do away with forward guidance — meaning less market steering through speeches and projections, and more room for debate and uncertainty within the Fed. This could make future rate decisions less predictable. For markets, that's significant, since a different monetary regime can directly affect rate expectations, the dollar, and risk assets like stocks and Bitcoin.
New inflation metrics could prompt the Fed to act sooner
Warsh also believes the current inflation metrics fall short. He wants to place greater emphasis on real-time data and measures that filter out temporary price shocks. This would mean the Fed puts less weight on temporary spikes in, for example, oil and food prices.
That opens the door to earlier rate cuts, as long as underlying inflation pressure remains contained. For investors, this is relevant because it could allow the credit cycle to run longer — which is theoretically a positive development for Bitcoin.
AI plays a key role in Warsh's vision
Warsh placed notable emphasis on artificial intelligence and the supply side of the economy. He believes AI can structurally boost productivity and thereby raise the growth capacity of the United States.
If that scenario plays out, inflationary pressure could ease and even tip into deflation in some sectors. In that case, the Fed would have more room to cut rates sooner. For markets, that would be a powerful scenario: higher productivity, lower inflation, and potentially falling real rates.
The fact that Warsh believes in this narrative could be enough in the coming years for Bitcoin and other risk assets to benefit from it.
The bottom line is that we're seeing a number of signals suggesting that the Federal Reserve under Warsh could be quite positive for financial markets. However, the effect of Warsh's desired balance sheet reduction does raise a big question mark.
That said, I find it hard to believe that a chair chosen by this Trump would pursue policies that act as a headwind for risk assets.
In closing
All previous editions of Alpha Markets are available in the archive. Questions, comments, and suggestions are always welcome in the community.
Thank you for reading!
To stay informed about the latest market developments and insights, follow our team members on X:
- Bart Mol (@Bart_Mol)
- Peter Slagter (@pesla)
- Bert Slagter (@bslagter)
- Mike Lelieveld (@mlelieveld)
We appreciate your continued support and look forward to bringing you more comprehensive analysis in our next edition.
Until then!