
Bitcoin Posts Biggest Weekly Gain Ever
Bitcoin climbed above $81,000 this week, its highest price since May. That puts us right on the border between bear and bull market!

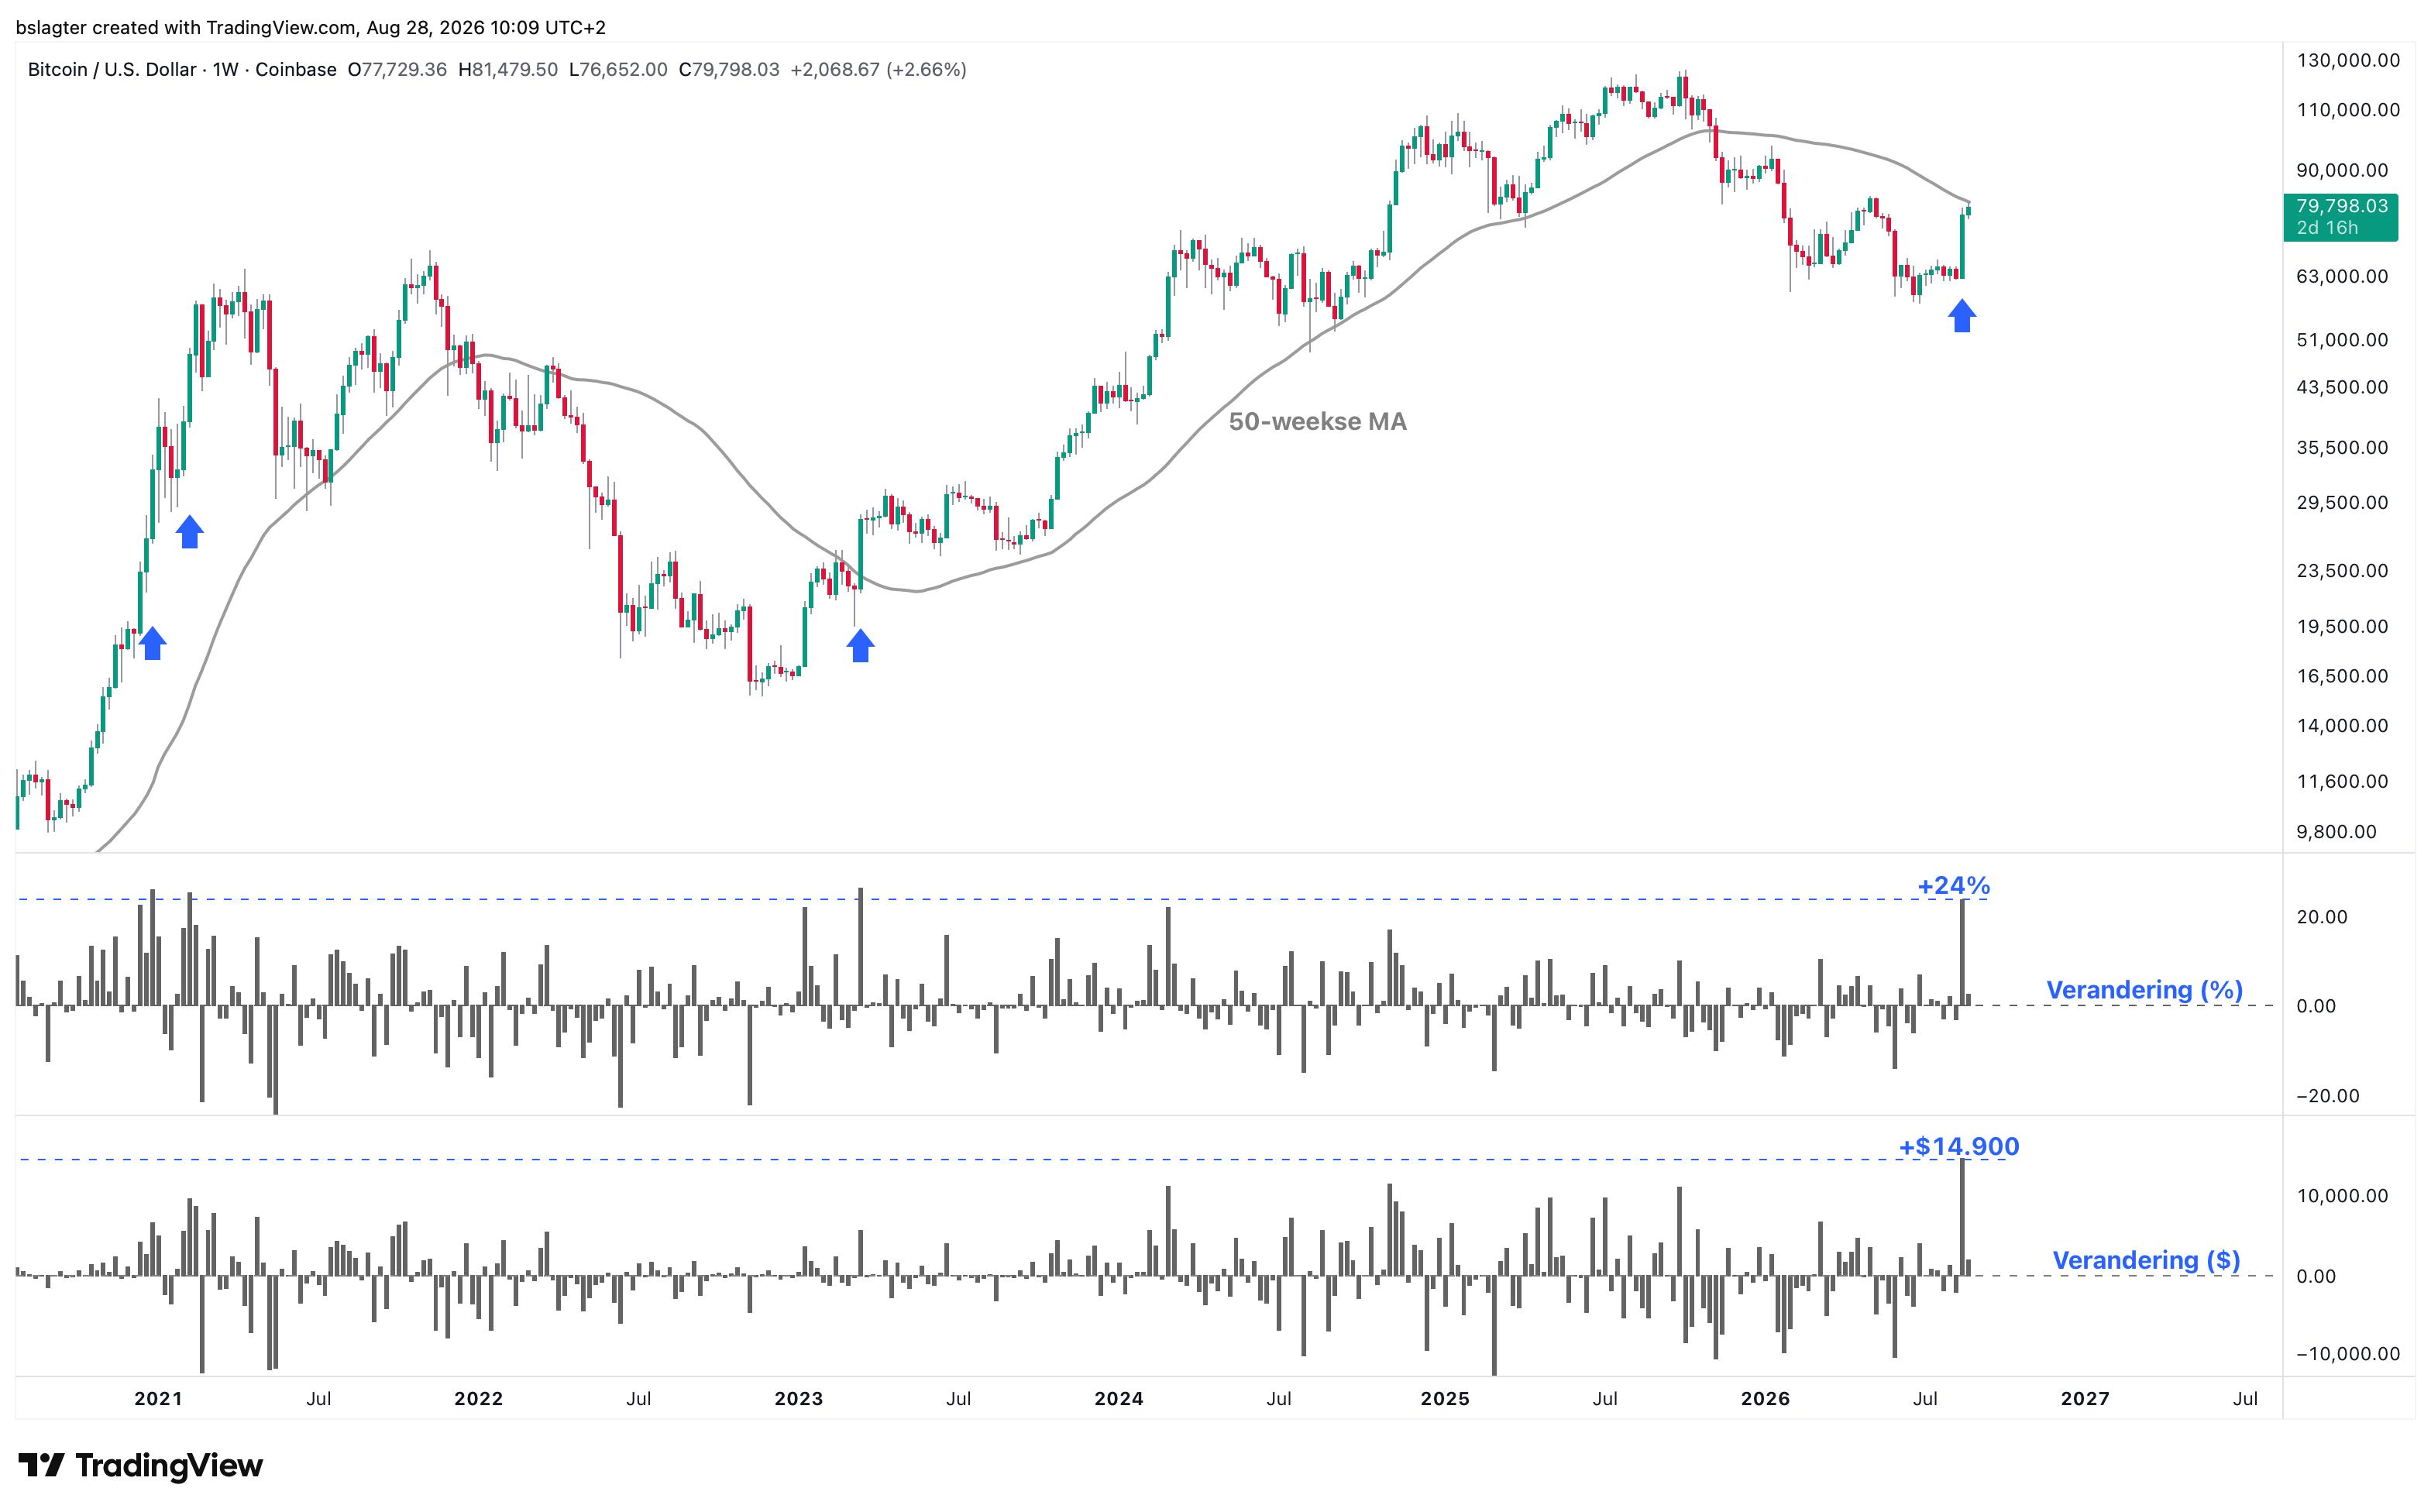
Last week, bitcoin surged 24% from $62,800 to $77,700. In percentage terms, that's the biggest jump since March 2023, when bitcoin leapt from 22k to 28k in a single week following the collapse of Silicon Valley Bank. In dollar terms, the nearly $15,000 weekly gain is actually the largest ever.
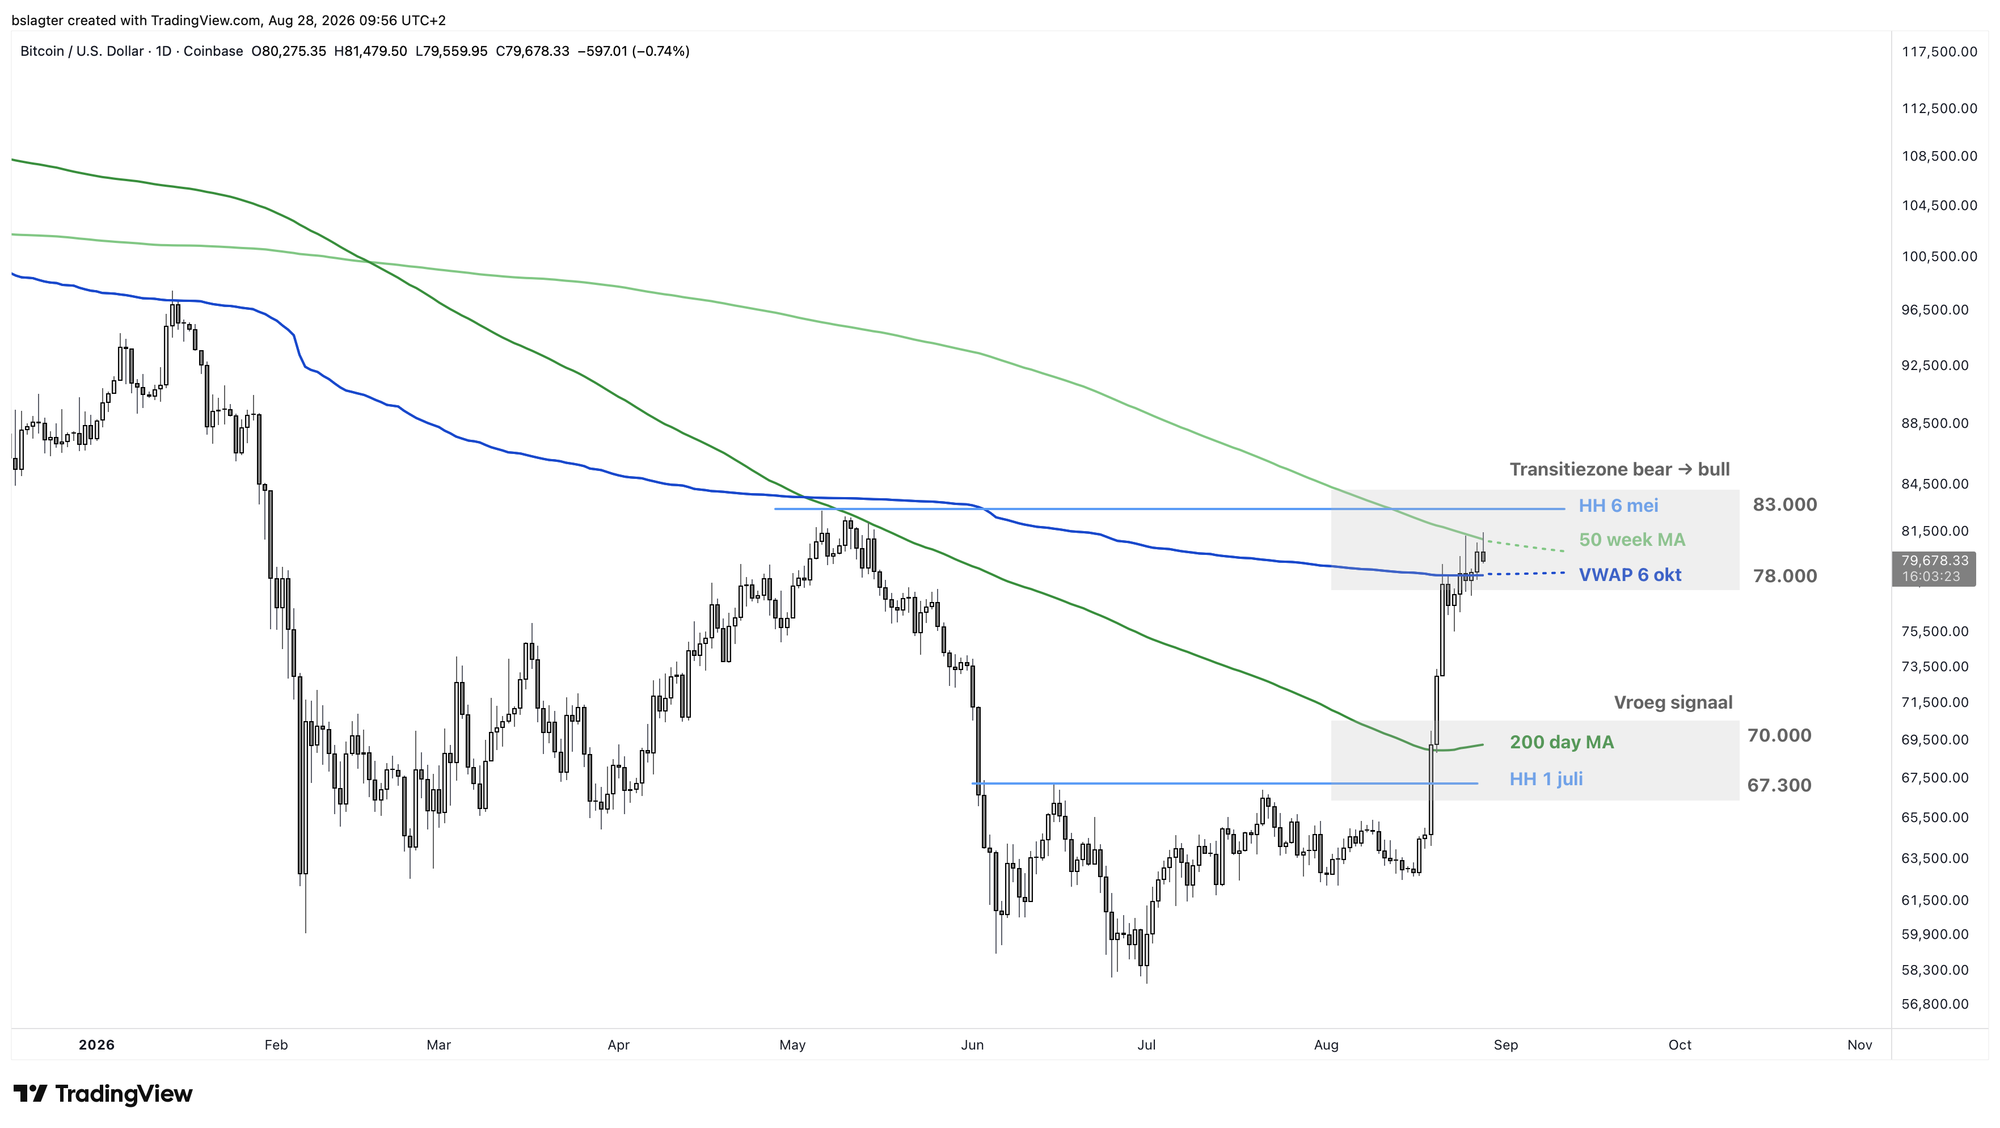
We hit the highest point early this morning, when the price briefly climbed above $81,000. That's above the 200-day moving average and above the volume-weighted average price (VWAP) measured from the top of the previous bull market. This marks a serious assault on the bear market's downtrend.
But we're not there yet. We're still below the $82,800 from May 6, the previous top on the weekly chart. And we haven't yet seen a weekly close above the 50-week moving average, currently at $81,000.
On the chart from the July 17, July 24, and August 14 editions of Markets, we blew right through the “early signal” zone with flying colors, and now we're stuck in the transition zone from bear to bull market. You could say it's hardly surprising that we're running into a bit of resistance here.
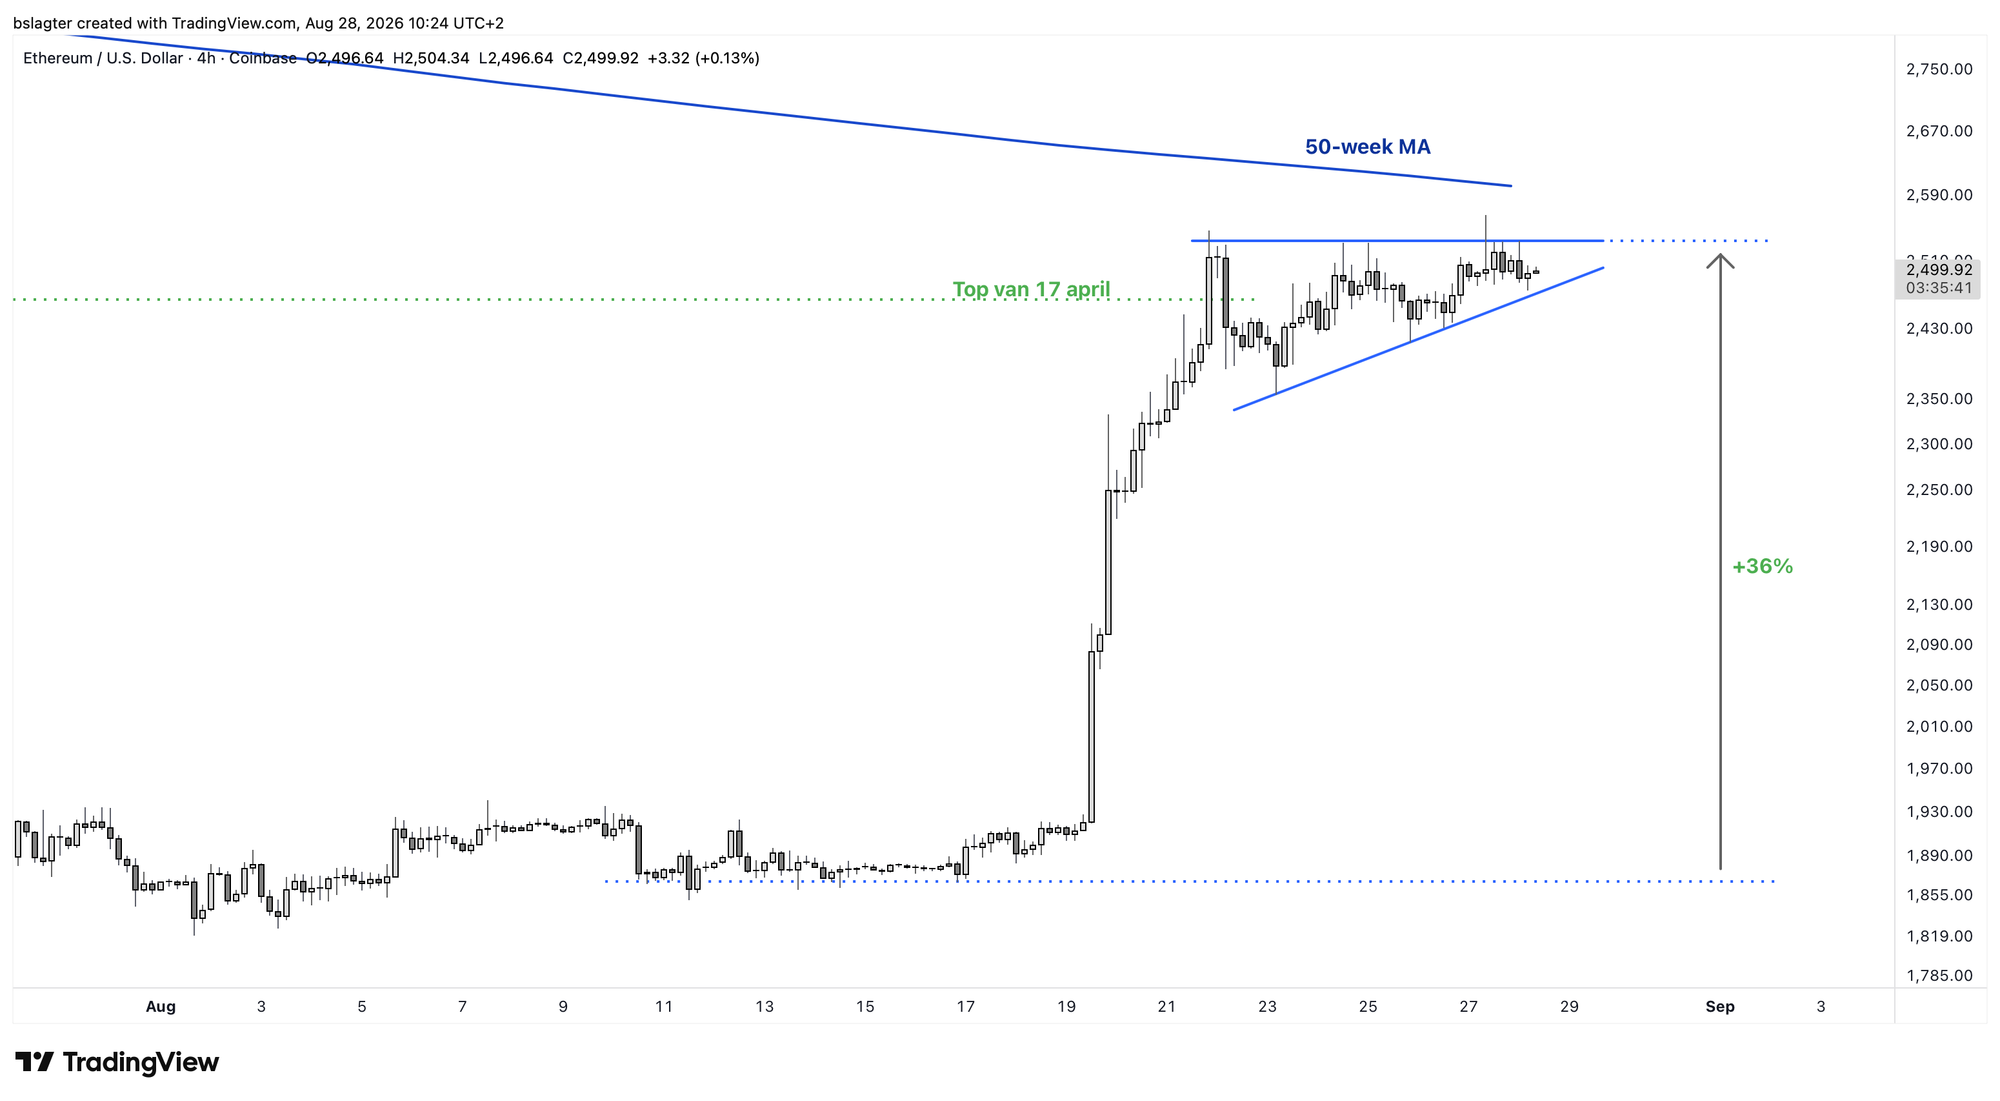
Ether is playing a notable role. Late last week, during the sharpest part of the rally, the Ethereum network's coin led the charge. And while bitcoin is still waiting for its first higher high (HH) on the weekly chart, ether has already posted one. At $2,550 last Friday, its price was already above the $2,460 from April 17.
On ether's chart, we're seeing a nice consolidation pattern. The market is digesting the recent price rally. Players are taking profits, but there are plenty of interested buyers ready to scoop up their ETH. This is how a market can cool off without a significant correction.
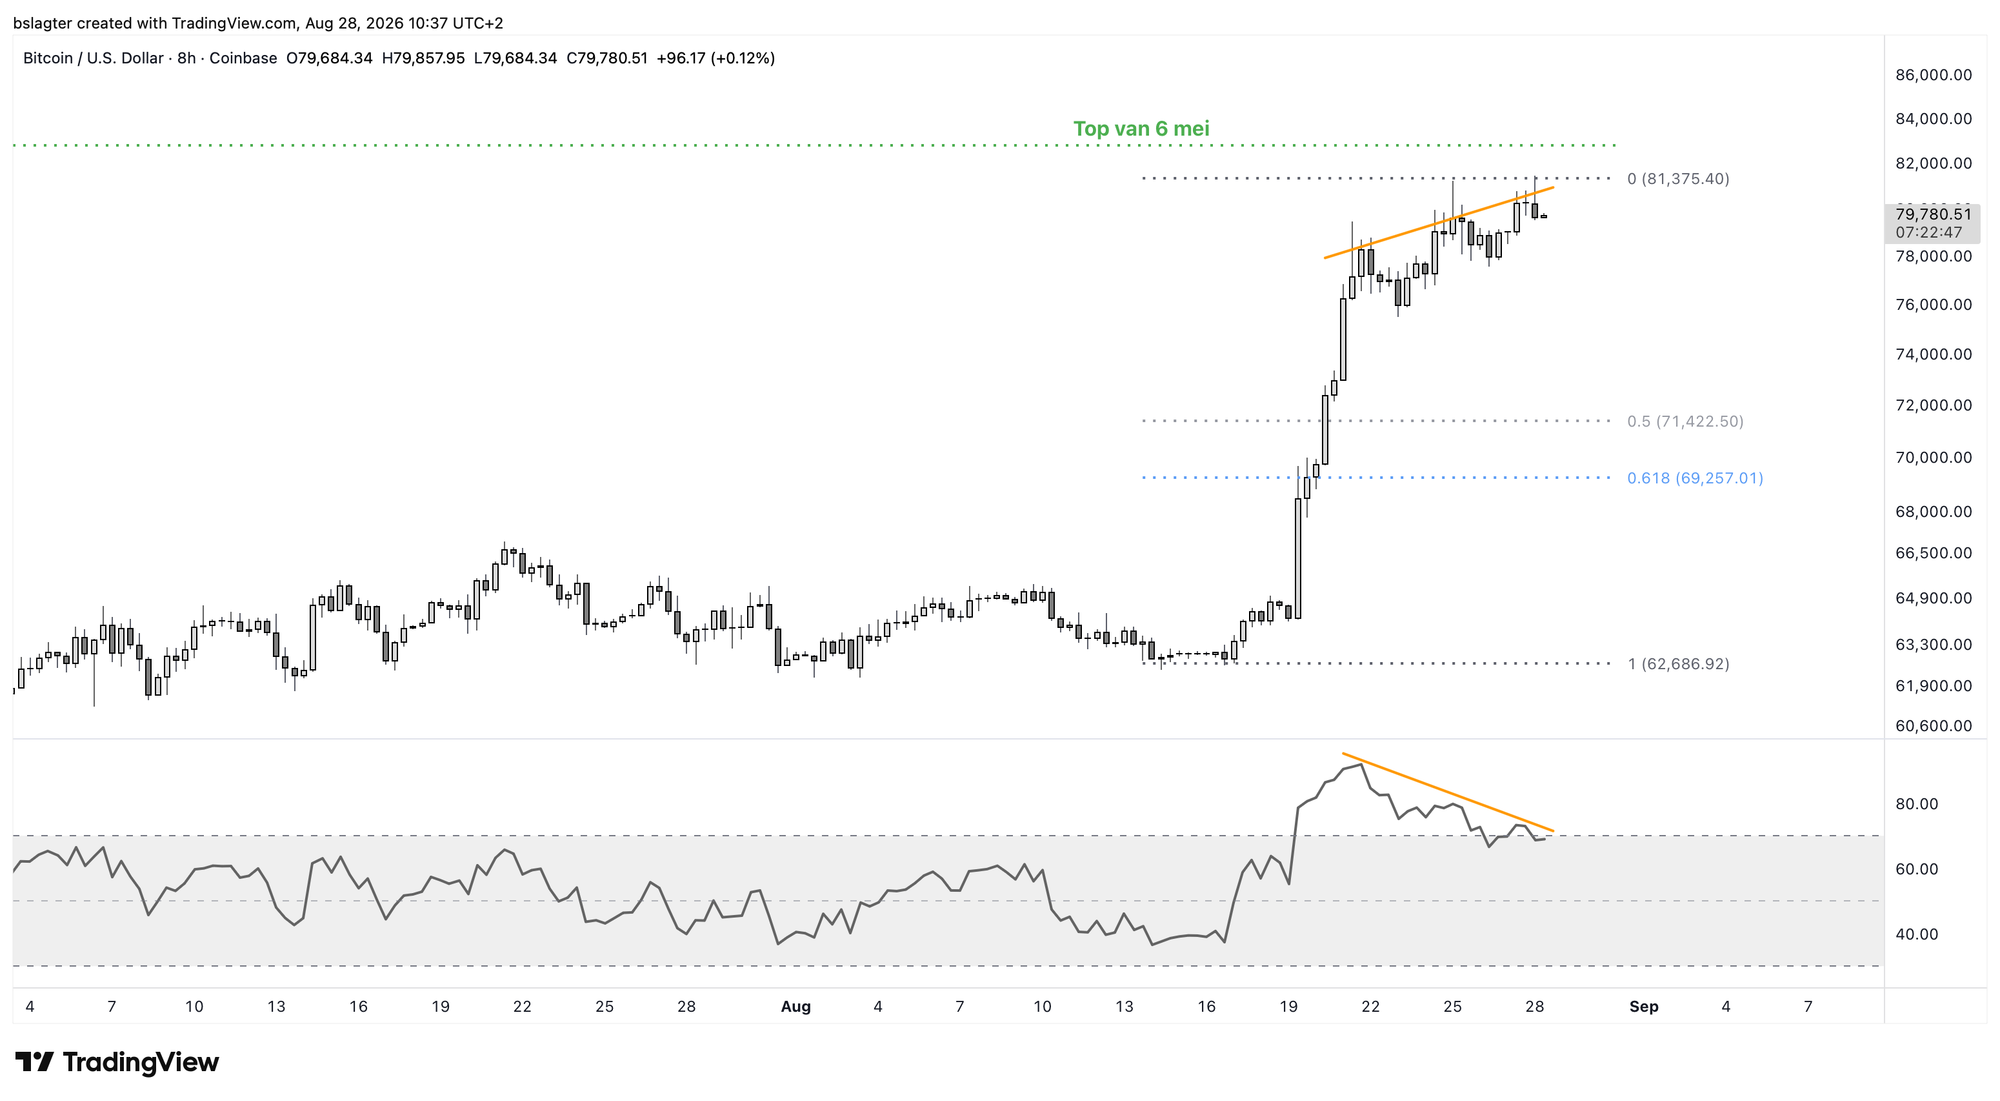
That correction may still be coming. With bitcoin, we're seeing the price struggle to push much higher while momentum is fading. This negative divergence shows up on all sorts of lower timeframes (2h, 4h, 8h, 12h), but it's most pronounced on the 8-hour chart.
That's a harbinger of a correction, in the sense that it's the most likely outcome. If the price hovers around $80,000 and then breaks out to the upside without a correction, that would be a sign of great strength. Especially after last week's monster rally.
In June and July, we noted that the bitcoin market had a different character than in the first quarter. We were clearly no longer in the first phase of the bear market, where capitulations follow one after another and investors sell in panic and at a loss.
Over the past two weeks, we've seen the first signals that this bear market's downtrend is coming to an end. High time to take a closer look at the probabilities of our scenarios!
We'll continue with the following topics for our Alpha Plus members:
- Scenarios and probabilities (Bert)
- The buyback plan after the breakout (Sam)
- Nvidia surprises once again, market reaction becomes key
- There is no serious alternative to the US dollar
1️⃣ Scenarios and probabilities (Bert)
 Contribution by
 Bert
On November 14, 2025, I laid out four bear market scenarios:
- Resumption of the bull market: 30%
- A period of sideways movement: 40%
- A mild bear market: 20%
- A deep bear market: 10%
I adjusted the probabilities during the first few months whenever new information became available.
On February 6, 2026, I definitively dropped the possibility that we'd soon resume the bull market:
- Continuation of the bull market: 0%
- A period of sideways movement: 20%
- A mild bear market: 60%
- A deep bear market: 20%
A mild bear market—that was my base case by a wide margin. Always accompanied by this chart:
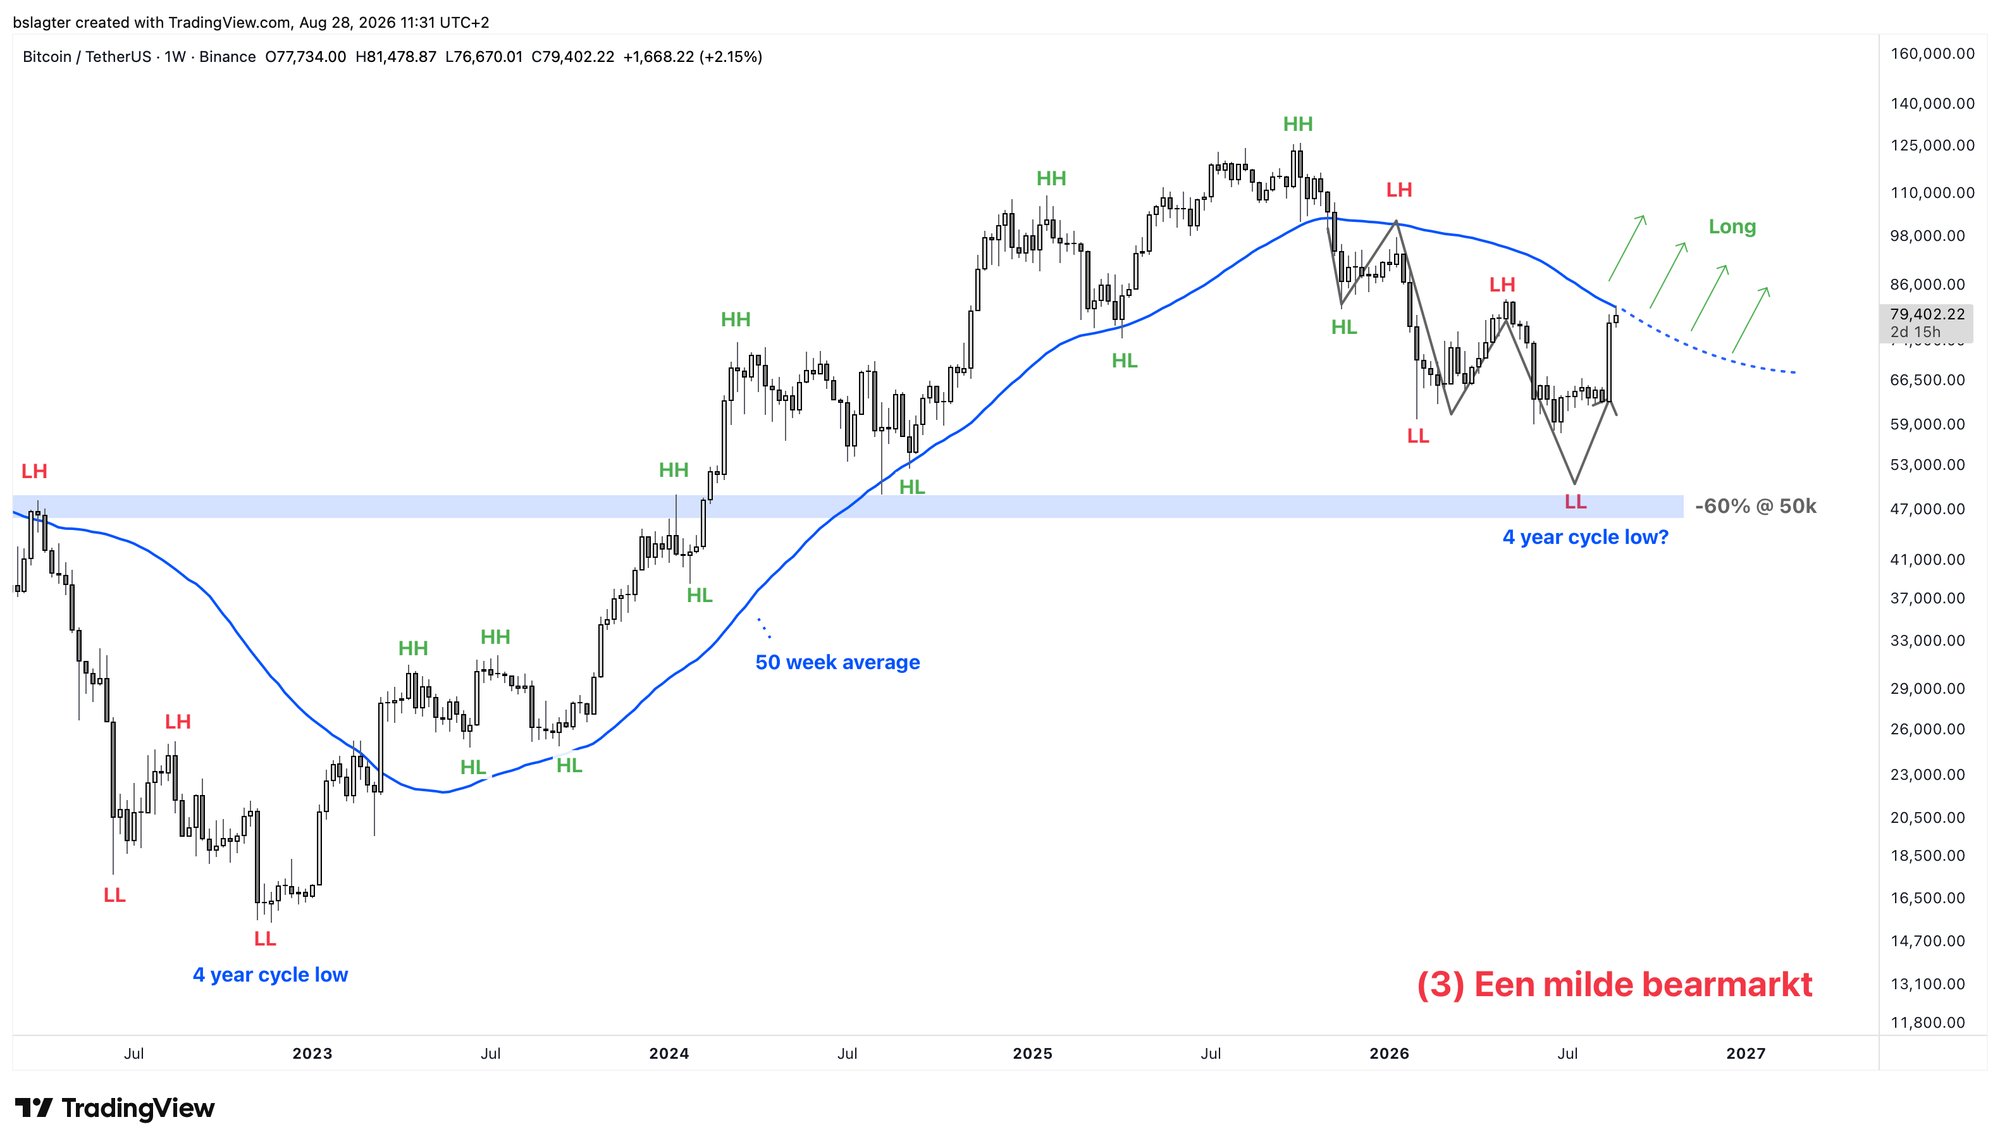
In that base case, we've now arrived at the transition from bear market to a new bull market. The downtrend is weakening and a new uptrend is emerging. This is a process that takes months.
The July 1 bottom as the lowest point would fit perfectly, but a slightly lower bottom somewhere in the coming months wouldn't be out of place either.
Only if the bottom doesn't come until 2027, or if the price drops below $48,000, would we enter “deep bear market” territory. Based on today's data, I give that a small probability of 10%.
So I'm 90% certain that we're in the transition from bear to bull. But have we already seen the bottom, or is it still to come?
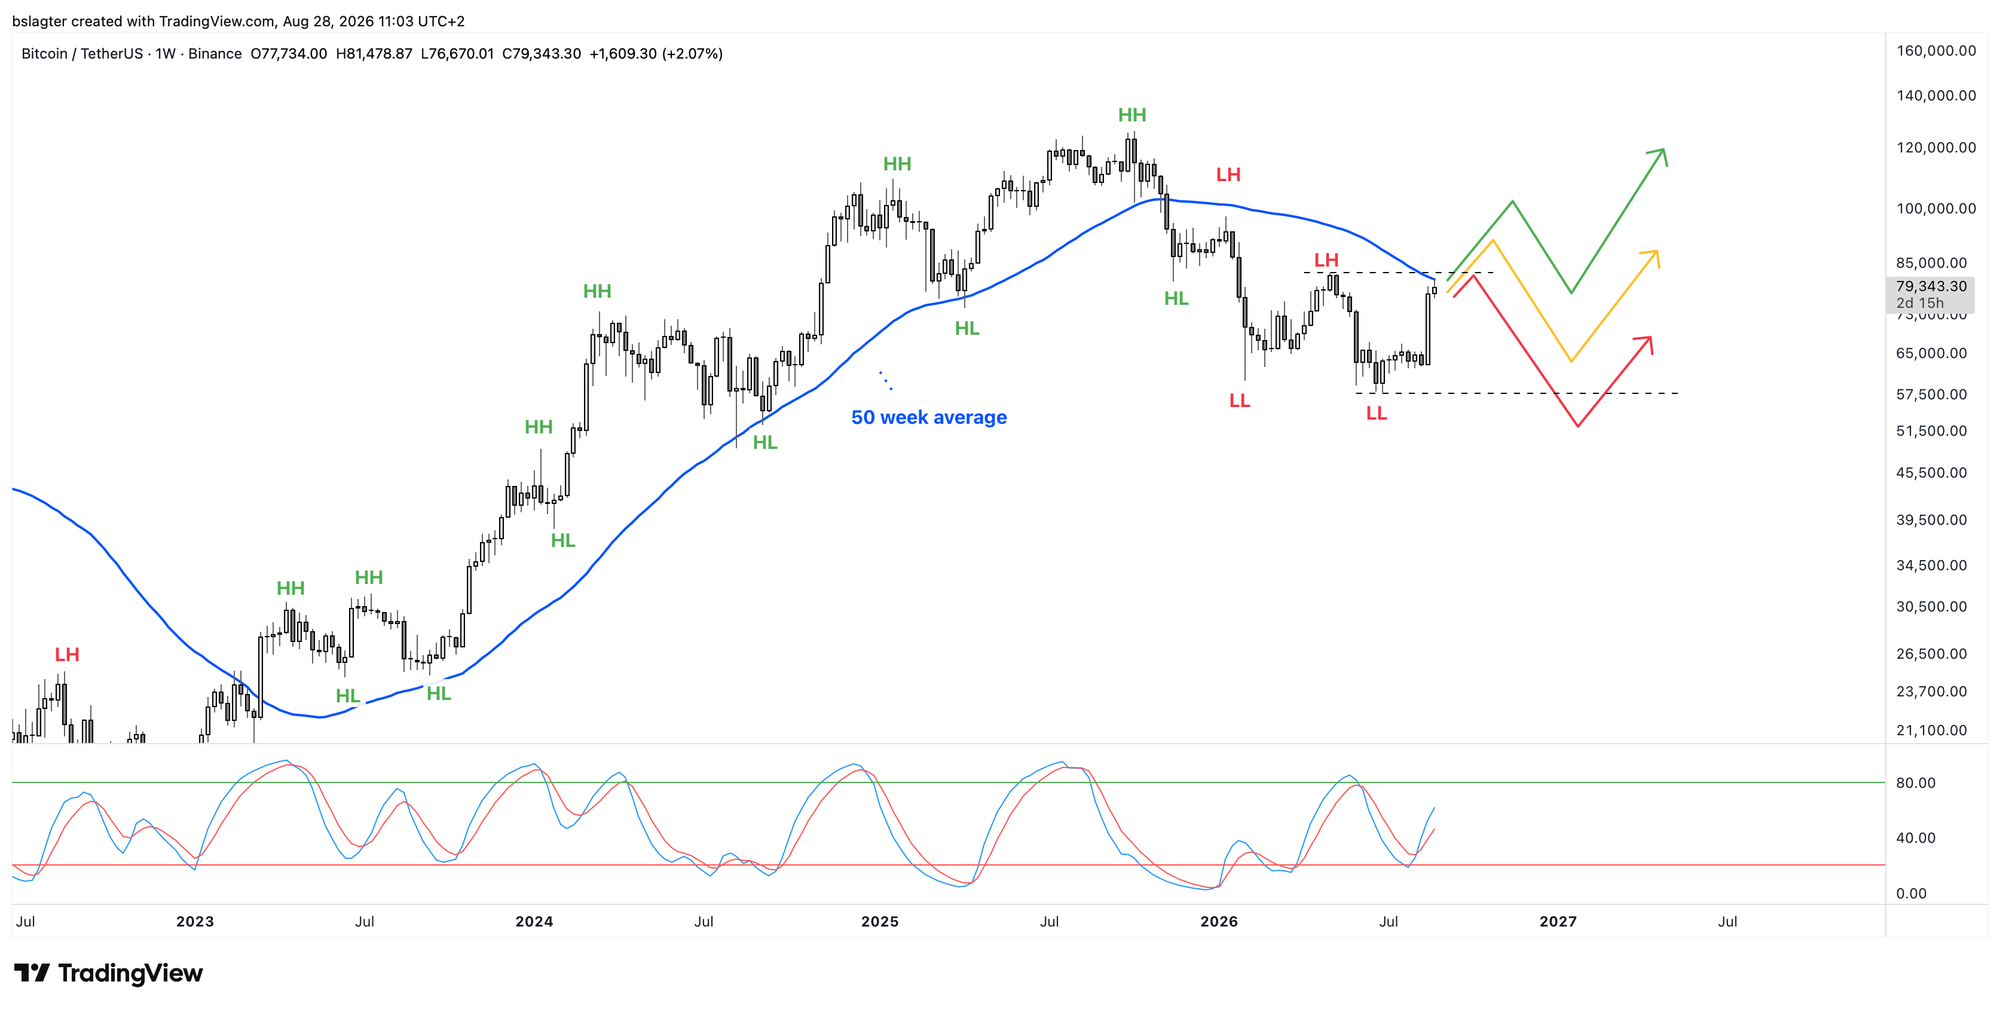
Let's take a look today at two transition scenarios:
- The new bull market has begun. The bear market bottom was the $57,700 from July 1 (green).
- The bear market isn't over yet. We'll get the definitive bear market bottom later this year (red).
Let me start by noting that there's a variant that sits somewhere between these scenarios (yellow).
Suppose we see a sharp price drop in the fourth quarter, with heavily negative sentiment, but the price stays (just) above $57,700. Technically, that's the first scenario, since July 1 remains the absolute low. But in all sorts of other respects, such as sentiment and rhythm, it fits the second scenario.
Anyway, for now we'll look at the two archetypal scenarios: (1) green and (2) red. Let's start with a schematic chart.
What speaks for scenario 1?
The rise above the 200-day moving average and the volume-weighted average price from the top are strong signals. The positive divergence between price and momentum indicators such as the weekly RSI, which we discussed in June and July, is supporting evidence.
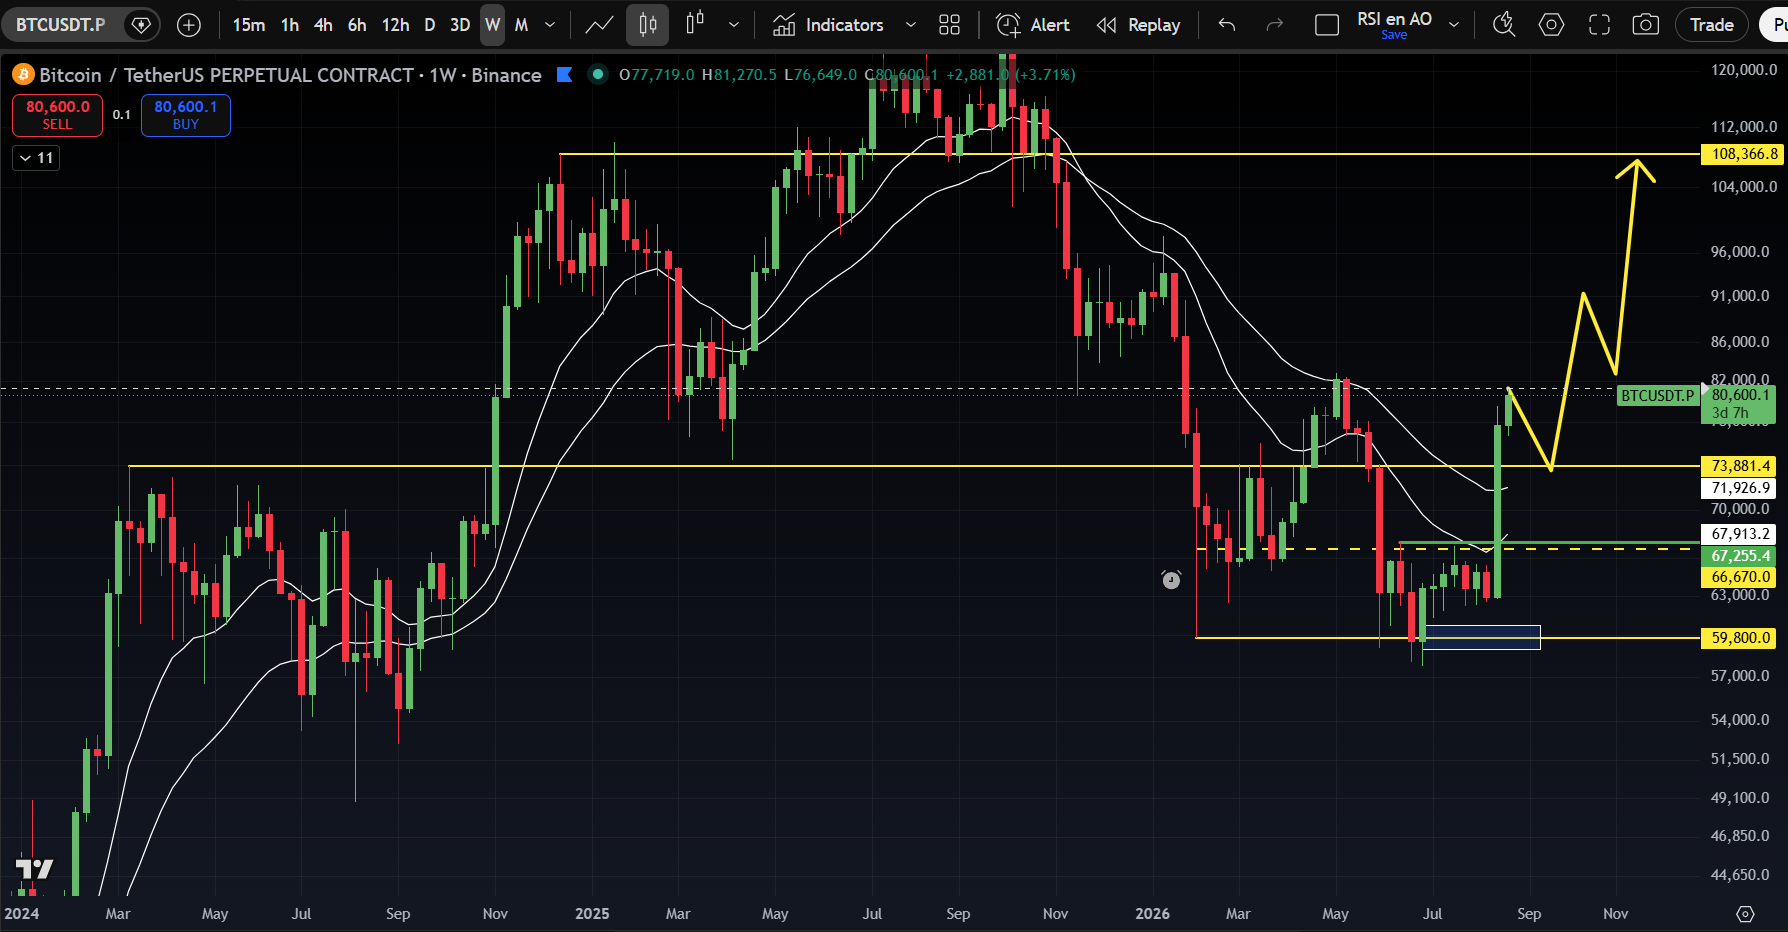
From a market structure perspective, the mid-June top at $67,000 was significant on the weekly chart—Sam talks about this in his video on YouTube. Last week's price move pushed the price above it, and above the two EMAs that guided the bear market's decline.
What's more, the sentiment fits the end of a bear market. Bad news barely moves the needle anymore. The doom-and-gloom narratives from the start of the bear market are now considered resolved—think of the risk of Strategy collapsing, the risk of BIP-110 getting out of hand, or the quantum risk.
The commentary from the broader financial sector on bitcoin's rise also fits an early bull market rather than a late bear market. Bitcoin is being mentioned alongside gold in the context of the debasement trade, and as a diversification play against the AI trade.
Finally, it's striking that the rally of the past few weeks is more than just speculation. The buyers are coming from all over the world and are active across every market: spot, futures, perps, and ETFs.
What speaks for scenario 2?
If we define bitcoin's cyclical bull market as the uptrend on the weekly chart, then right now we can't check off a single box:
⏹️ A higher high (HH) above the $83,000 from May 6
⏹️ A higher low (HL) above the $57,700 from July 1
⏹️ A weekly close above the 50-week moving average at $81,100
⏹️ A shift in that moving average's direction from declining to rising
For that reason alone, I can't put my full weight behind scenario 1. Respecting the trend automatically means you're on the late side when trends reverse. I thought Caleb Franzen put it nicely this week:
Trend followers are willing to be wrong at inflection points in order to make money the majority of the time.
From a cycle analysis perspective, we also don't yet have confirmation of a yearly cycle low. A monthly close above the 10-month moving average (currently at $74,200), this coming Tuesday, would be an important piece of evidence. But right now, that evidence isn't there yet.
Probabilities
I think it's highly likely that we're in the transition from bear market to bull market (90%). But is there still a nasty sting in the tail of winter to come, or are we heading straight into full summer?
As far as I'm concerned, it's 50/50.
If I had to distribute 100 points right now, this is how I'd do it:
- The new bull market has begun: 50%
- The bear market isn't over yet: 40%
- The bear market gets much deeper still: 10%
Scenarios 1 and 2 are both a variant (a continuation) of “a mild bear market,” and scenario 3 corresponds to “a deep bear market.”
These numbers could well shift quickly in favor of the bull market, for example if the following happens:
- A higher high above $83,000
- A weekly close above the 50-week moving average at $81,100
- A monthly close above the 10-month moving average at $74,200
We still wouldn't have checked every box, but the new bull market would become the base case!
2️⃣ The buyback plan after the breakout (Sam)
 Contribution by
 Sam
In last week's Markets, I described a plan to buy back in, along with two scenarios. Before that Markets even went out, bitcoin broke out—and how! The price shot up from below $63,000 to a weekly close above $77,000. This rally was driven partly by a record amount of liquidated short positions. But once those liquidations were settled, bitcoin held its ground.
And with that, scenario 1 kicked into gear. The strong weekly close above $67,500 is a fact, and on top of that, the price is trading above both the 100-day and 200-day EMAs. Scenario 2, in which the bottom is still to come, is thereby (for now?) off the table.
We wanted to buy in part right after the weekly close above $67,500, but that close only came at $77,000. That's exactly the risk I flagged last week. Bitcoin can make powerful, unexpected moves.
Investors who missed last week's move may be tempted to make up for those lost gains by going all in at once after all. That's an emotional reaction. Then again, doing nothing isn't an option either, because the signal we've been waiting for has, in fact, gone off.
A middle ground is the obvious choice. Of the remaining 75%, we're now allocating 25%, purely because the condition has been met. We're reserving the other 50% for the first pullback. It will come eventually—the only question is at what price the correction will begin. The past few days have shown that there's resistance around $80,000, at least for now, so it's not inconceivable that the correction will start from these regions.
Should that happen, the most interesting area lies between $70,000 and $74,000. That's because we don't want to see a large chunk of the strong move given back in the short term—the 200-day EMA runs through there and the top of the 2024 consolidation sat here.
What would be a strong indication that a lower bottom is still coming after all? A weekly close back below $62,000 is the ultimate warning, but ideally we don't want to see the price come near $67,000 for any extended period again. Until proven otherwise, there's no reason so far to doubt this upward momentum.
3️⃣ Nvidia surprises once again, market reaction becomes key
 Contribution by
 Thom
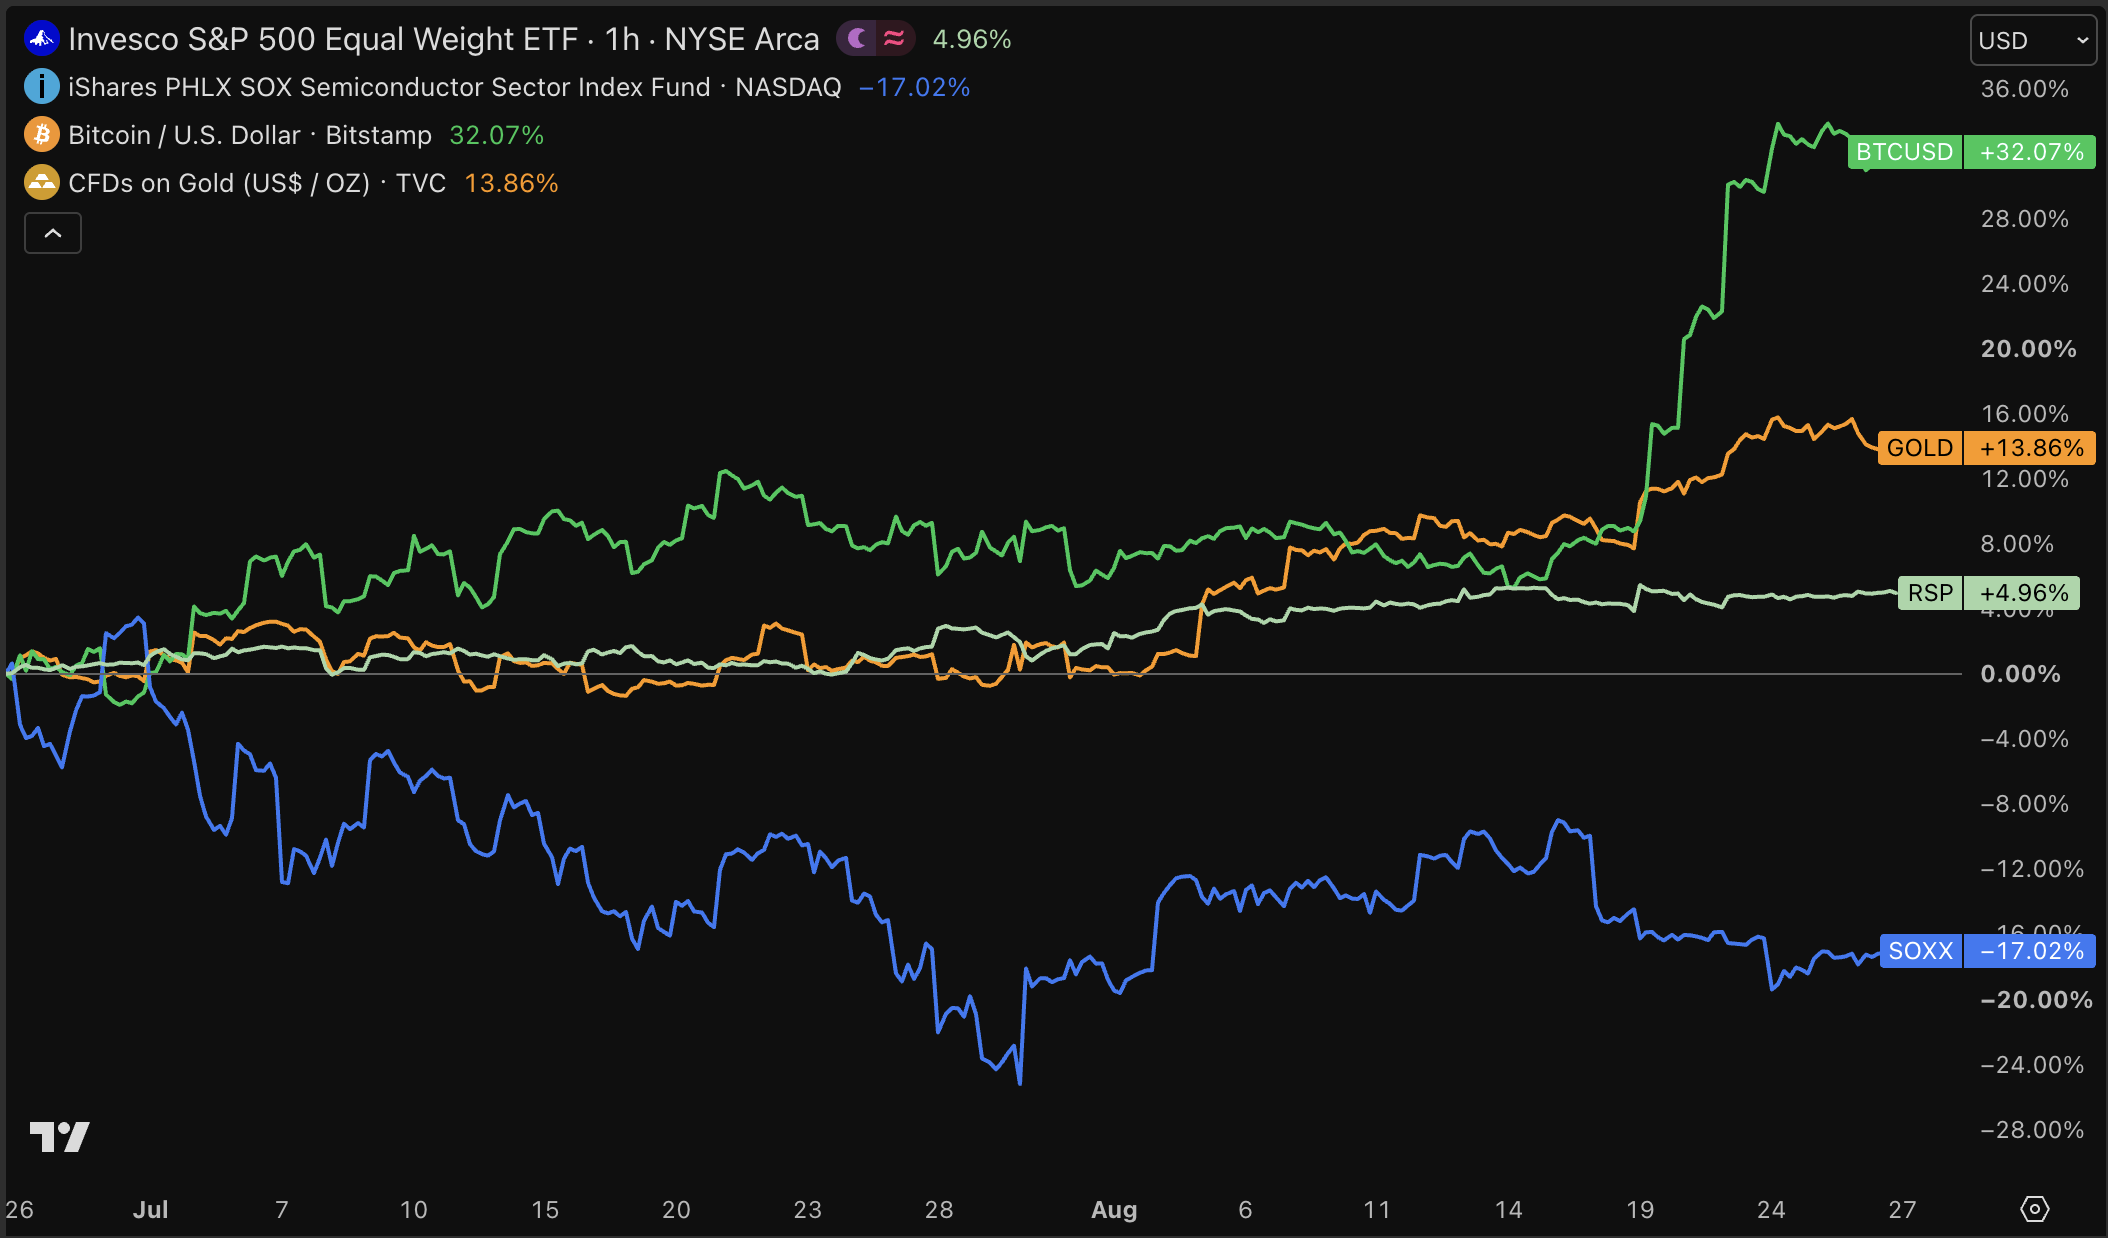
Over the past few months, we've seen something interesting happen in the financial markets. Until recently, AI stocks were the undisputed leaders on Wall Street. Over the past two months, that changed. In the stock market, we saw a rotation of capital out of AI and into other sectors.
In this chart, we see the chip index (SOXX) shed 17%, while the equal-weighted S&P 500 actually gained 5%. So investors didn't exit entirely—they opted for other assets instead. At the same time, gold managed to climb over 13% and bitcoin gained more than 30%.
Investors are increasingly questioning whether the gigantic AI investments will deliver enough return—not least to compensate for the rising yields in the bond markets. Where AI stocks previously rose on higher investment promises, investors now want to see results.
AI investments now have to translate into higher profit margins, earnings figures, and cash flows. Although the numbers are still more than impressive, Jurrien Timmer, head of the macro division at trillion-dollar fund Fidelity, observes that the acceleration of earnings growth is stalling.
That acceleration stood at 35% and has now fallen to 33%—see the green bars in the bottom panel of the chart.
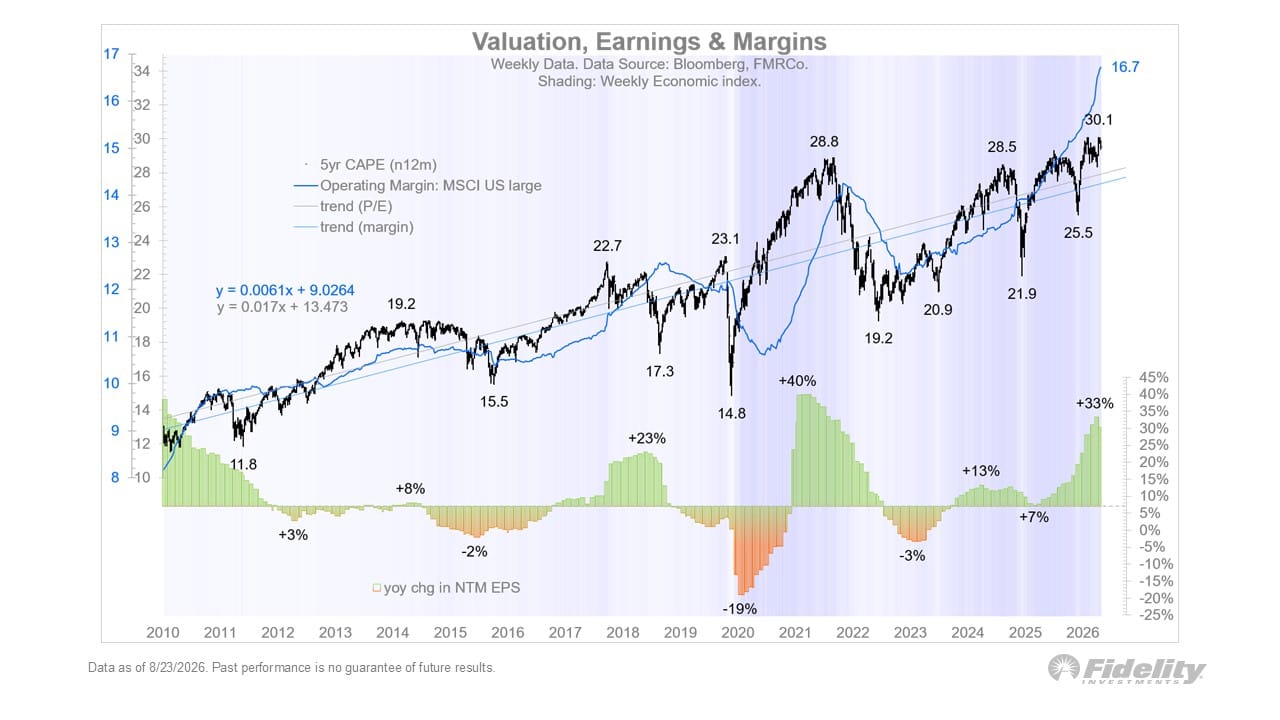
Although the growth is still very impressive, these are the first signs that more room is opening up for other assets. That's favorable for bitcoin, since the digital currency spent months overshadowed by all the attention devoted to artificial intelligence on the stock market.
On Wednesday evening, Nvidia posted results that once again beat all expectations. That could breathe new life into the whole circus. It'll therefore be interesting to see how the chip complex responds over the coming weeks.
The numbers are good, and in valuation terms Nvidia has become a bit cheaper again. The only question is whether investors believe that this kind of revenue and profit growth can be sustained in the years ahead. The charts will have to tell us in the weeks to come.
4️⃣ There is no serious alternative to the US dollar
Contribution by Thom
Bitcoin reacted rock-solidly last Wednesday to the interest rate intervention by the US Treasury. With the announcement that, starting in September, it will buy back twice as many long-dated government bonds from the market, the US government sent a kind of “this far and no further” signal on interest rates.
Within the US government, concern is also growing about rising long-term rates. These not only make servicing the national debt difficult, but also pose a threat to the AI investment cycle—and thereby to the digital arms race with China.
Although this signal is positive for bitcoin, because it makes clear that the United States is willing to sacrifice the US dollar for the economy, we shouldn't overstate the situation either. The internet immediately lit up with doomsday scenarios for the US dollar.
The reality is that there are no serious alternatives to US Treasuries. Other large bond markets, such as those of China, Japan, Europe, and the United Kingdom, are considerably less attractive to investors for a variety of reasons.
A more realistic question would be why you'd hold government bonds at all. The answer to that is that many funds operate under a mandate. They're required to hold certain percentages of their portfolios in government bonds, and so they have no choice but to participate in this market.
They have to buy something. In theory, governments could make the rules even stricter for certain funds and financial institutions. That could artificially force them to hold more government bonds.
For the funds and institutions in question, that wouldn't be terribly favorable, but it does keep the financial system standing for longer this way. Personally, I can't bear to think of the US dollar collapsing. That would spell a very dark scenario for the world.
The best scenario for bitcoin, in my opinion, is one where central bankers and governments keep turning the dials this way, and inflation stays somewhat in check. That way, bitcoin can carve out its place within the financial system in an orderly fashion, while everything keeps running relatively smoothly.
I hope not to witness the real doomsday scenarios, because if the dollar collapses, your bitcoin or gold won't do you much good either. It wouldn't take long before the entire global economy grinds to a halt and supermarkets run empty. I don't think anyone is looking forward to that.
In closing
You can revisit all previous editions of Alpha Markets in the archive. Questions, comments, and suggestions are warmly welcomed in the community.
Thank you for reading!
To stay informed about the latest market developments and insights, follow our team members on X:
- Bart Mol (@Bart_Mol)
- Peter Slagter (@pesla)
- Bert Slagter (@bslagter)
- Mike Lelieveld (@mlelieveld)
We appreciate your continued support and look forward to bringing you more comprehensive analysis in our next edition.
Until then!