Bitcoin on Track for a Daily-Cycle Low
Bitcoin's rebound from a $74.5K low hints at fresh bullish momentum, with peaks of $150K–$165K on the horizon. Meanwhile, Japan’s soaring bond yields and a stalled U.S. market add new twists. Could this be a turning point for crypto and altcoins?

On April 7, bitcoin’s price dropped to $74,500, which is 32% below the December and January highs. Sentiment had hit rock bottom. Analysts declared it the end of the bull market, and some investors sold their positions at a loss.
That turned out to be the bottom.
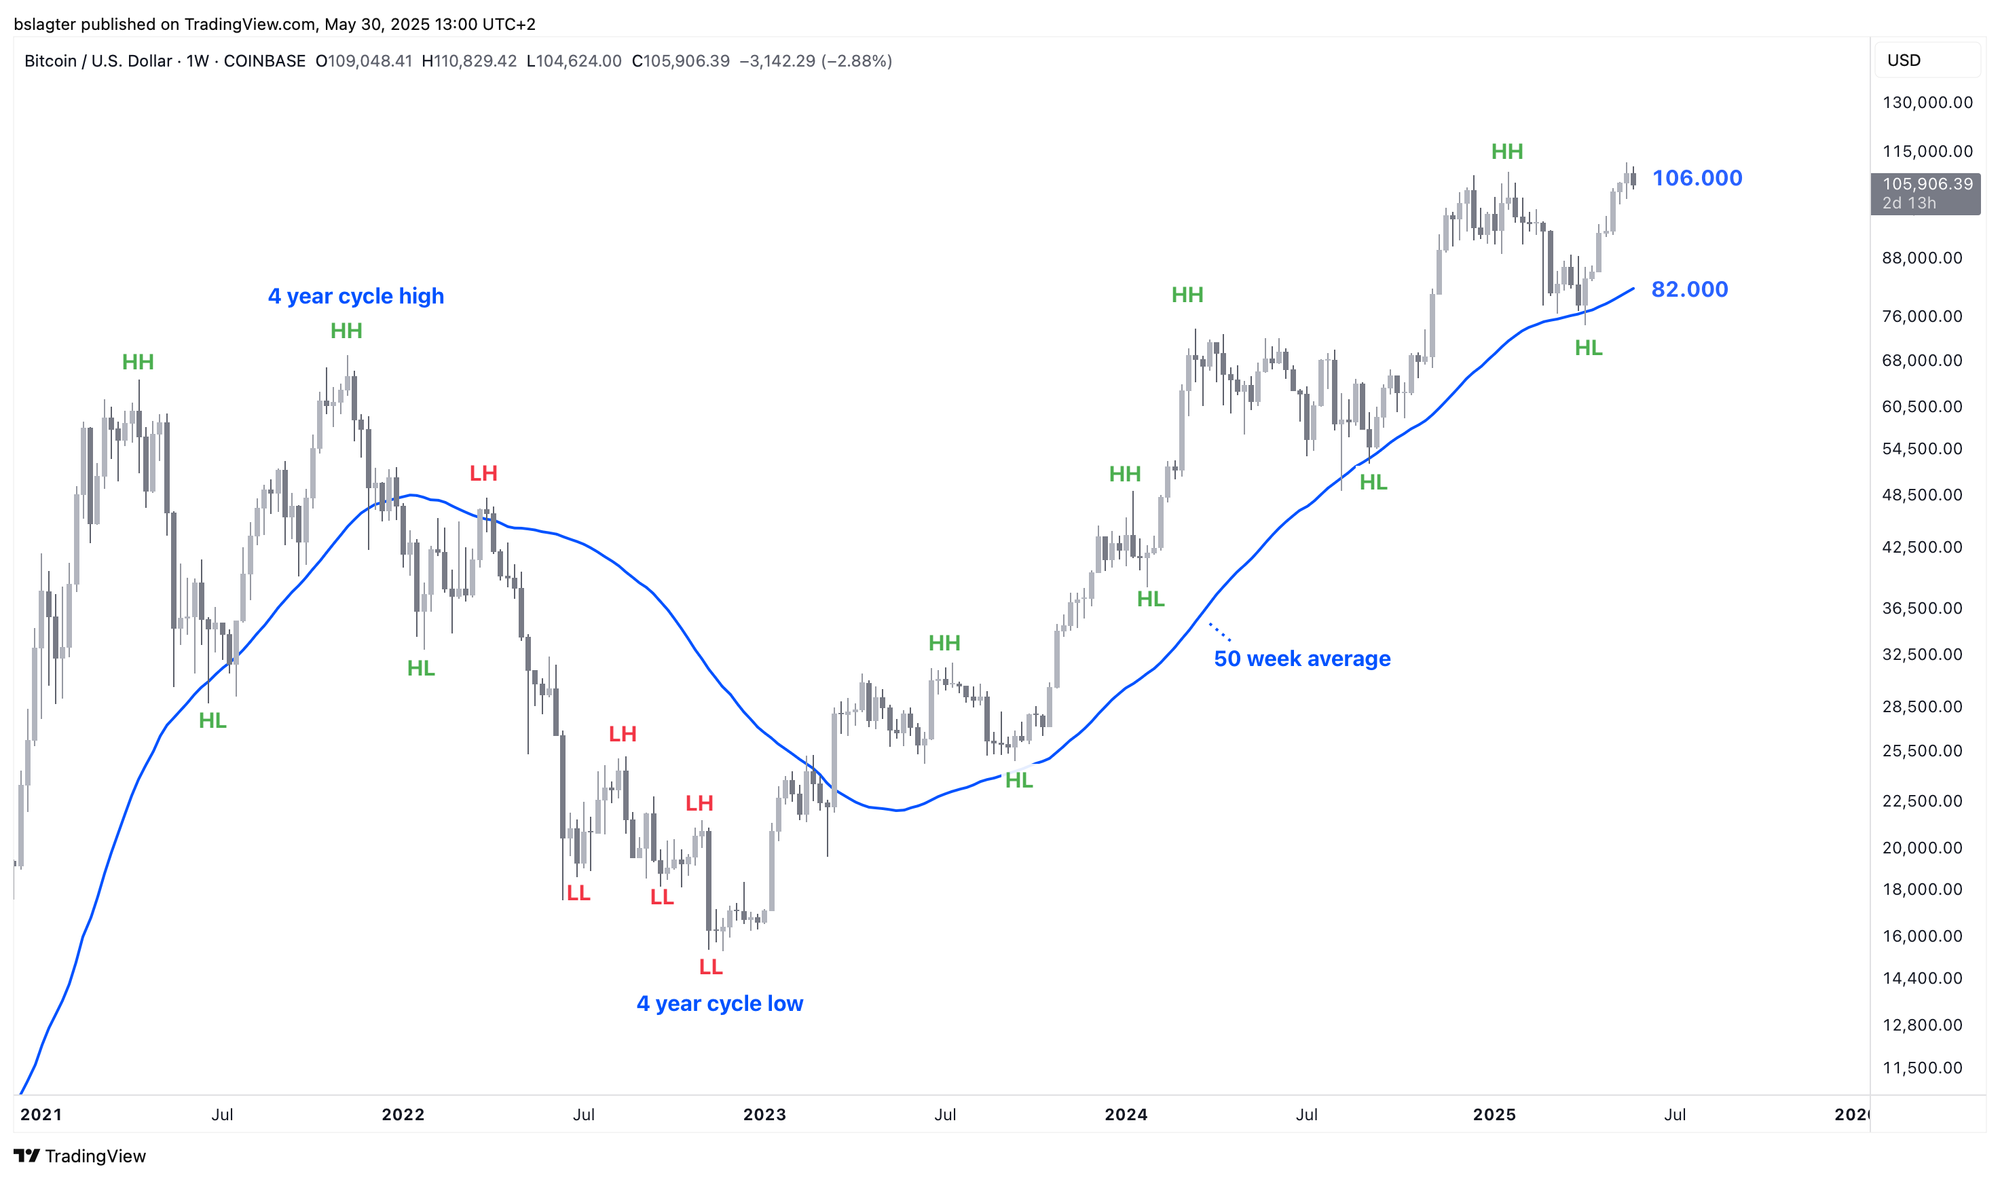
The weekly close was still neatly above the 50-week average at that time—a clear divider between bull and bear markets. Moreover, the $74,500 level acted as a test of the March 2024 high as support.
From that point on, a new uptrend began, ushering in a weekly cycle that typically lasts about 20 weeks. If this cycle behaves like previous ones in this bull market, its peak could range between $150,000 and $165,000. See the Alpha Markets update from May 2 for supporting evidence.
Each weekly cycle is made up of daily cycles, and it appears we have already passed the peak of the first daily cycle and are now heading toward the first daily cycle low (DCL) of this weekly cycle. More on the characteristics and timing of this DCL, along with charts, will follow.
Over the past week, the price has been squeezed between the upper and lower bounds of an ever-narrowing range. The anchored VWAPs in the chart below illustrate this well. The red line shows the volume-weighted average price since the peak, and the green line since the local bottom.
We broke out at the bottom of this range. In our view, that is a strong signal that we are now looking to establish a DCL before the weekly cycle’s upward move resumes.
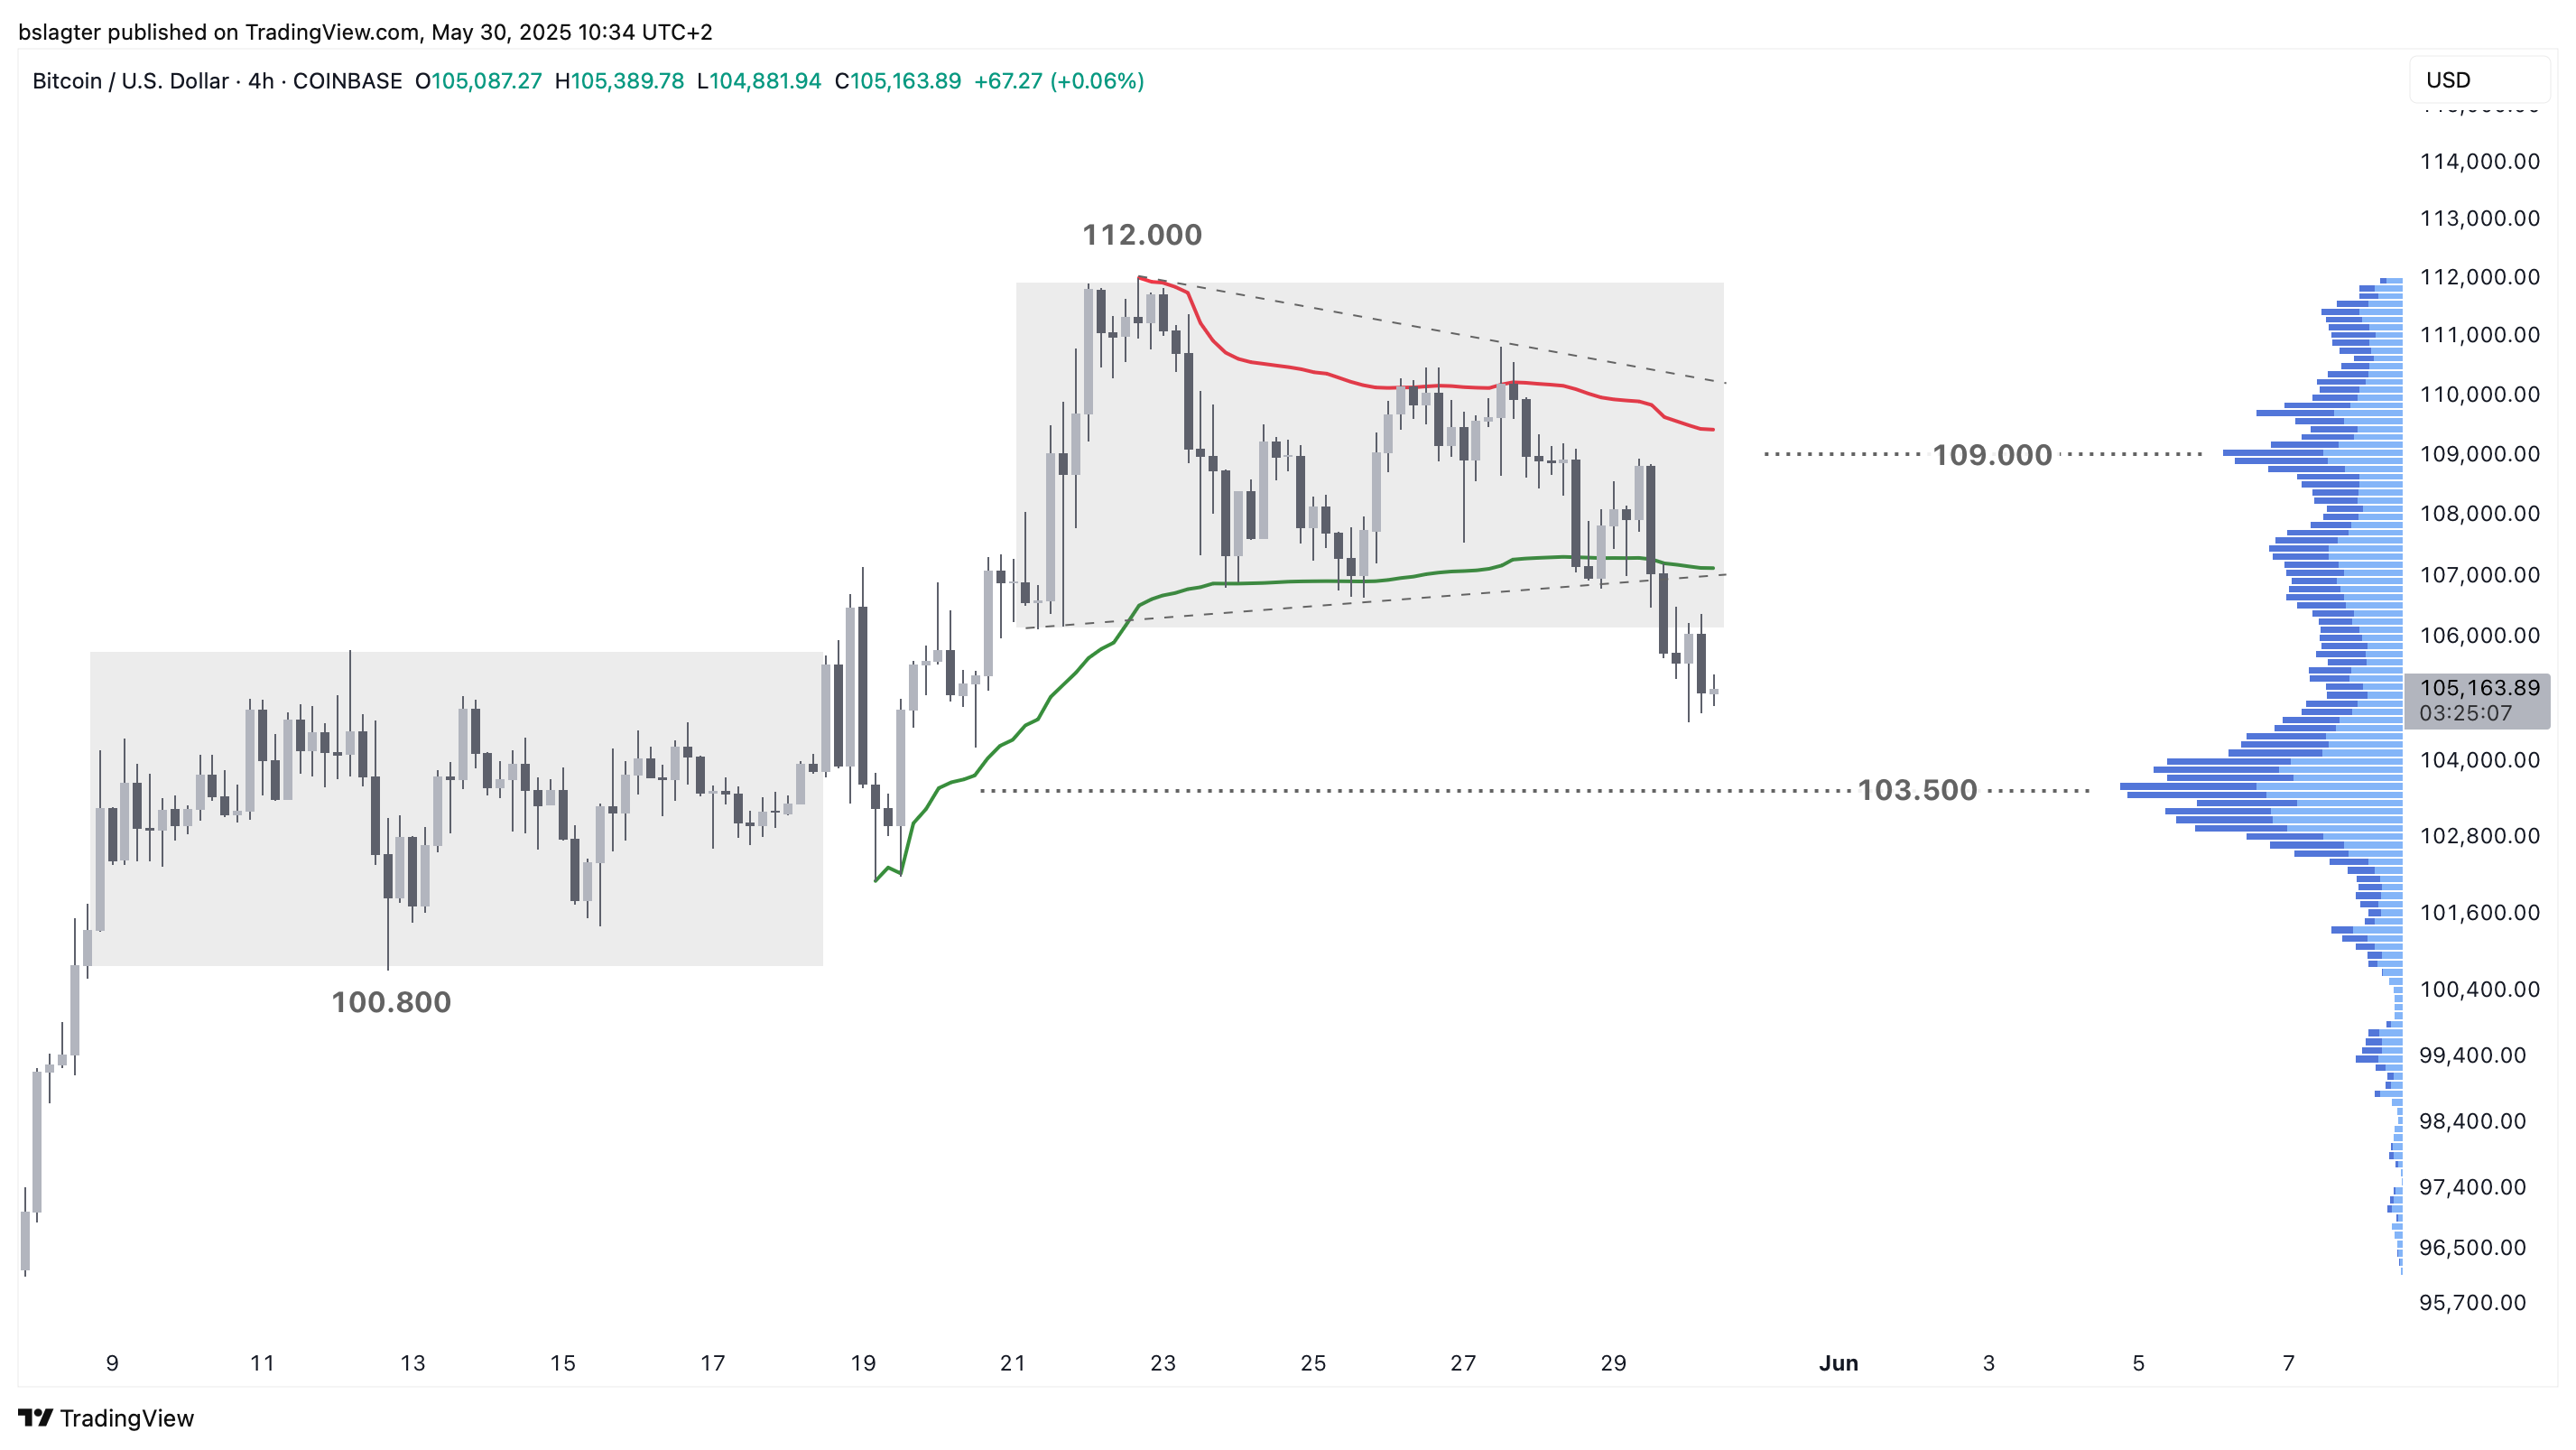
This means that the series of very mild corrections over the past eight weeks is coming to an end. Since the bottom on April 7, we hadn’t seen a drop of more than 5%—but now it’s already at 7%.
The price could dip a bit further. The range between $98,000 and $102,000 is a logical area for a bottom. In the chart below, we’ve marked it with a blue rectangle. The 50-day average now also runs through this zone. If we hit the lower edge, that would represent a 13% correction—quite typical for a DCL.
We don’t see a high likelihood of retesting the horizontal levels we passed on the way up, between $86,000 and $92,000. Achieving that would require a significant external shock.
Our base scenario is that, over the next 14 days, we will form a mild DCL, after which a new upward daily cycle will commence—with new all-time highs later in June. Is this also a good time to take a look at altcoins?
There are indeed arguments in favor. Historically, altcoins have performed well during this phase of the bull market, and we’re also seeing that many altcoins have formed a bottom and started a new uptrend.
However, you should only invest in altcoins if you expect them to outperform bitcoin; otherwise, it’s probably best to stick with bitcoin.
We still see no evidence of that.
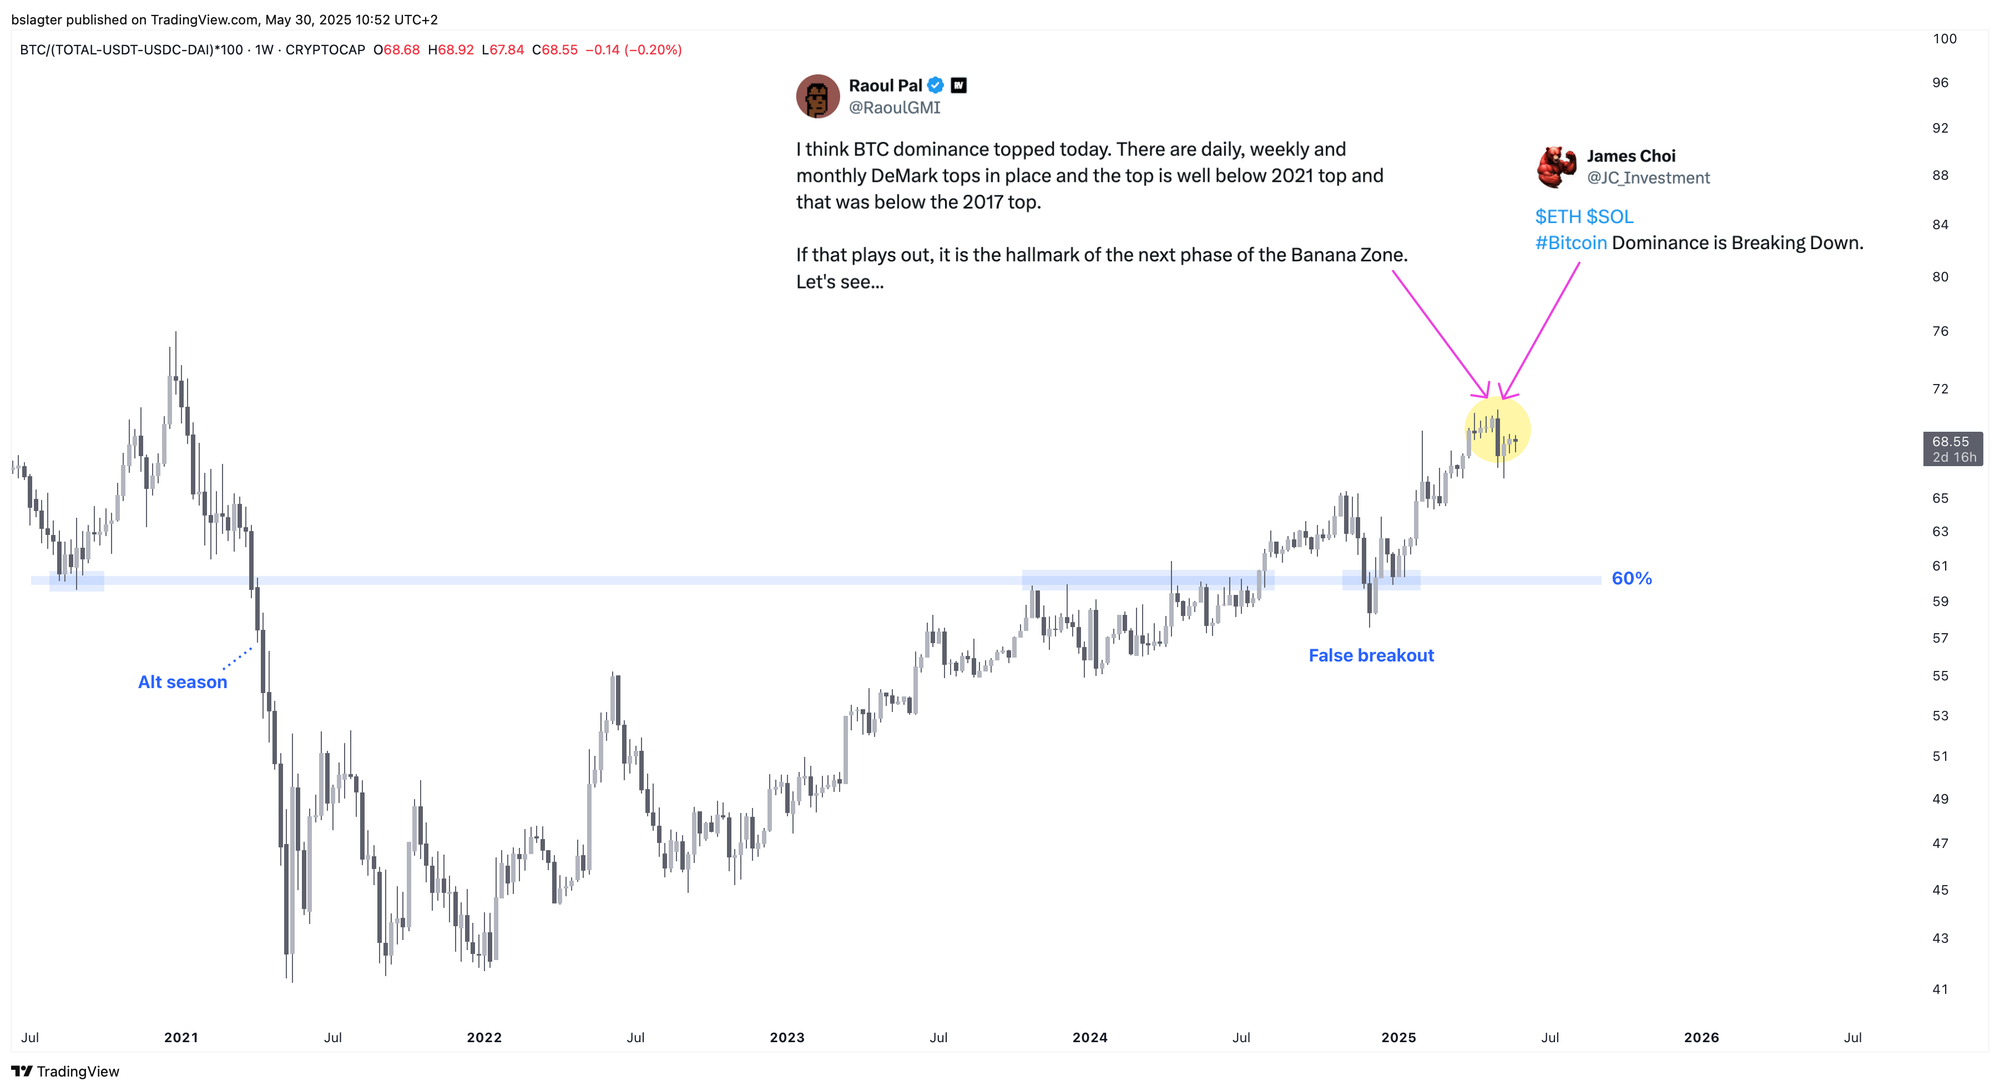
For the past four years, bitcoin’s market share has been steadily rising. Even the relatively strong performance in recent weeks falls well within this upward trend. There is no sign of a reversal. If that were to change, it would be a major signal.
Until then, there is no “alt season” — a prolonged period during which a large portion of altcoins perform significantly better than bitcoin. While a few specific altcoins might perform exceptionally for a short time, very few investors manage to profit from that consistently. Most traders end up losing money.
Let’s continue with the following topics for our Alpha Plus members:
- Heading Toward a Daily Cycle Low
- Japan, the Land of Rising Bond Yields
- Bear Market for U.S. Stocks?
1️⃣ Heading Toward a Daily Cycle Low
Bert
Cycle analysts often use a checklist of conditions that a cycle low must meet. While the exact criteria may vary between analysts, it typically includes the following for a daily cycle low (DCL):
- A daily close below the 10-day moving average
- A daily close below an ascending trendline
- The 10-day moving average shifting from upward to downward
- A momentum indicator falling into oversold territory
- (Here lies the DCL)
- A daily close above the 10-day moving average
- A daily close above a descending trendline
- The 10-day moving average turning from downward to upward
- A daily close above the previous swing high (currently at $109,000)
Once all these conditions are met, a new daily cycle begins and the DCL is left behind.
Technical analysts also use additional tools to identify a local top or bottom, such as divergences, trading volume, reactions to horizontal support levels, and classic bottom patterns.
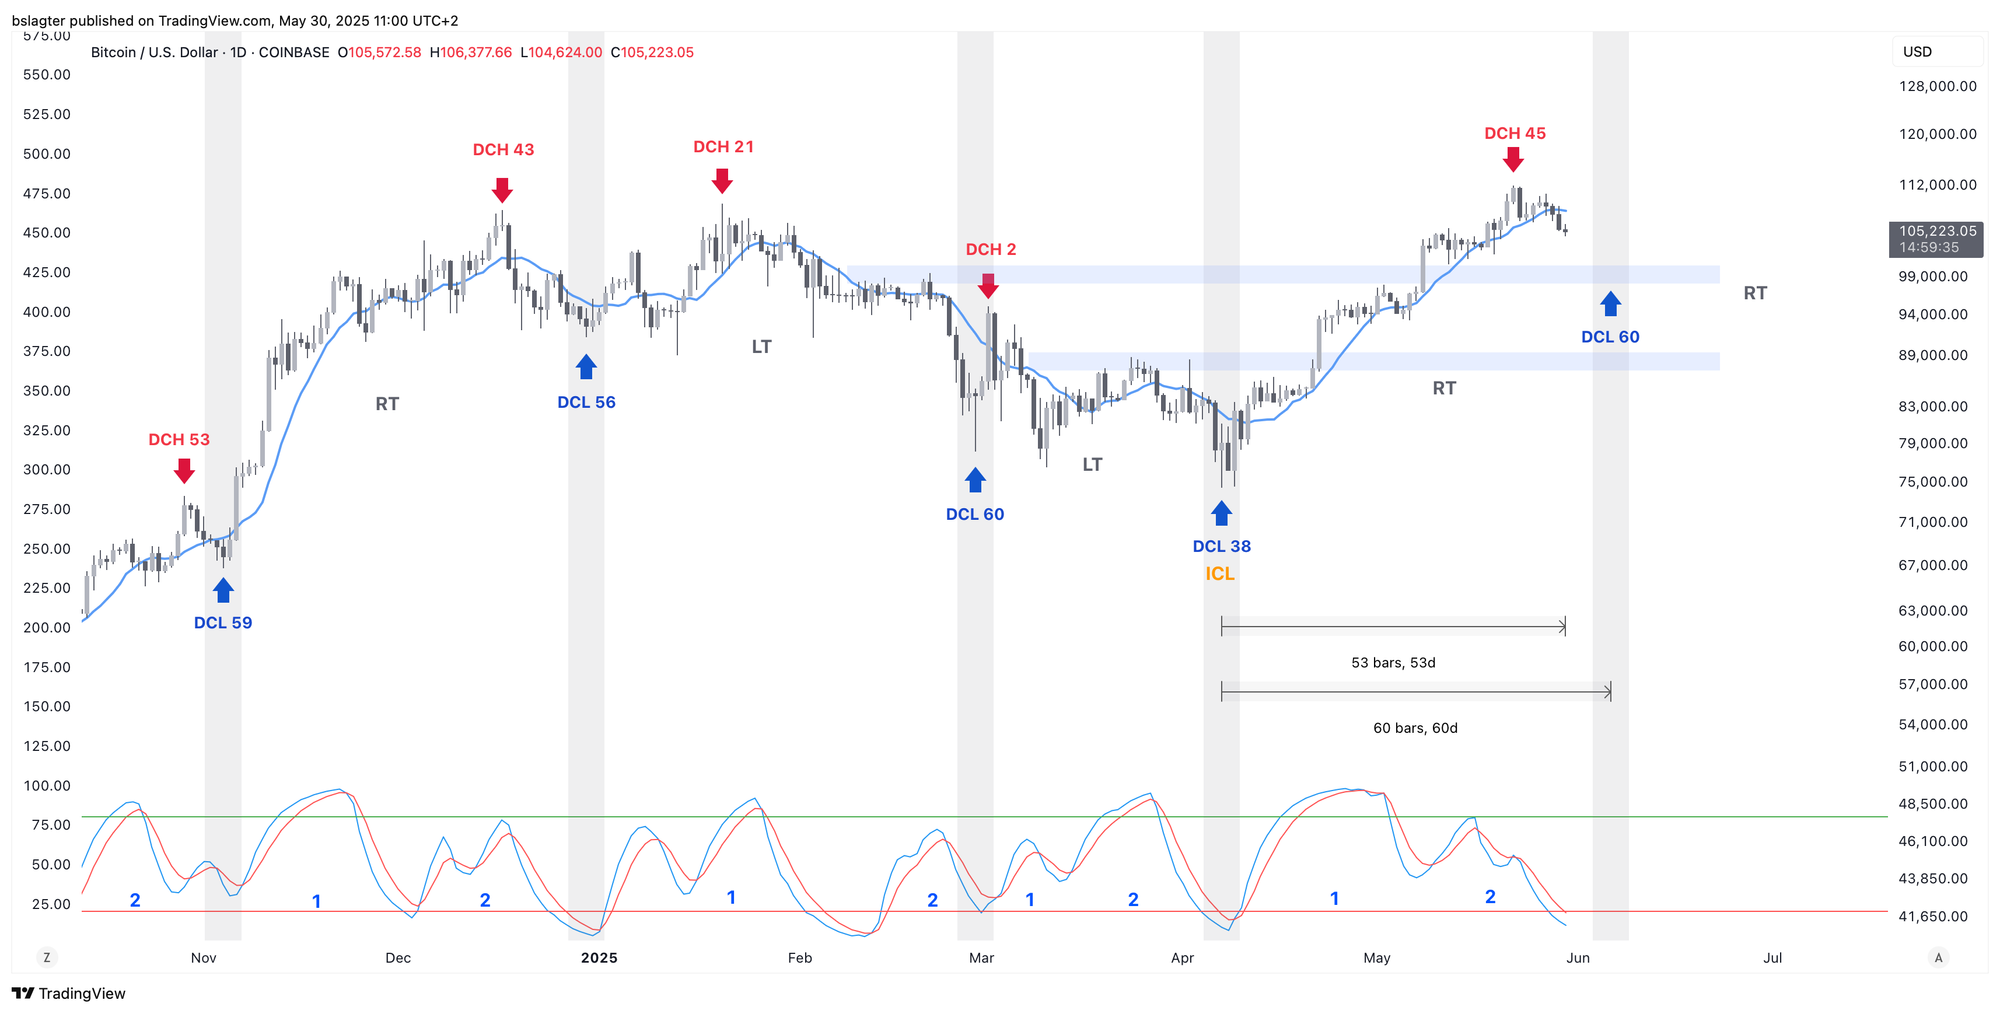
From a cycle analyst’s perspective, we now expect that we’ve passed the DCH (daily cycle high) and are on our way to reaching the DCL. Another supporting factor is the timing. We are on day 53 of a daily cycle that typically lasts around 60 days. If a new peak were reached now, it would likely indicate the beginning of a new daily cycle, based solely on timing.
The chart below not only shows the timing but also these characteristics:
- A daily close below the 10-day moving average
- The 10-day moving average curving from upward to downward
- The DSS Bressert oscillator at the bottom is in oversold territory
Our base scenario is therefore that we will form a DCL in the coming days, with a modest chance that it may have already occurred today.
This DCL marks the end of the first daily cycle within this weekly cycle and the beginning of the second daily cycle, which is typically upward—especially at this stage of the bull market.
The chart below shows that this weekly cycle still has room for further gains, both in terms of momentum (A) and timing (B).
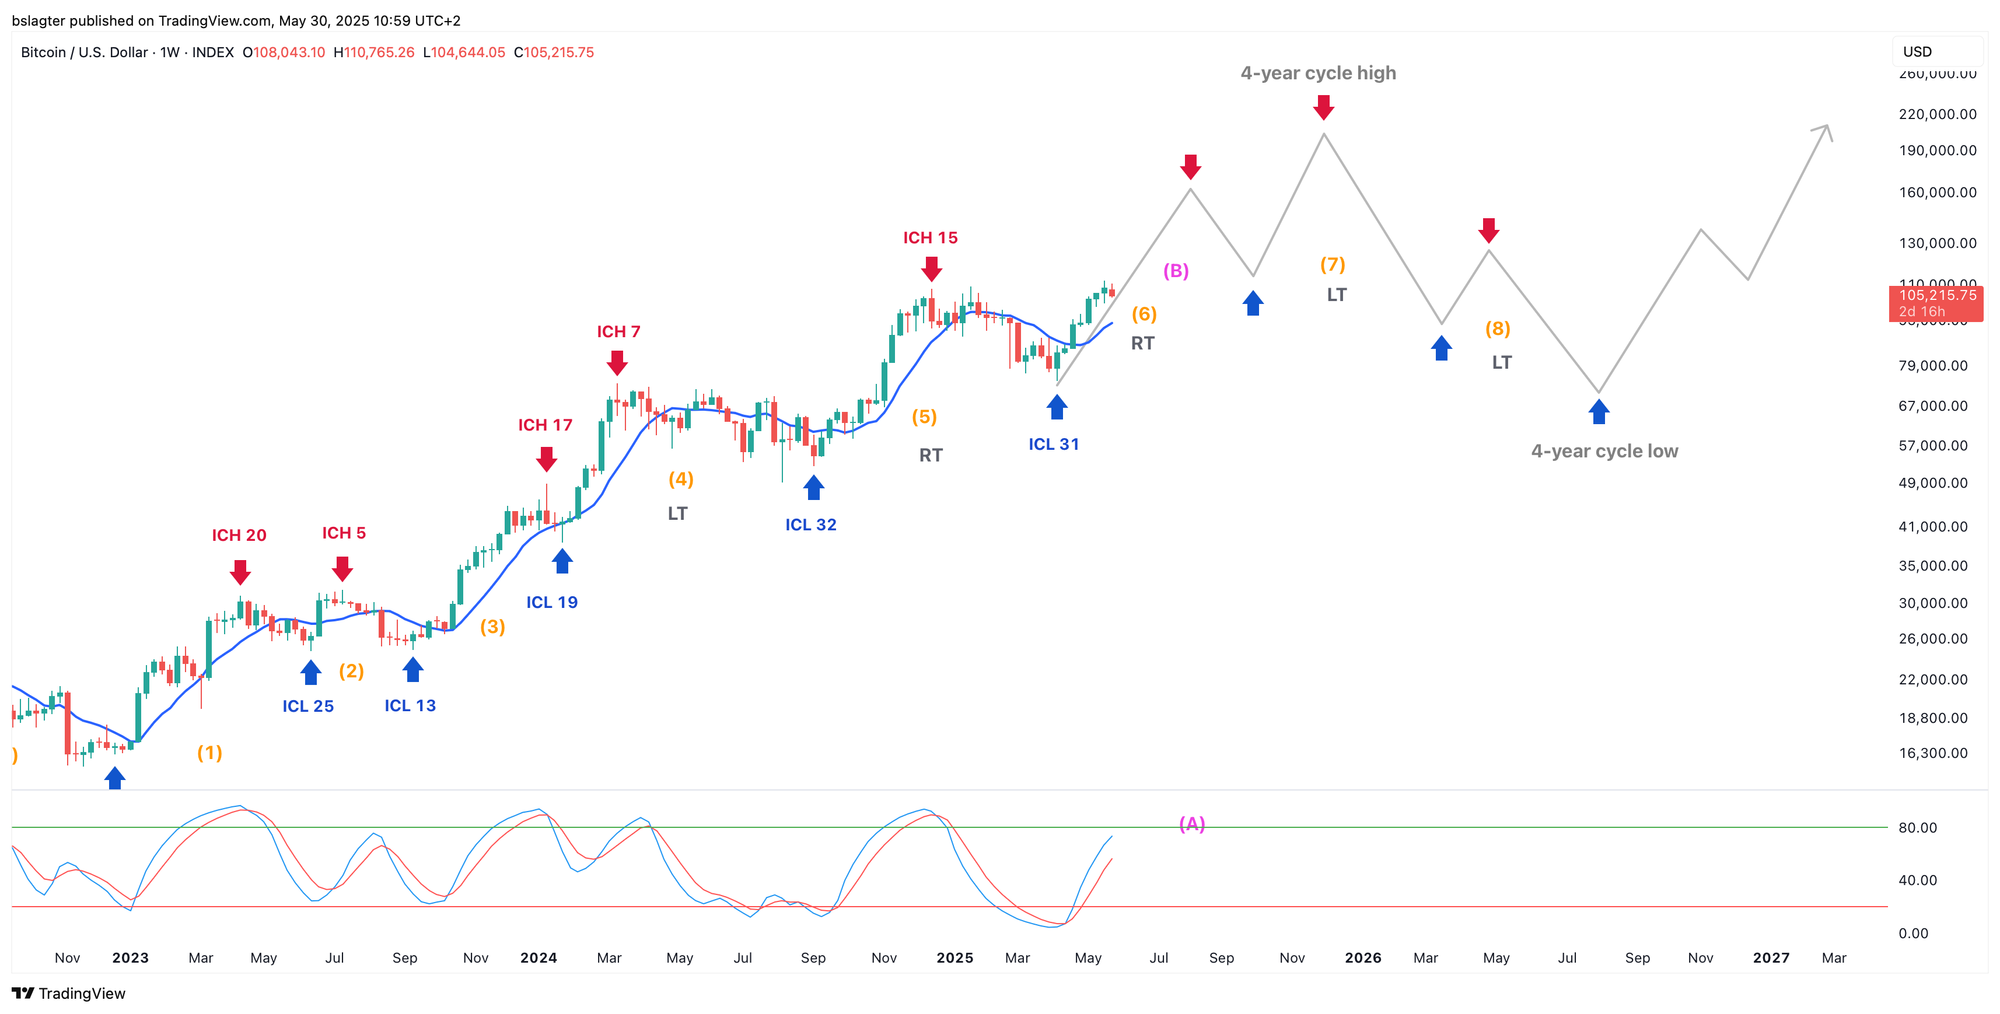
Of course, having room for further gains does not guarantee that those gains will materialize. We are always dealing in probabilities, not certainties.
If the price in the coming daily cycle fails to exceed $112,000, or perhaps even closes lower than the current cycle’s close, it could indicate that the bull market peak has been reached.
That would be a good reason to adopt a defensive stance. However, this does not immediately signal a bear market. As you know, we use the 50-week moving average as the boundary between bull and bear markets, and we are still well above that!
2️⃣ Japan, the Land of Rising Bond Yields
Thom
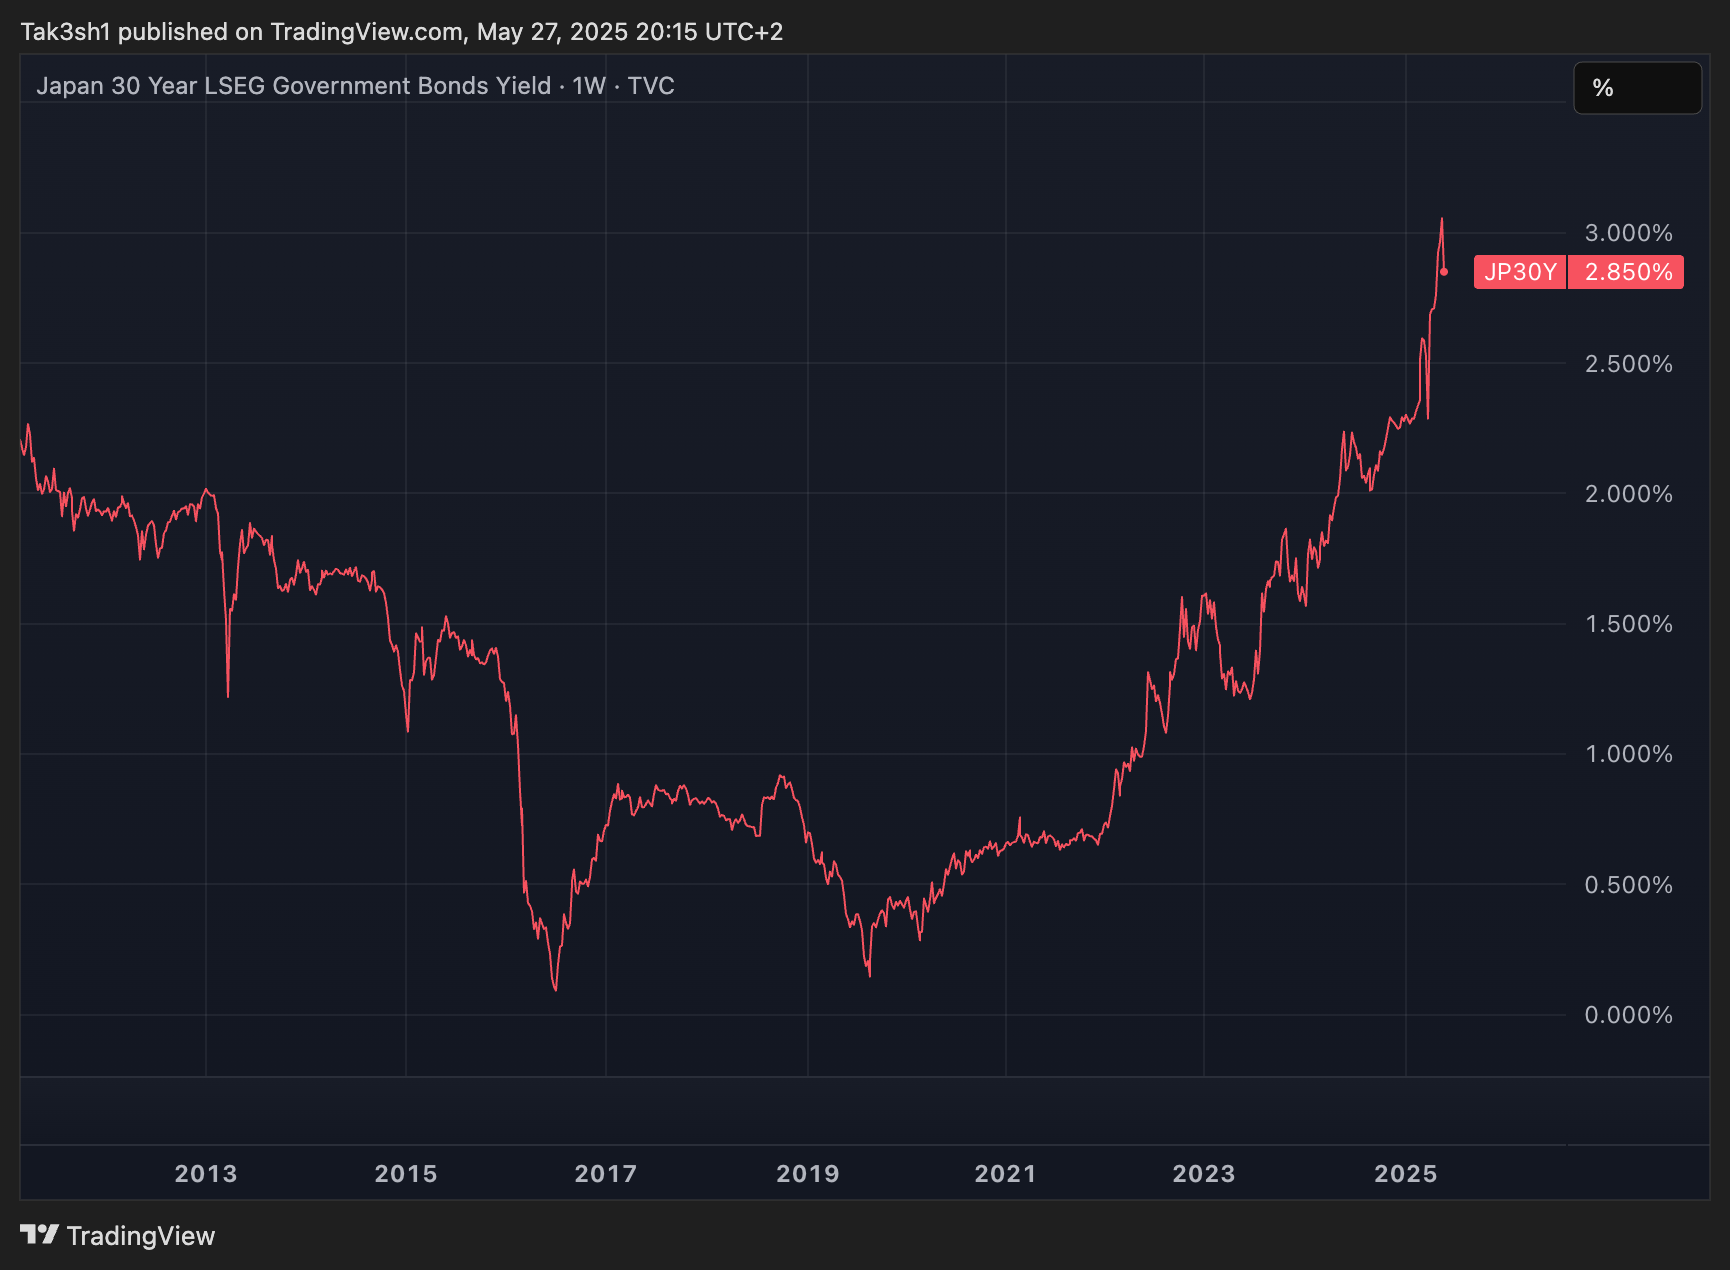
Japan has long been known as the Land of the Rising Sun, but recently it has also become known as the land of rising bond yields. Notably, yields on long-term Japanese government bonds have surged dramatically.
Bond yields rise when there is little demand at lower interest levels—in this case, because of a reluctance to lend money to the Japanese government over the long term.
It is no secret that Japan carries a massive national debt, but it was particularly striking when Prime Minister Shigeru Ishiba described the situation as “worse than that of Greece” said. Furthermore, several recent developments have dampened demand for Japanese government bonds:
- Japan’s CPI stands at 3.6%, which is above the 30-year yield. A negative real return makes government bonds unattractive.
- Japanese insurers have stopped buying very long-term bonds in order to comply with recently introduced capital requirements.
- The outlook for public finances has not improved: the US is pressuring Japan to increase defense spending from 1.6% to 3% of GDP.
- The Bank of Japan now holds more than 50% of all Japanese government bonds but has shifted from being a major buyer to a seller.
One way to address this issue is simply to issue fewer long-term government bonds. That is exactly what the Japanese authorities announced on Tuesday. Shortly after, the 30-year yield dropped by 35 basis points.
Jeroen Blokland described this as “further evidence” that governments, along with their central banks, will go to great lengths to maintain the status quo of our debt-driven financial system. It makes sense, as why not mitigate short-term consequences while you still can?
You might now be thinking: interesting story, but why should Western investors lose sleep over yields in Japan?
The answer is simple. Long-term government bonds in developed countries are largely interchangeable. If yields on Japanese or British bonds suddenly spike, investors worldwide react by selling comparable bonds elsewhere—say, in the United States—causing yields there to rise as well.
Furthermore, major Japanese asset managers have long parked their funds abroad precisely because domestic yields were so low. But now that yields in Japan are rising again, it becomes more attractive for them to repatriate their capital. They receive better returns, face no currency risk, and worry less about the central bank’s artificial suppression of interest rates.
In this way, Japan indirectly contributes to the recent rise in long-term US yields. And higher government bond yields typically ripple through the broader economy—mortgages, consumer loans, and corporate borrowing all become more expensive.
Over time, these rising long-term yields serve as a brake on economic growth. That is why this development is significant. While pessimists are quick to claim that the financial system is on the brink of collapse, it’s far from that—policymakers still have ample tools to prevent such a scenario.
3️⃣ Bear Market for U.S. Stocks?
Thom
After the V-shaped recovery in recent weeks, the US stock market is only a few percentage points away from the record set in February. However, according to macro guru Jurrien Timmer of Fidelity, the outlook is less rosy than it might initially appear:
- Longer-term yields have risen significantly
- The trade war is likely not over yet
- Earnings expectations are being revised downward
- The S&P 500’s forward price-to-earnings ratio is at 21—a level usually seen only during peak periods
Based on these points, Timmer concludes that the market is no longer pricing in setbacks, despite risks on multiple fronts. In his view, this limits the potential for further price gains.
"All things considered, I believe we will likely remain in a sideways market for the next 6 to 12 months. In my view, the range is roughly between the April low of 4835 points and the recent peak around 6000 points. Outliers beyond this range are possible, but likely short-lived," he said.
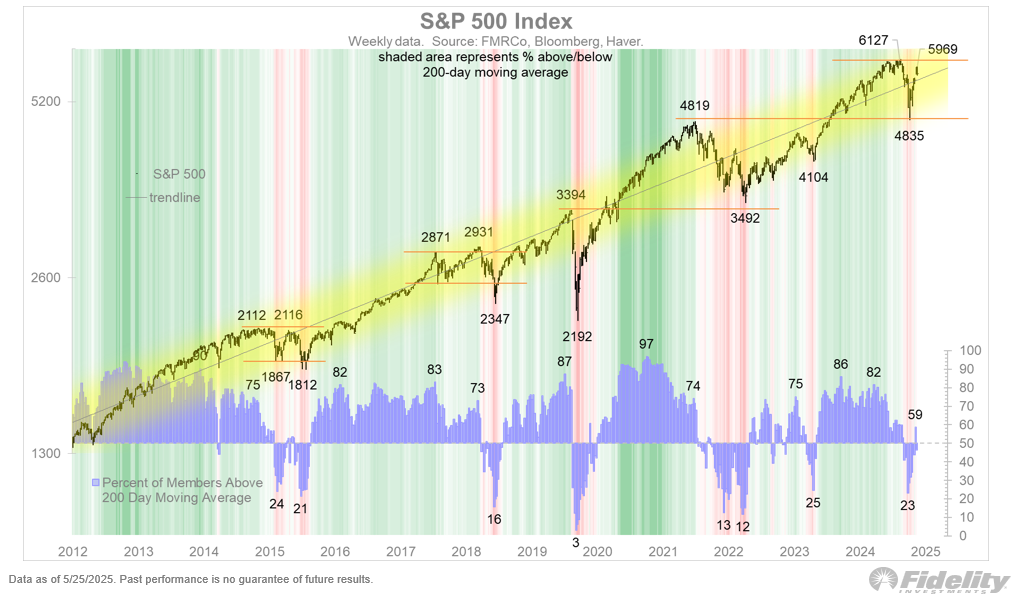
"If my assessment of this sideways market is correct, it could signal the end of the cyclical bull market that began in October 2022. That bull market would have ended in February 2025, after 30 months. In that case, it appears that a modest bear market has already begun."
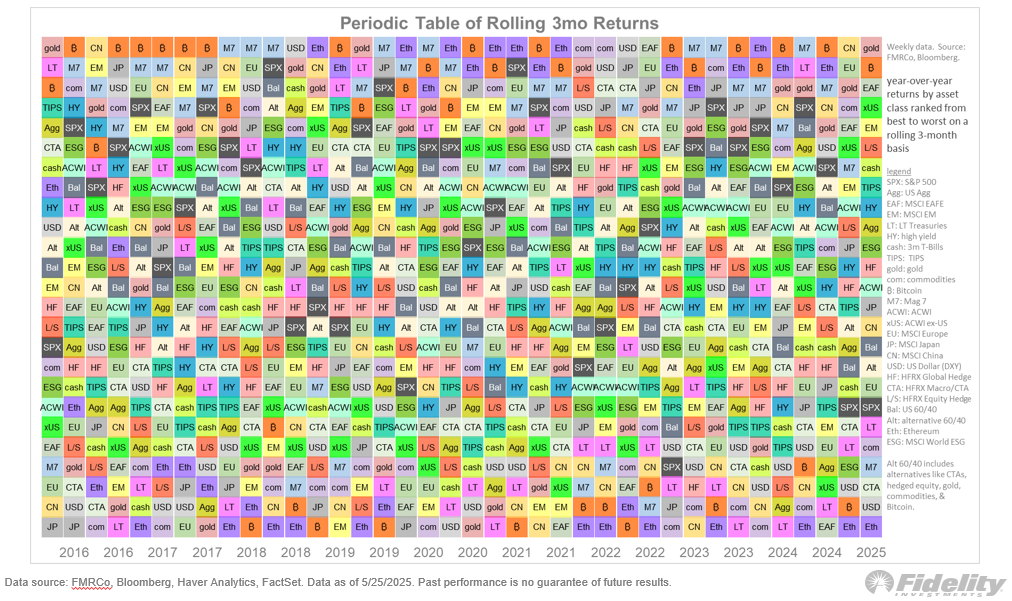
For the remainder of 2025, a year in which he sees further declines in the S&P 500 as a realistic scenario, he points to international equities and alternative investments as potential safe-haven options.
"Looking at the performance over the past three months, you can see that gold, bitcoin, international stocks, long/short strategies, and even cash rank among the best-performing asset classes. To me, that’s a logical starting point," stated Jurrien Timmer—a rather intriguing conclusion when it comes to bitcoin.
Thank you for reading!
To stay informed about the latest market developments and insights, you can follow our team members on X:
- Bart Mol (@Bart_Mol)
- Peter Slagter (@pesla)
- Bert Slagter (@bslagter)
- Mike Lelieveld (@mlelieveld)
We appreciate your continued support and look forward to bringing you more comprehensive analysis in our next edition.
Until then!