Bitcoin Hits a All Time High at $112,000
Bitcoin surged 9% in just 5 days, smashing past its April low to a record $112k—a 50% climb in under seven weeks. Is a rally to $150–$165k on the horizon, or are deeper corrections imminent? With strong ETF inflows and bullish investor sentiment, bitcoin continues to outshine altcoins.

After ten days with a daily trading range between $102,800 and $104,800, bitcoin’s price surged over the past week. In just five days, it climbed by 9% to a provisional high of $112,000—a new record!
This all-time high caps off an impressive rise since the low of $74,500 on April 7. In just under seven weeks, the price has jumped 50%.
We’re witnessing a strong short-term upward trend: higher highs and higher lows, with a substantial gap above the 50-day moving average. So far, any pullbacks have been minor—if you can call them pullbacks at all—they haven’t dipped more than roughly five percent.
That won’t always be the case. In the Alpha Markets on May 2, we suggested a price target of $150k–$165k for the current weekly cycle. On the way there, deeper corrections are likely. But when will they occur? And how deep?
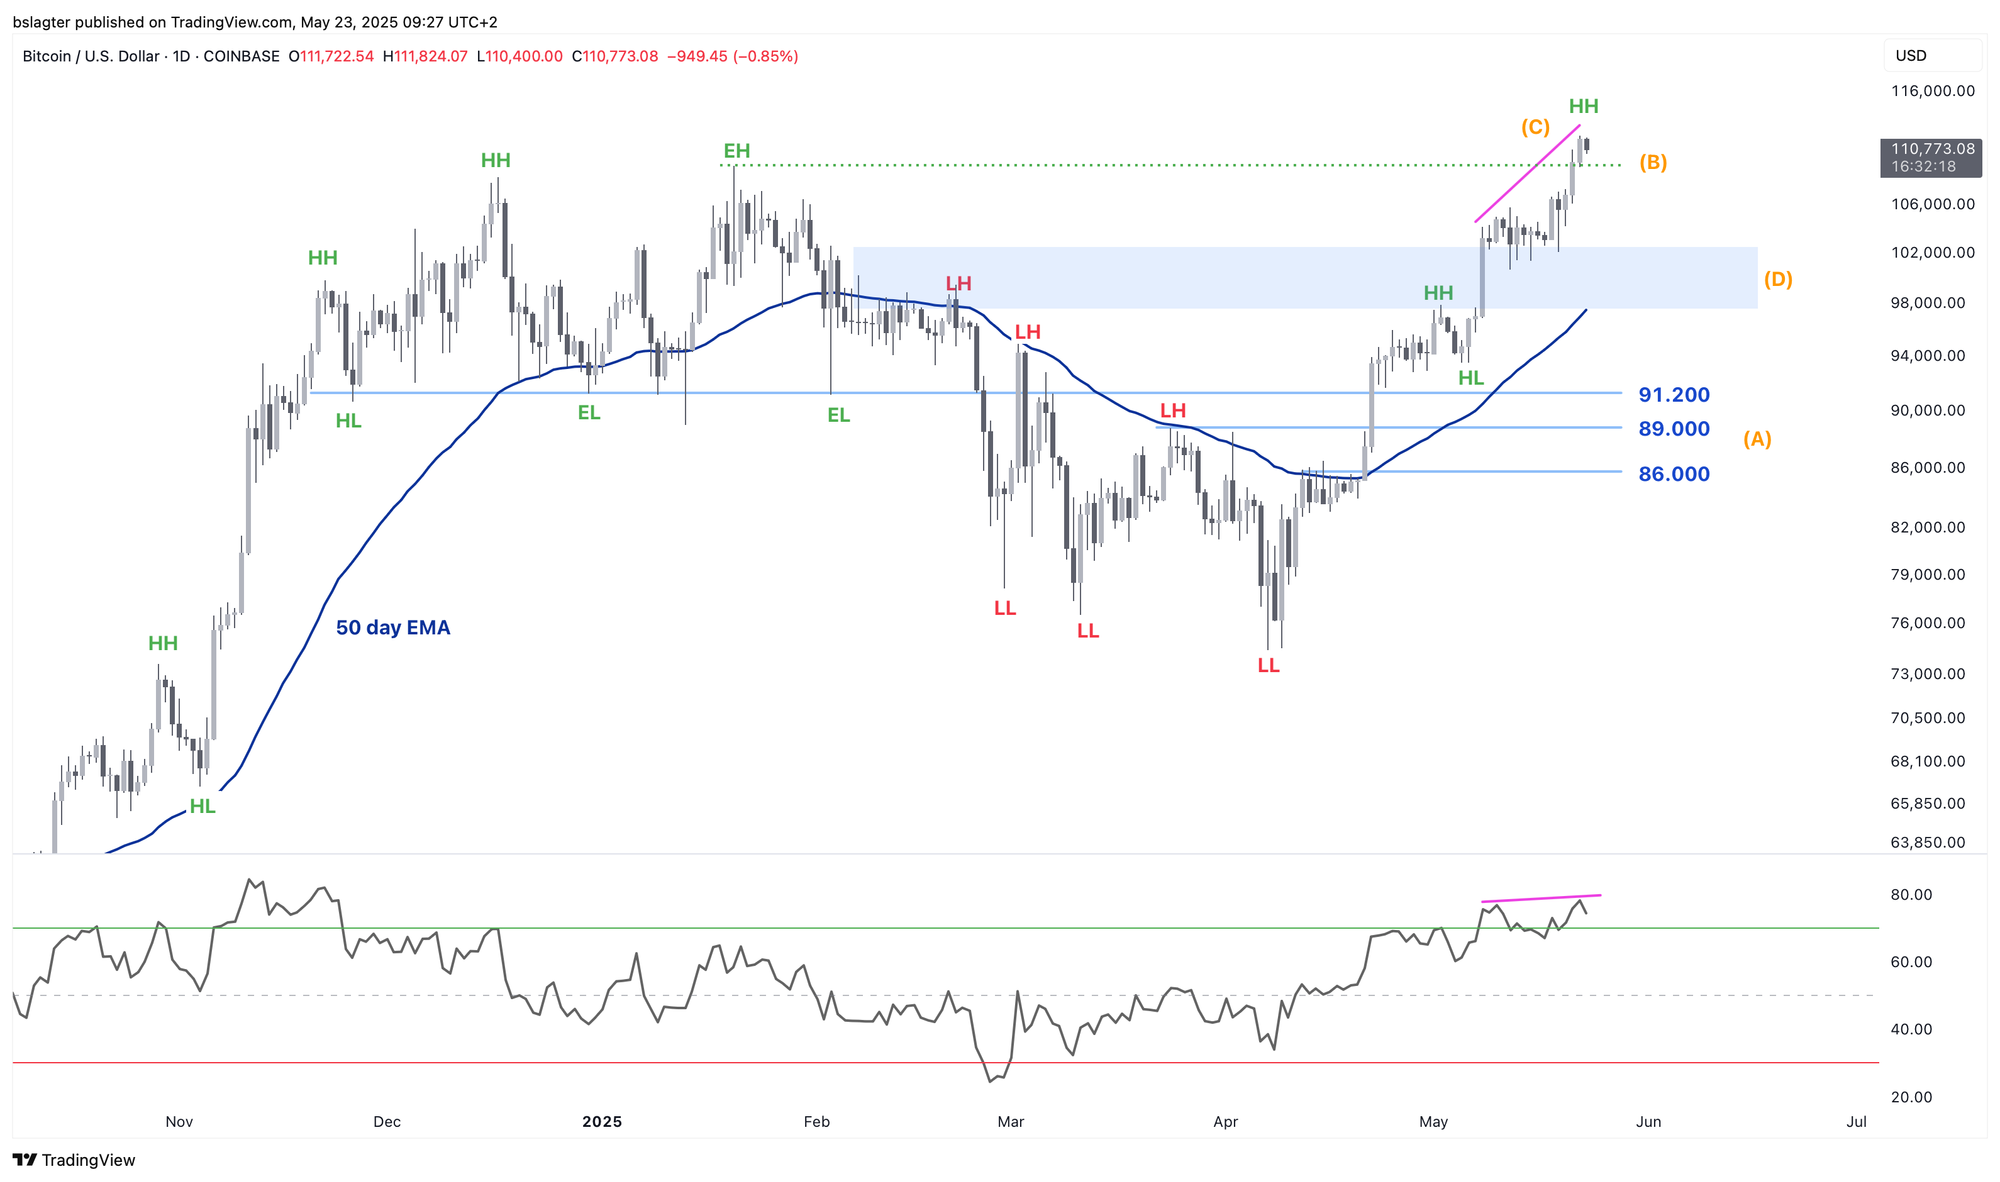
The chart below shows the rise over the past several weeks. We broke through three key horizontal levels (A) and reached a new all-time high (B).
The earlier bearish divergence on the RSI has now vanished, hinting that the upward run could continue for a few more days (C). However, the gap above the 50-day moving average is large, and we’re well over halfway through this initial daily cycle.
It’s likely we’ll see a deeper correction in the next three weeks. How deep it goes will also depend on how much further we rise. Still, the zone between $98,000 and $102,000 appears most plausible (D). From there, a new upward phase could begin in June.
Bitcoin, with its new all-time high, is once again leading the crypto market. In this market cycle, which began in November 2022, bitcoin has consistently outperformed the rest. There are moments when certain altcoins shine, but capitalizing on them requires intense focus and a fair bit of luck. Most altcoin traders end up losing compared to simply holding bitcoin.
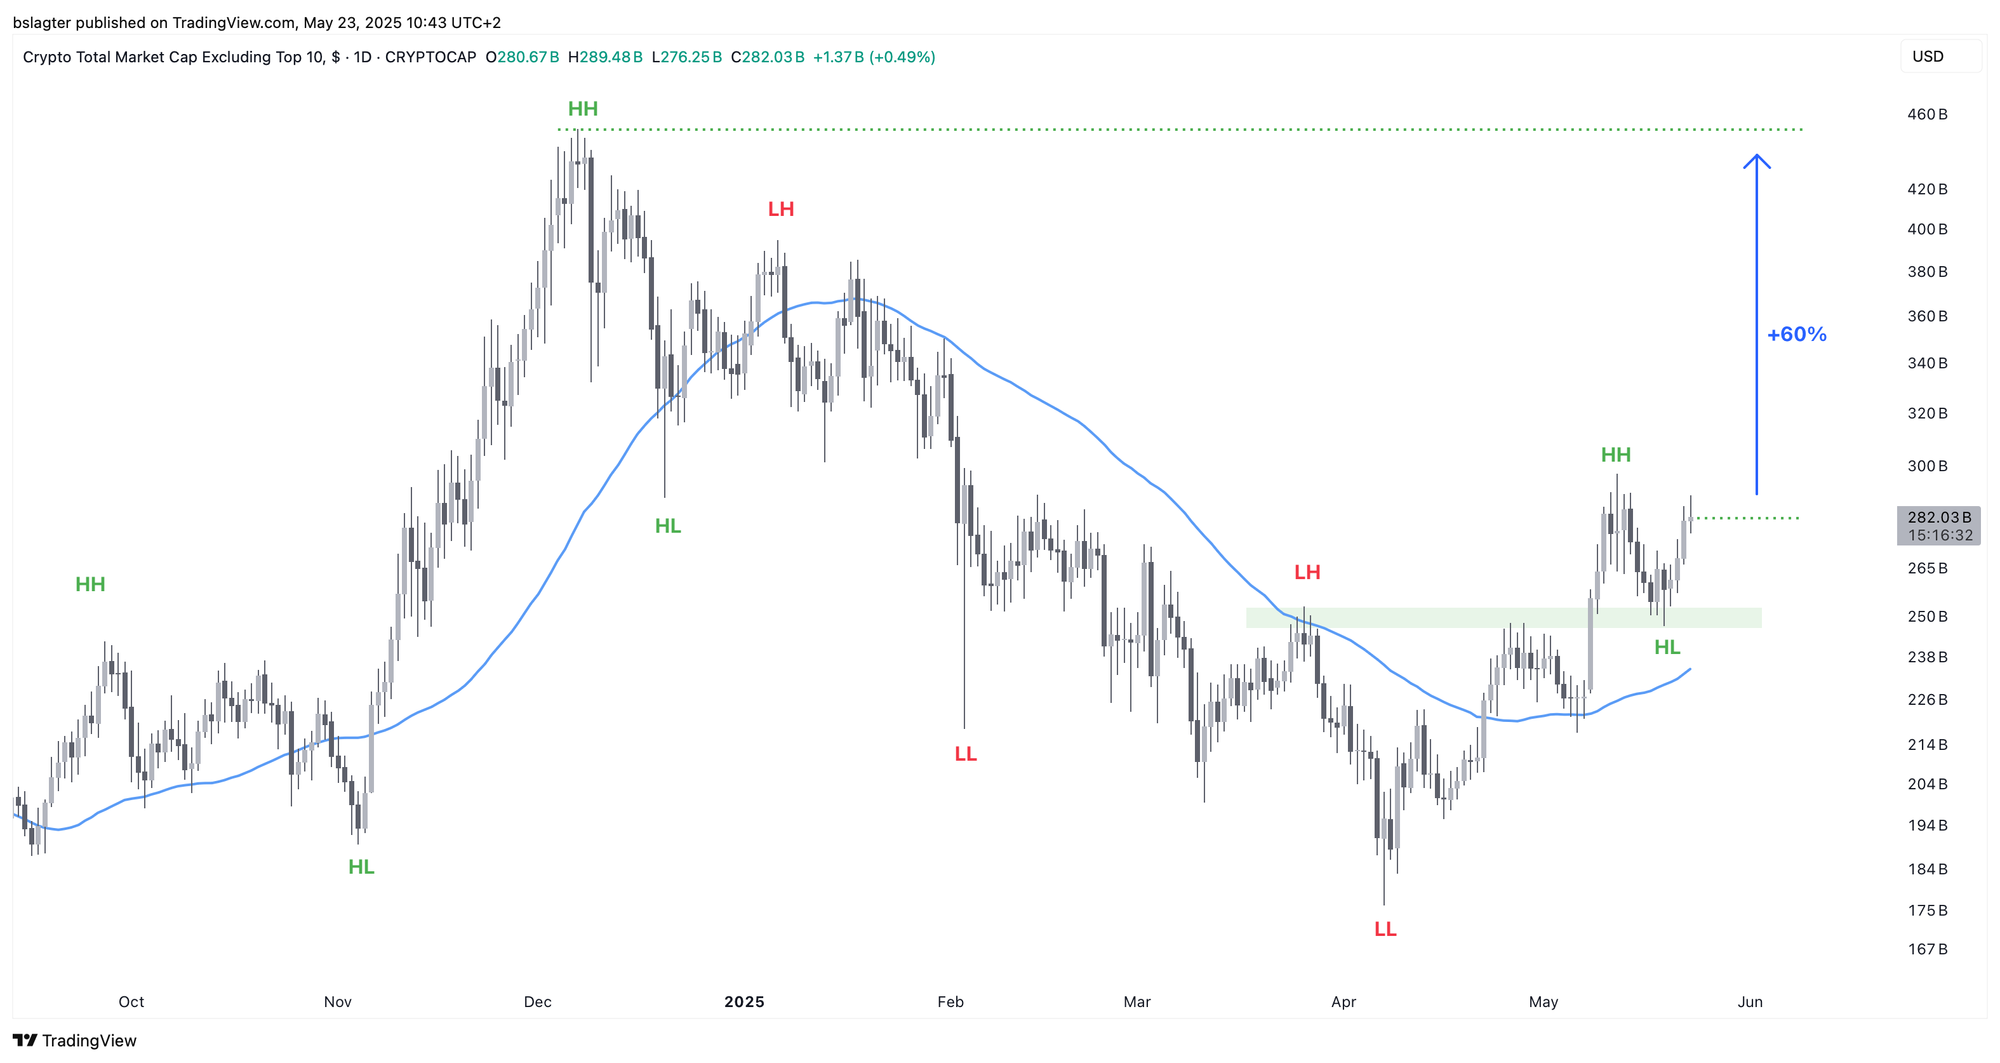
The chart below illustrates this point. It shows the total market cap of altcoins ranked from 11 to 125, and there’s still a 60% increase needed to hit a new record level.
This surge could very well happen in the coming months. The trend has shifted from downward to upward. We’re again seeing higher highs (HH) and higher lows (HL), with the dominant moving average offering support and trending upward. We’re even noticing an initial resistance level morph into support.
However, the question isn’t just whether altcoins will rise, but whether they will rise faster than bitcoin. Otherwise, you might as well invest in bitcoin. A prolonged, structural outperformance by altcoins is what people refer to as “alt season” or “the banana zone.” We haven’t seen that yet—bitcoin dominance is still on the rise. Will that change? Then you’ll hear from us!
Last week, we observed that existing investors are showing confidence after the recent rally. On-chain data indicates they are increasing their positions while taking only minimal profits. They clearly expect even higher prices.
We demonstrated this with Glassnode’s Accumulation Trend Score chart. Glassnode combines all bitcoin addresses owned by the same entity and then evaluates whether these entities are accumulating (i.e., increasing their holdings) or distributing (i.e., decreasing their holdings) bitcoin.
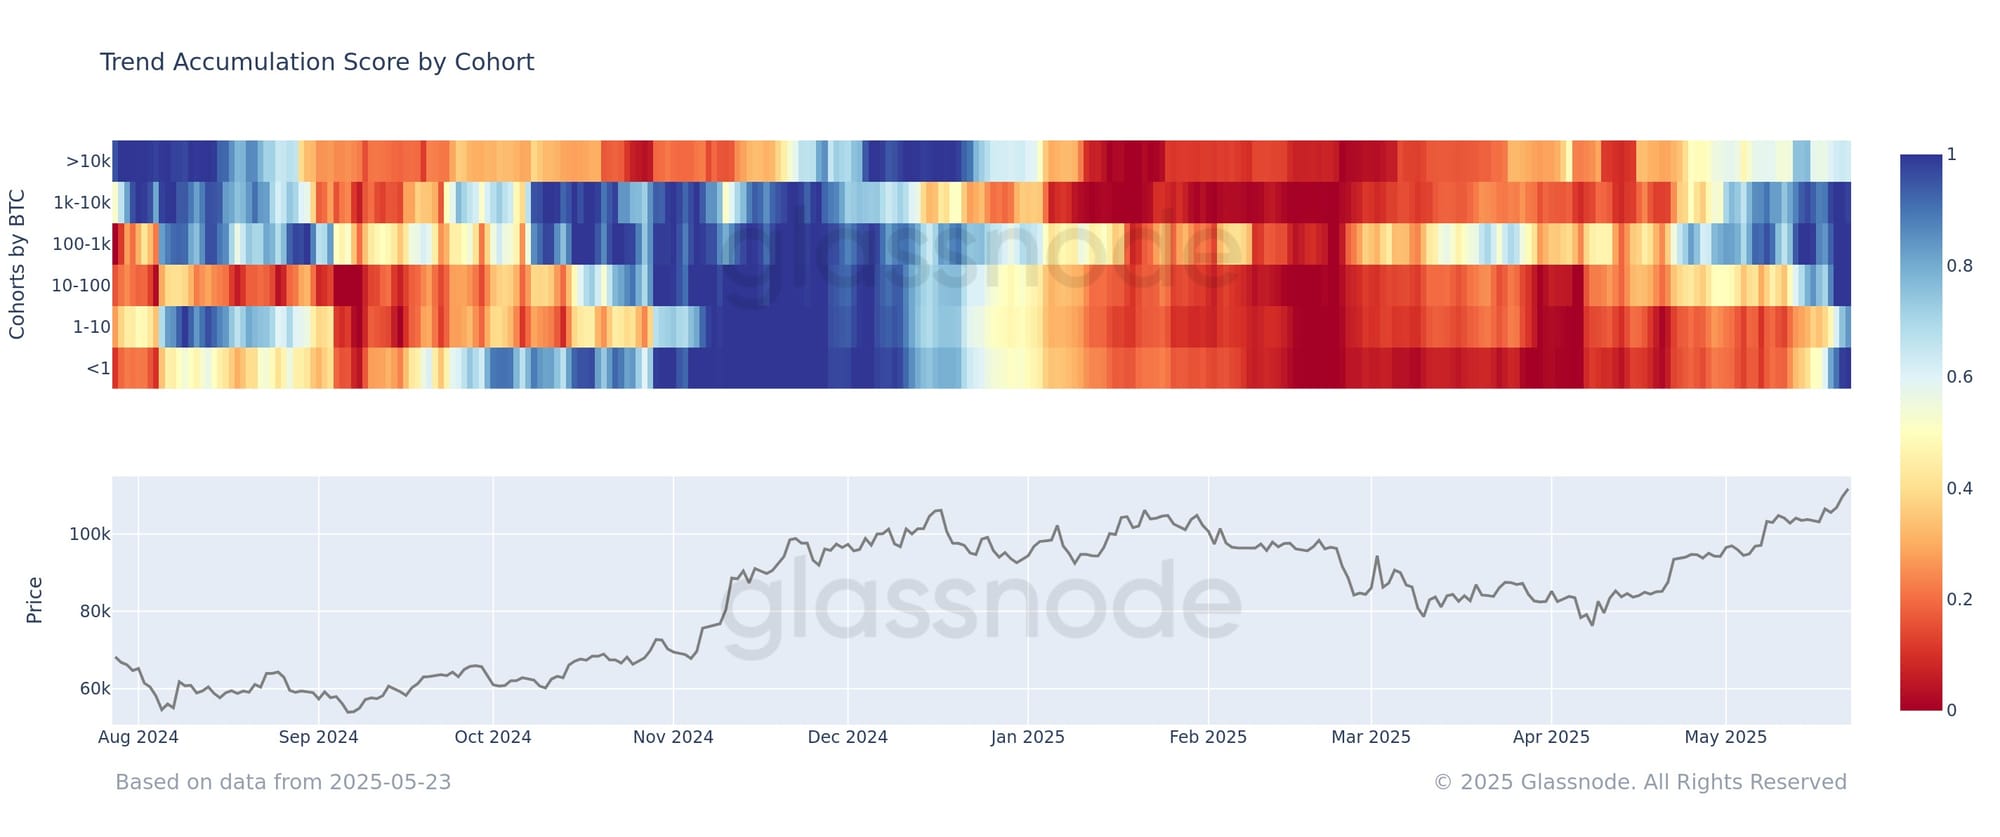
Glassnode also offers a visualization of the Accumulation Trend Score, categorizing investors by size so you can see if smaller and larger investors behave differently. Blue signifies accumulation, while red indicates distribution.
By mid-April, large investors had already shifted from red to blue. Only last week did smaller investors join them. Earlier in this cycle, such an extended blue phase typically lasted between one and a half to two months.
We continue with the following topics for our Alpha Plus members:
- Capital to ETFs and the Rest of the Bitcoin Market
- On-chain Indicator: Sell-Side Risk
- Updated Scenario for the Coming Months
- Big & Beautiful Lies from Donald Trump
- Increasing Evidence for the Resumption of the Bull Market
1️⃣ Capital to ETFs and the Rest of the Bitcoin Market
Bert
It’s been a while since we examined the capital flows to and from the US spot bitcoin ETFs. They debuted in January 2024—more than 16 months ago. Since then, ETF shares have been purchased for $44 billion.
Together, these ETFs now hold 1.2 million BTC in custody, with a market value of $133 billion at a rate of $110,000 per bitcoin. That far exceeds the $44 billion in inflows. This is partly because the Grayscale fund didn’t start with zero bitcoin, and partly due to the price appreciation of the bitcoins held in custody.
The $44 billion wasn’t evenly distributed over the past 16 months. There have been periods of strong inflows, moderate inflows, and even slight outflows. So far, the peaks in inflows have aligned with major bitcoin price surges.
At first, this might seem odd. After all, an ETF share is just another form of bitcoin, and ETF trading is part of the bitcoin market.
A likely explanation is that strong price surges coincide with the entry of new investors, who are overrepresented in the ETF segment of the bitcoin market—largely because ETFs didn’t exist two years ago, so all earlier investors hold non-ETF bitcoin.
The chart below displays the weekly capital flow into bitcoin ETFs. After a period of outflow, we’re now seeing five weeks of strong inflows—averaging about $1.8 billion per day.
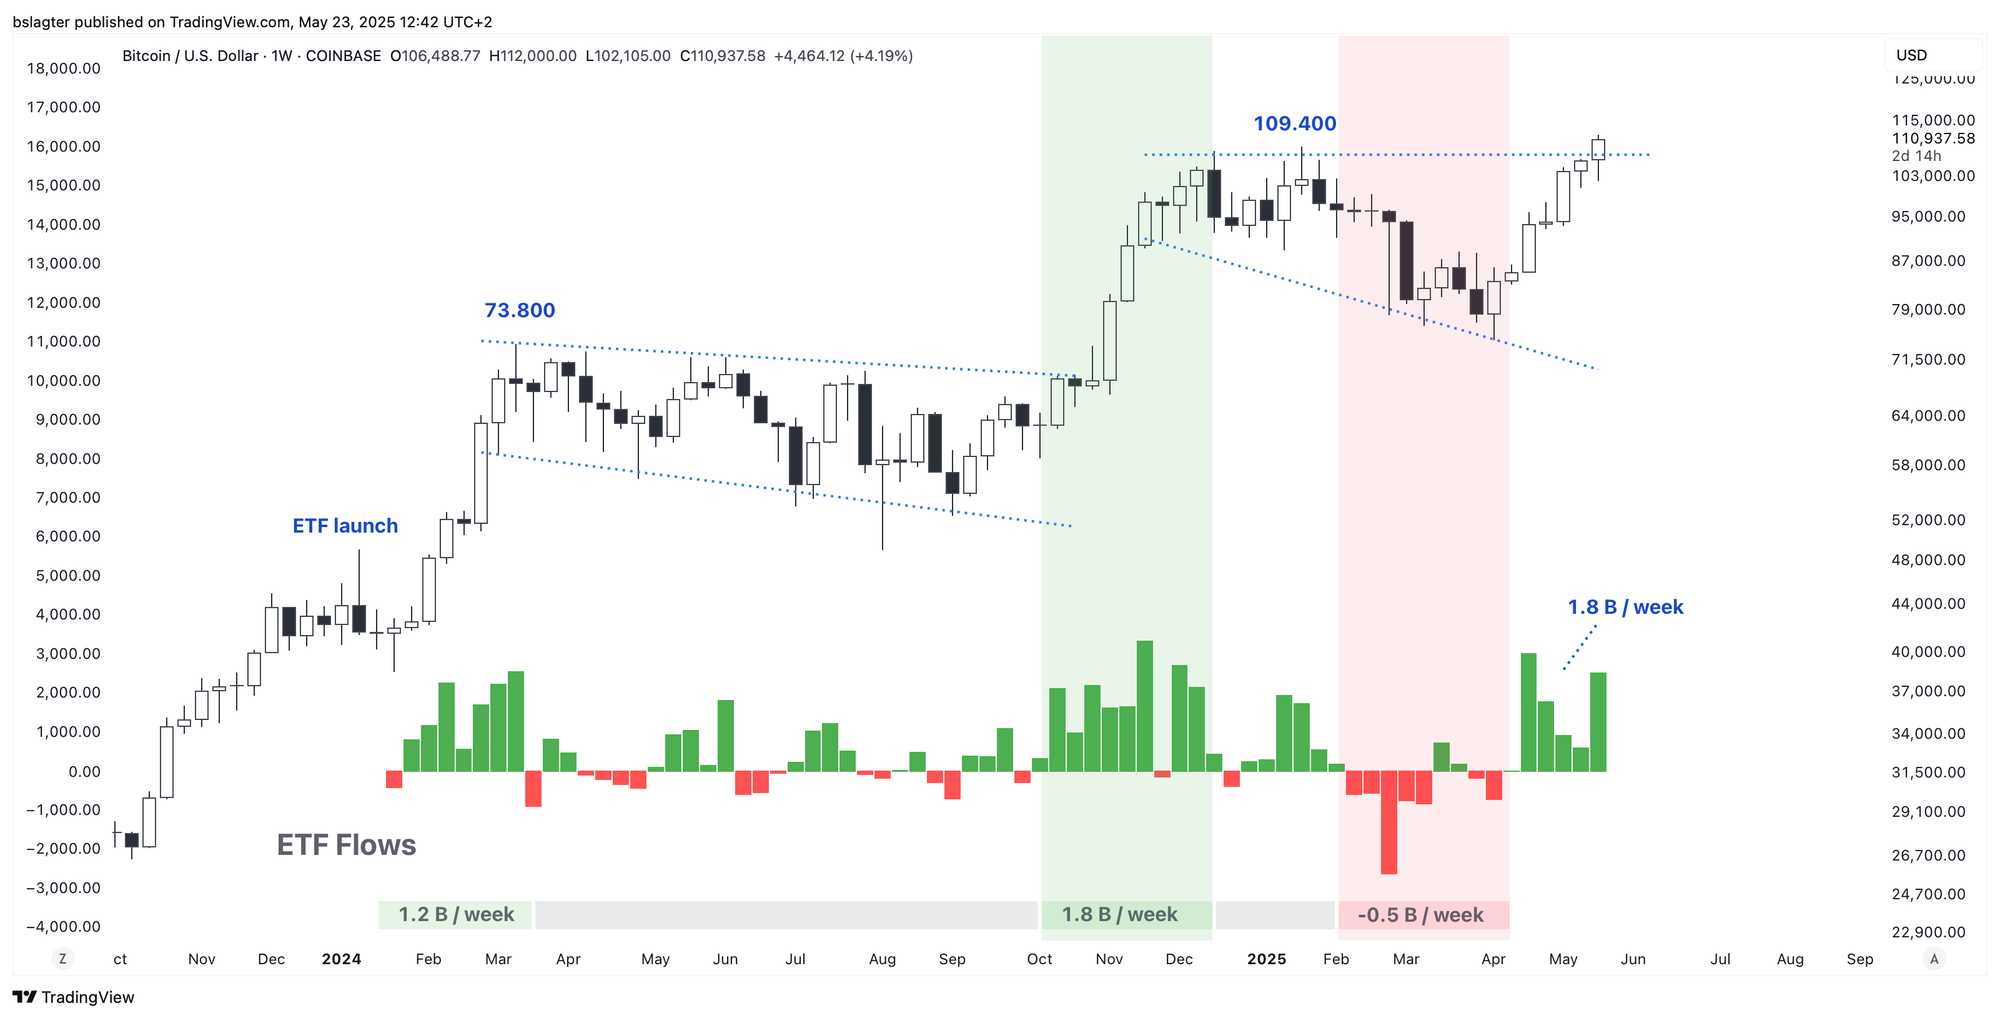
This level of inflow is comparable to the entire period from October through December. However, doubling the price from $75k to $150k requires more capital than increasing it from $50k to $100k. To reach such levels, the capital inflows must continue accelerating.
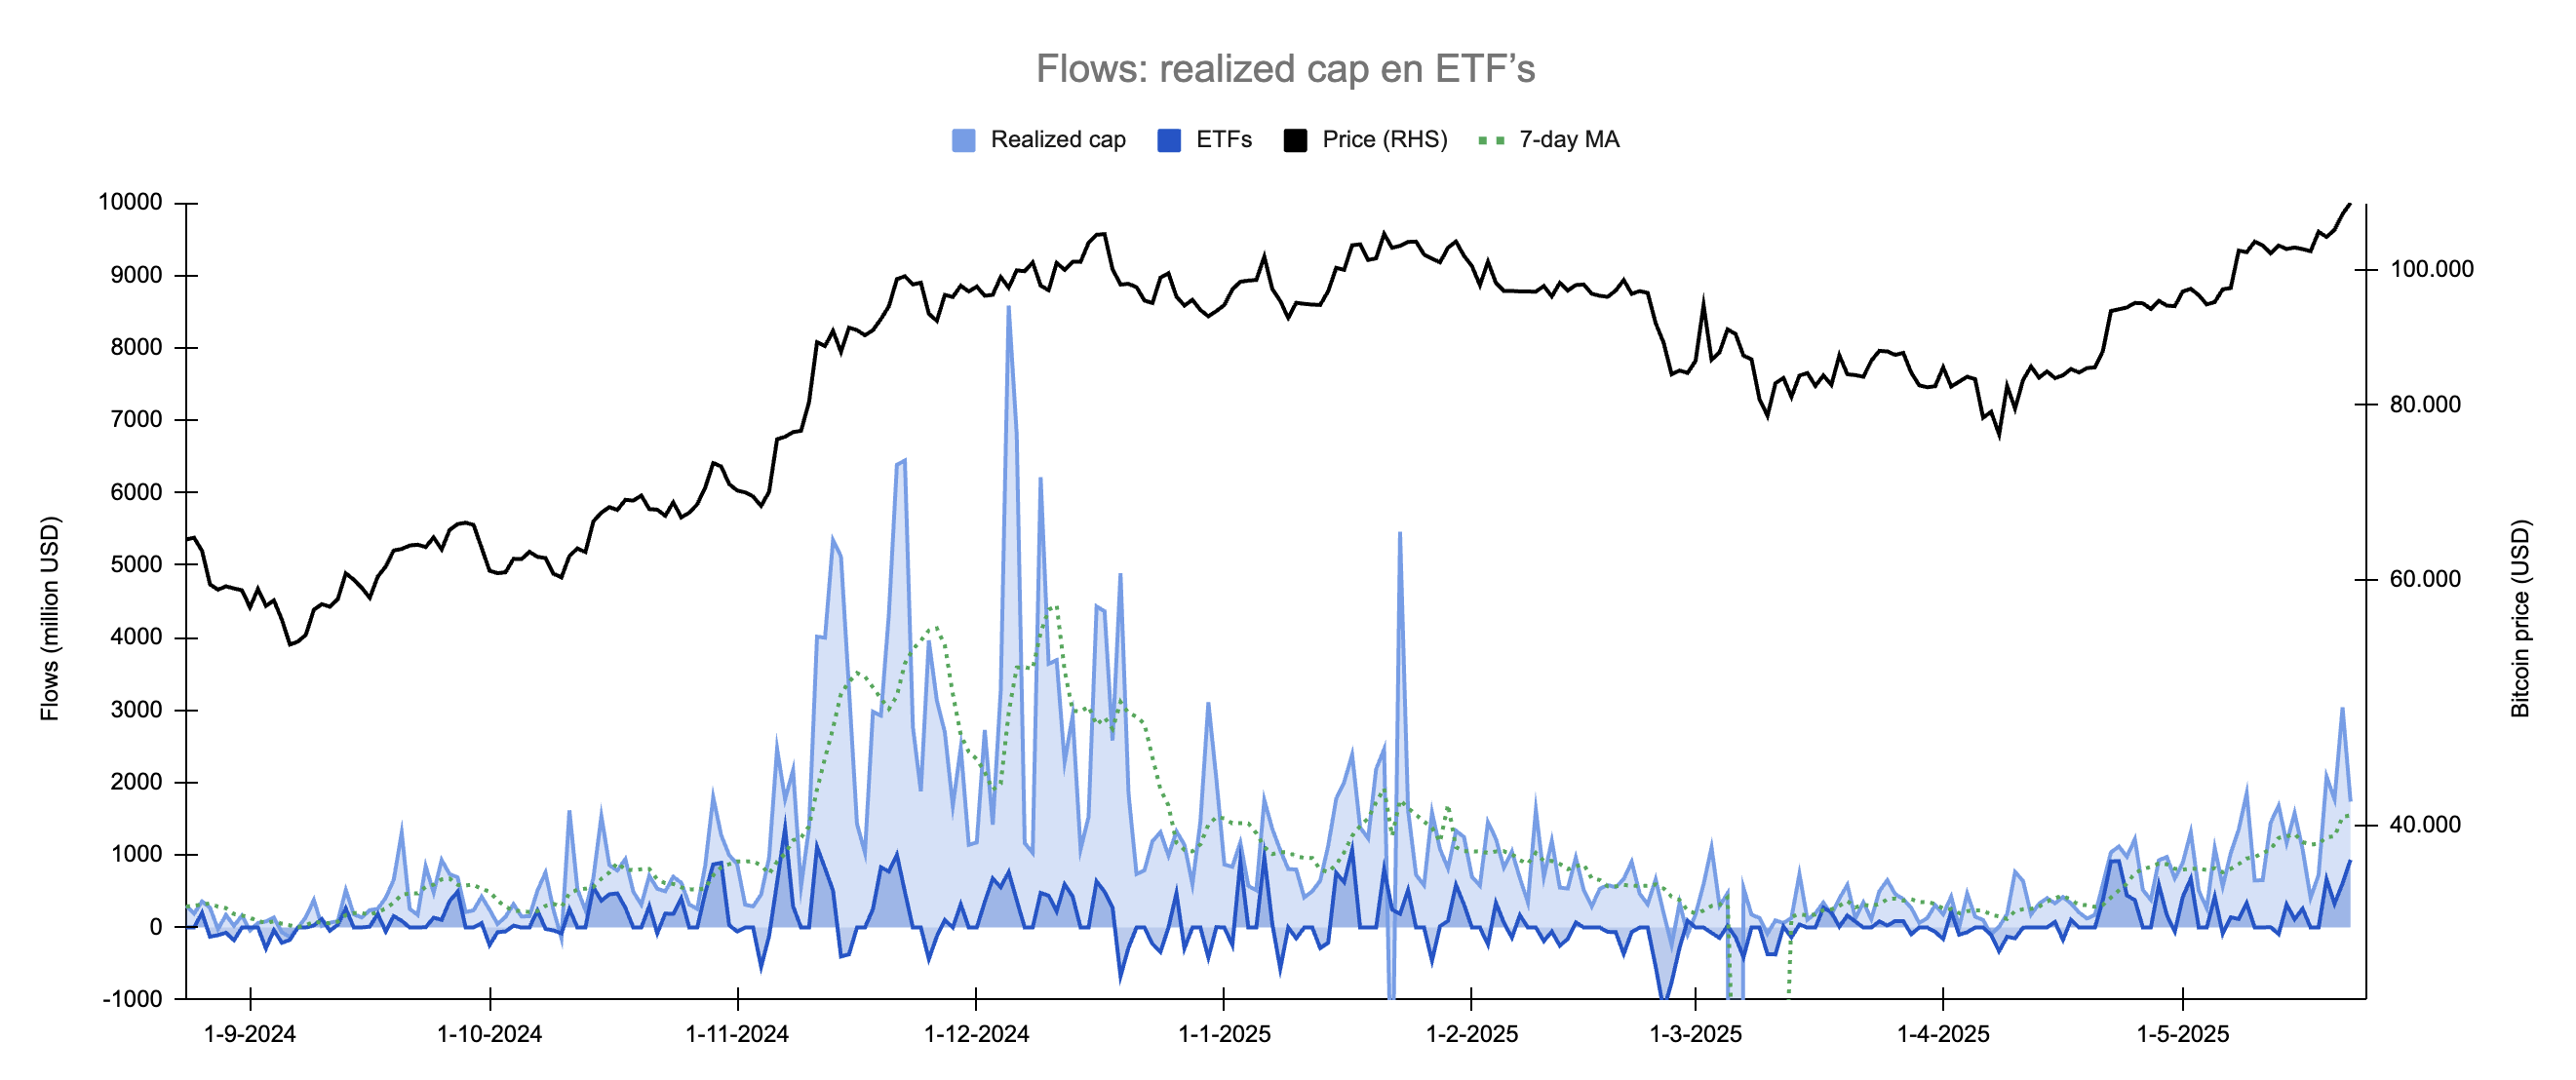
ETFs capture only a portion of the total capital flowing into the crypto market. In November and December, we initially saw ETF inflows pick up, with the rest of the crypto market following afterward. This is clearly shown in the chart below, where dark blue represents ETF inflows and light blue depicts the overall crypto market based on the increase in realized cap.
In December, we recorded several consecutive weeks with inflows of $3 billion per day. At a price of $100,000, that equated to 30,000 bitcoins per day. We discussed this in the Alpha Markets on December 13.
Currently, the 7-day average inflow is $1.6 billion per day and rising. We’re eager to see where this leads!
2️⃣ On-chain Indicator: Sell-Side Risk
Bert
Last week, we explored the traces that current investors leave in on-chain data, including realized profit. During bull runs, this becomes a useful indicator because most investors are in profit, so most sales generate a gain.
A more precise approach is to consider both realized profit and realized loss. These are the quantifiable results of the decision to sell. Dividing their sum by the realized cap shows what portion of all capital ever invested in bitcoin is currently active.
Mikołaj Zakrzowski coined this ratio as Sell-Side Risk in 2022:
Sell-Side Risk = (Realized Profit + Realized Loss) / Realized Cap
Glassnode notes that as bitcoin matures and volatility decreases, the upper and lower boundaries will likely converge. You can clearly see this in the chart from the past ten years below.
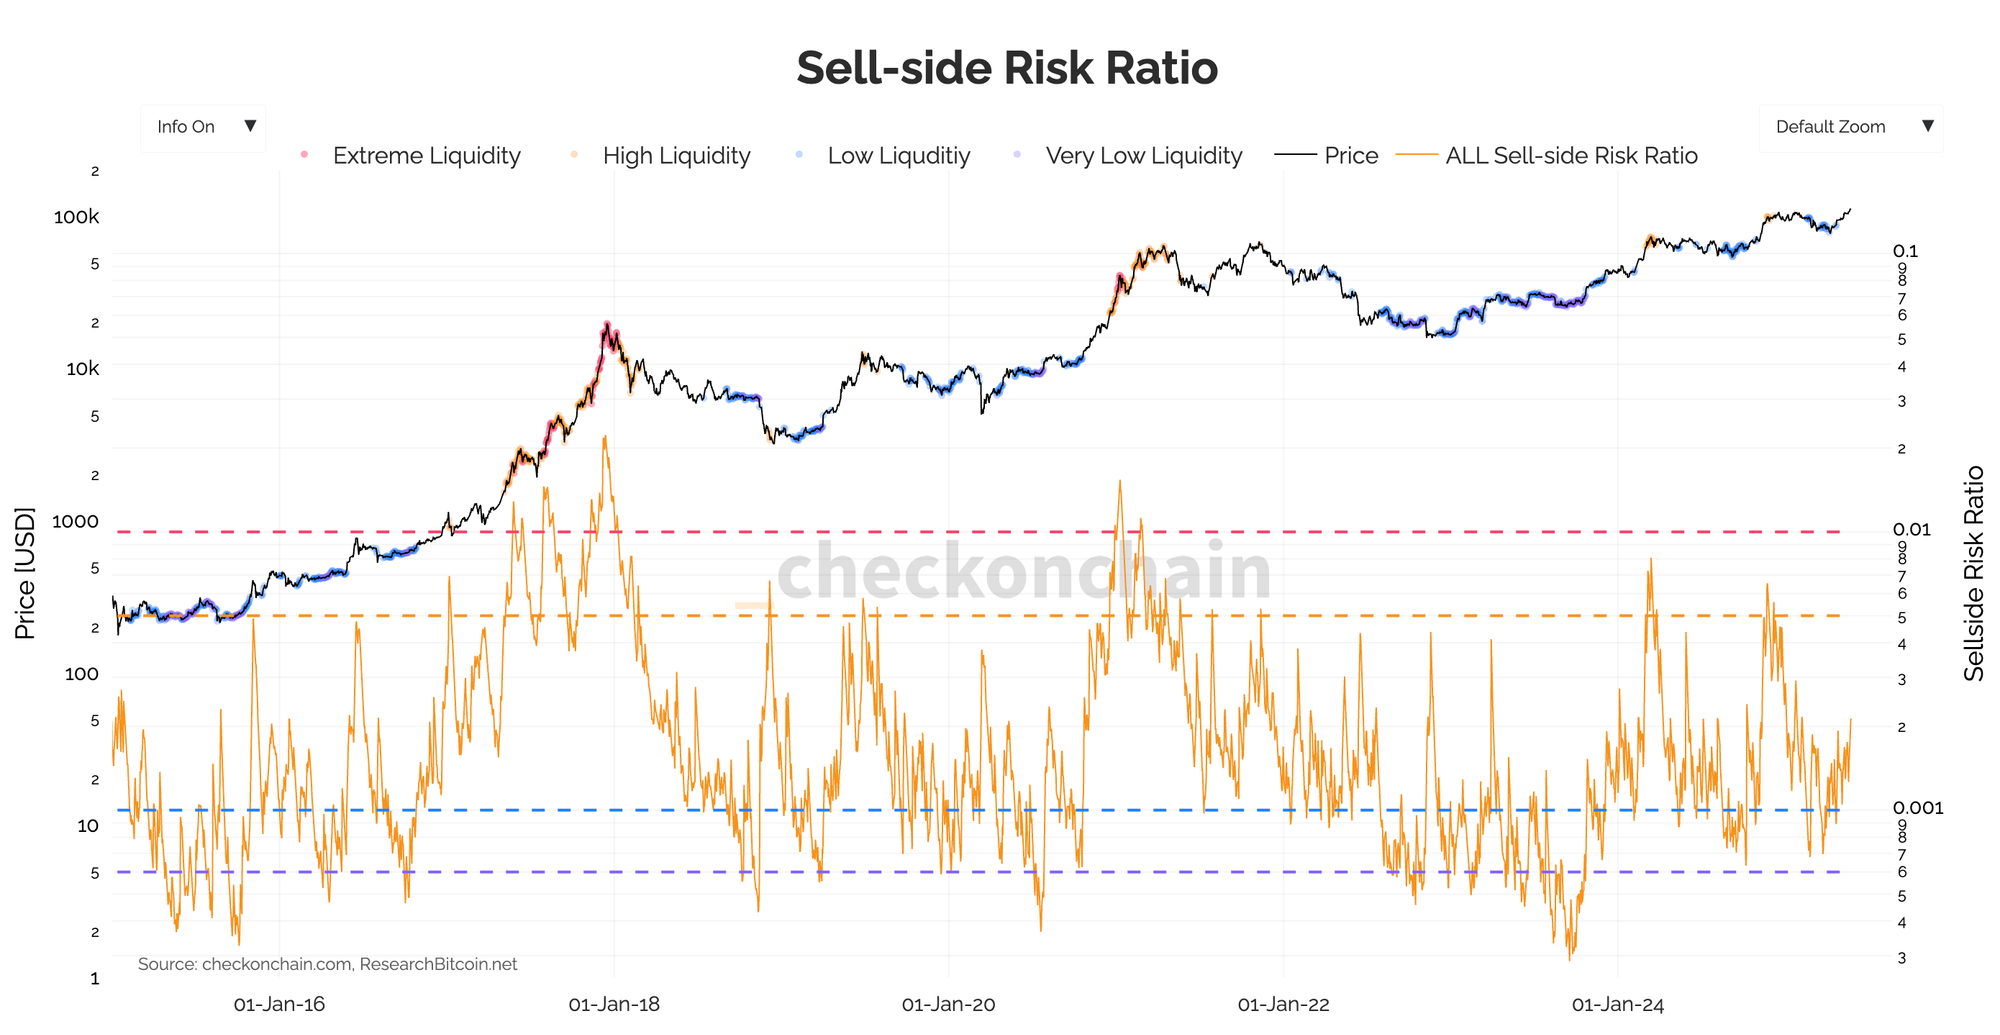
Looking at this bull market, we can identify two peaks. The first occurred in March 2024, following the launch of the ETFs and the breaking of the all-time high set during the 2021 bull run. The second happened in November 2024, after Trump’s election victory and surpassing the $100,000 mark.
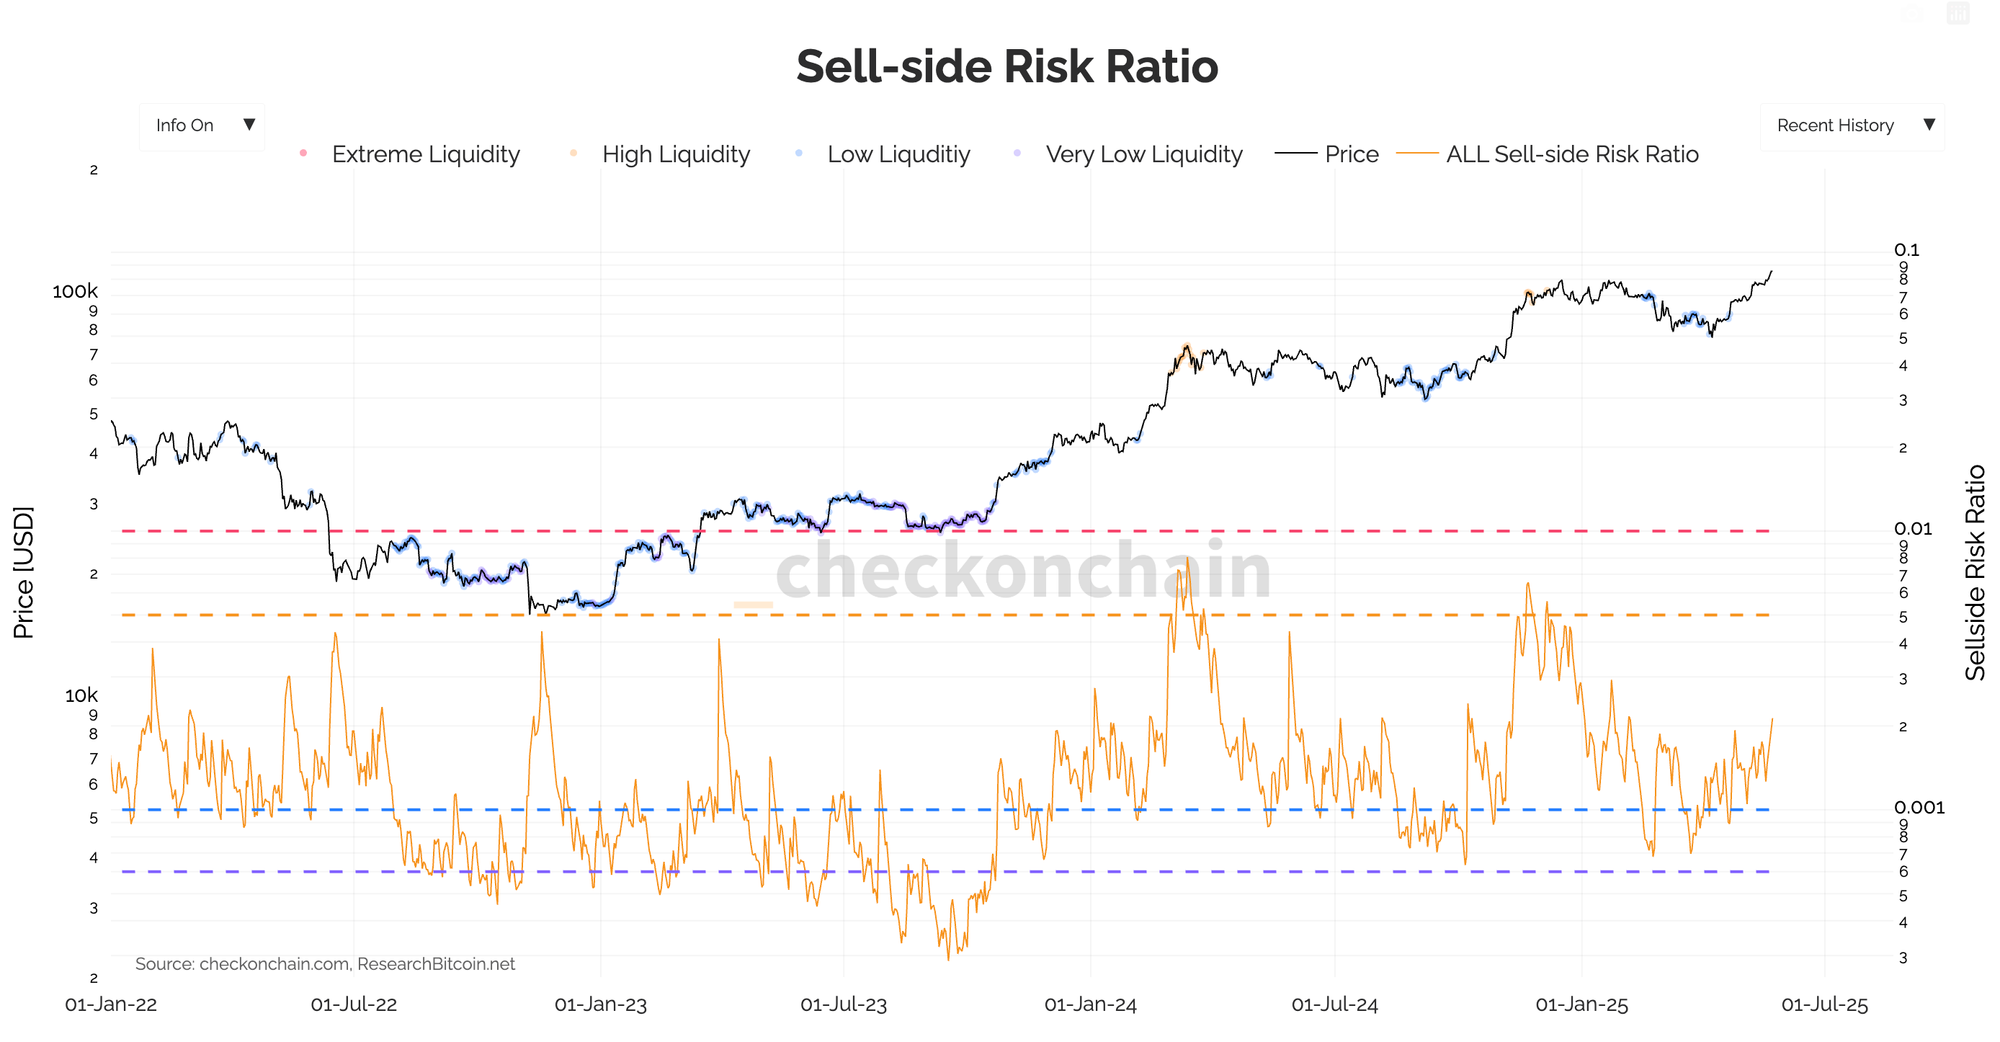
Currently, Sell-Side Risk is neutral—positioned right in the middle of the zone highlighted by CheckOnChain. Sellers aren’t swayed by $112,000; they’re waiting for either higher or lower prices before acting.
Or, as James Check explains in his newsletter:
When we compare the total capital flows into Bitcoin to the Realised Cap, we get the Sell-side Risk Ratio, and it’s trading at fairly modest levels right now.
This tells me that the profit taking we are seeing today is unlikely heavy enough to saturate demand, so I think this ATH break-out looks pretty healthy thus far.
3️⃣ Updated Scenario for the Coming Months
Bert
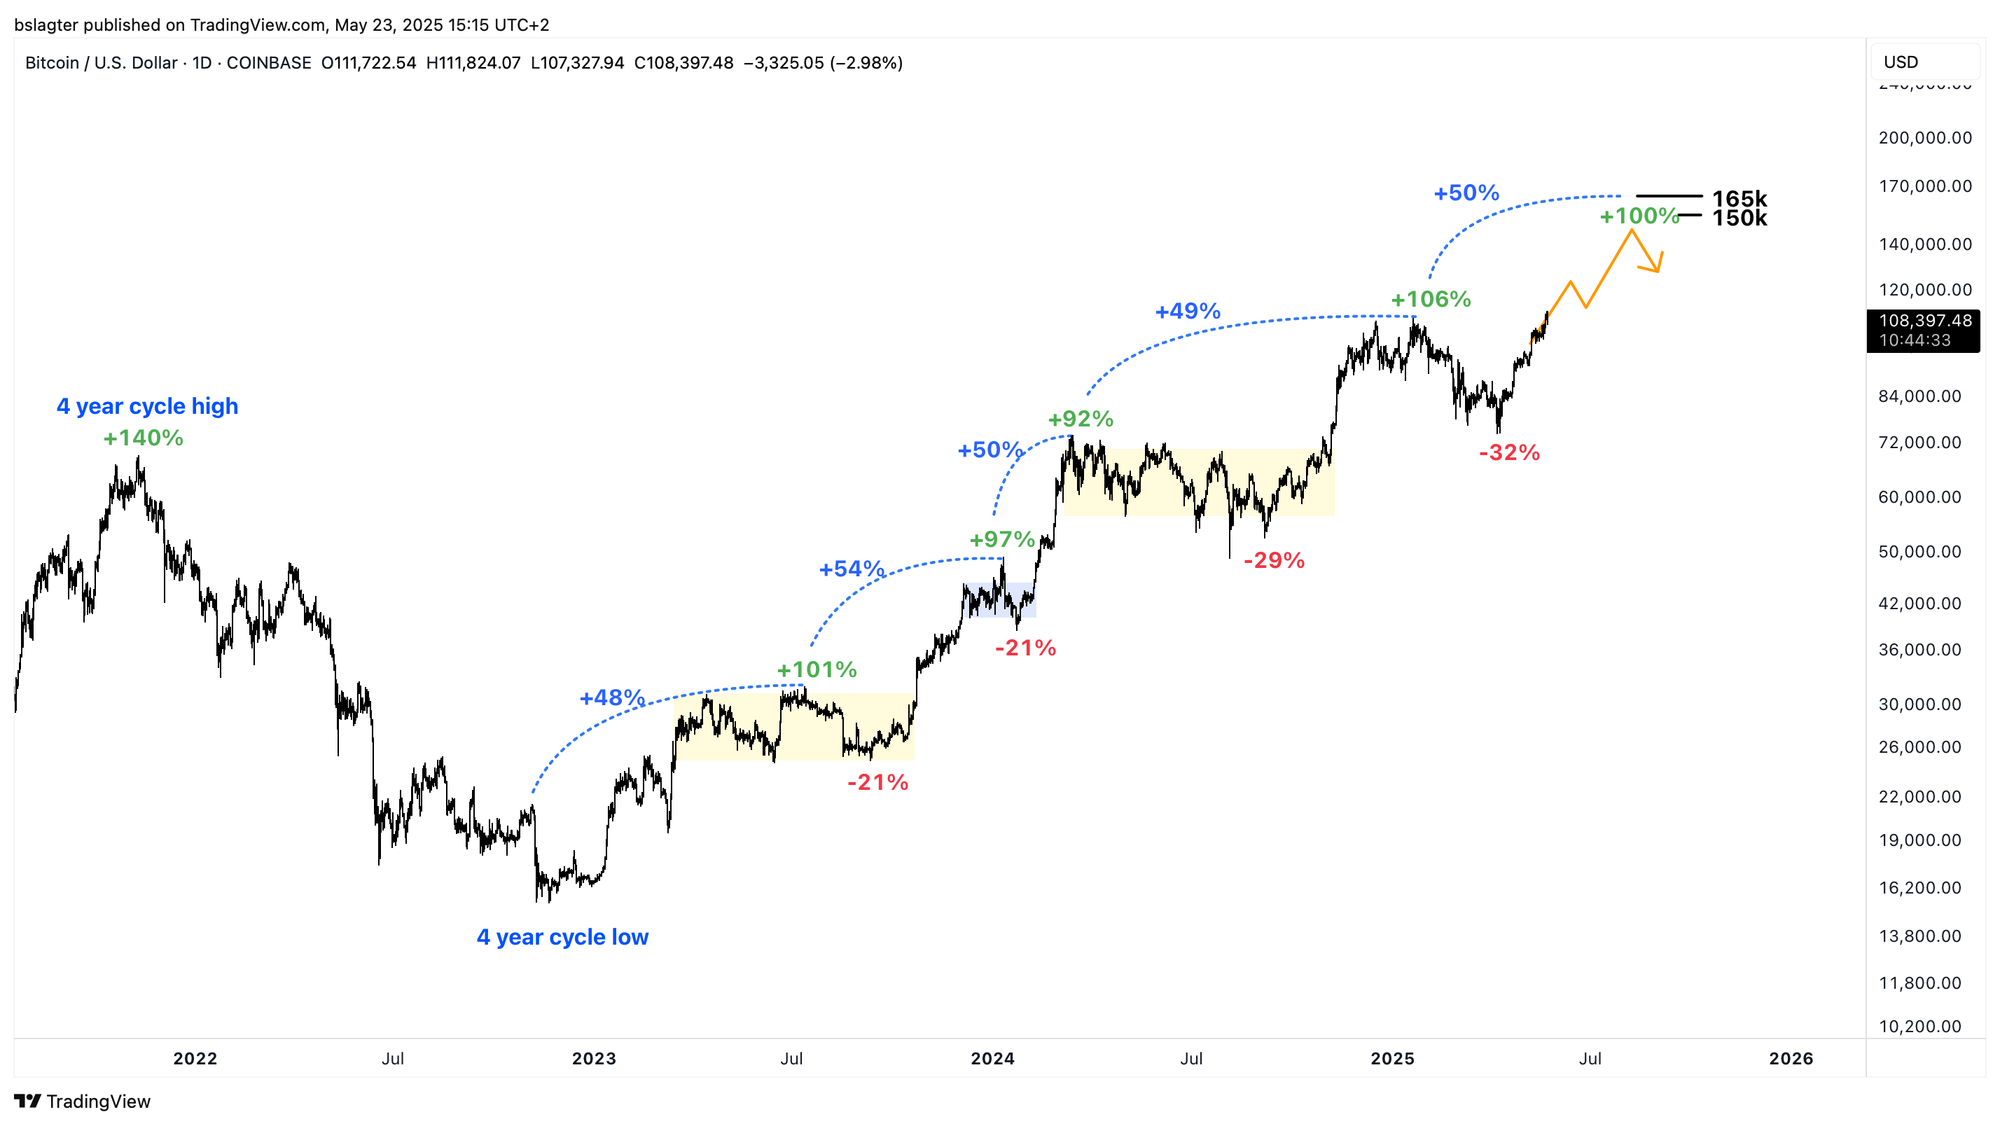
In recent weeks, we outlined a scenario for a new weekly cycle that would mirror the results of four previous cycles in this bull market—roughly a 100% increase from the bottom and about 50% higher than the previous cycle’s high.
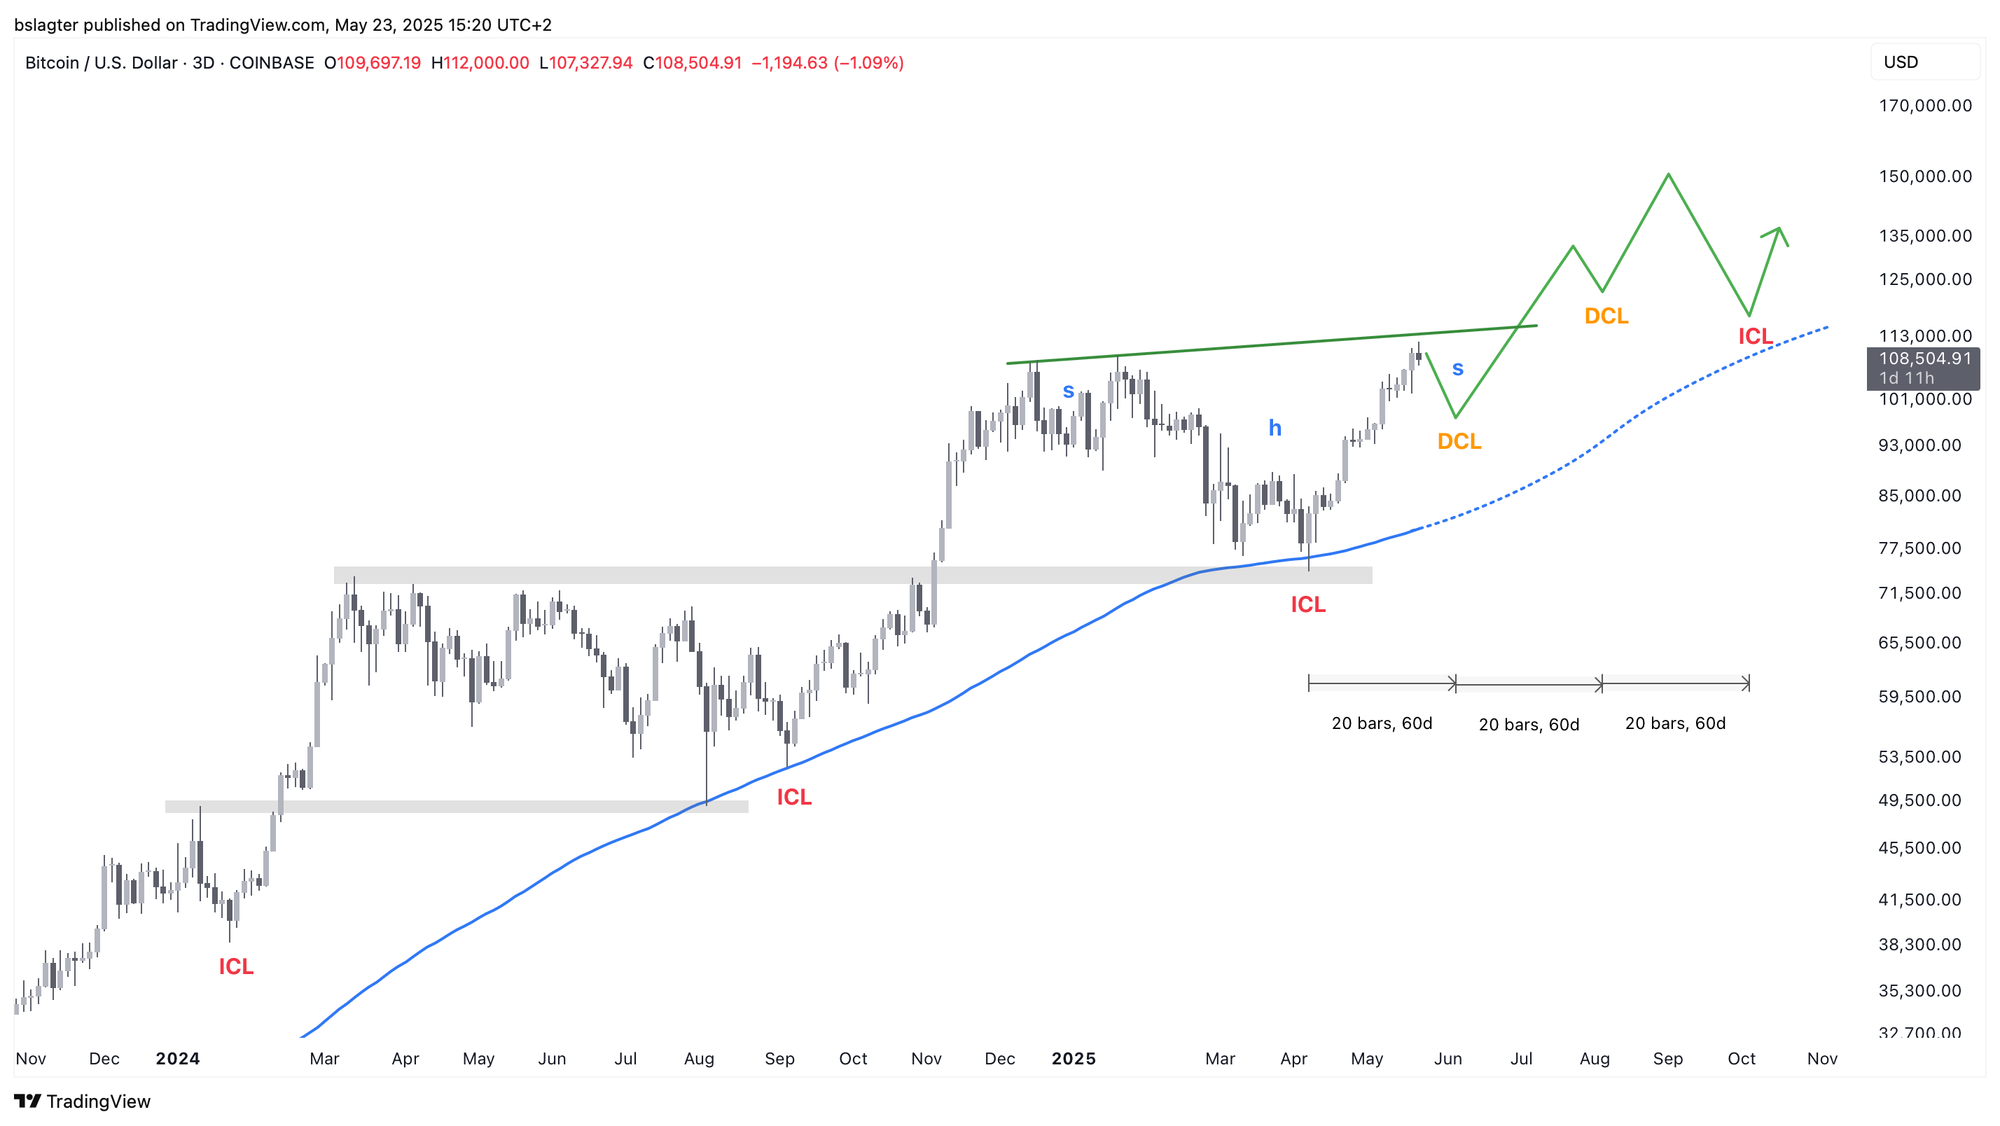
In the Alpha Markets on May 2, we presented the chart below. You can see it updated with prices from the past three weeks. I highlighted the arrow in orange to make it more noticeable. So far, everything is on track!
Last week, we discussed a very specific scenario in which bitcoin forms a head-and-shoulders pattern before leaping to $150,000. While this picture is highly speculative, it’s very much in line with bitcoin’s style.
Below is an updated version. If we assume that $112,000 is the high, it creates a slightly sloping neckline, with the right shoulder around $98,000. It remains speculative, but it’s certainly interesting to watch.
4️⃣ Big & Beautiful Lies from Donald Trump
Thom
Donald Trump’s second term began with the bold promise to tackle the growing budget deficit and mounting national debt. On February 5, Finance Minister Scott Bessent even declared that lowering the yield on 10-year Treasuries was the top priority.
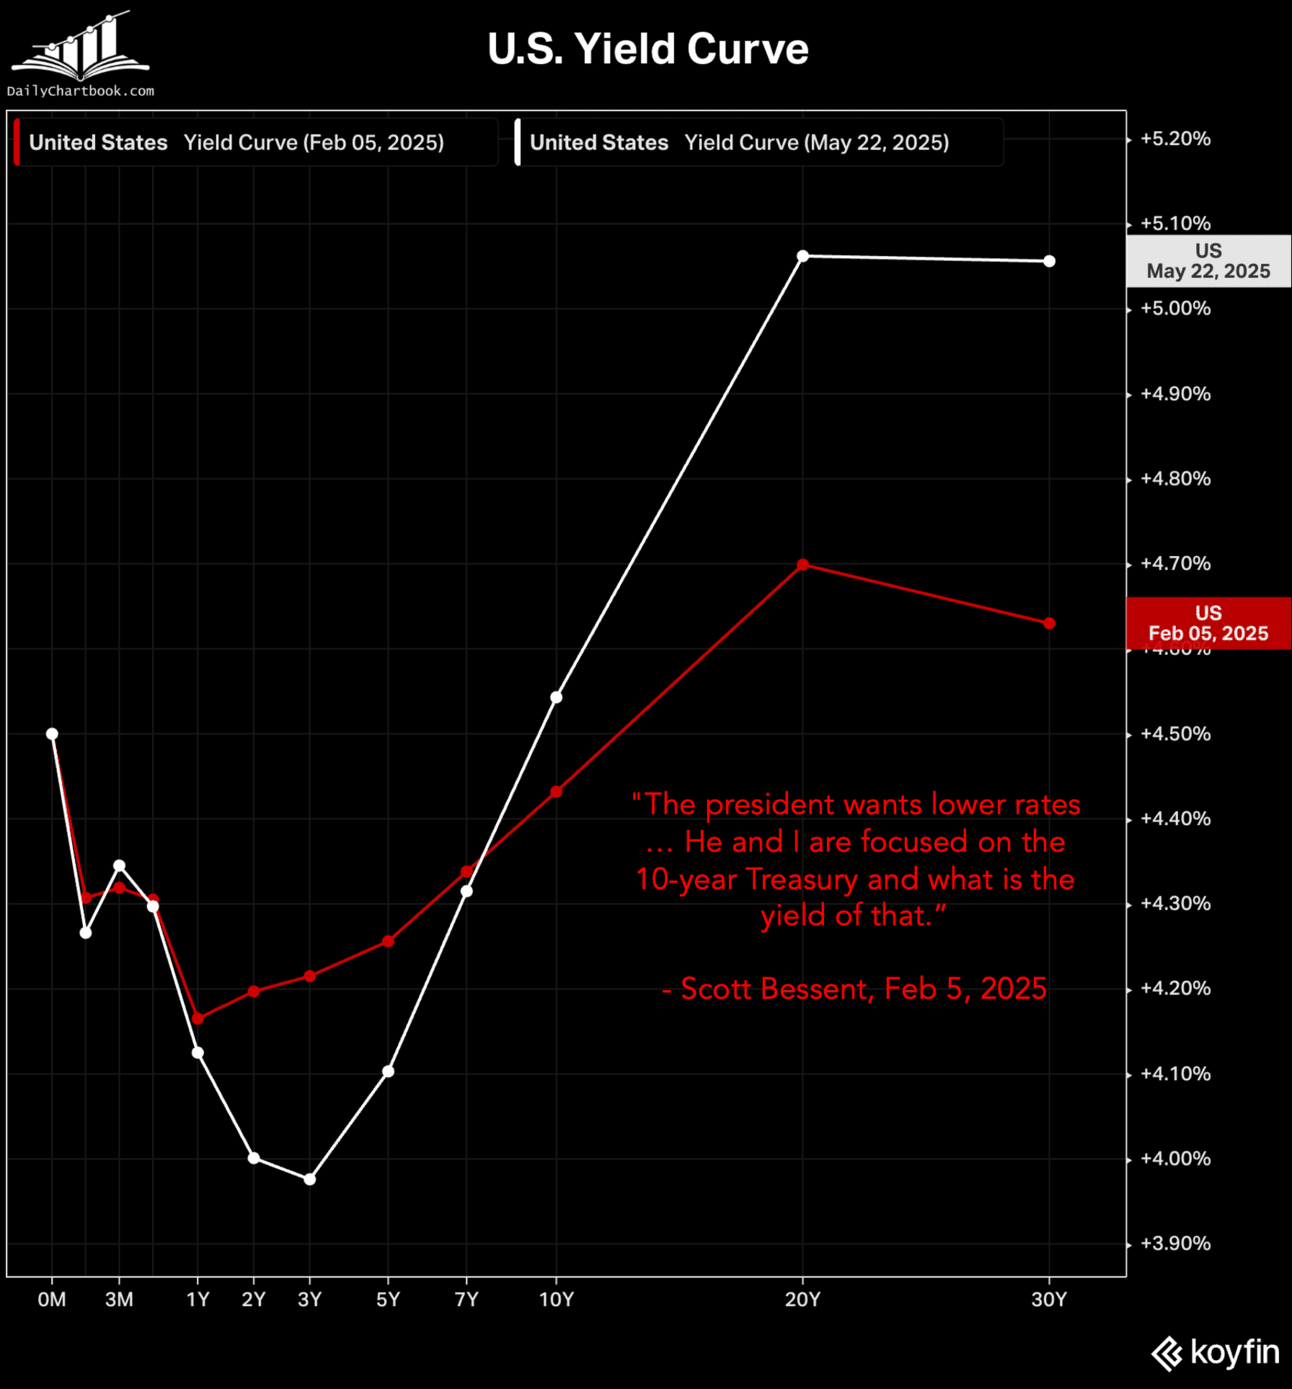
It initially looked possible to push down bond yields, but it’s now clear that even Donald Trump won’t restore fiscal discipline. In fact, this week it emerged that the new policy directly contradicts earlier plans to reduce the deficit.
Instead of cutting spending, the government has opted for a strategy where economic growth must outpace the rising debt. The previous focus on frugality—which was central just three months ago—has been replaced by a more active government role in stimulating the economy.
We've inherited a 6.7% deficit-to-GDP, the highest outside war or recession.
— Treasury Secretary Scott Bessent (@SecScottBessent) May 18, 2025
Our focus is to grow the economy faster than the debt, that’s how we will stabilize debt-to-GDP. pic.twitter.com/yblwrunO9t
Trump’s tax and expenditure plan, nicknamed the Big Beautiful Bill, stirred quite a commotion this week. While the Trump administration forecasts savings of $1.6 trillion, independent think tanks predict that costs could rise by several trillion dollars by 2035.
For now, the Trump administration seems to be undermining confidence in the U.S. dollar. Long-term yields have risen significantly this week, suggesting that investors find it less attractive to lend their money to the U.S. government for ten years or more. With that capital freed up, they’re looking for alternatives.
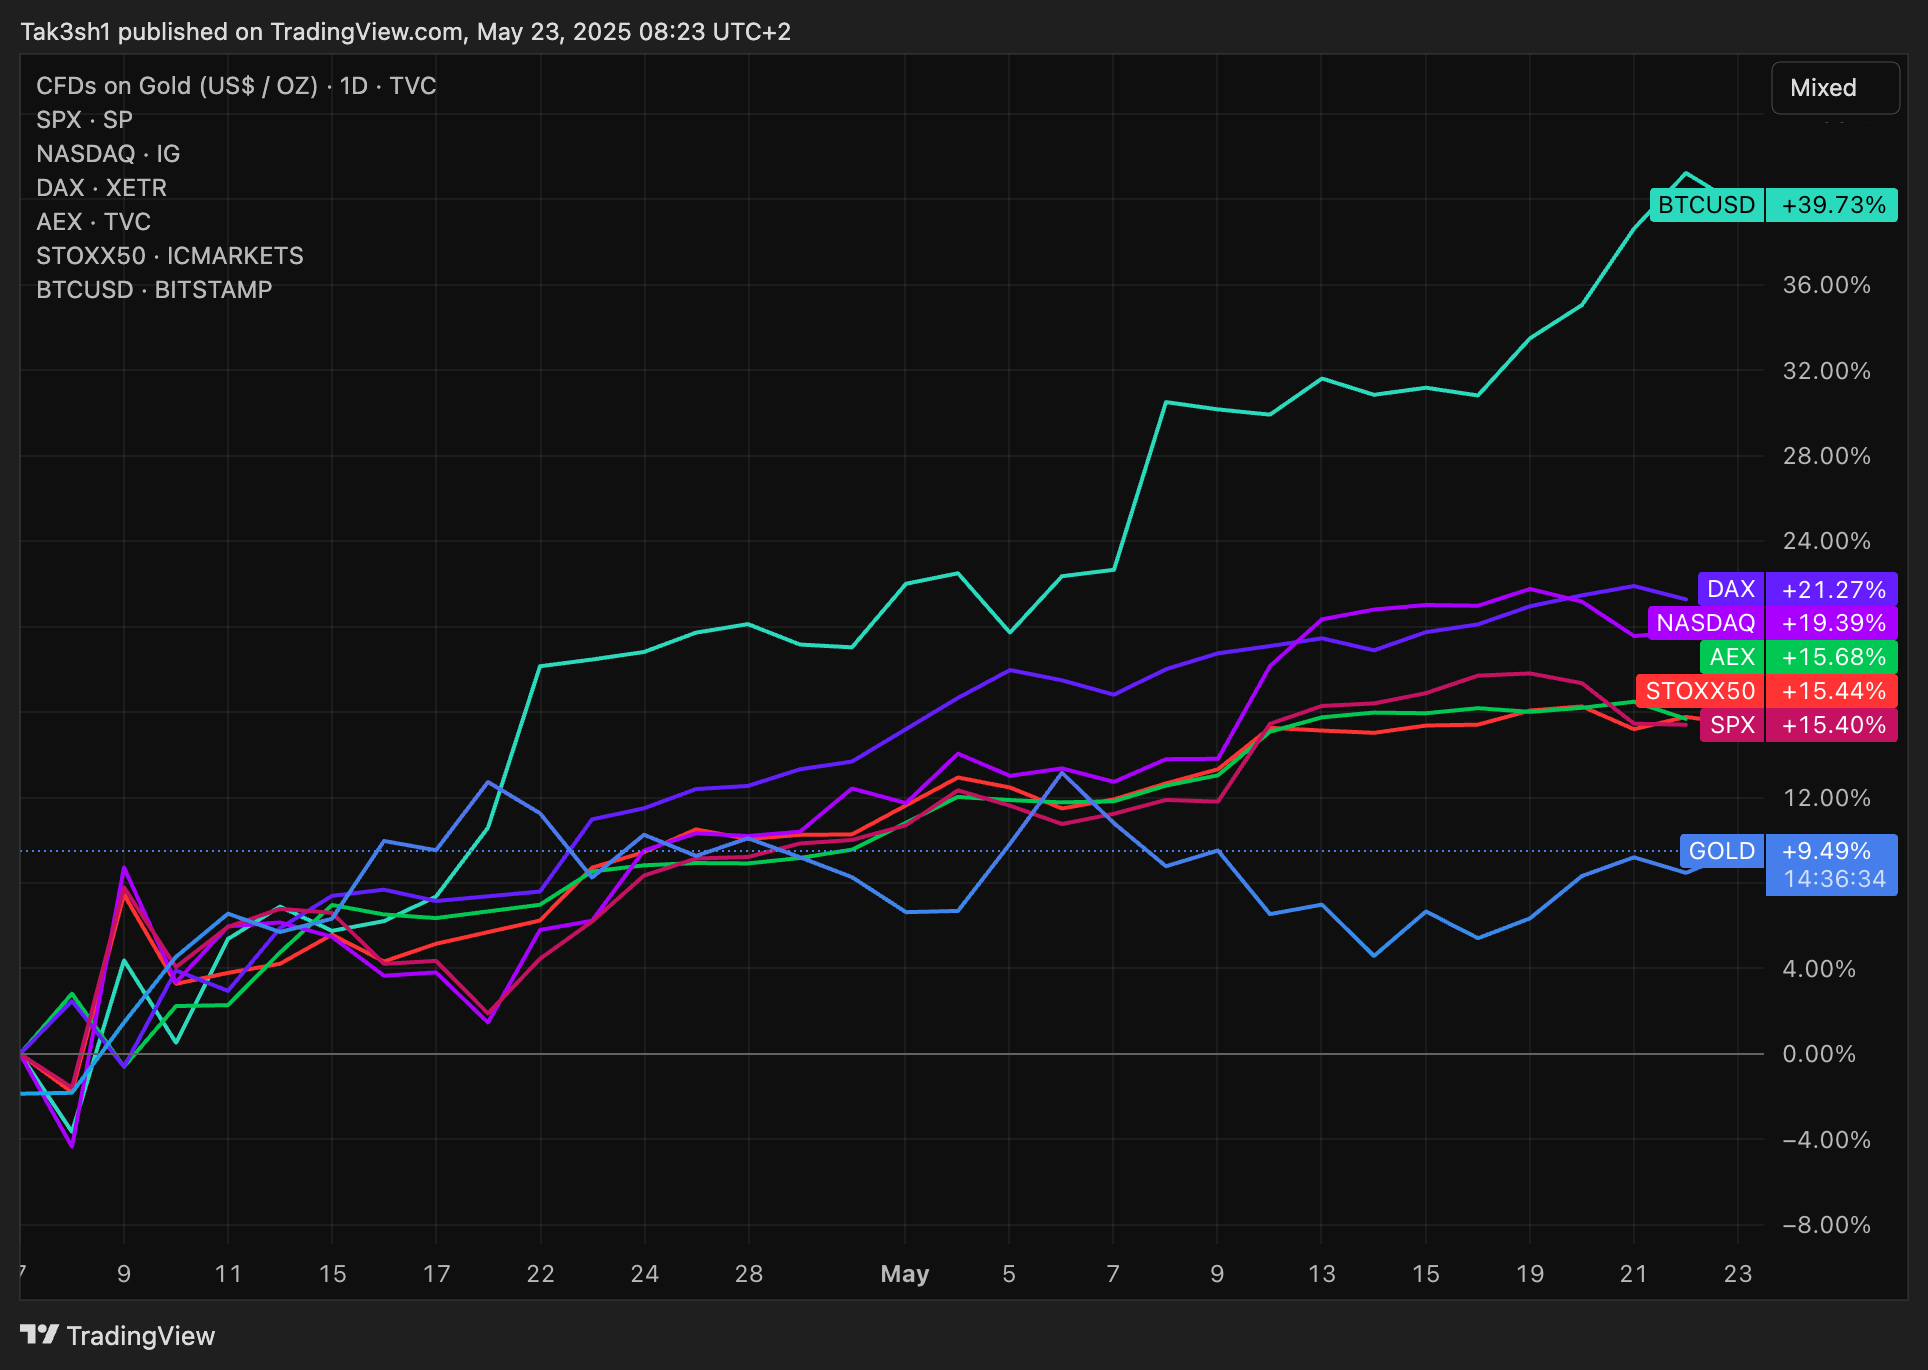
At this point it appears to be a temporary shock, and it remains to be seen whether this trend will stick. However, bitcoin clearly benefited from Trump’s policy shift this week.
If long-term yields were to really spike as a result, it would eventually hurt the U.S. economy. High yields on long-term government bonds translate into higher rates for mortgages, consumer loans, and corporate borrowing.
5️⃣ Increasing Evidence for the Resumption of the Bull Market
Thom
Since the low in April, risk assets—and bitcoin in particular—have soared. While I’ve always seen a resumption of the bull market as the baseline scenario (especially since fears of a recession due to the trade war seemed overblown in light of robust economic data), I also recognized risks that could hamper a prolonged rally.
As long as the impact of the trade war remained unclear, I saw no opportunity for bitcoin to launch into a sustained bull run.
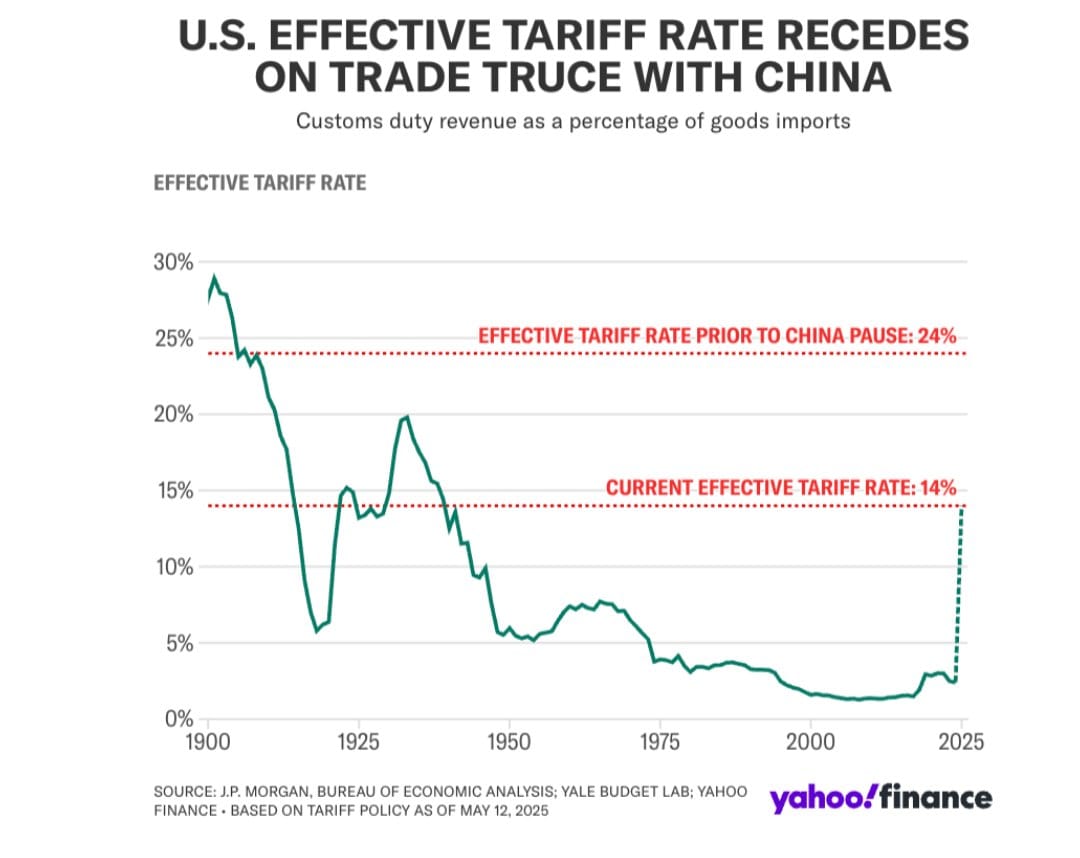
Despite the provisional agreement between China and the United States, there still remains an effective tariff rate of 14%, as shown in the chart below. The economy will only fully feel the impact in the coming months, and ultimately, a definitive agreement still needs to be reached.
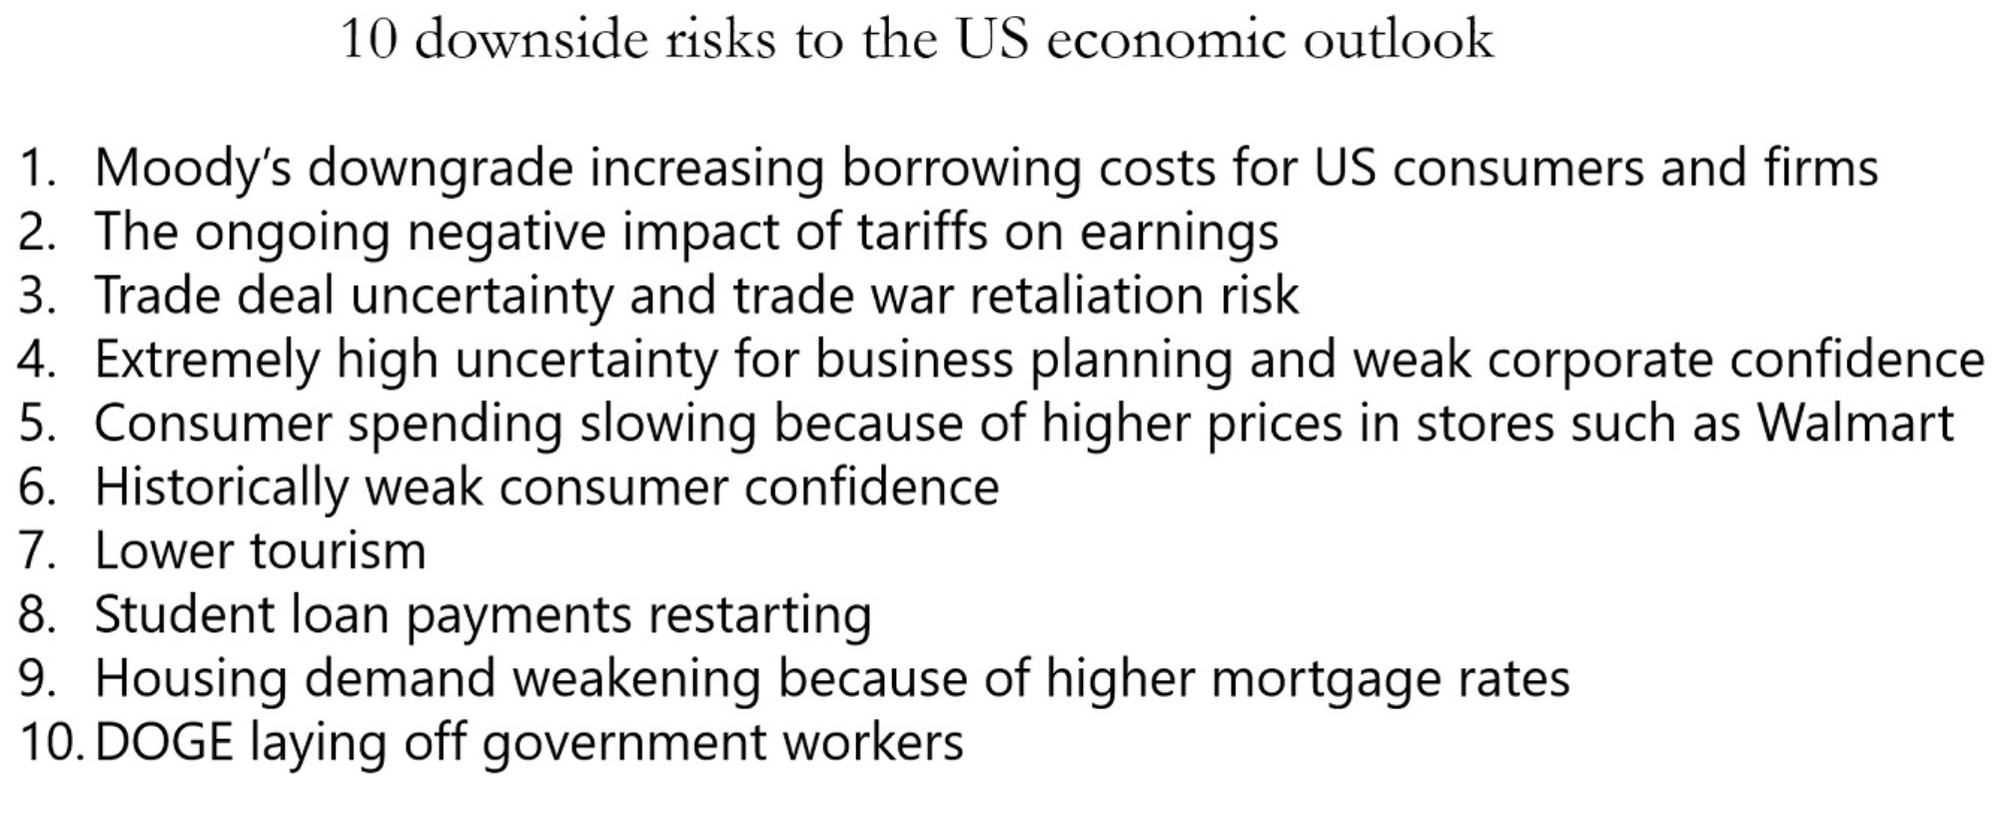
In addition, Torsten Sløk presented a list of ten risks to the U.S. economy, some of which also relate to the trade war.
Although the economic data didn’t give me any immediate reason to fear a recession, I also thought that a prolonged bull market was unlikely at the time. However, the policy shift—from fiscal discipline to a focus on growing the economy faster than the debt—has increased the chances that we may already be at the start of a new bull market.
We need to keep an eye on these risks, but after this week there’s clearly more weight behind the most optimistic scenario for bitcoin.
Thank you for reading!
To stay informed about the latest market developments and insights, you can follow our team members on X:
- Bart Mol (@Bart_Mol)
- Peter Slagter (@pesla)
- Bert Slagter (@bslagter)
- Mike Lelieveld (@mlelieveld)
We appreciate your continued support and look forward to bringing you more comprehensive analysis in our next edition.
Until then!