
Base Case: A New Bull Market
Bitcoin's price surged above $87,000 this week. Our new base case: we're at the start of a fresh bull market. Two routes lead to new all-time highs — but the path depends on oil, rates, and whether Trump can turn the tide before the midterms.

Overnight from Sunday to Monday, bitcoin printed its first weekly close above the 50-week moving average since early November. Over the past few months, we've written repeatedly about early signals. Sentiment, investor behavior, and technical signals all painted a clear picture: we're in the transition from a bear to a bull market.
The weekly close above the dominant moving average fits that picture perfectly, which is why we took this indicator seriously. Monday morning, we sent out an extra edition of this newsletter titled Time to Release the Handbrake.
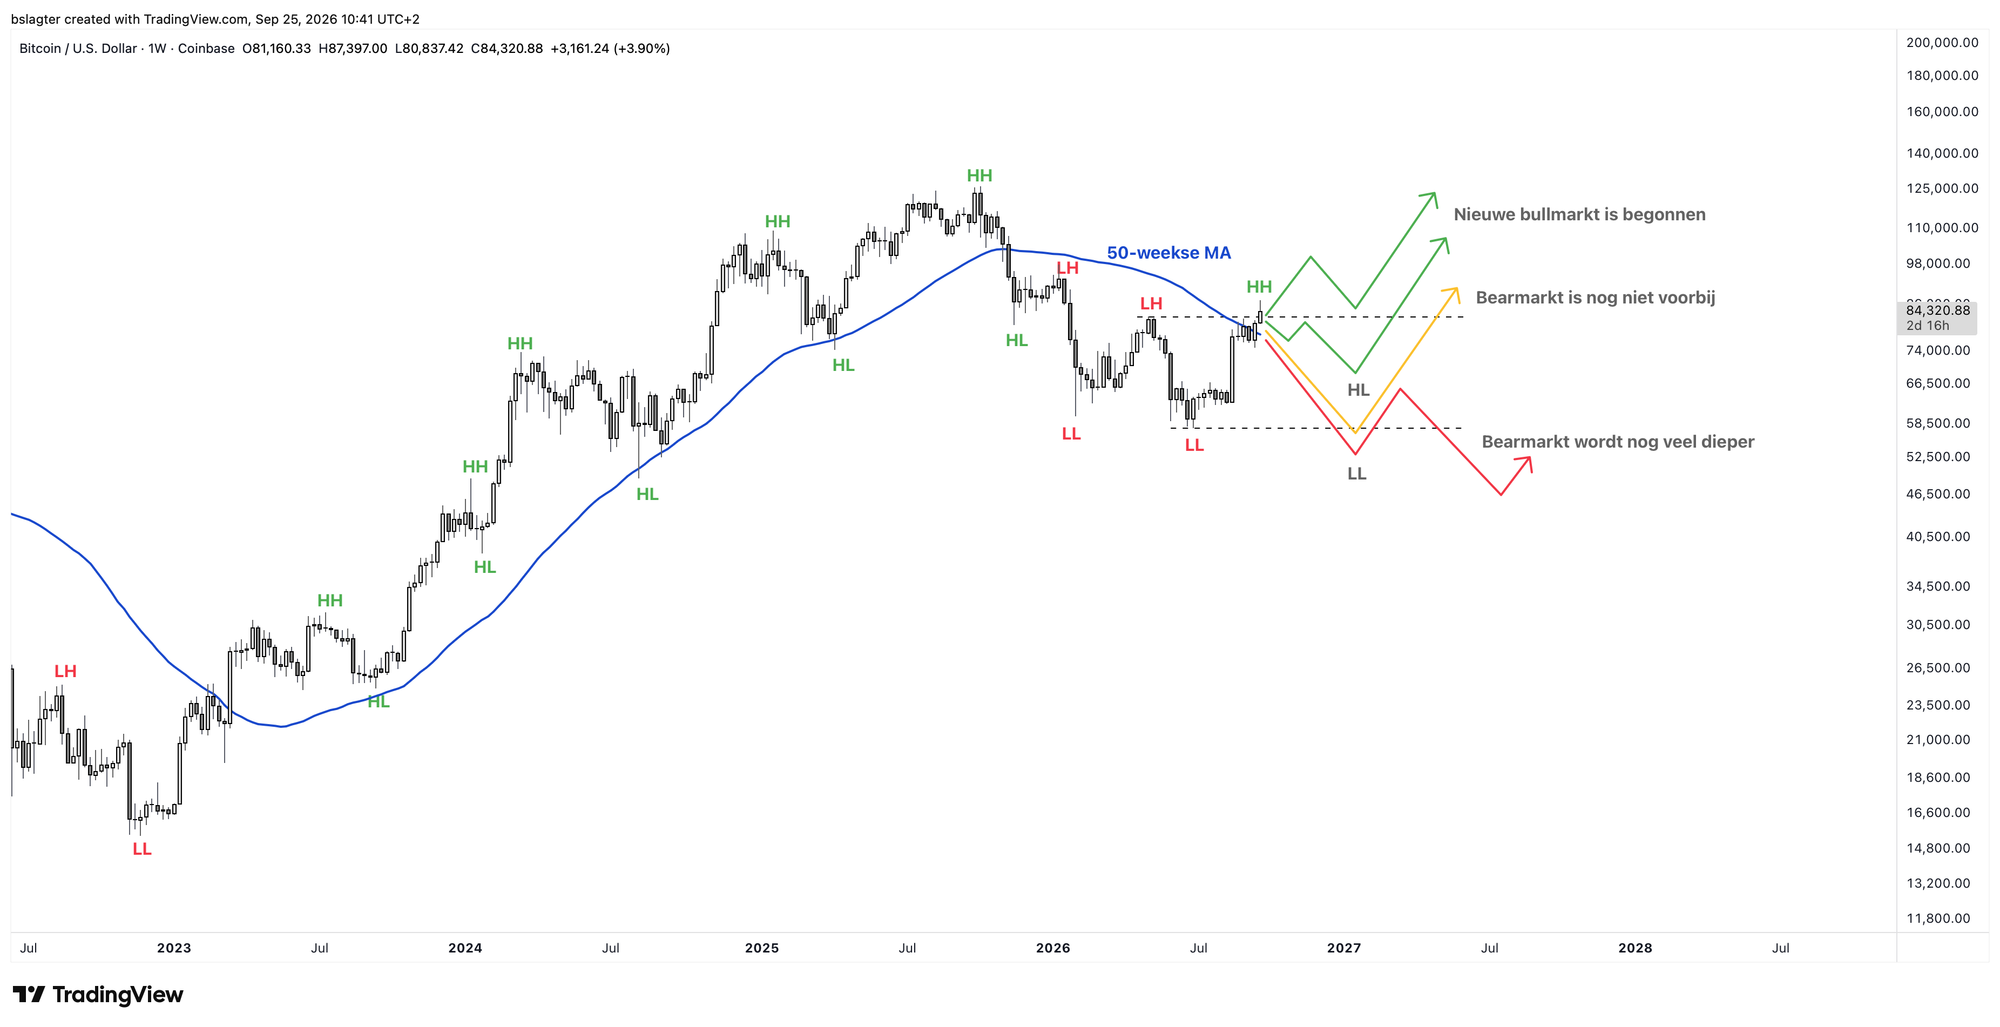
The final piece of evidence needed to switch to “a new bull market” as our base case was still missing Monday morning — namely, a higher high above the $83,000 level from May 6. We previously referred to that price as the dividing line between a bear and bull market. Investors and analysts had chosen prices between $82,000 and $84,000 as the boundary for various reasons.
It was the upper edge of the transition zone between bear and bull market that we introduced back in July:
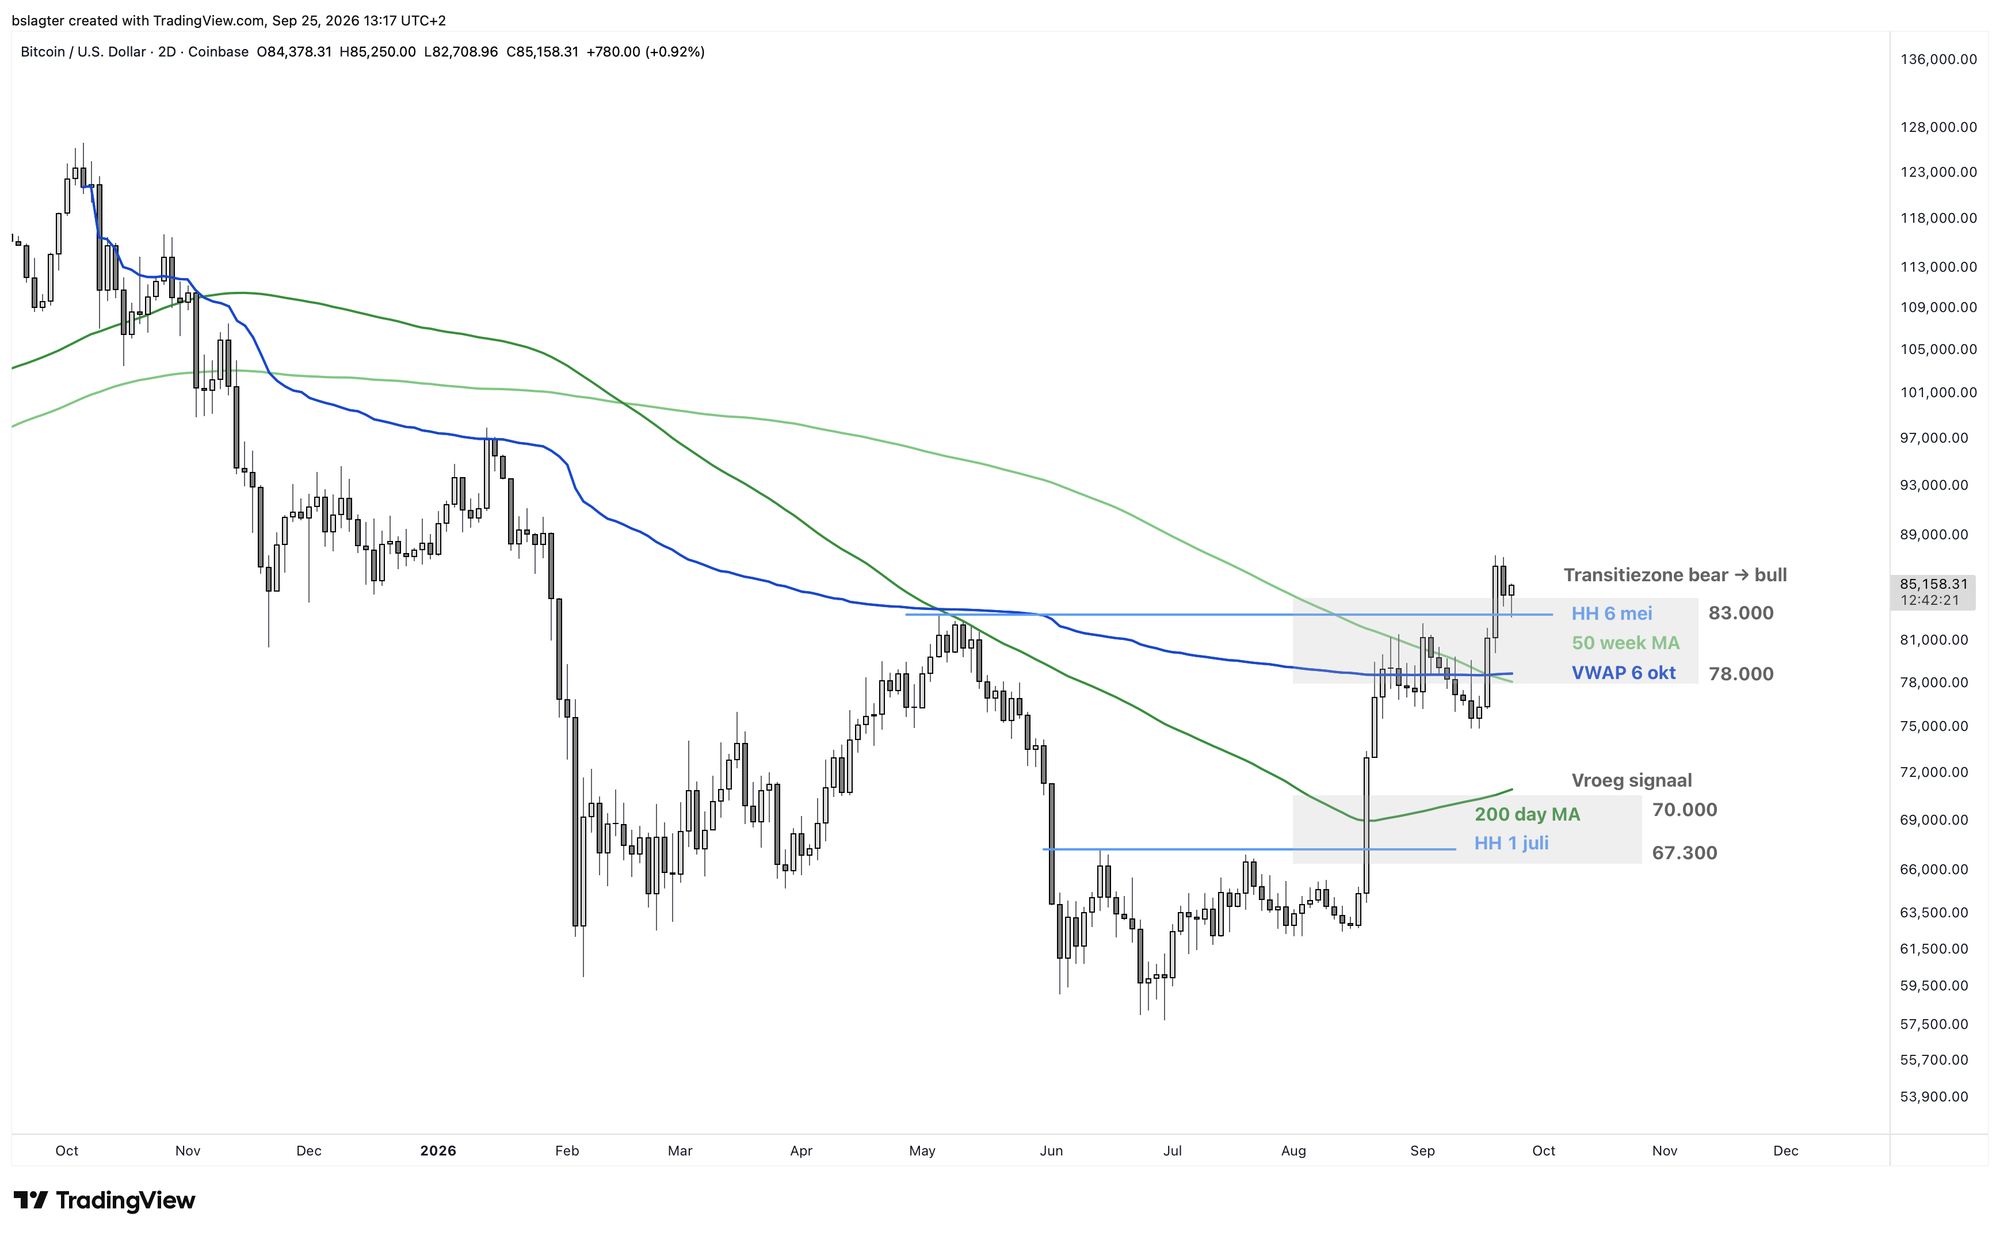
On Monday, this boundary fell. The price rose 7% in twelve hours, from $81,500 to $87,000. Since then — now four days running — bitcoin has seen a daily close above $84,000. Even without a weekly close, that's enough weight to call it a higher high (HH) above the May 6 top.
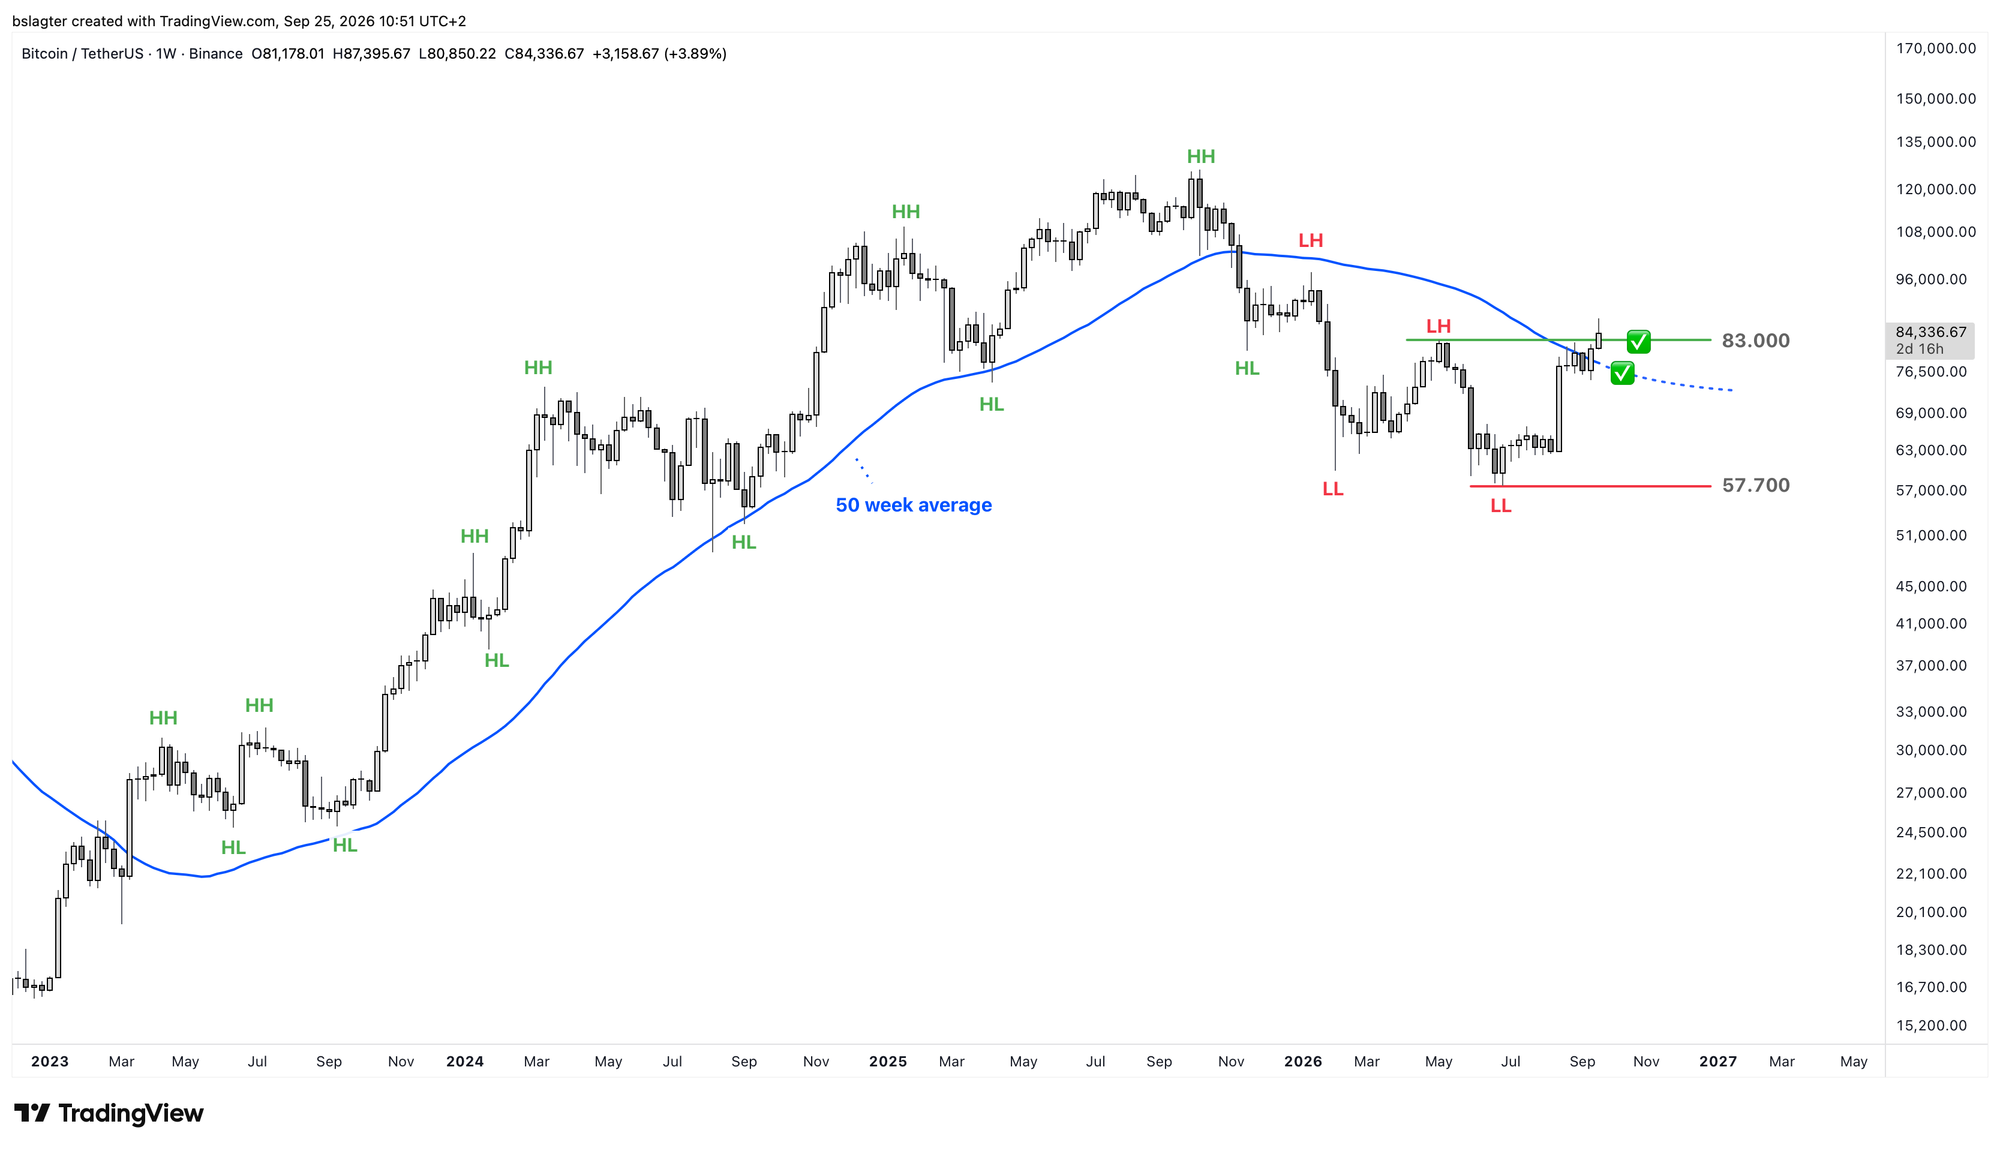
That means we can now tick two of the four boxes:
✅ A weekly close above the 50-week moving average at $78,800
✅ A higher high (HH) above the $83,000 level from May 6
⏹️ A higher low (HL) above the $57,700 level from July 1
⏹️ A shift in direction of that moving average from falling to rising
From here, we can imagine two routes, both of which support the scenario of a new bull market. In both, the $57,700 low from July 1 holds. In both, we reach new all-time highs in the coming years. But the path there differs.
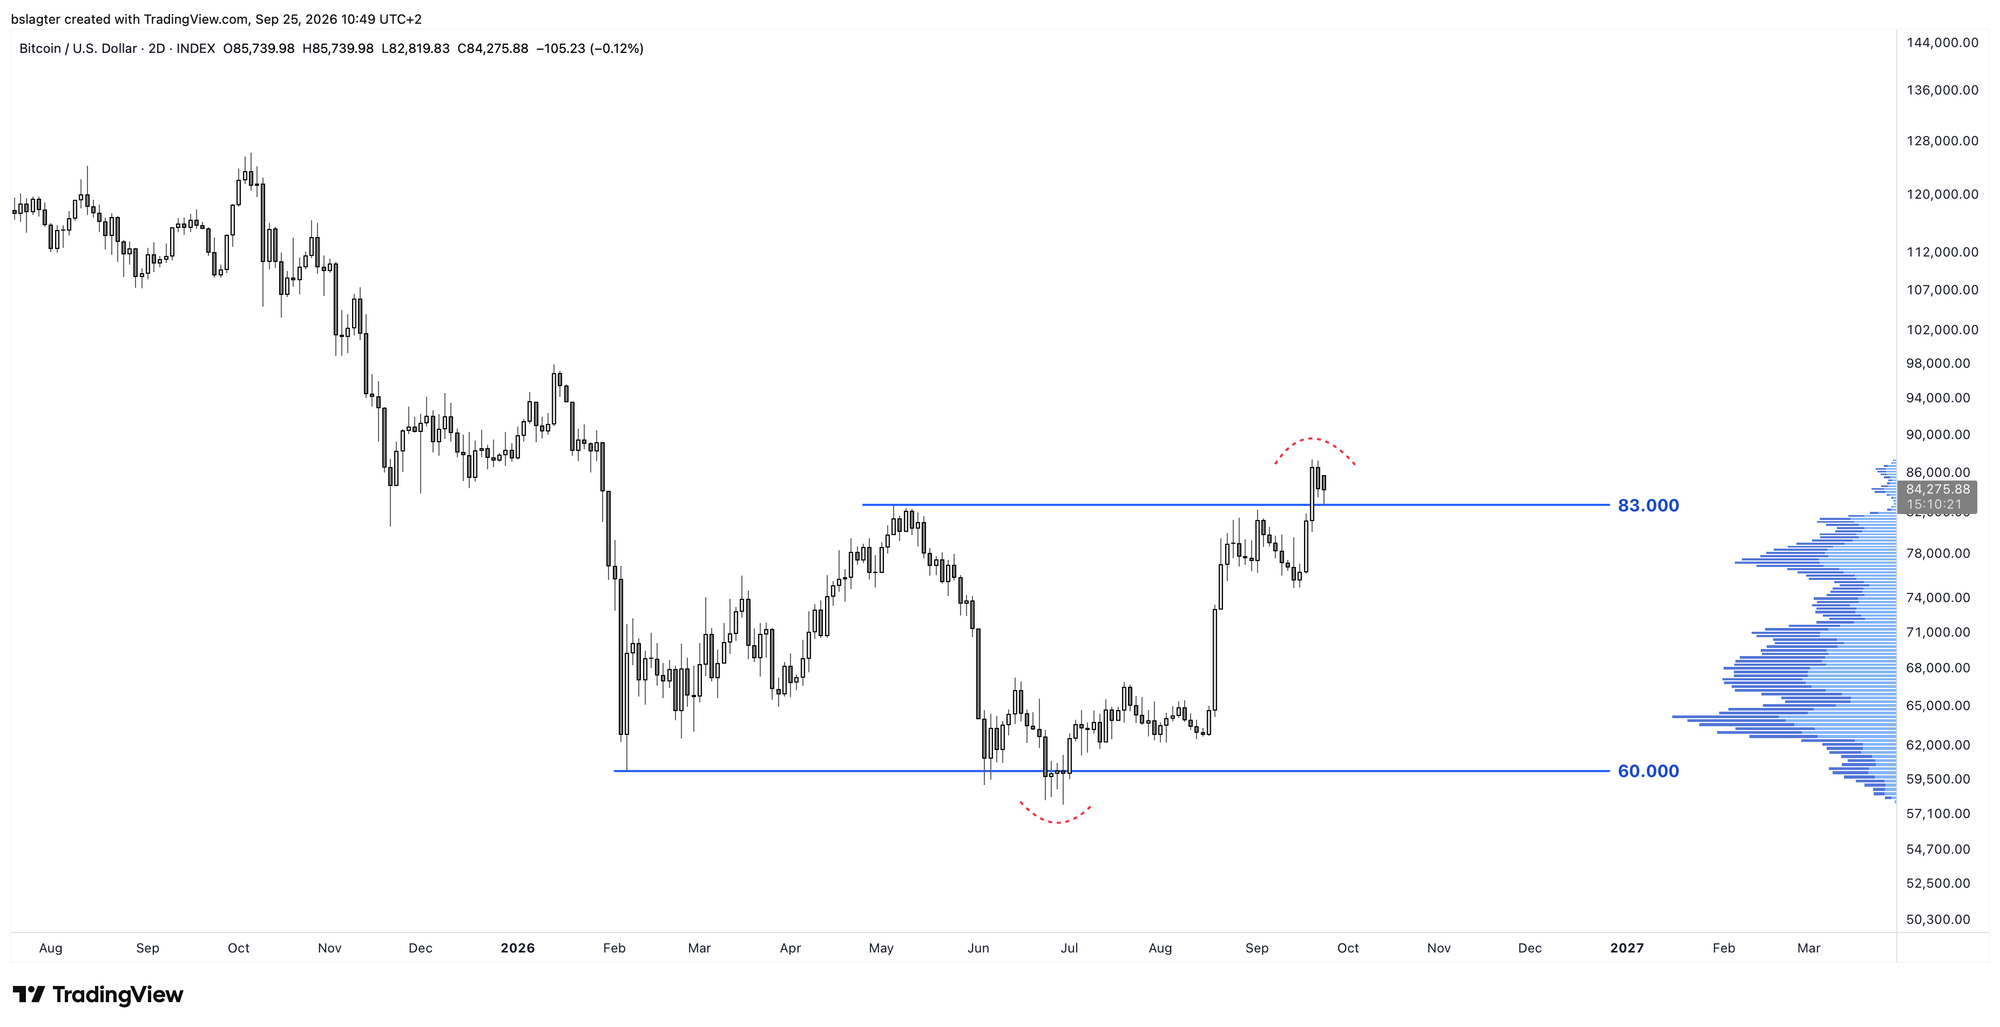
The first route. If the price now falls back below $83,000, the market may interpret the move above it as an anomaly. Just as the move below $60,000 was an anomaly.
In that case, a longer period between $60k and $83k becomes likely. Apparently more time would then be needed to shake off investor doubt. That fits nicely with the observation that the current low in month 44 is fairly early in the 47–48 month rhythm.
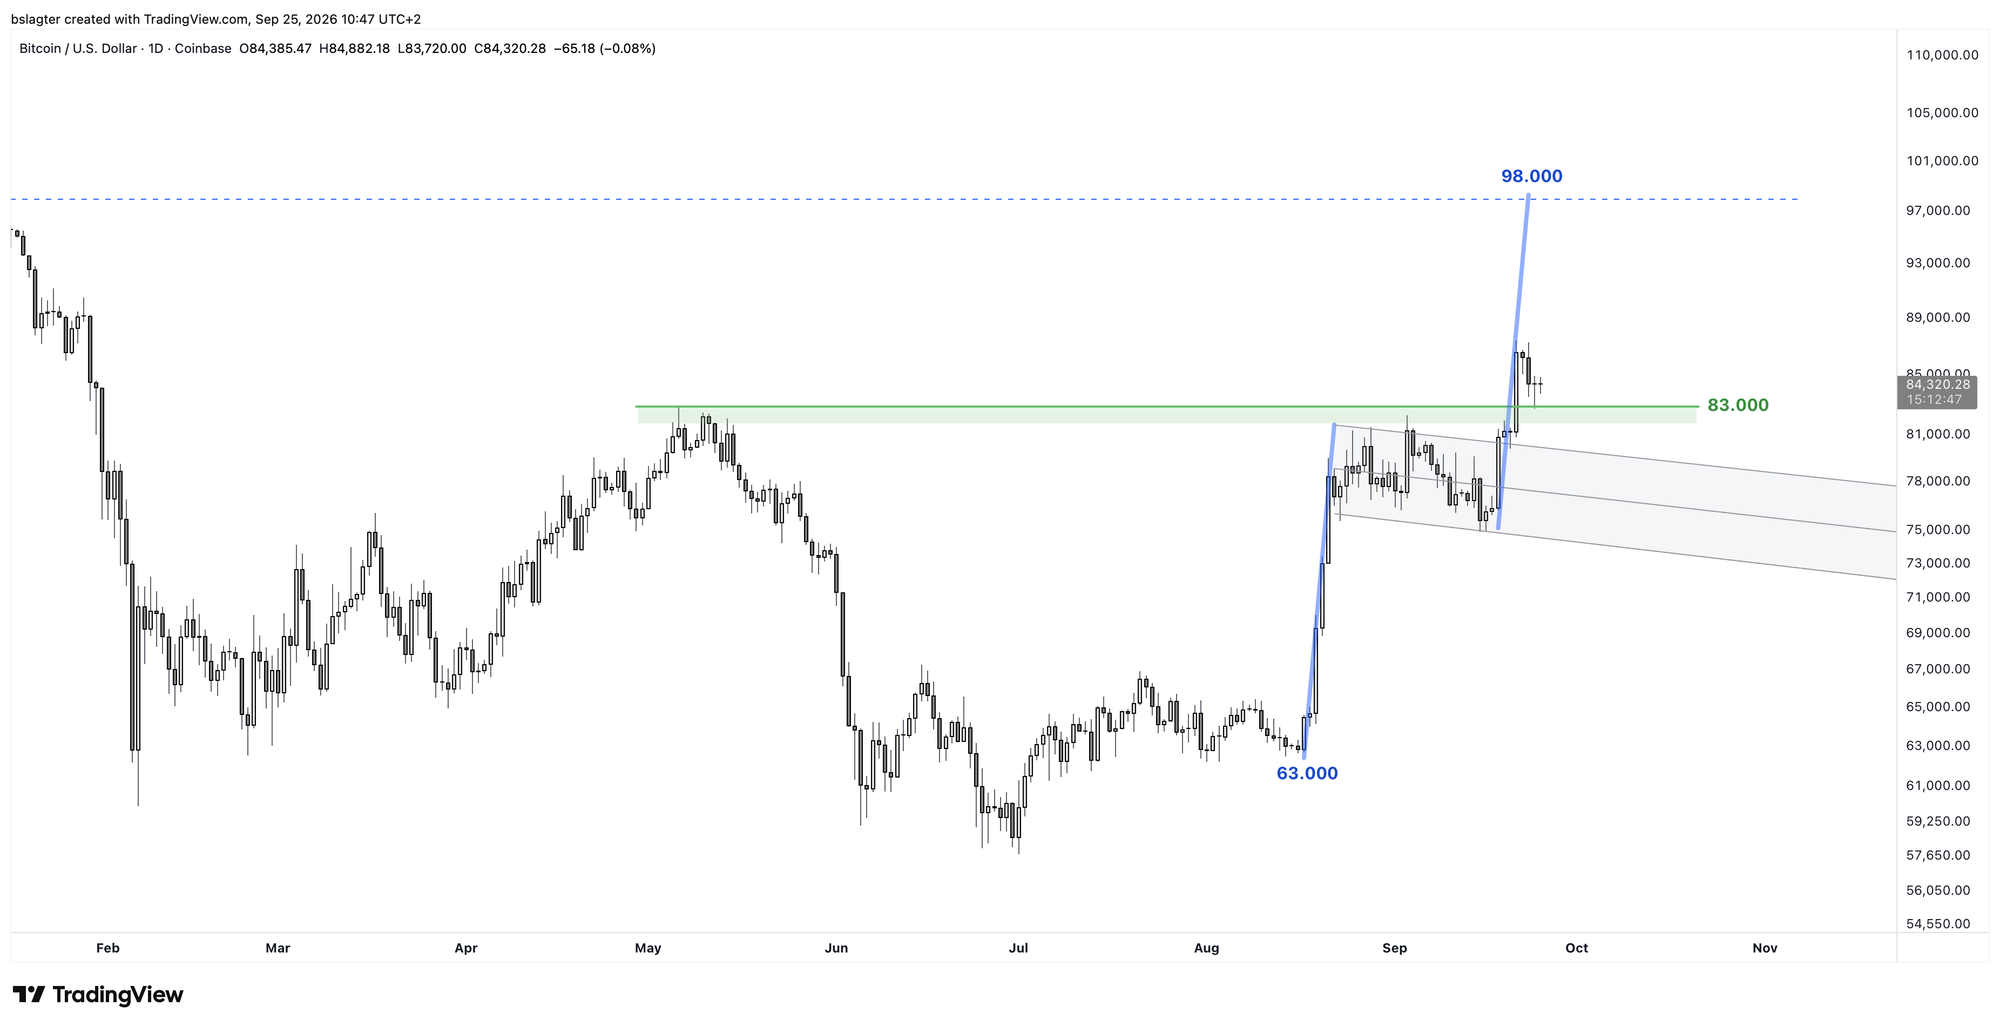
The second route sees the consolidation around $78,000 as a flag pattern. Bulkowski argues that flags have a maximum length of three weeks, and we're pushing slightly past that, but it's still perfectly explainable as a continuation pattern. That comes with a (geometric) price target of $98,000.
In this variant, you can interpret the recent days' decline as a test of $83,000 as support. Resistance in May and September, the breakout this past Monday, now the test as support, and continuation of the rise in the coming days.
The chart below shows three scenarios, to which we now assign these probabilities:
- A new bull market (green) — 80%
- A mild and prolonged bear market (yellow) — 15%
- A deep and prolonged bear market (red) — 5%
Our new base case is the first scenario: a new bull market. The two variants are shown in green on the chart. In both cases, a higher low (HL) now follows, above the $57,700 low from July. Only the first few weeks and months differ slightly.
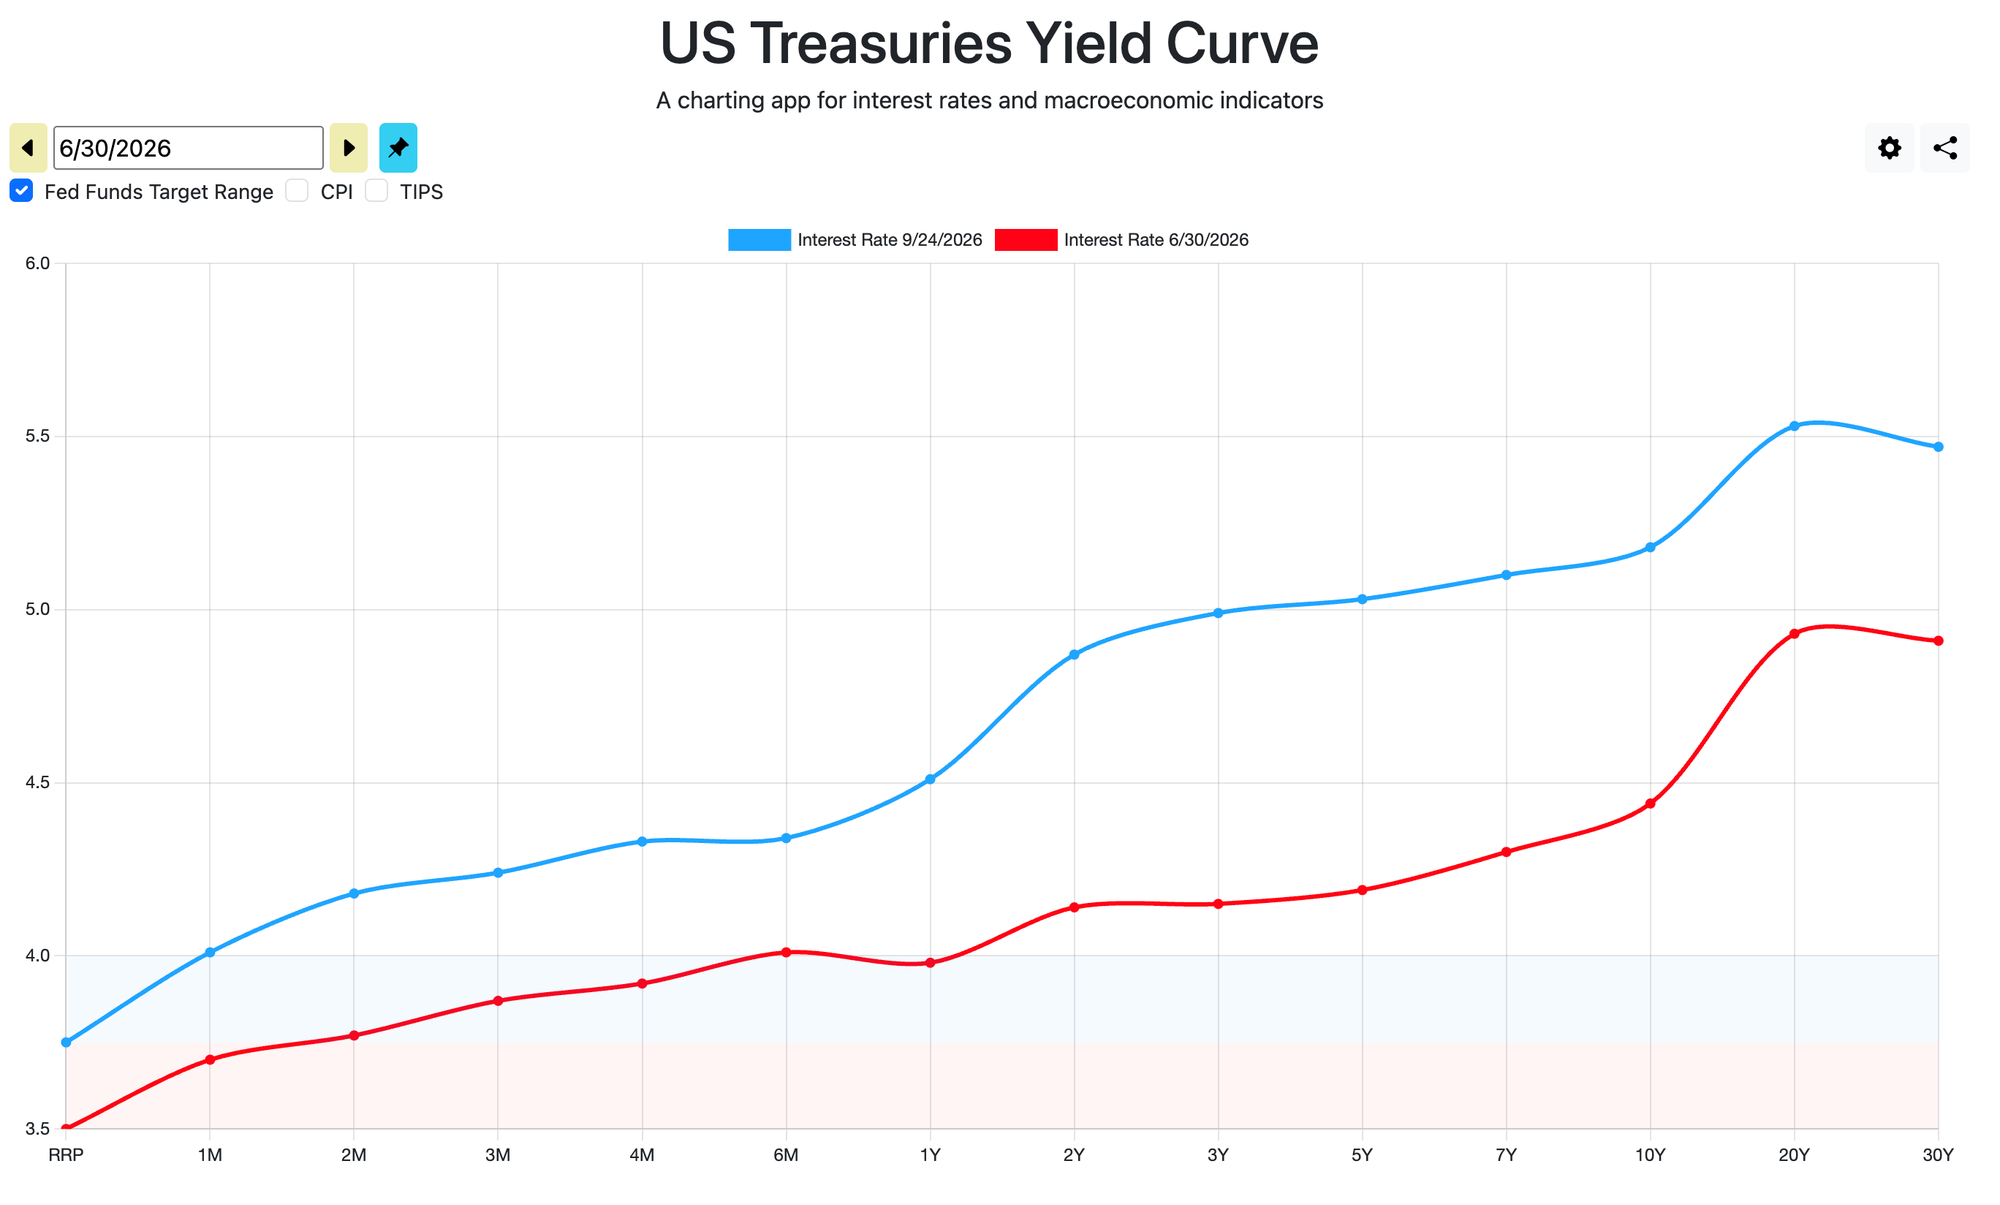
The recent decline in bitcoin, gold, and stocks is tied to rising yields on government bonds. Plenty has been written and said about this. Most of it nonsense. That's easy to establish, because the countless conclusions fundamentally contradict each other and can't all be true at once.
The tricky thing about bond yields is that the cause and meaning of a rise or fall can't be pinpointed exactly. A complex web of forces gets flattened into a single number. Under different conditions, the market is sensitive to a different selection of those forces.
What's driving yields right now? Presumably an interplay between inflation expectations and economic growth expectations. For the shorter maturities, monetary policy too, of course. But hardly fiscal policy, government debt, interest payments, the yen carry trade, the credibility of the central bank, the creditworthiness of the government, or central banks selling off their bonds.
The high inflation expectations are linked to expensive oil, fuels, and commodities driven by the war in Iran. And the high growth expectations are presumably tied to the rise of AI.
Government debt and the interest payments on it barely drive yields, but Treasury Secretary Scott Bessent is certainly feeling the pain of high rates. He's already spent his small ammunition, from symbolic buyback programs to tough talk. Now it's time for the heavy artillery.
To keep the government debt affordable, America will need to boost demand for bonds. It strongly looks like they want to deploy the banks for this. Offshore stablecoins could also do part of the heavy lifting. Every ‘eurodollar 2.0’ that foreigners hold in stablecoins is a dollar of demand for short-term bonds.
If short-term rates were to fall a bit, it would cut both ways. Bessent could refinance more cheaply, and a steeper yield curve helps banks. What banks need is a ‘bullish steepening,’ where short-term rates fall faster than long-term ones. The key to that is an end to the war in Iran while the AI thesis stays alive:
- End of the war in Iran → Cheaper oil and commodities → Lower inflation expectations → Short-term rates fall.
- AI thesis alive → Economic growth expectations hold up → Long-term rates stay relatively high.
It seems logical that Trump has a lot riding on turning the tide before the midterms. But he'll need to move fast. That would be a solid boost for bitcoin, gold, and stocks. The debasement trade stays in place. The AI boom stays alive. The biggest headwind disappears.
The outcome likely also determines the route bitcoin takes. Bessent can do little as long as the situation in Iran isn't resolved. A longer period of consolidation around $80,000 would then make sense — the lower green route. The upper one requires a breakthrough that bond investors genuinely believe in. And for that, Trump will need to bring more than a Truth Social post!
We'll continue with the following topics:
- Watch for behavioral change!
- Bitcoin is slowly carving out its place
- Further bitcoin gains come into view
1️⃣ Watch for behavioral change!
 Contribution by
 Sam
Bitcoin and altcoins often develop habits. Weeks or months in which, for example, a certain moving average keeps getting bought, or in which a pullback never goes deeper than a local low.
Recognizing such a habit is highly valuable information, but it isn't always easy. There are many variations in its characteristics, since it can occur on different timescales or only work during certain periods.
Such a habit is interesting, but even more interesting is the moment a habit changes. That change can be the harbinger of a major move, or even mark the end of a bull or bear market.
Let's take a look at the last bull market, where bitcoin showed a lot of respect for the 50-week EMA. Apart from a small false breakout without conviction at the start of the bull market, there was no weekly close below this EMA until the bull market was over. After that, support turned into resistance.
The fact that, alongside losing this dominant moving average, we had also printed a lower low on the weekly chart were very clear signals that the uptrend had broken.
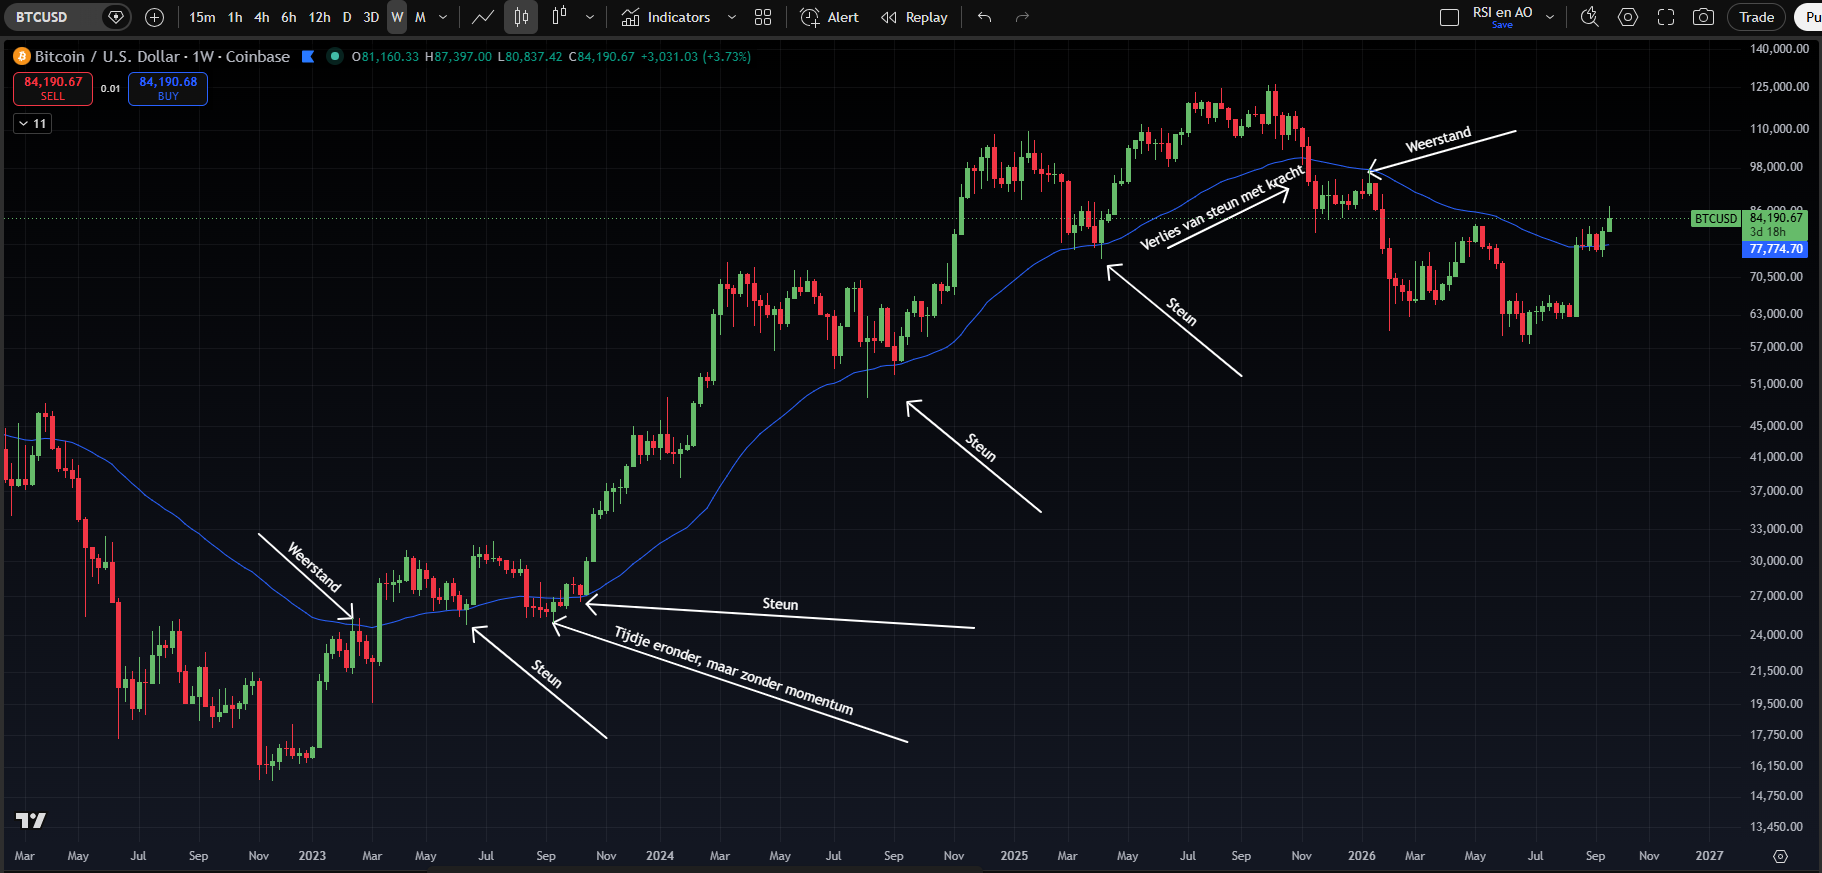
A behavioral pattern can occur on all timescales and therefore doesn't have to be the dividing line between a bull and bear market. It can also be a harbinger of the end of a smaller upward or downward move.
When bitcoin was in the middle of a countertrend rally from $66,000 to $83,000 in April of this year, the green EMA cloud on the 12-hour chart was respected very well. When it was broken decisively, that also marked the end of the upward move.
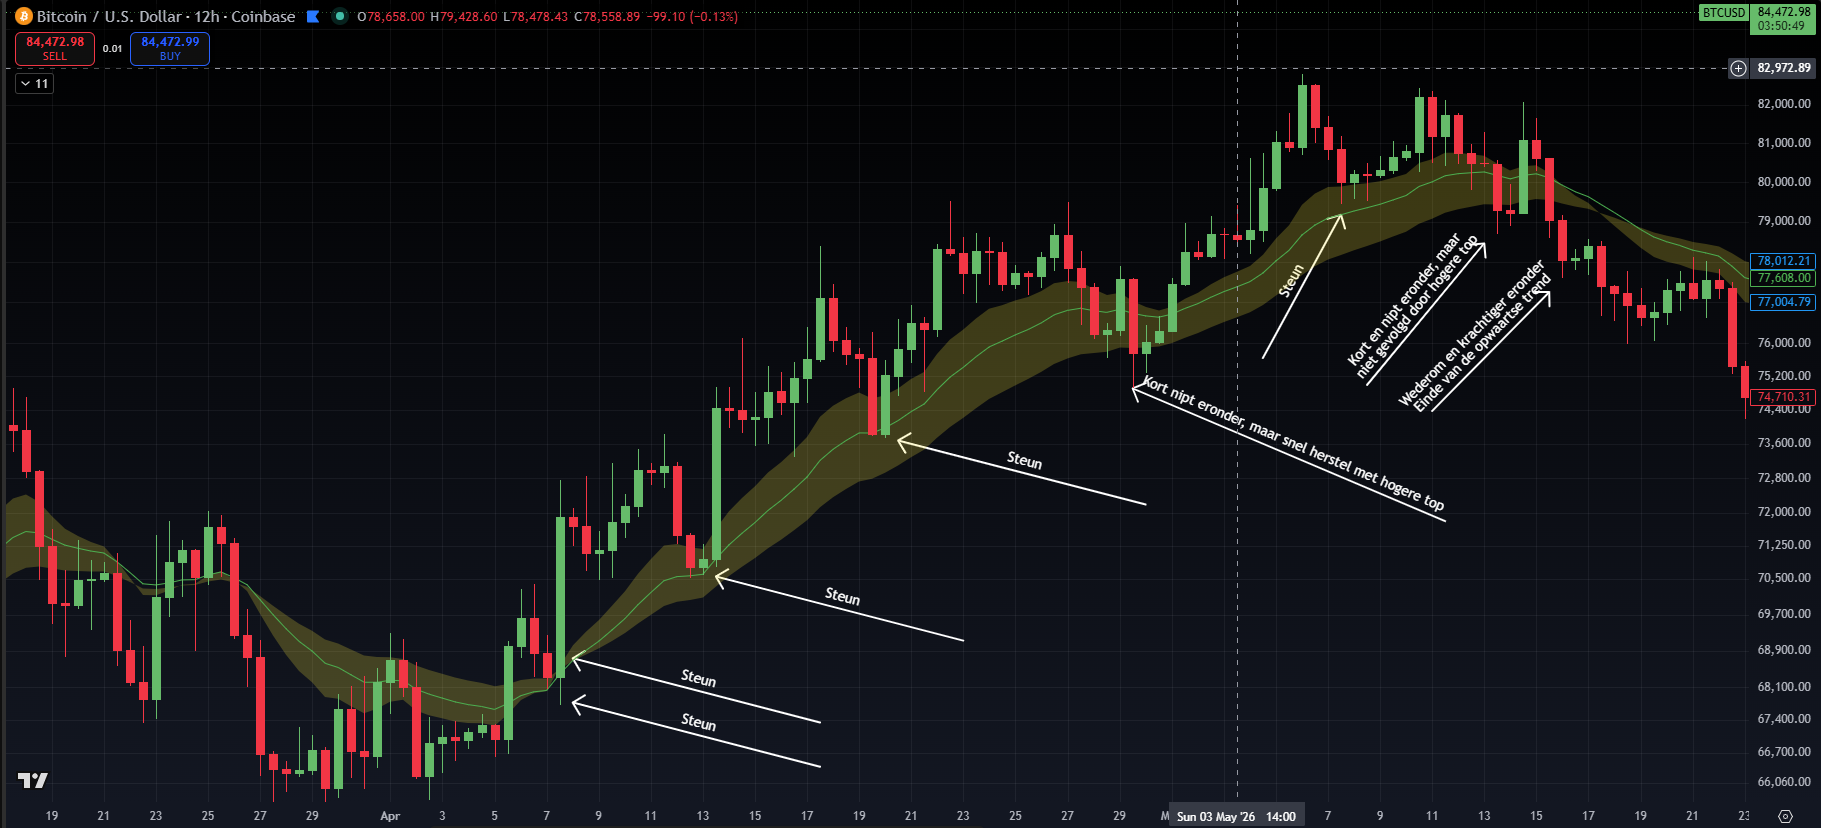
These are two examples from the past, and of course hindsight is easy. So to wrap up, let's look at a pattern that's currently still intact, namely with Zcash (ZEC).
In mid-August the price was still below $500, and now, a good month later, it's up more than 200% to above $1,500. As you can see in the chart below, two characteristics are visible on the 12-hour chart. First, it respects the green EMA cloud, and second, there aren't really price corrections but rather corrections in the form of sideways time.
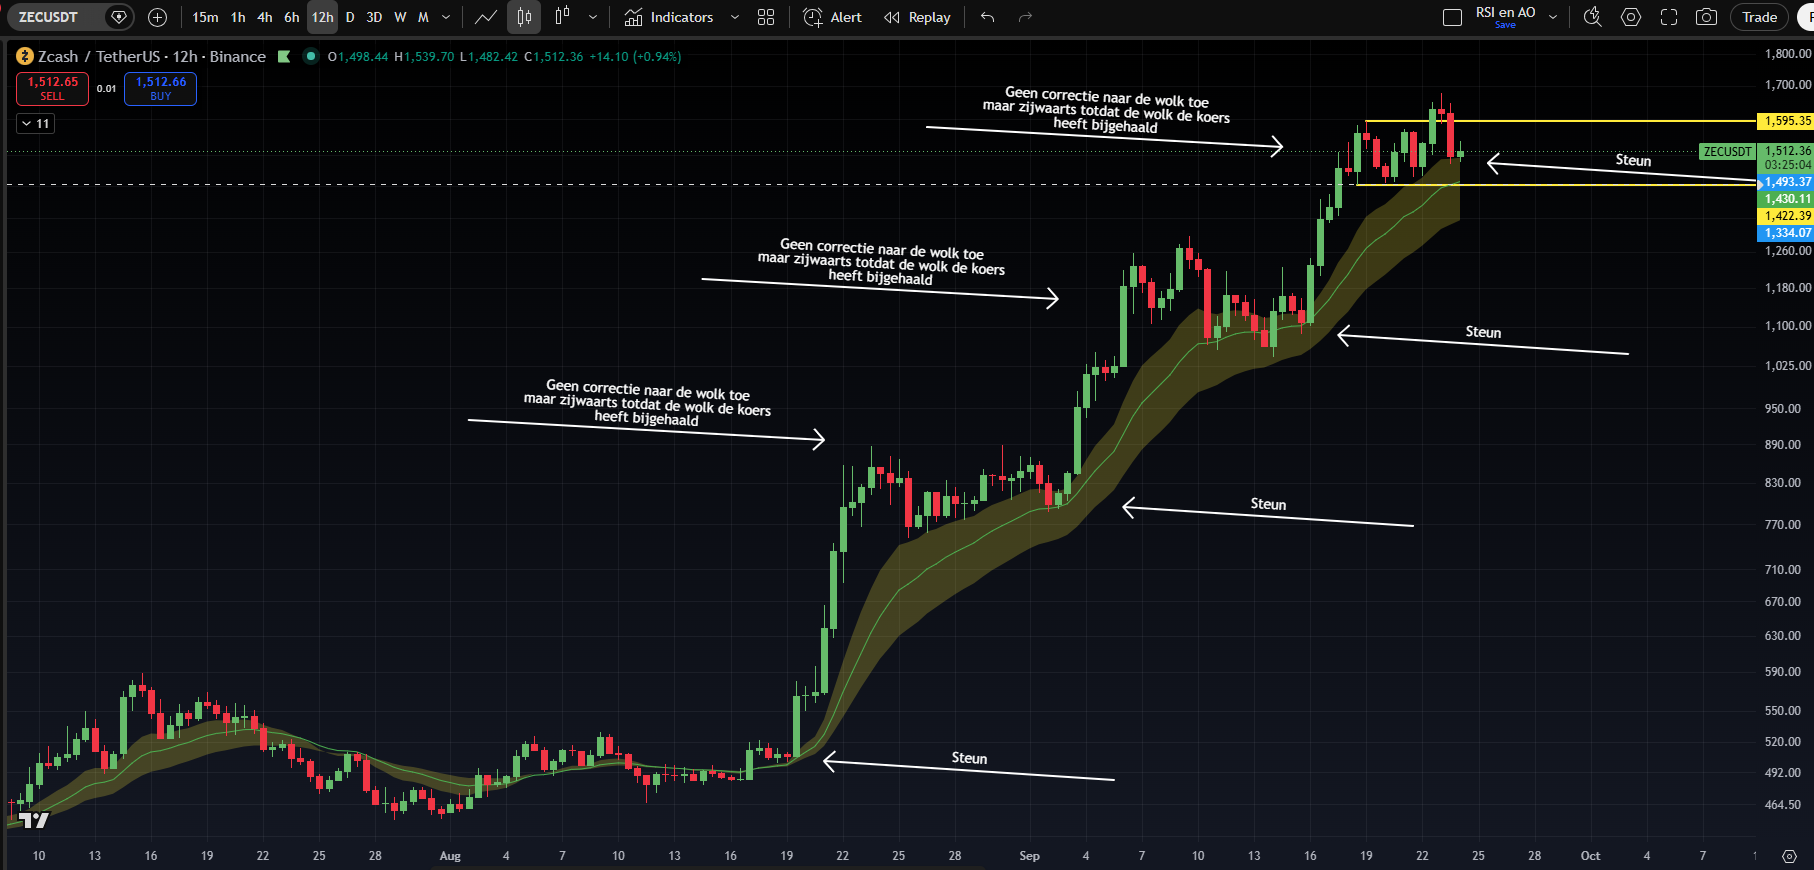
As long as there's no close below the green cloud or a clear correction, we can assume this pattern stays intact, and for example a quick move below the lower yellow line is a nice opportunity to consider some exposure in this strong market.
If you already have exposure to ZEC, then a behavioral change in this pattern could be an important signal to take profits or at least to keep a close eye on.
2️⃣ Bitcoin is slowly carving out its place
 Contribution by
 Thom
Howard Marks is among the most respected investors in the financial world. Over his long career, the founder of Oaktree Capital repeatedly managed to identify major turning points in financial history at just the right moment. In his latest memo, Marks focuses on the rising U.S. national debt, large budget deficits, and climbing long-term rates.
His main point is that policymakers can't simply bypass the laws of economics.
We're now seeing the U.S. government try to suppress long-term rates in several ways. For example, by buying back more government bonds. According to Marks, however, that has no effect on the fundamental causes of rising bond yields.
Inflation remains elevated. The government is running large deficits. Demand for capital is increasing, partly due to the billions being invested in AI.
As a result, he argues, the problem shifts toward the U.S. dollar in virtually all scenarios.
Marks doesn't expect the United States to end up in a position where it simply stops paying its debts. After all, the debt is denominated in dollars — a currency the U.S. government issues itself.
The risk, in his view, lies more in the purchasing power of those dollars. With persistently high deficits, he argues, the discussion will increasingly shift toward monetary debasement, or the much-discussed “debasement trade.”
Marks discusses bitcoin
Marks doesn't name bitcoin in his memo as the obvious winner of this scenario. That would be too much for the digital currency's current status. Instead, he writes that he expects the U.S. dollar to remain dominant as the world reserve currency for the time being.
Interestingly enough, he does mention cryptocurrencies — by which Marks probably means bitcoin — as one of the possible alternatives for investors looking to reduce their dollar exposure. Alongside gold, foreign currencies, real estate, and non-U.S. companies.
While none of this is groundbreaking, I think it does represent an interesting signal for bitcoin. A few years ago, Marks probably wouldn't have mentioned the digital currency at all. Slowly but surely, bitcoin is starting to secure a place in traditional circles as well.
For bitcoiners, Marks's story is familiar. My point was mainly that it's a positive signal that someone of his stature is now cautiously starting to include bitcoin.
3️⃣ Further bitcoin gains come into view
The week started off rock-solid for bitcoin and stocks. That changed Wednesday afternoon due to strong economic data from the United States. As a result, the market is now pricing in another 38 basis points of rate hikes for the remainder of 2026.
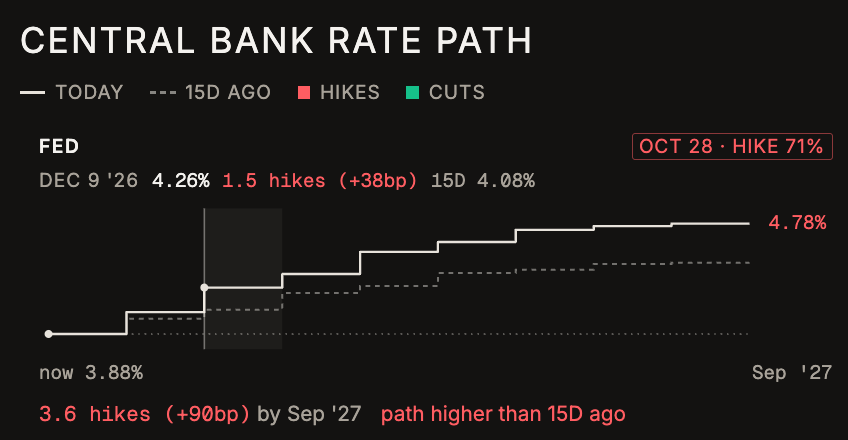
That's a lot, assuming the U.S. central bank raises rates by a maximum of 25 basis points per meeting. That would mean a maximum of 50 basis points more to come. So well over three-quarters of that is already priced in. In other words, the expected rate path can hardly get more extreme than it already is.
To my mind, the expectations are starting to become quite aggressive. Which creates room for a reversal if conditions improve. My base case is that we'll get at most one more rate hike from the U.S. central bank in 2026.
Mainly because of the oil shock, which you're not going to solve with rate hikes anyway. That would mean at least 13 of the current 38 basis points of rate hikes disappear from the market.
The potential chain reaction should look roughly like this:
- U.S. bond yields could fall as a result. The recent rate rise stemmed in large part from a more hawkish expected Federal Reserve policy, and not solely from stronger economic growth.
- Lower rates and less volatility improve financial conditions. Bonds become more attractive as collateral, and systematic investors get more room to take on risk.
- Bitcoin could benefit from that. Bitcoin typically reacts strongly to changes in liquidity and risk appetite.
For that reversal, however, the oil price is crucial. It has also climbed again over the past few hours, which explains part of the sharp drop in bitcoin and the rise in rates on Wednesday afternoon.
That makes oil, for me, the most important variable right now. If the oil price falls further, the aggressively priced rate path can quickly soften. And precisely there, the conditions could emerge for a further rise in bitcoin.
On that front, cautious progress was made over the past few days. U.S. and Iranian representatives held hours of talks during the United Nations General Assembly. Afterward, Trump spoke of a productive meeting, while contacts on a possible resolution continue.
Although the strong economic data is now causing volatility, I wonder to what extent it actually provides the basis for additional rate hikes. The economy is mainly being carried by AI investments, while many other sectors are already struggling with higher rates.
My primary scenario is therefore that at most one rate hike follows, and that pricing out the excess 13 basis points of expected hikes could provide fuel for the bitcoin price over the next month and a half.
Finally
You can read back all previous editions of Alpha Markets in the archive. Questions, comments, and suggestions are very welcome in the community.
Thank you for reading!
To stay informed about the latest market developments and insights, follow our team members on X:
- Bart Mol (@Bart_Mol)
- Peter Slagter (@pesla)
- Bert Slagter (@bslagter)
- Mike Lelieveld (@mlelieveld)
We appreciate your continued support and look forward to bringing you more comprehensive analysis in our next edition.
Until then!