
All-Time Highs — and Turmoil in Stocks
Bitcoin slid 8% in recent days to just above $80,000. So far, it's a perfectly normal dip in an early bull market. But with AI bubble fears, surging bond yields and jittery stocks, the big question is: is this the dip worth buying?

While stock markets keep setting record after record, sentiment is dominated by doubt and worry: about the war in Iran, energy prices, inflation, bond yields and a possible bubble in AI stocks. This week, AI companies took centre stage.
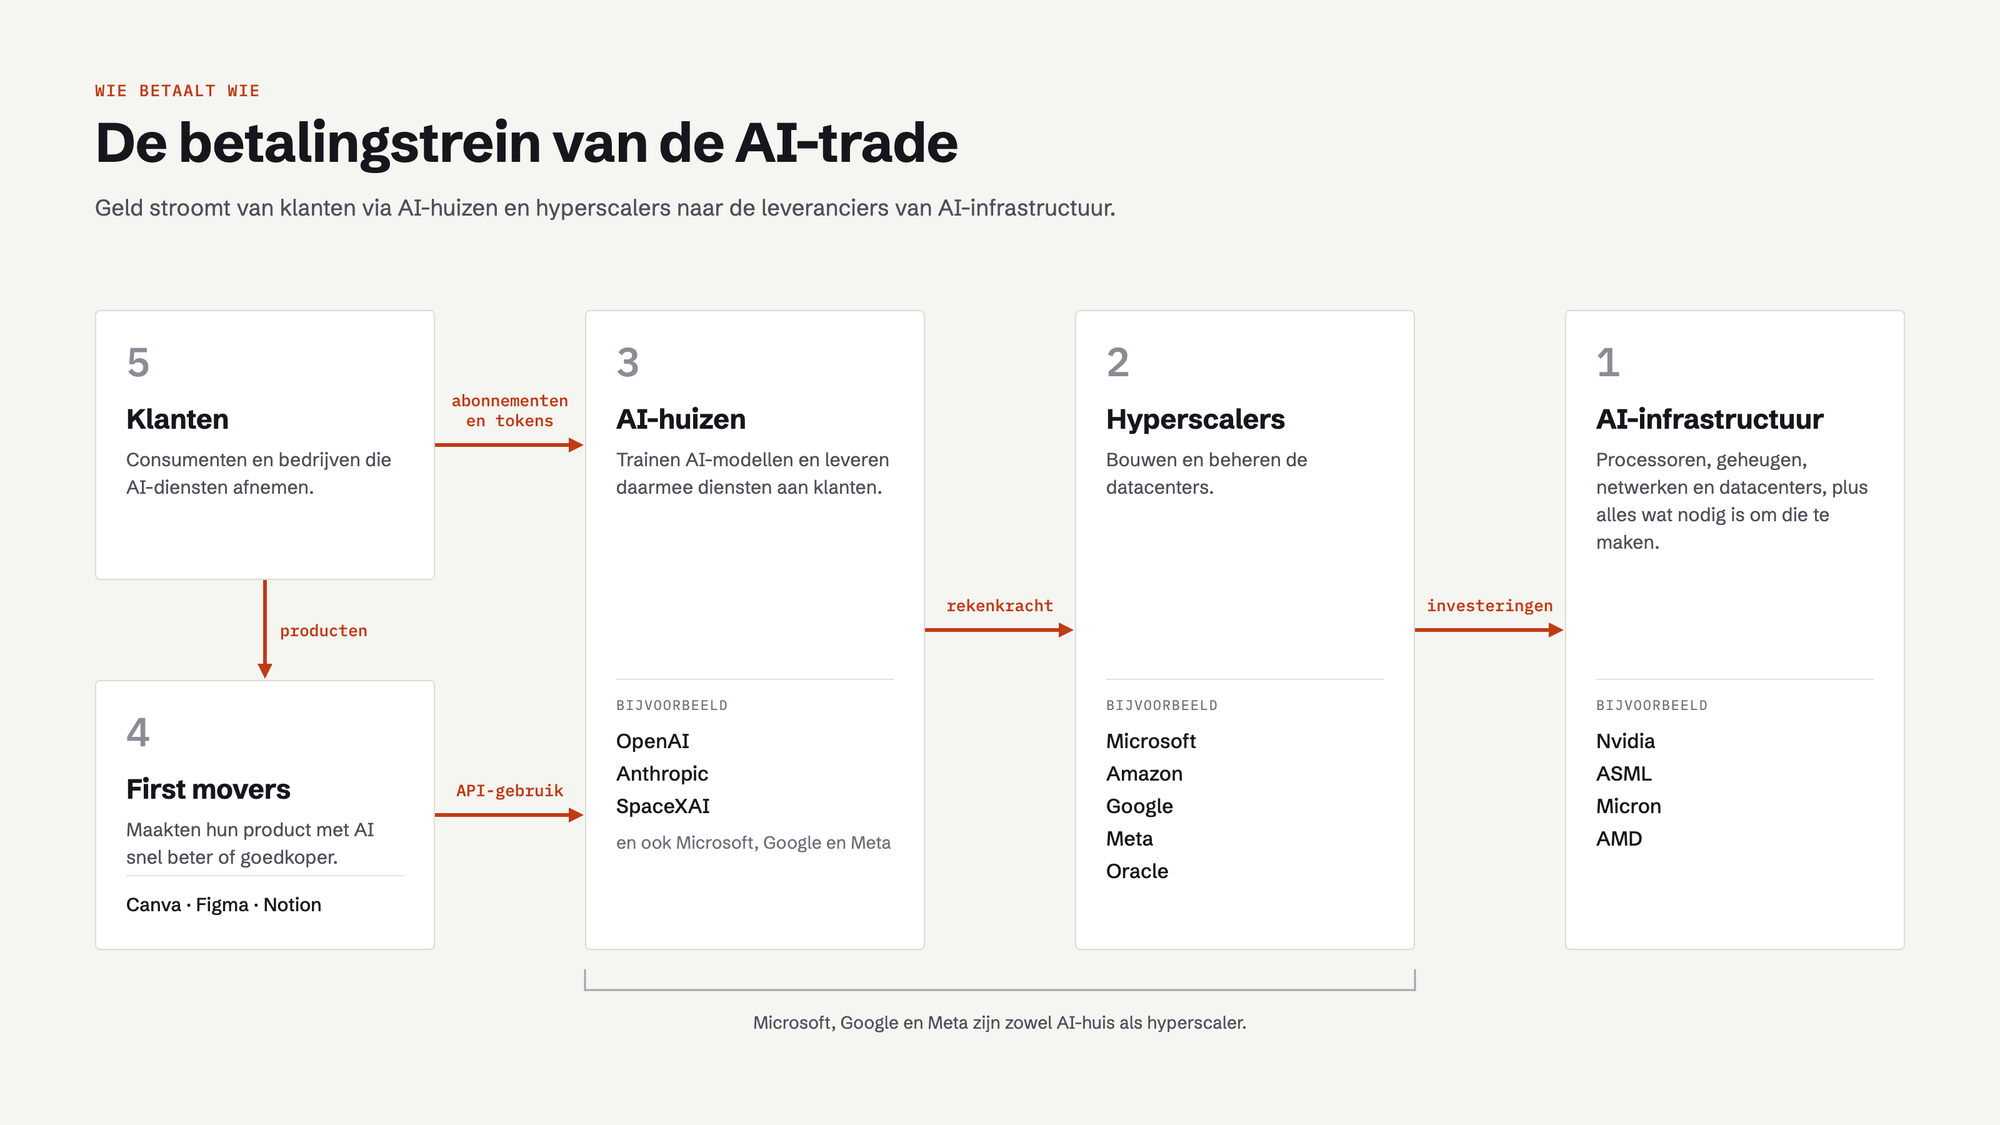
The big question is whether the hefty valuations within the ‘AI trade’ are justified. To get a sense of that, we need to distinguish between the following groups:
- AI infrastructure. Suppliers of processors, memory, networking, data centres and everything needed to produce them. Think Nvidia, ASML, Micron and AMD.
- Hyperscalers. Big tech companies that build and operate the data centres. Think Microsoft, Amazon, Google, Meta and Oracle.
- AI labs. Big tech companies that train AI models and use them to deliver services to their customers. OpenAI, Anthropic and SpaceXAI, of course, but also Microsoft, Google and Meta themselves.
- First movers. Companies that have used AI to very quickly improve their product or service, or cut their costs. Companies such as Canva, Figma and Notion.
- Customers. Consumers or businesses that buy AI services, such as ChatGPT or Claude subscriptions, tokens for API usage, or specialised applications like cyber defence.
Together, these groups form a payment chain: customers (5) and first movers (4) pay the AI labs (3). They pay the hyperscalers (2) for computing power. And the hyperscalers invest massively in AI infrastructure (1).
Many of the companies in this chain have seen their share prices go through the roof over the past three years. If there is an AI bubble, just as there was an internet bubble in 2000, then those price gains are wildly overdone and the companies seriously overvalued.
To say anything meaningful about that, we need to make a number of estimates, such as:
- How much will customers pay in the coming years? The answer will depend heavily on how much (economic) value the products and services deliver. Think higher productivity, more revenue, lower costs, more enjoyment.
- Where does that money end up? Which companies capture the most value? Which part of the service becomes a low-margin commodity?
- What will the AI infrastructure of the future look like? Which chips will still be in use five years from now? What runs in a data centre and what runs on your device?
Make optimistic assumptions, and there is definitely no bubble – valuations even look cheap. Be sceptical, and you can easily argue that the trillions being invested will never be earned back, and that prices will be lower a few years from now than they are today.
As you can tell, the plausible outcomes are miles apart. In other words, there is huge uncertainty about how things will play out over a horizon of years.
And even if the best-case scenario materialises and AI stocks are much higher a few years from now, the road there could be bumpy. Big rallies come with violent corrections. We saw that this summer with infrastructure companies. Individual projects can also fail, companies can go bust and loans can go unpaid.
The market is constantly scanning for signals that might say something about the outcome. Yesterday, the Financial Times reported that OpenAI was at an annualised revenue of $50 billion in September, noting that this was less than the much-discussed $70 billion.
The market immediately took a sizeable step down, with the Nasdaq 100 falling 1.5% within a few hours. Makes sense: if the revenues of AI companies (3) disappoint, that is also bad news for the hyperscalers (4) and suppliers (5).
It turned out to be a storm in a teacup. The FT compared OpenAI's $50 billion in net revenue with $70 billion in gross revenue – OpenAI's own plus the margin intermediaries take on top. That latter figure is useful when comparing with other AI labs like Anthropic and SpaceXAI. Incidentally, OpenAI expects to actually reach an annualised revenue of $70 billion by the end of this year.
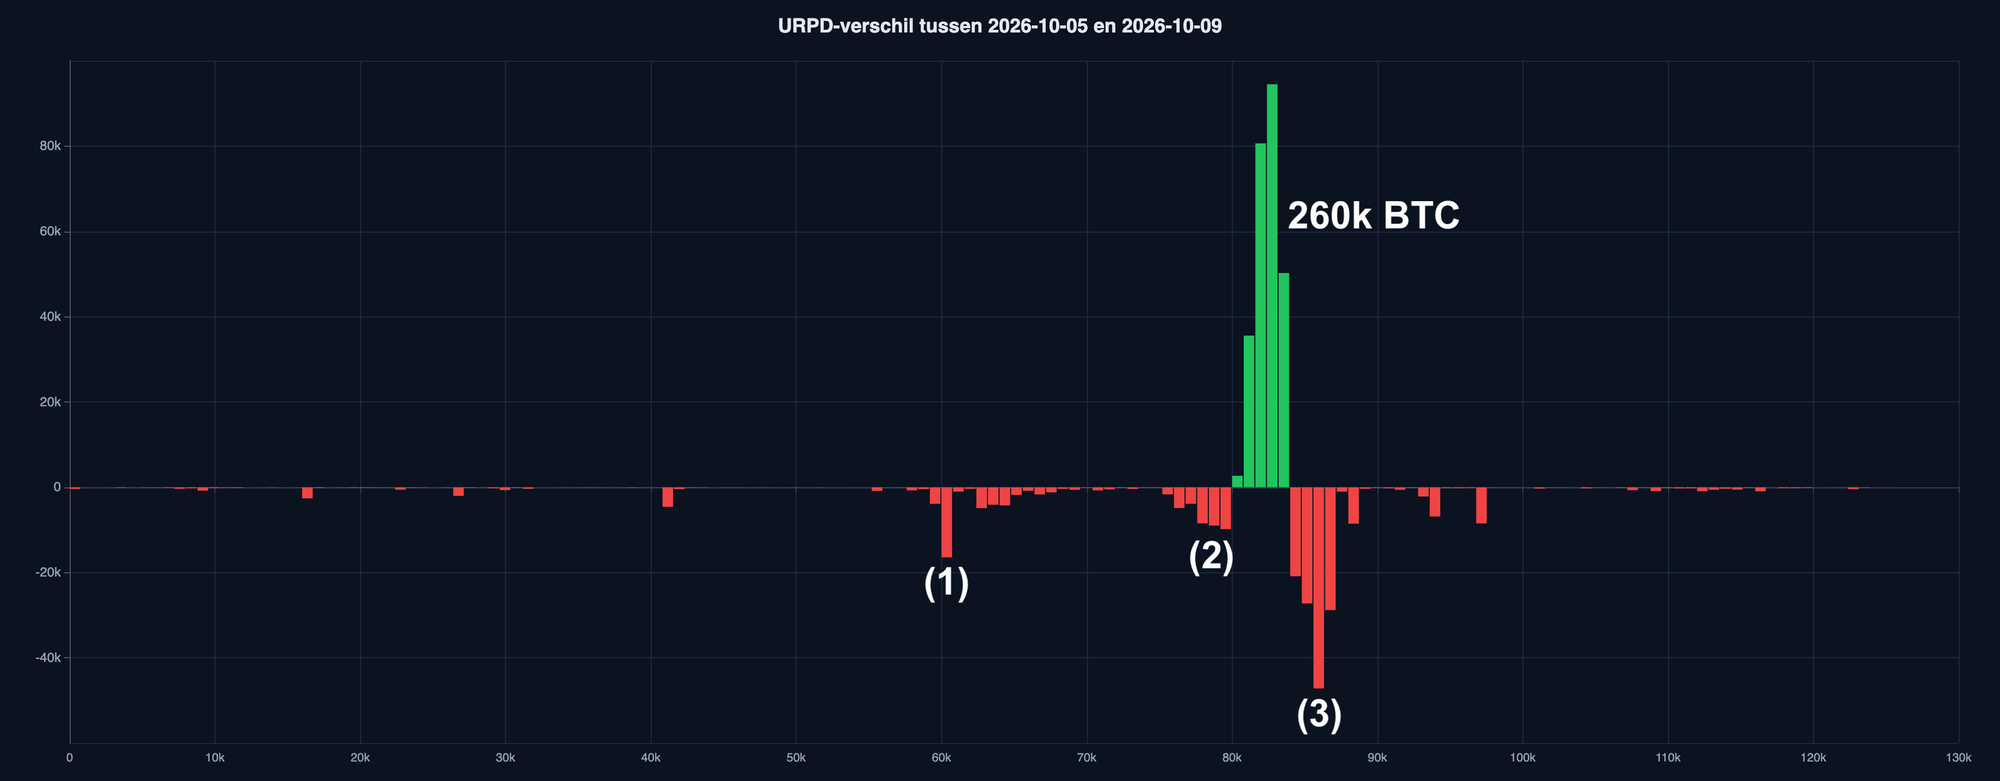
Yesterday's drop illustrates how sensitive investors are to new information. So far, the pattern has consistently been that the dip gets bought quickly afterwards. After all, this week we also saw all-time highs for the S&P 500 and the Nasdaq 100.
Bitcoin also took a tumble yesterday. The knee-jerk reaction in the stock market will undoubtedly have contributed. On top of that, doom stories were doing the rounds about the cryptography of bitcoin and other blockchains.
Justin Drake and Vitalik Buterin are concerned about the flood of discoveries in mathematics. Read their posts carefully and you'll see a call to think about this, along with words like ‘no rush’. But it's hardly surprising that some people got a bit panicky when they read “begin planning for bunker-mode”. A bit unfortunate, to put it mildly. We discussed this topic at length in yesterday's Satoshi Radio.
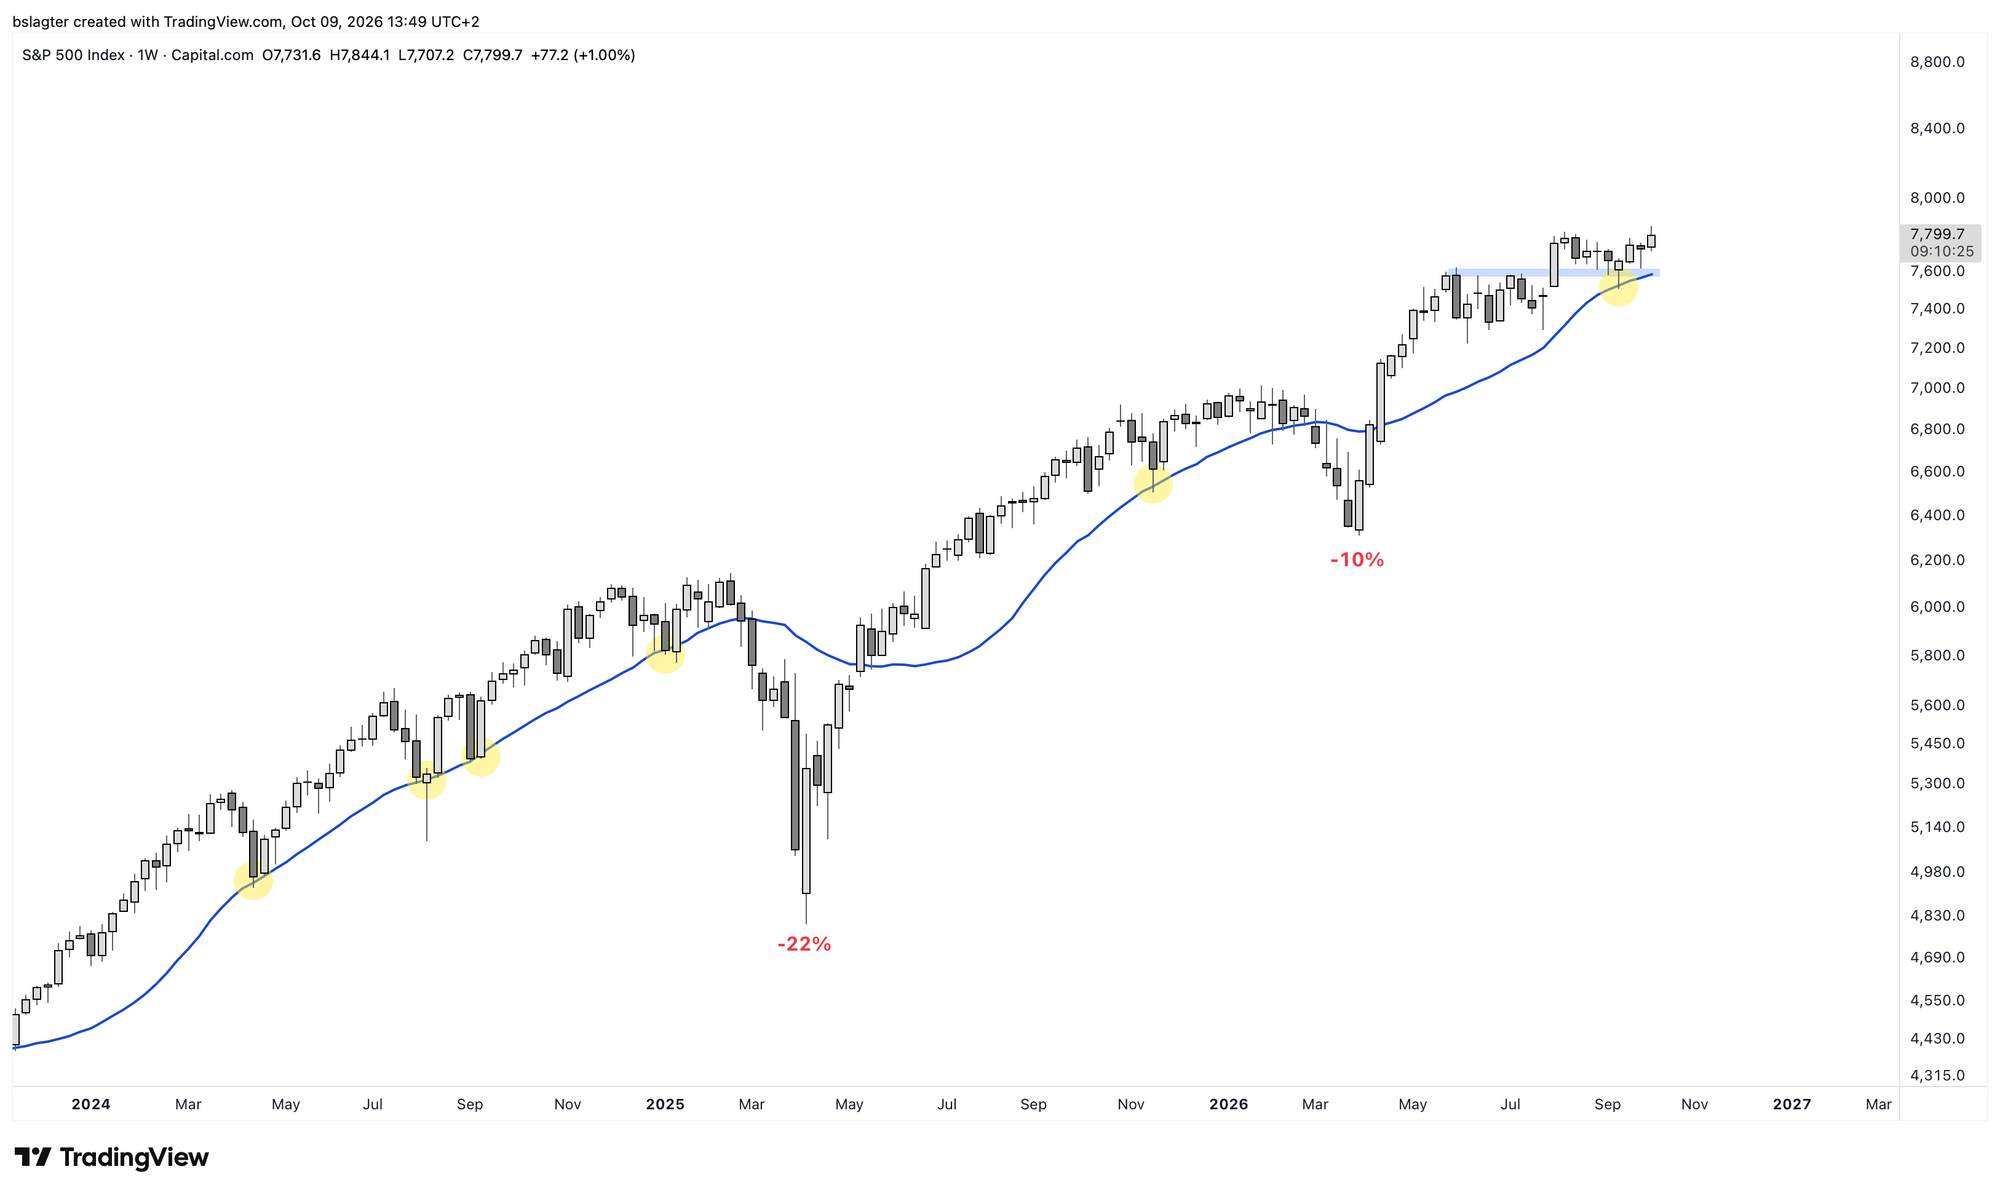
Over the past few days, the bitcoin price fell 8%, from $87,200 on Monday to $80,300 on Thursday. That was followed by a slight recovery to between $82k and $83k. Annoying for investors hoping for a quick ride above $90,000, but no disaster. At the current price, we're still a hefty 40%+ above the low of $57,700 on 1 July.
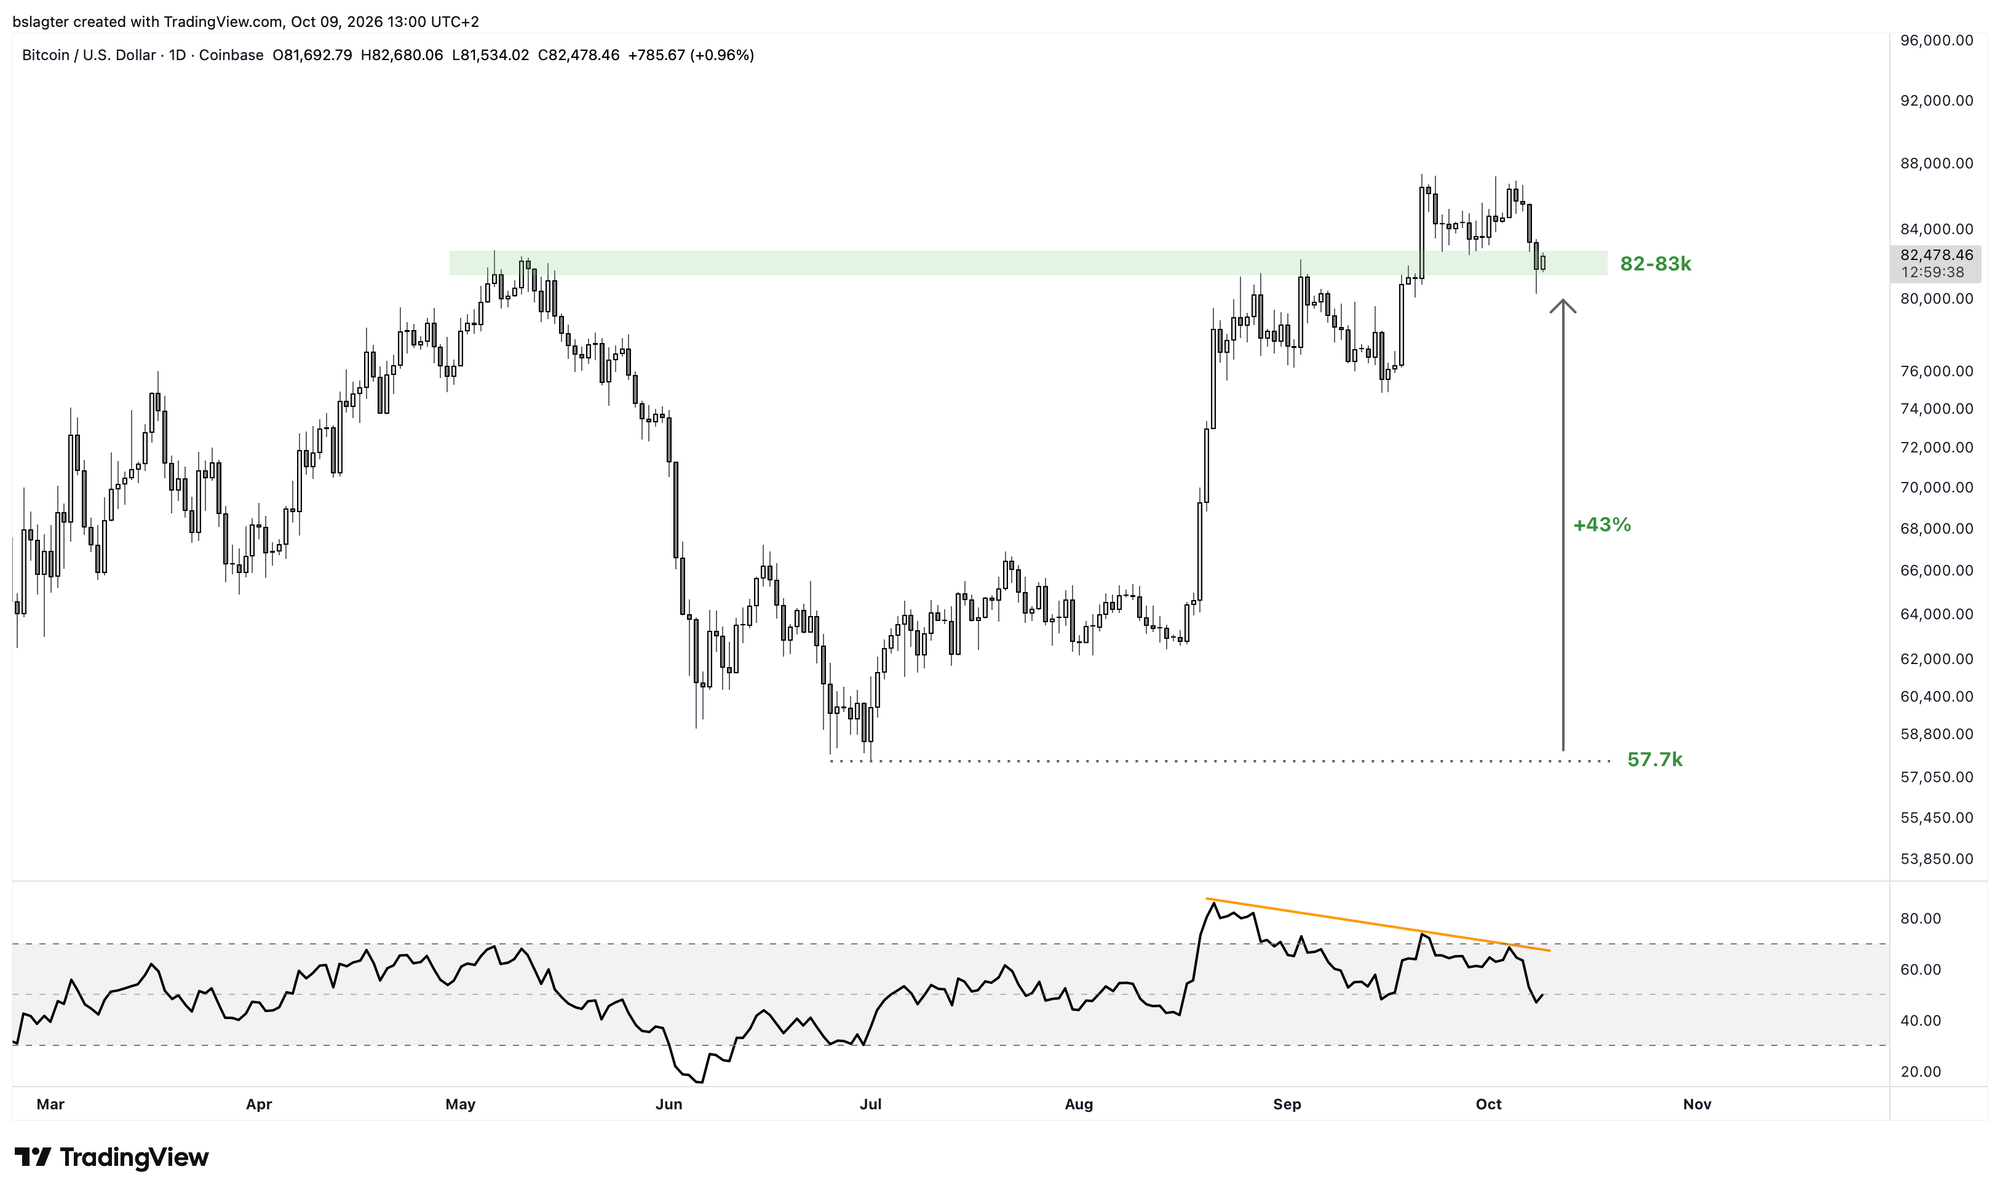
From the charts of realized loss, realized profit and URPD, we can conclude the following. Long-term holders are barely taking profits. Investors who bought at last year's top are barely taking losses.
The selling pressure comes from three groups, which you could characterise as follows:
- Players who bought around $60,000 and are now taking profits.
- Players who bought around $78,000, are now having second thoughts, and are exiting with a small profit.
- Players who bought around $86,000, expected further gains, and are now exiting at a small loss.
None of this is cause for serious concern. It's behaviour consistent with a minor correction in an early bull market.
It's quite conceivable that for a new period of strength and the next leap higher, we'll have to wait for some easing on issues like Iran, inflation and the bond market. Who knows what Trump, with the elections looming, will pull out of his hat in the coming week!
We continue with the following topics for our Alpha Plus members:
- Weekly & daily cycle
- Is this the dip we've been waiting for?
- Central banks are feeling the stress
- Market expects rate hikes, just like in 2008
1️⃣ Weekly & daily cycle
 Contribution by
 Bert
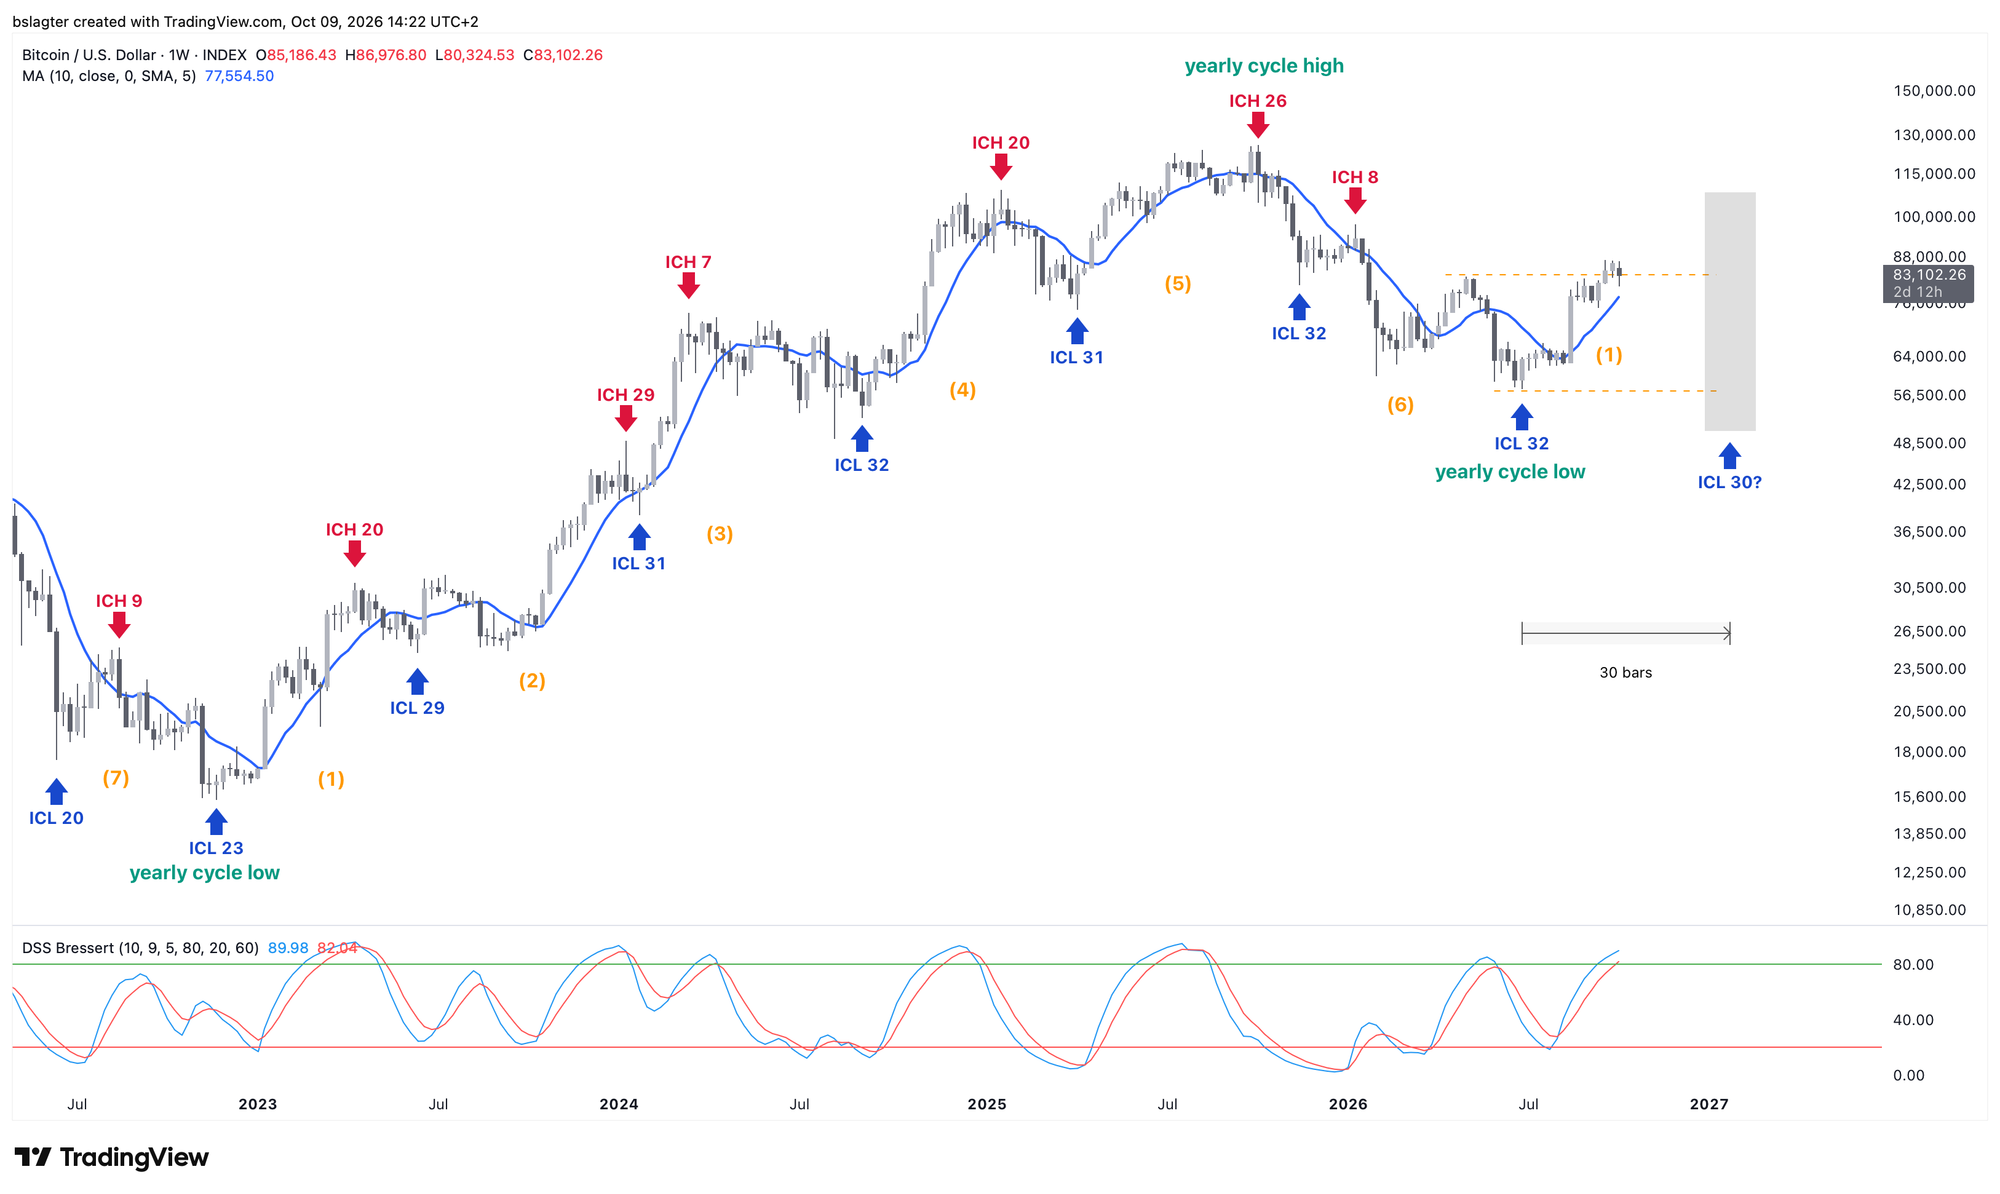
Taking 1 July as the starting point of this weekly cycle, we are now in week 14 of an average 31–32 weeks. In a bull market, we often see tops around two-thirds of the way through the cycle. A typical pattern would put the top (ICH) somewhere in November or December and the low (ICL) in January.
So there's still a fair amount of time to extend the performance of this first weekly cycle. The provisional top of $87,000 is 50% above the starting point of $57,700. That could stand to be a bit more.
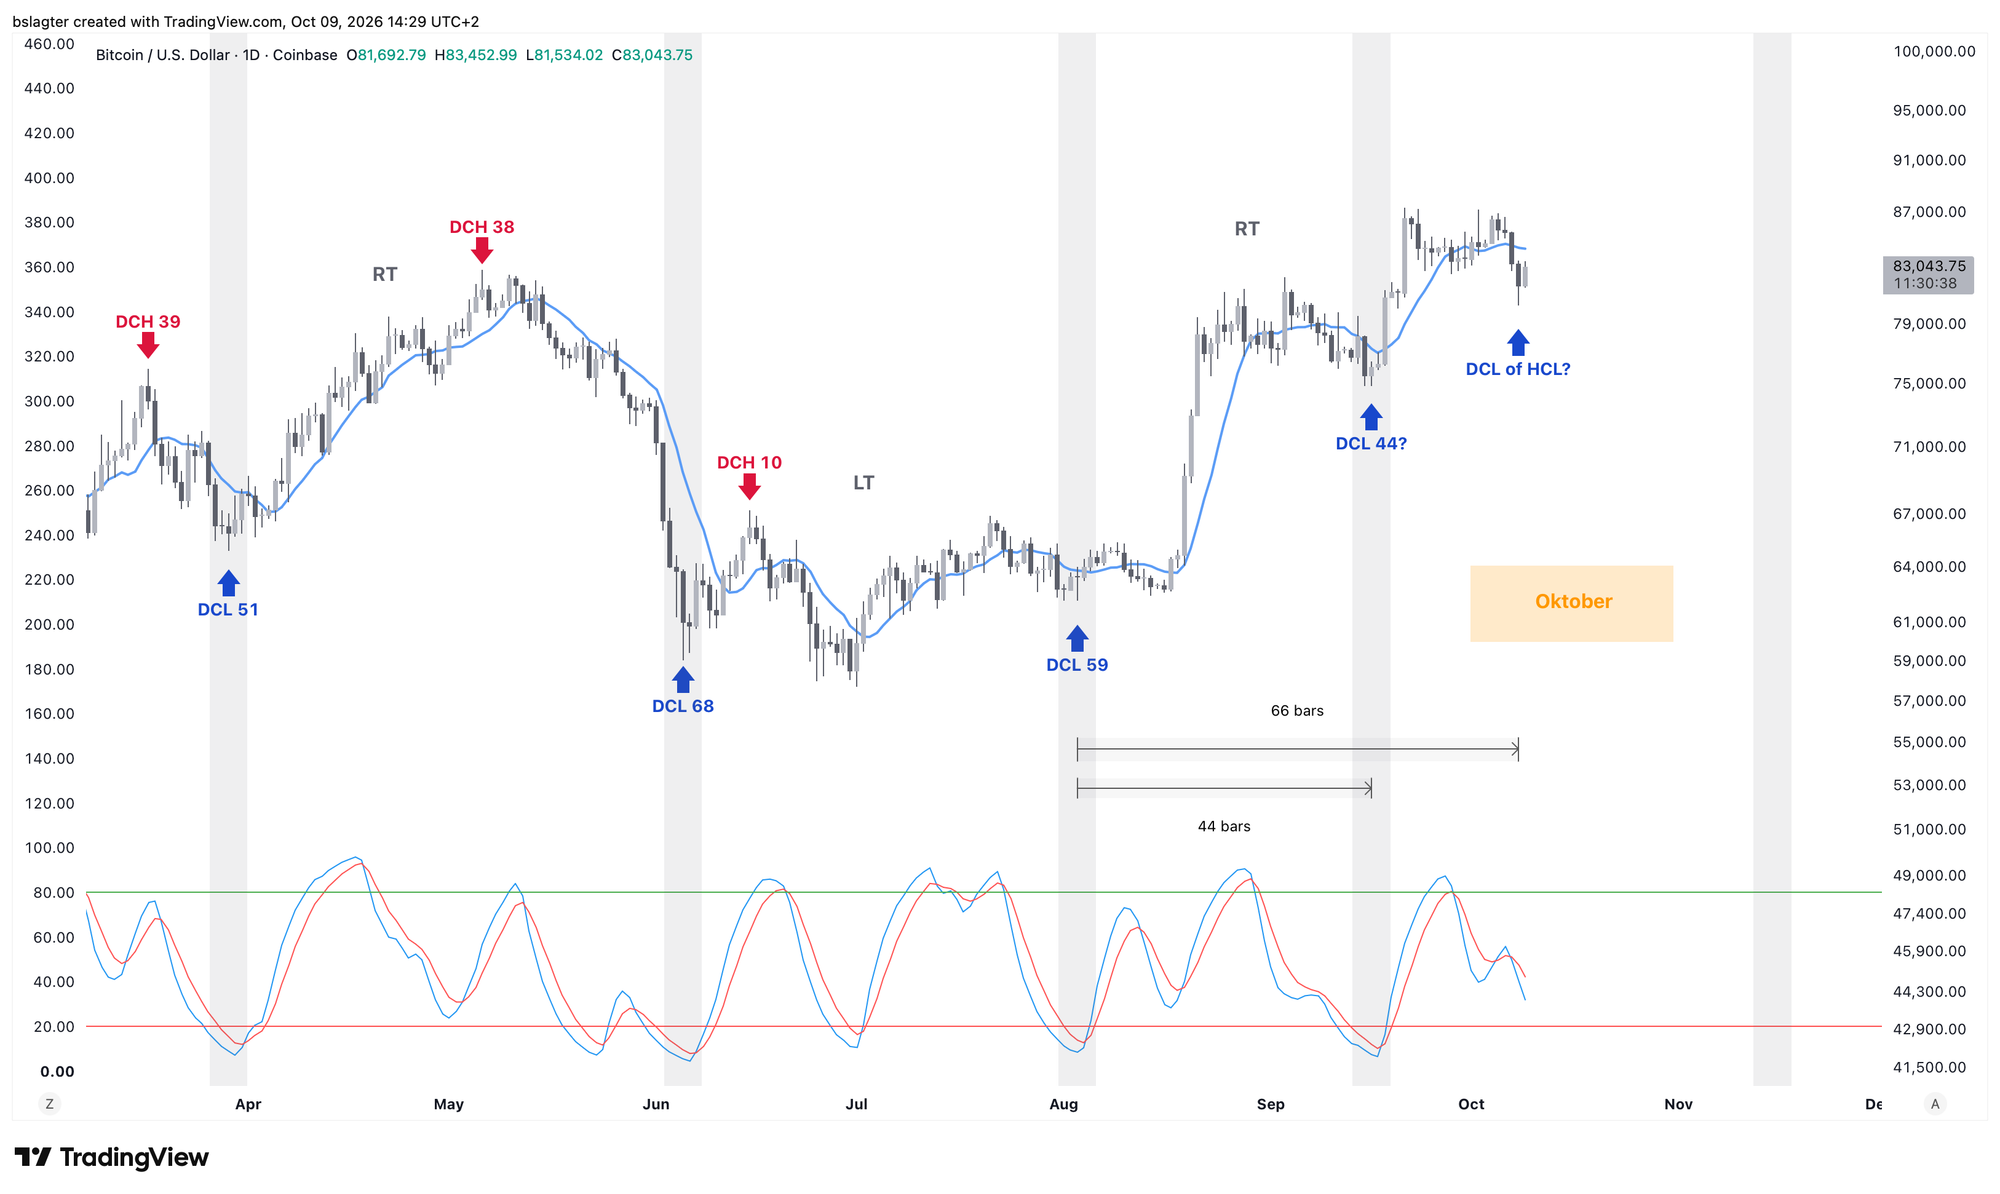
The daily cycle has two interpretations. There's a case to be made for marking 16 September as the daily cycle low (DCL). Just look at the depth of the momentum indicator and the long stretch below the 10-day average. On the other hand, 44 days is rather short.
The alternative is that we're now around a DCL. For example, yesterday's $80,300 on day 66, or a slightly lower price in the coming days.
Both interpretations are plausible. How things develop over the coming weeks will help us choose. Fortunately, it makes no difference for the weekly cycle!
2️⃣ Is this the dip we've been waiting for?
 Contribution by
 Sam
In the Markets edition of 28 August, we talked about buying back after a correction. At that point, the bitcoin price was meeting resistance around $80,000. The price didn't go much lower than $75,000 before moving further up to $87,000.
This breakout was considerably weaker than the move from $63,000 to $80,000. Bitcoin also showed its by-now familiar character once again: a short, sharp rally followed by several weeks of sideways action. After 21 September, we were stuck between roughly $83,000 and $87,500.
Last Thursday, the market picked a direction with a breakdown, sweeping all the local lows at the bottom of this range. At the very least, this means we can now sketch out a few scenarios for buying the dip.
We want to buy the dip because all higher timeframes are bullish. The daily, weekly and monthly charts have all printed a higher high. We therefore assume a higher low will form, until proven otherwise.
Officially, that would be proven the moment the price falls below $58,000. However, the weekly chart has proven to be a good guide for distinguishing between bull and bear markets. In short, the deepest correction can involve a brief wick, but not a weekly close below $75,000.
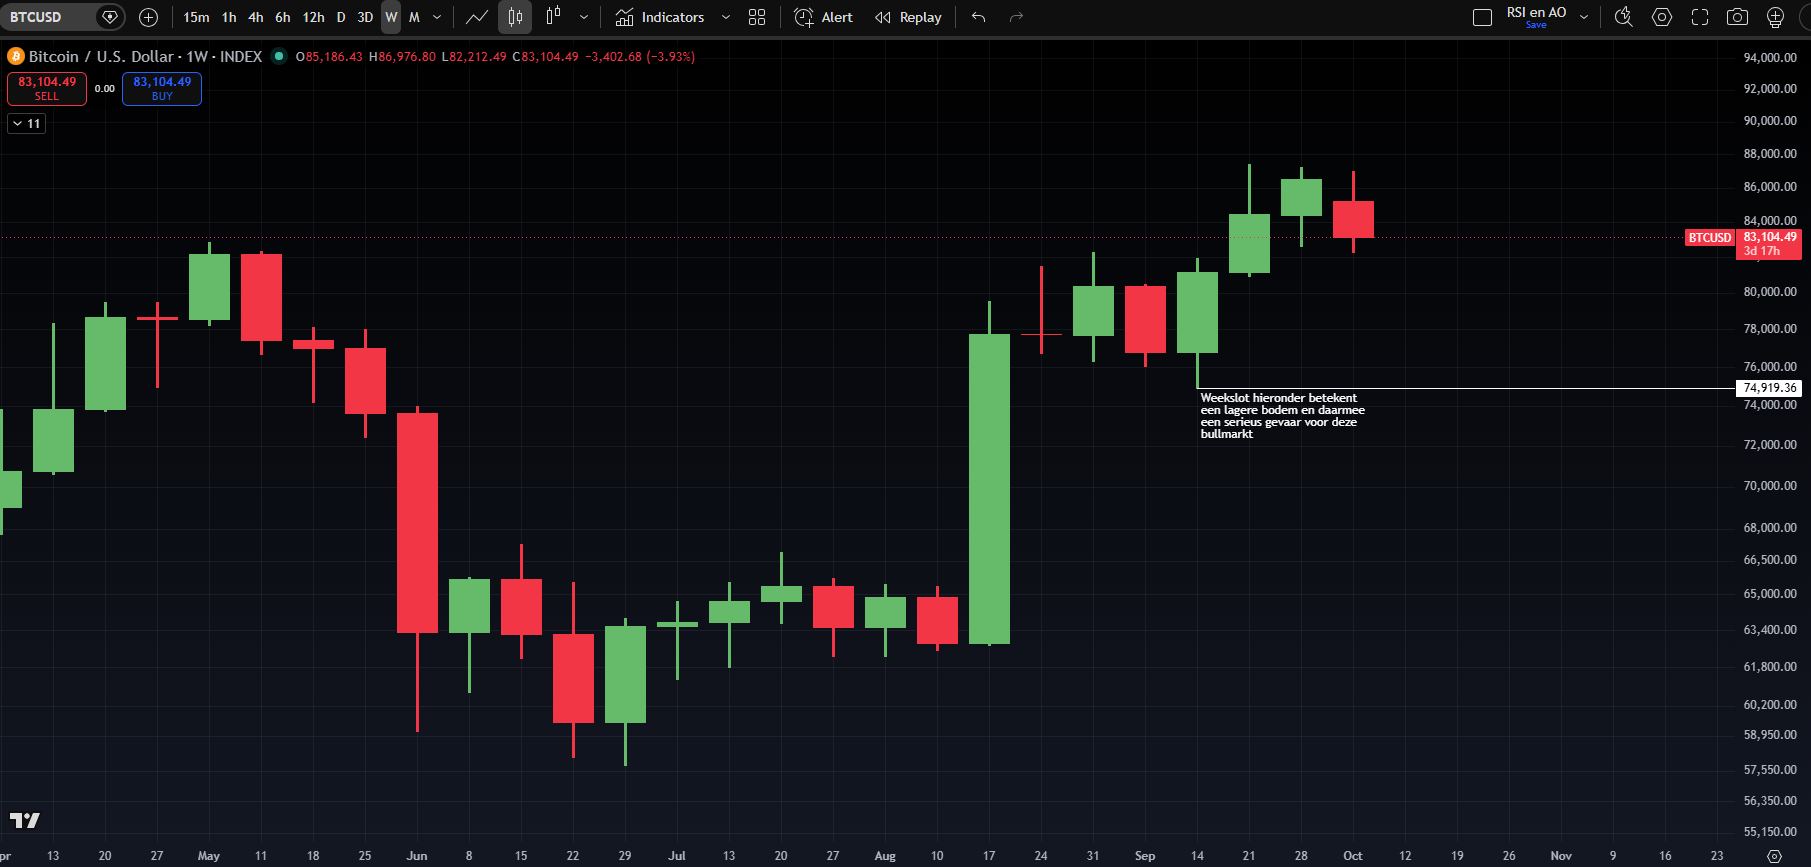
At the opposite end from the deepest move we'd still consider a correction is the shallowest variant. In that case, yesterday's $80,000 was the bottom.
That would, however, require a strong response from the bulls to get back above $83,000. We only just tagged the support zone on the weekly chart (white box), but didn't hit the clear local low of $79,000. That makes it difficult to step in with conviction right now.
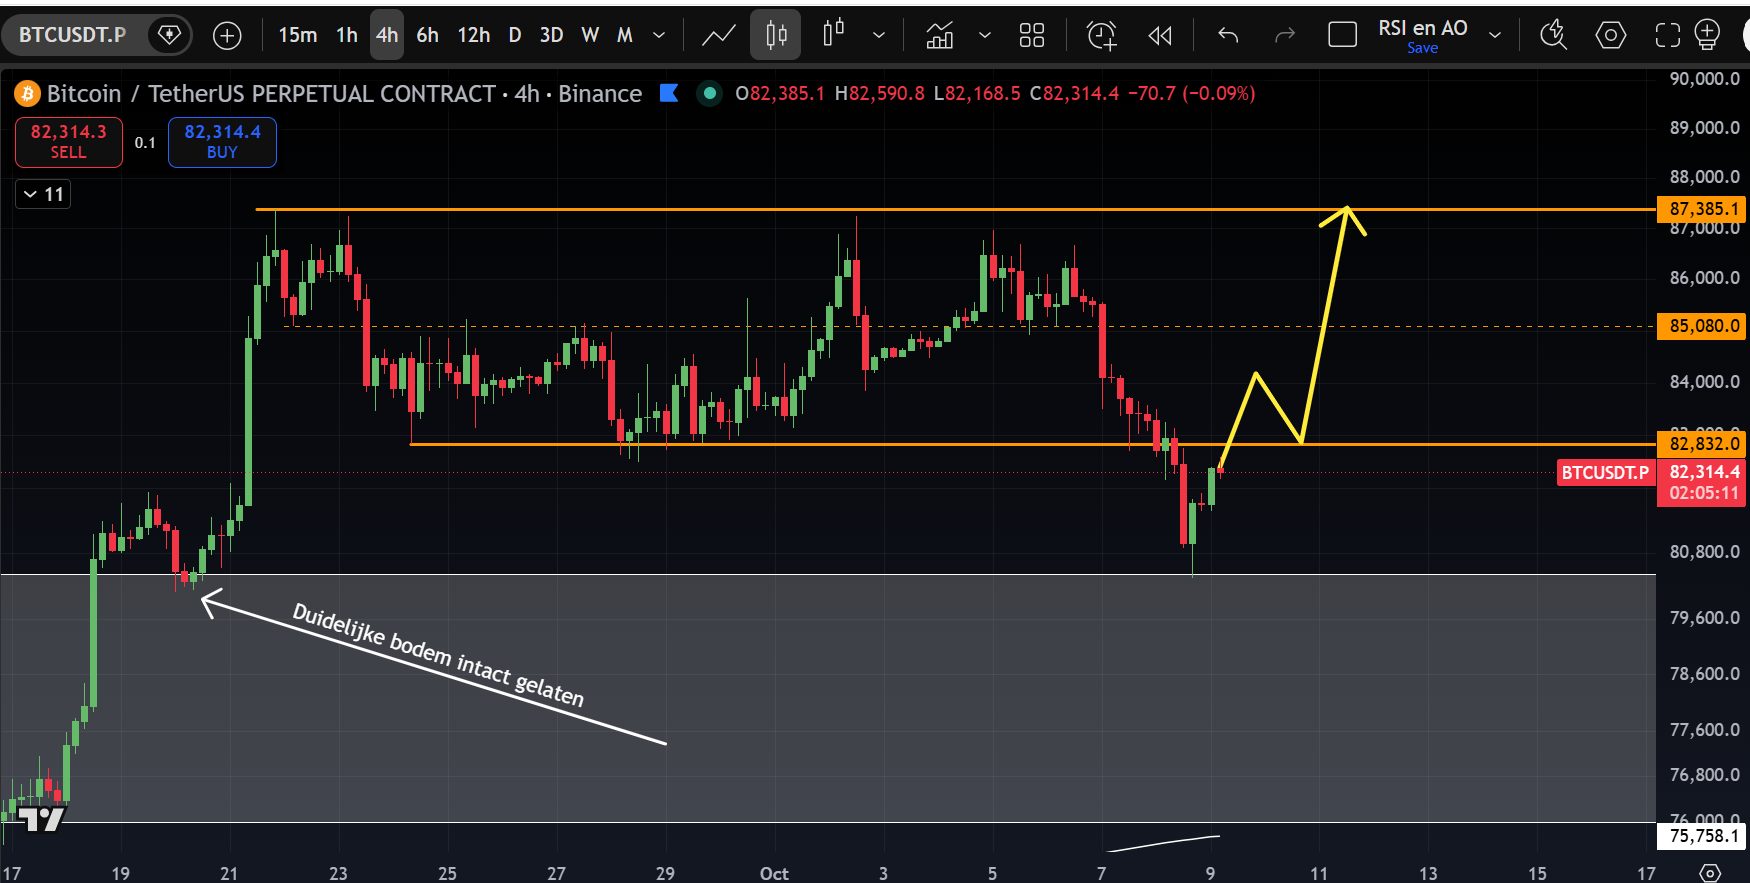
If yesterday turns out not to have been the bottom after all, the following scenario is a very interesting one: a brief move below $80,000 followed by strength from the bulls. It's interesting for several reasons:
- A move below $80,000 creates psychological uncertainty;
- We trade below the clear low to grab liquidity, but keep the market structure on the daily chart intact with a higher close;
- The price enters a support area on the weekly chart (white box).
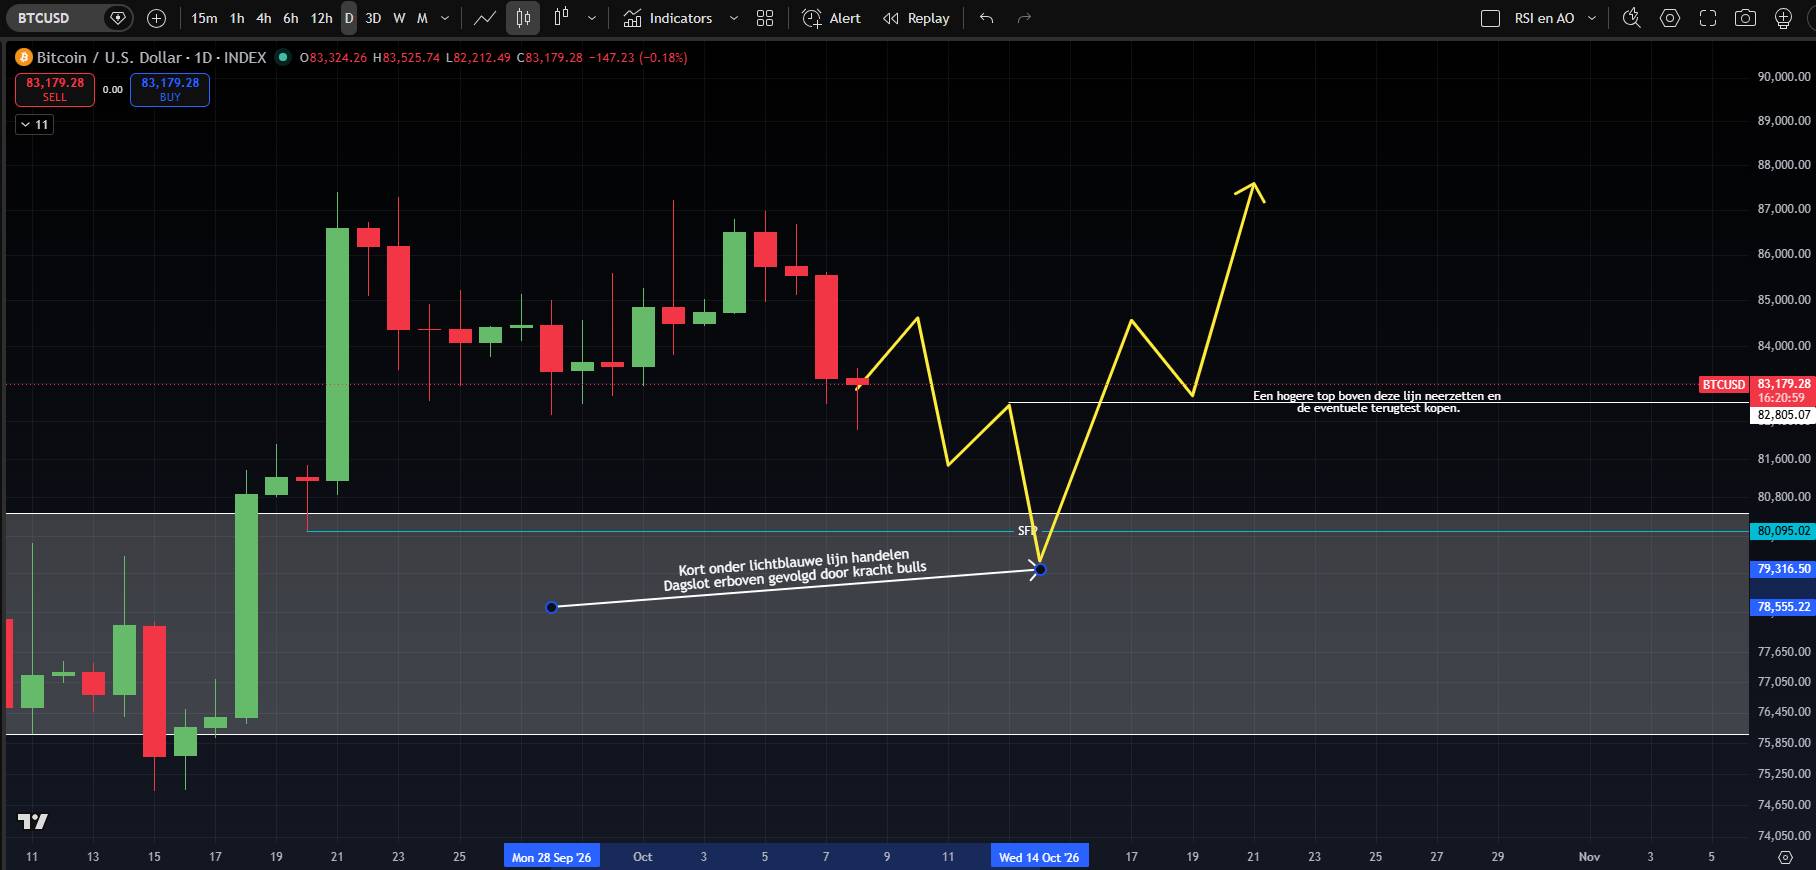
At this point, all of the above options are still on the table, and the likelihood of each scenario will shift depending on the bulls' response – or lack thereof. Finally, some volatility back in the market!
3️⃣ Central banks are feeling the stress
 Contribution by
 Thom
Rapidly rising bond yields are the talk of the financial world. For bitcoin, they're a headwind in the short term, while in the long term they put extra pressure on the sovereign debt problem – and thereby strengthen the investment case for bitcoin.
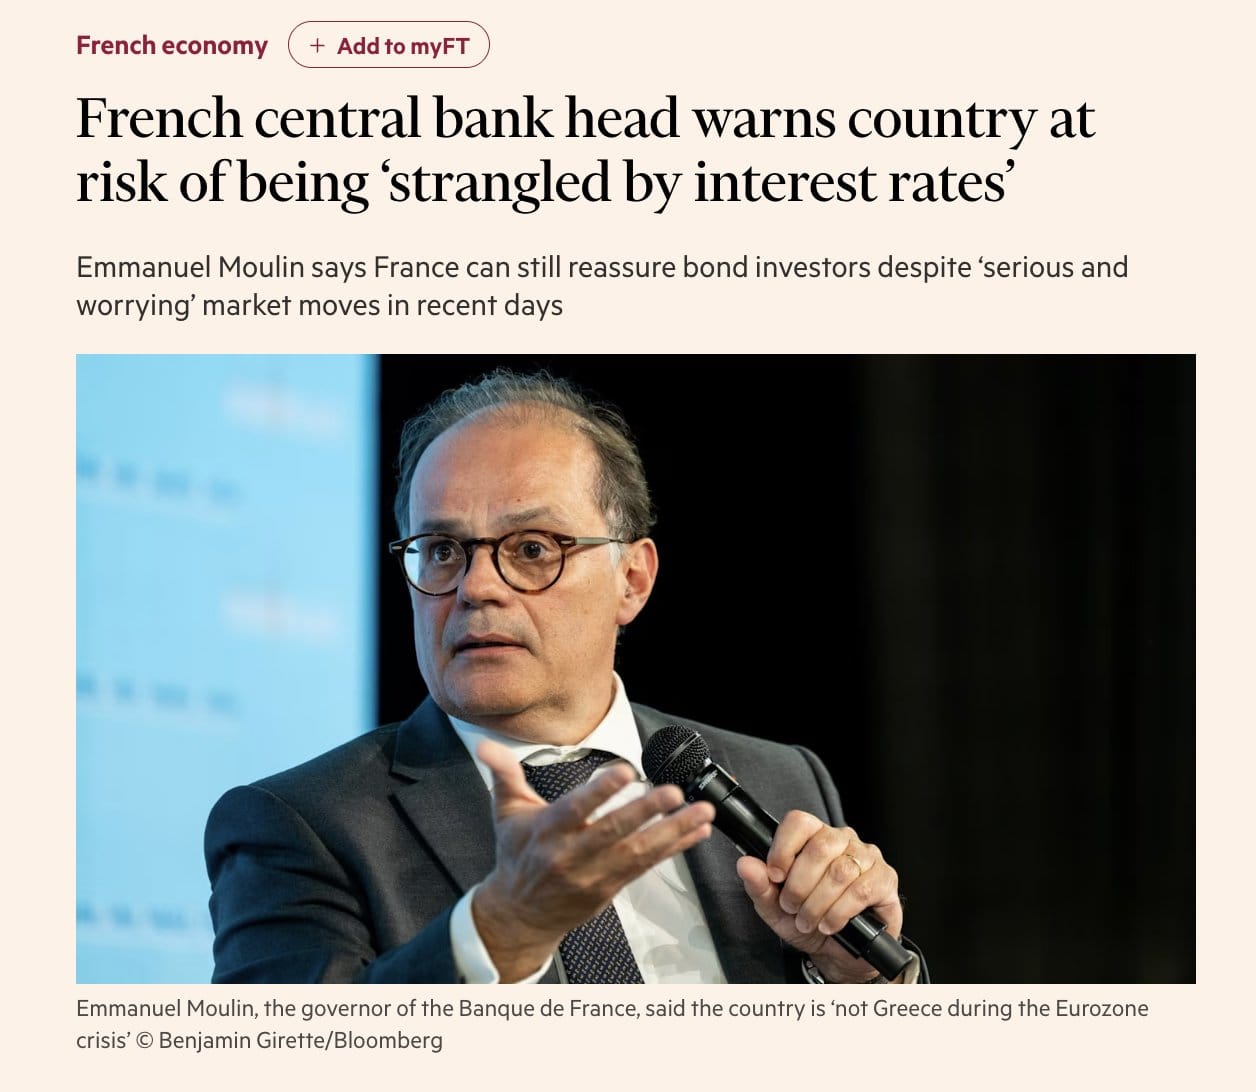
Meanwhile, bond yields have reached levels that are causing stress among central bankers. This week, for example, the Financial Times ran the following piece, in which the head of the French central bank voiced his concerns about yields.
For now, this situation hasn't triggered widespread panic in financial markets. The S&P 500 and Nasdaq 100 are still trading close to their all-time highs. On the surface, the market seems relatively unbothered by the tighter financial conditions.
But look a little beyond the index level and a different picture emerges.
Last month, technology was the only sector in the green in the United States. Every other sector had to swallow price declines. The claim that the market apparently couldn't care less about rising bond yields doesn't quite hold up.
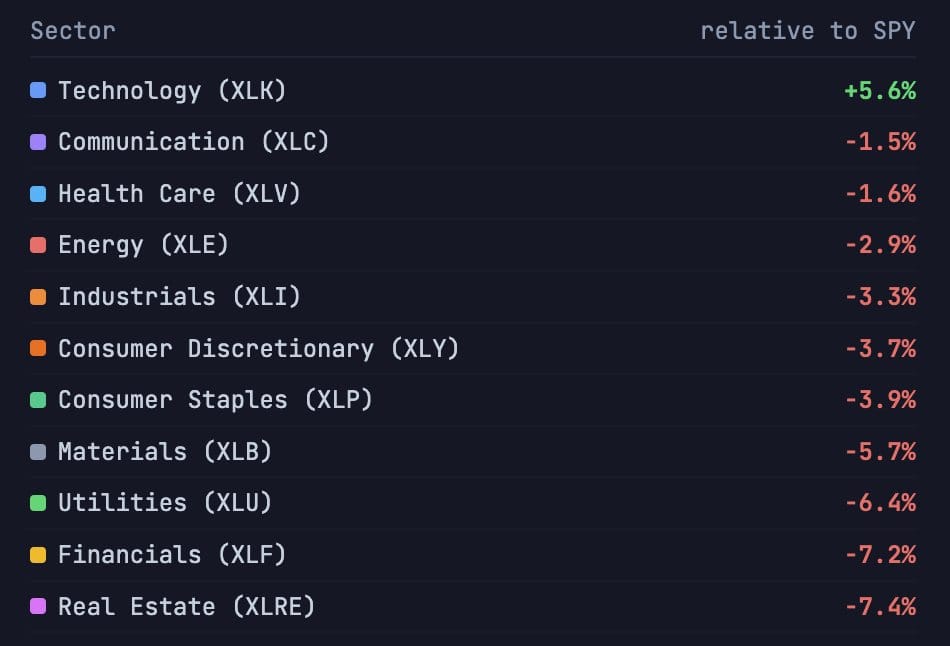
Wall Street is increasingly leaning on strong quarterly results from the AI sector, while the rest of the economy is buckling under high interest rates. Bitcoin and gold have also faced strong headwinds from bond yields in recent days.
Around me, I'm seeing more and more analysts argue that yields can't rise much further. Jim Bianco, who for years was negative on government bonds as part of a portfolio, recently made a 180-degree turn.
Based on economic growth and inflation expectations, he argues that government bonds are an attractive investment again – and that yields are currently at the levels you'd expect given the economic conditions.
In doing so, he's signalling his expectation that bond yields won't rise much further from here.
Personally, I also think we're approaching the point where central banks will increasingly step in to stop yields from rising. Not least because it's starting to hit large parts of the economy, as we can see from share prices in practically every sector other than tech.
And ultimately, the cure for high rates is high rates. They slow the economy, reduce demand for credit and dampen inflation, which eventually creates room for lower rates again. The only question is how far central banks are willing to let it go.
I've been making the case for bonds.
— Jim Bianco (@biancoresearch) October 8, 2026
If this cover cannot convince you that it's time for bonds, I cannot help you anymore!!@donnelly_brent https://t.co/vLJHhkiBsP pic.twitter.com/v1tYd6DX9G
4️⃣ Market expects rate hikes, just like in 2008
Contribution by Thom
While scrolling on X, I came across this analysis by Efficient Market Hype, which holds the current macro situation up against that of 2008. Although it's risky to draw conclusions from comparisons like this, I found this one interesting enough to share with you.
What happened in June 2008?
At the time, the US economy was already in recession, but the Federal Reserve was mainly worried about inflation.
The situation was as follows:
- The Fed had stopped cutting rates. After a series of cuts, the policy rate stood at 2%.
- The housing market was in dire straits. House prices were falling and banks were becoming increasingly reluctant to lend.
- Energy prices were soaring. Oil was approaching $140 a barrel, driving up inflationary pressure.
- The Fed expected inflation to ease, but at the same time warned of rising inflation expectations.
- Financial markets were already pricing in rate hikes again, despite clear economic weakness – as his chart shows.
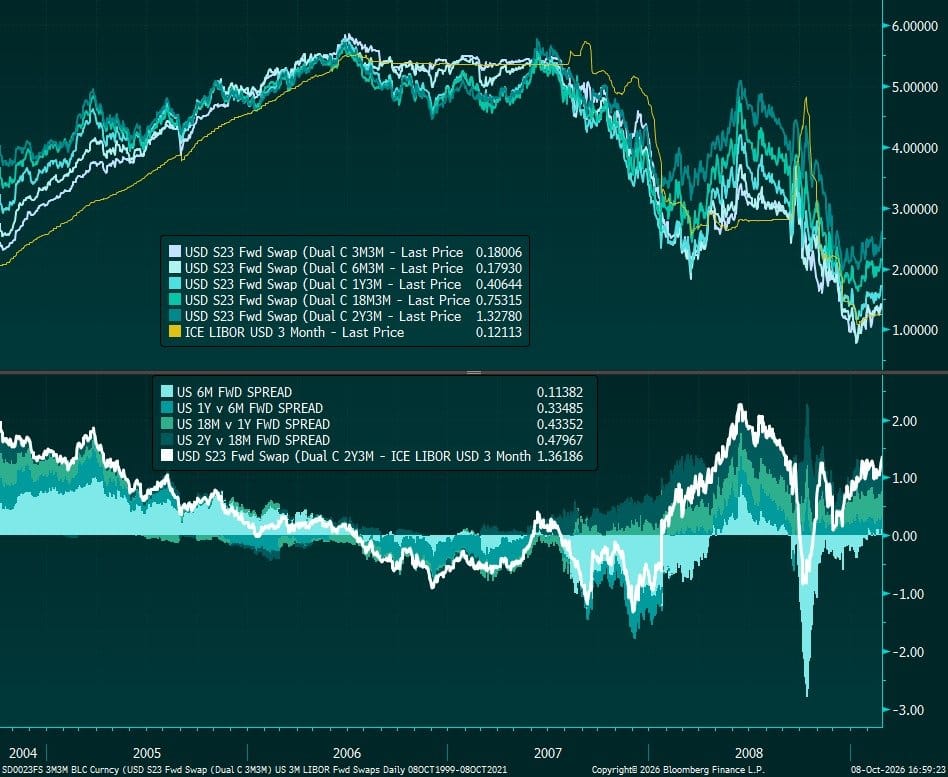
- Top of the chart: the various blue and green lines show the expected three-month rate at future points in time, from three months to two years ahead. The yellow line is the three-month LIBOR at the time.
- Bottom of the chart: here we see the differences between expected future rates and shorter reference rates. Above zero means the market expects higher rates; below zero points to expected rate cuts.
In 2007, expectations were largely below the short-term rate. Investors were counting on rate cuts.
But in the first half of 2008, that changed. Despite the problems in the housing market, investors once again began pricing in hefty rate hikes. A few months later, Lehman Brothers collapsed and the Fed was forced to cut rates aggressively instead.
And that situation bears some resemblance to today's.
- The US labour market is weakening, with just 29,000 new jobs in September.
- The oil price is rising again due to geopolitical tensions.
- The US 10-year yield is above 5.3%, putting further pressure on the economy.
- The market is pricing in another rate hike in December, while the Fed remains cautious about further tightening.
The big difference is that in 2008, the financial system was already grappling with a deep mortgage and banking crisis. That means today's situation isn't automatically comparable. But it's not entirely reassuring either – especially since we're seeing almost every sector on the stock market buckling under rising rates.
For bitcoin, that means a tough environment for now, with high rates and limited liquidity.
Finally
All previous editions of Alpha Markets can be found in the archive. Questions, comments and suggestions are very welcome in the community.
Thank you for reading!
To stay informed about the latest market developments and insights, follow our team members on X:
- Bart Mol (@Bart_Mol)
- Peter Slagter (@pesla)
- Bert Slagter (@bslagter)
- Mike Lelieveld (@mlelieveld)
We appreciate your continued support and look forward to bringing you more comprehensive analysis in our next edition.
Until then!