
A Solid Monthly Close Above $83K
Bitcoin closed both the week and the month above $83,000. Two more pieces of evidence for a new bull market. And all this while worries about interest rates keep piling up.

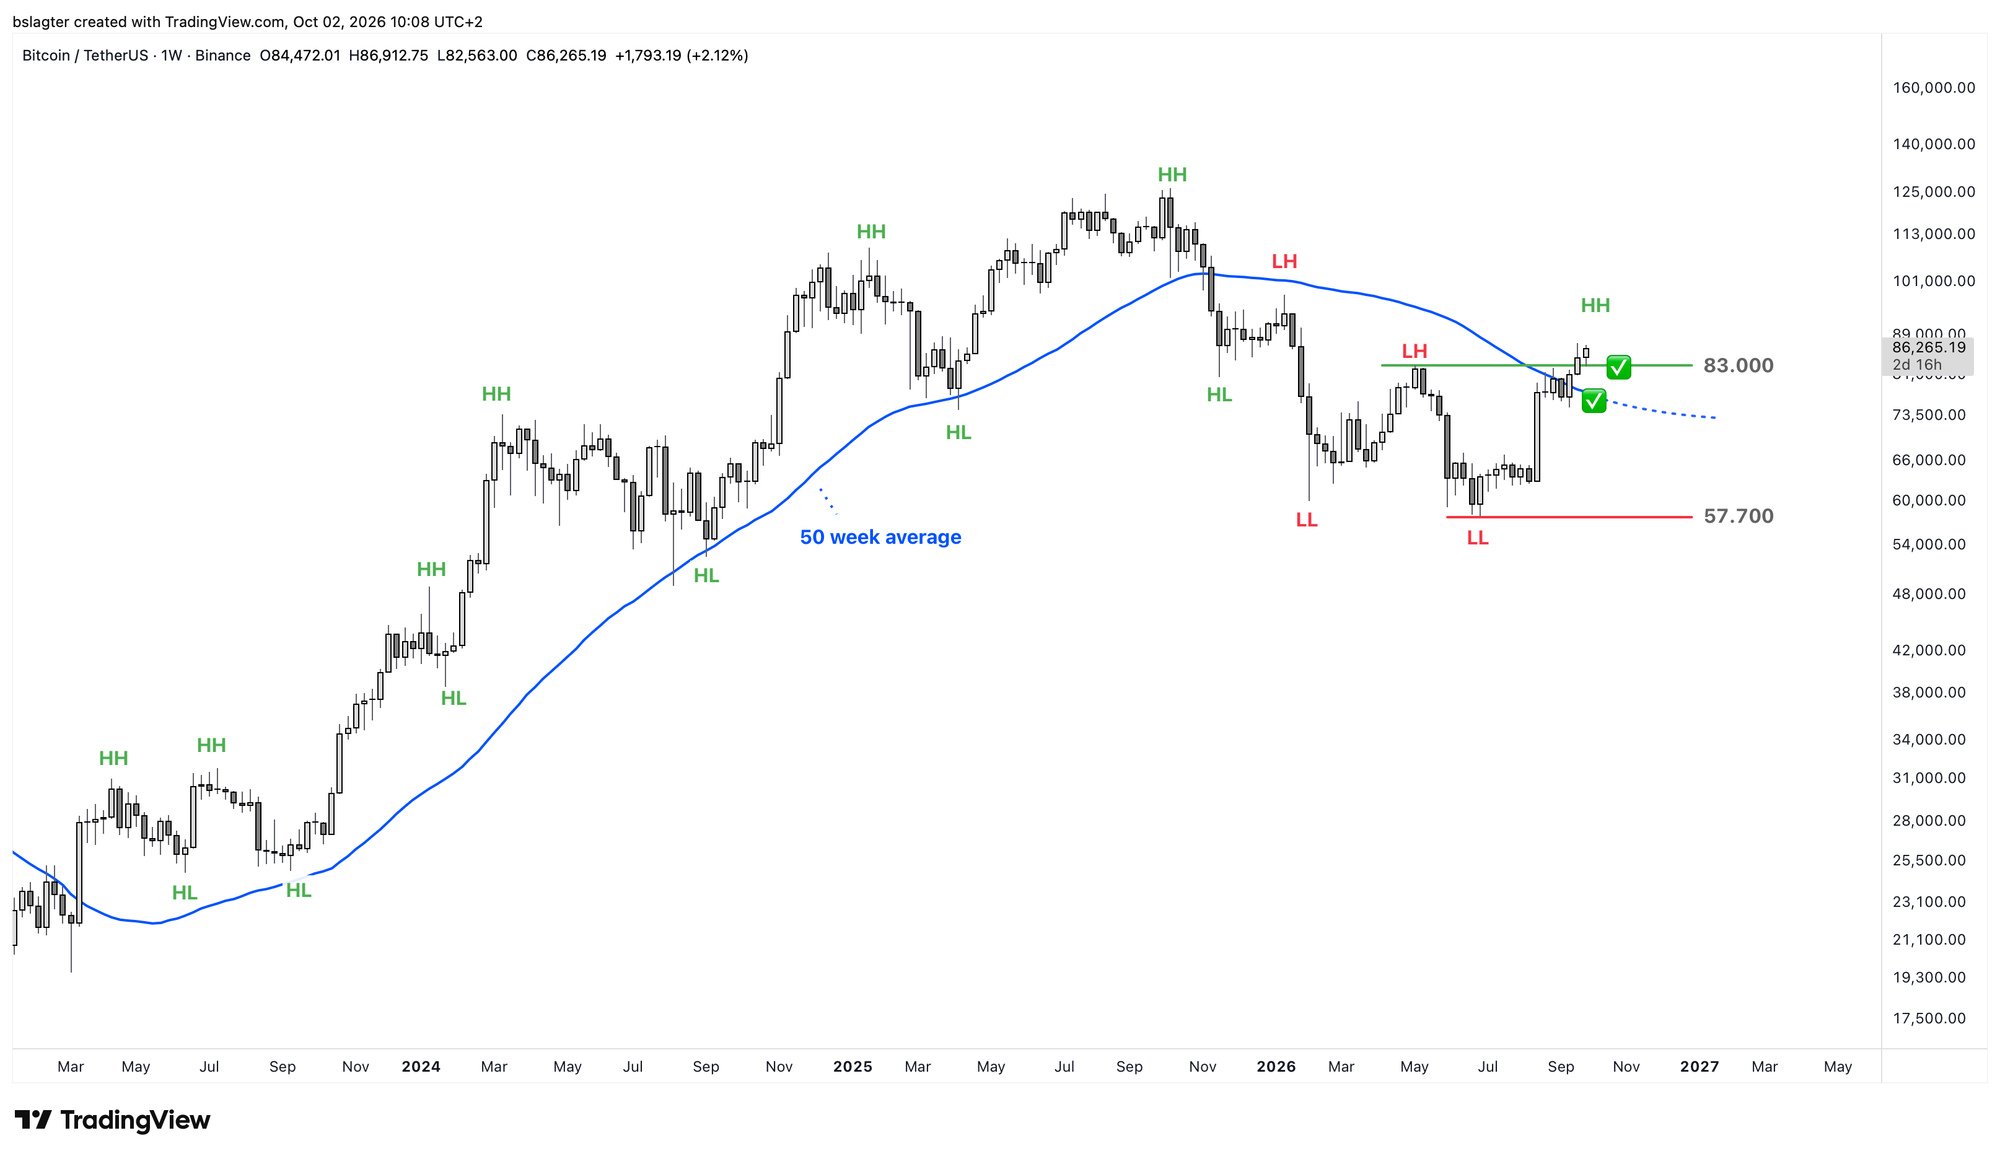
This week brought us further evidence that we're in the very early stages of a new bull market. Monday gave us a weekly close above $83,000 and Thursday a monthly close above $83,000. Across all timeframes, the May 6 peak has been beaten, and we now have our first higher high (HH) since October last year.
At first glance, September wasn't particularly spectacular. With a modest 6% gain, the price climbed from $78,500 to $83,500. But dig a little deeper and you'll find real strength. The first monthly close above the 12-month moving average. The RSI saw acceptance above 50. And three consecutive rising months fits a bull market far better than a bear market.
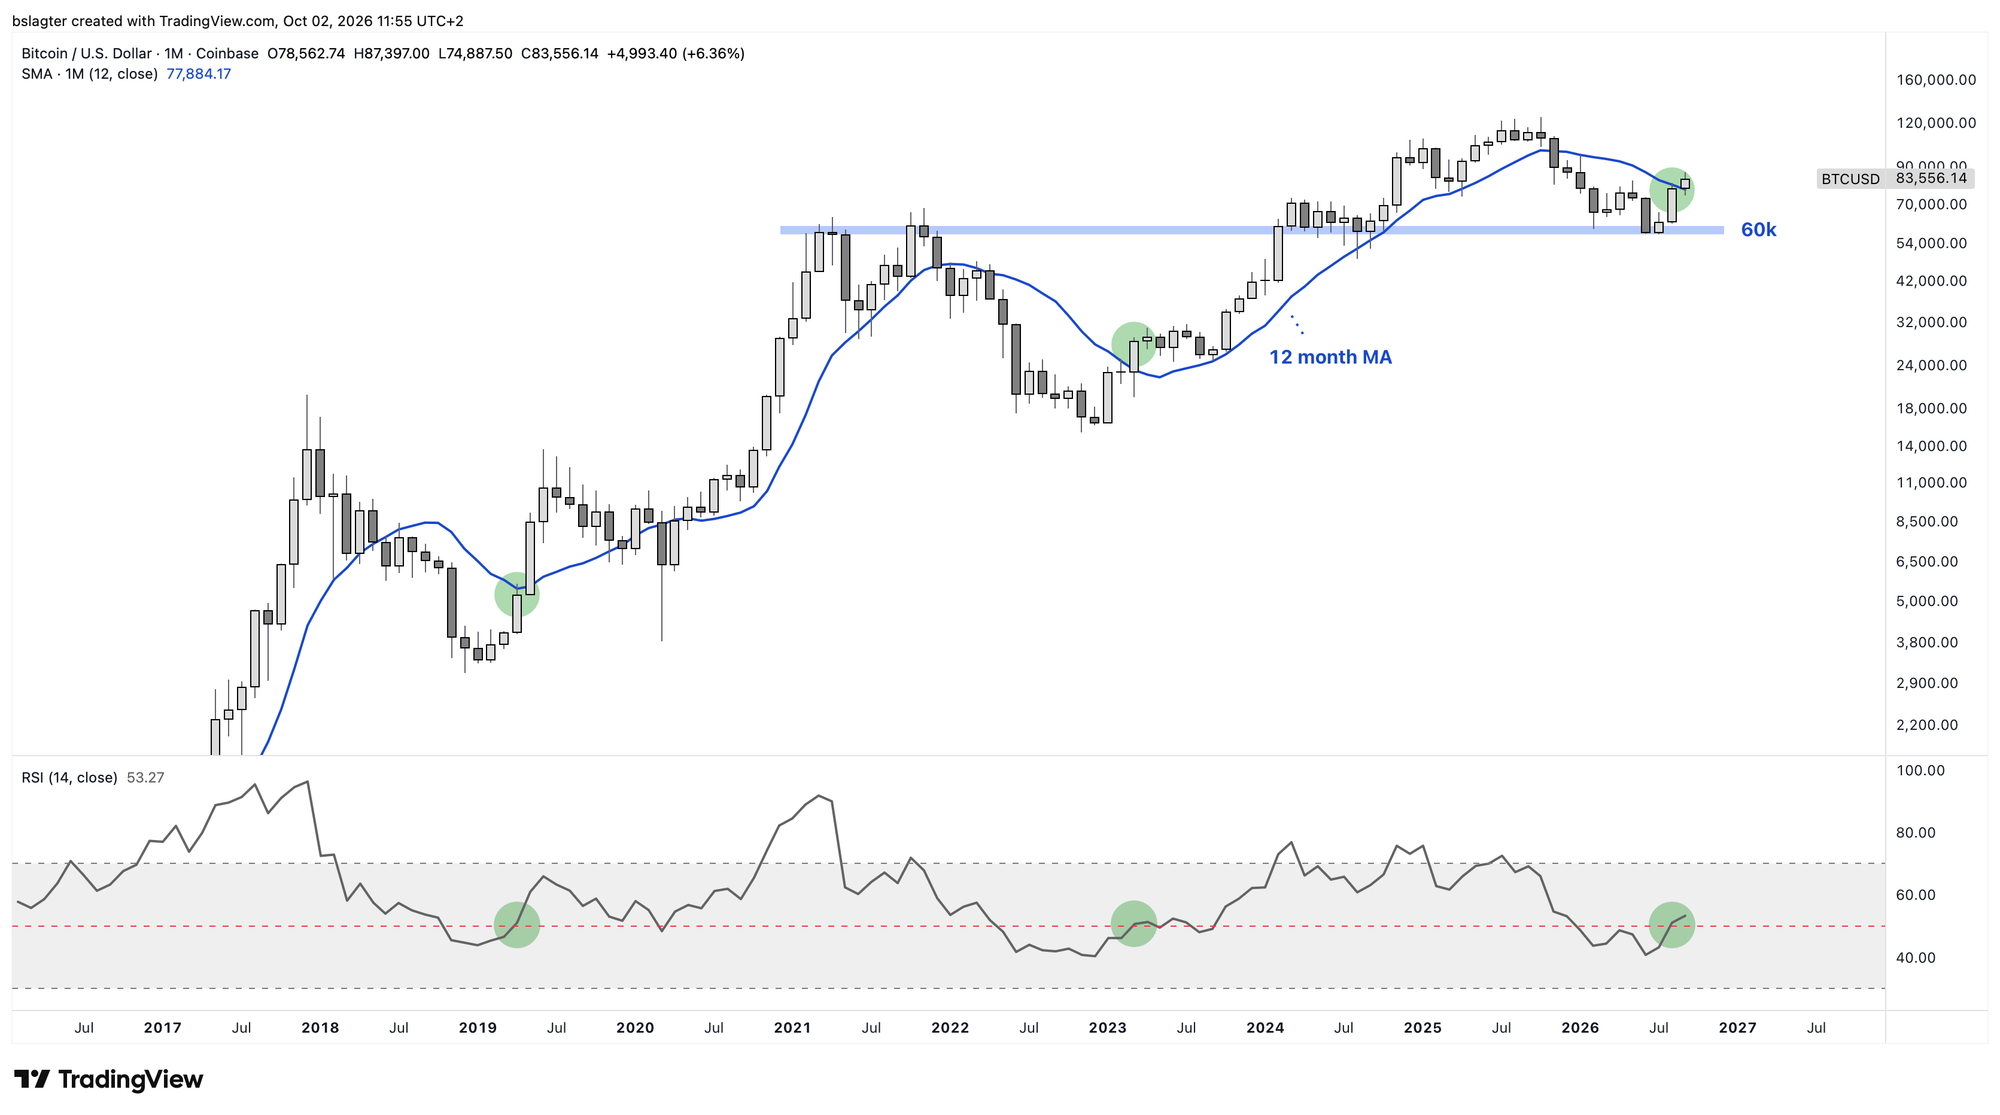
The myth of the metronomically precise four-year cycle is therefore under serious pressure. The most extreme version counts on bull markets lasting exactly 1,064 days and bear markets exactly 364 days. That would put the bottom on October 5, this coming Monday.
But even the slightly less precise version of the fairy tale is struggling. A lot would have to happen to push the price below $57,700 'somewhere in October.' It's not impossible, but it's certainly not the base case.
The flip side of this is that the group of investors who believe in it will take stock throughout October and defect to the new bull market camp. And thus take a position after all.
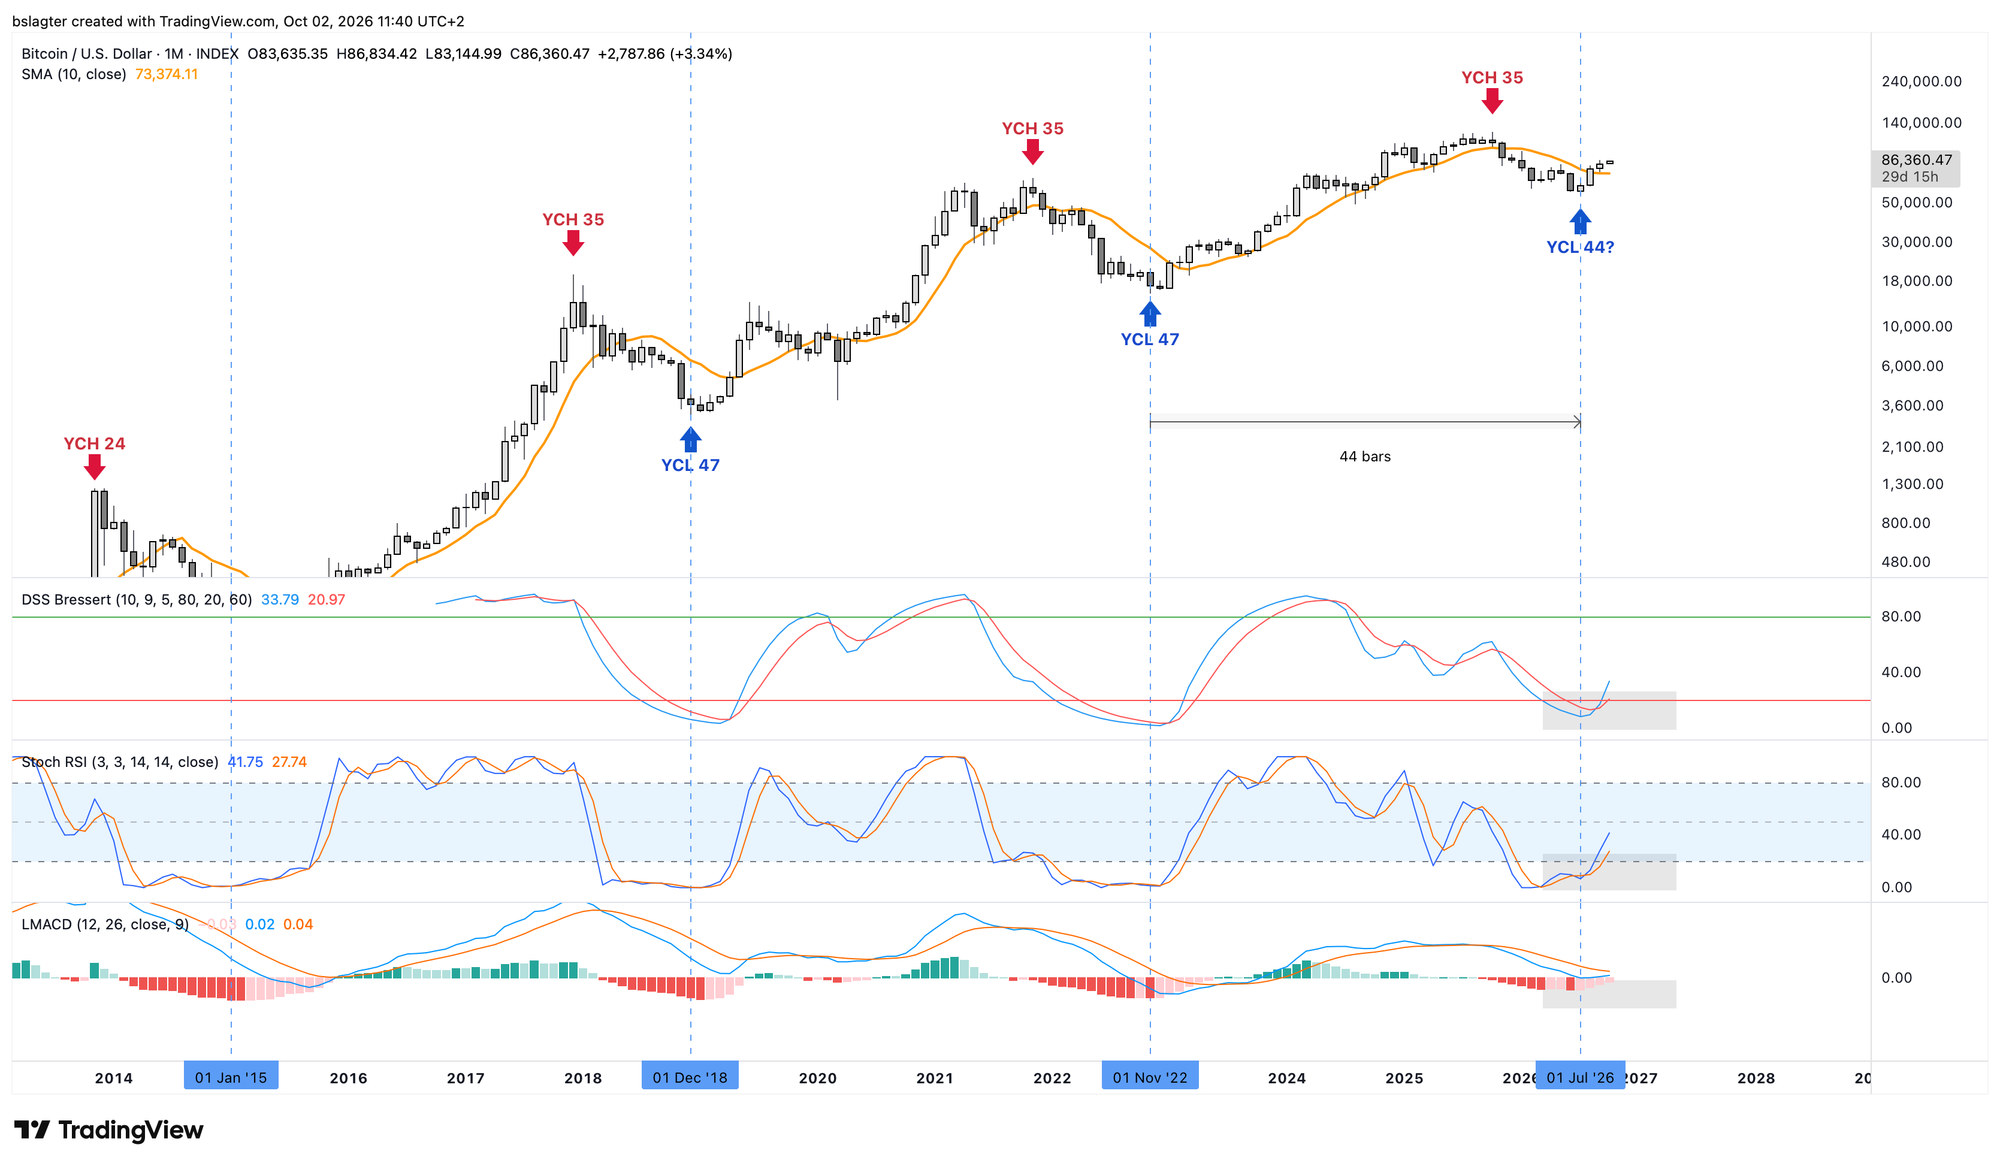
If July 1 really was the bottom of the bear market, then we have a yearly cycle low in month 44 of a cycle that has averaged 47 months over recent iterations.
Cycle analyst Bob Loukas links the relatively short and shallow cycle to a bull market that could well surprise on strength. That's not a conclusion that follows logically from the cycle analysis, but more his intuition:
With the Sept monthly close, the remaining confirming factors for a new Bitcoin Cycle are now in.
The slightly early Cycle Low (44 months vs 47), and lack of deeper move in June/July sets up a possibility of a Cycle that could well (upside) surprise. Versus say the diminishing return idea.
Another heuristic is that the next cycle after an early bottom often gets going a little more slowly. As if the market wants to get back into its original rhythm. One possible explanation is that it simply takes time to rebuild confidence after a year in which every rally was followed by a waterfall to the downside.
We'll see. Right now we know for certain that we've got two of the four boxes ticked:
✅ A weekly close above the 50-week moving average
✅ A higher high (HH) above the $83,000 of May 6
⏹️ A higher low (HL) above the $57,700 of July 1
⏹️ A directional change in that moving average from falling to rising
The next one is a higher low (HL) above the $57,700 of July 1. But this weekly cycle is still young; it could easily take a few more months before we dive into the next weekly cycle low (ICL). We also don't expect the moving average to change direction until after the turn of the year.
Until then, we watch with curiosity as the future unfolds. Beyond the crypto market, countless major forces are at play. The war in Iran, rising energy prices, rising inflation, rising bond yields, and ongoing doubt and concern about bubble formation in AI stocks.
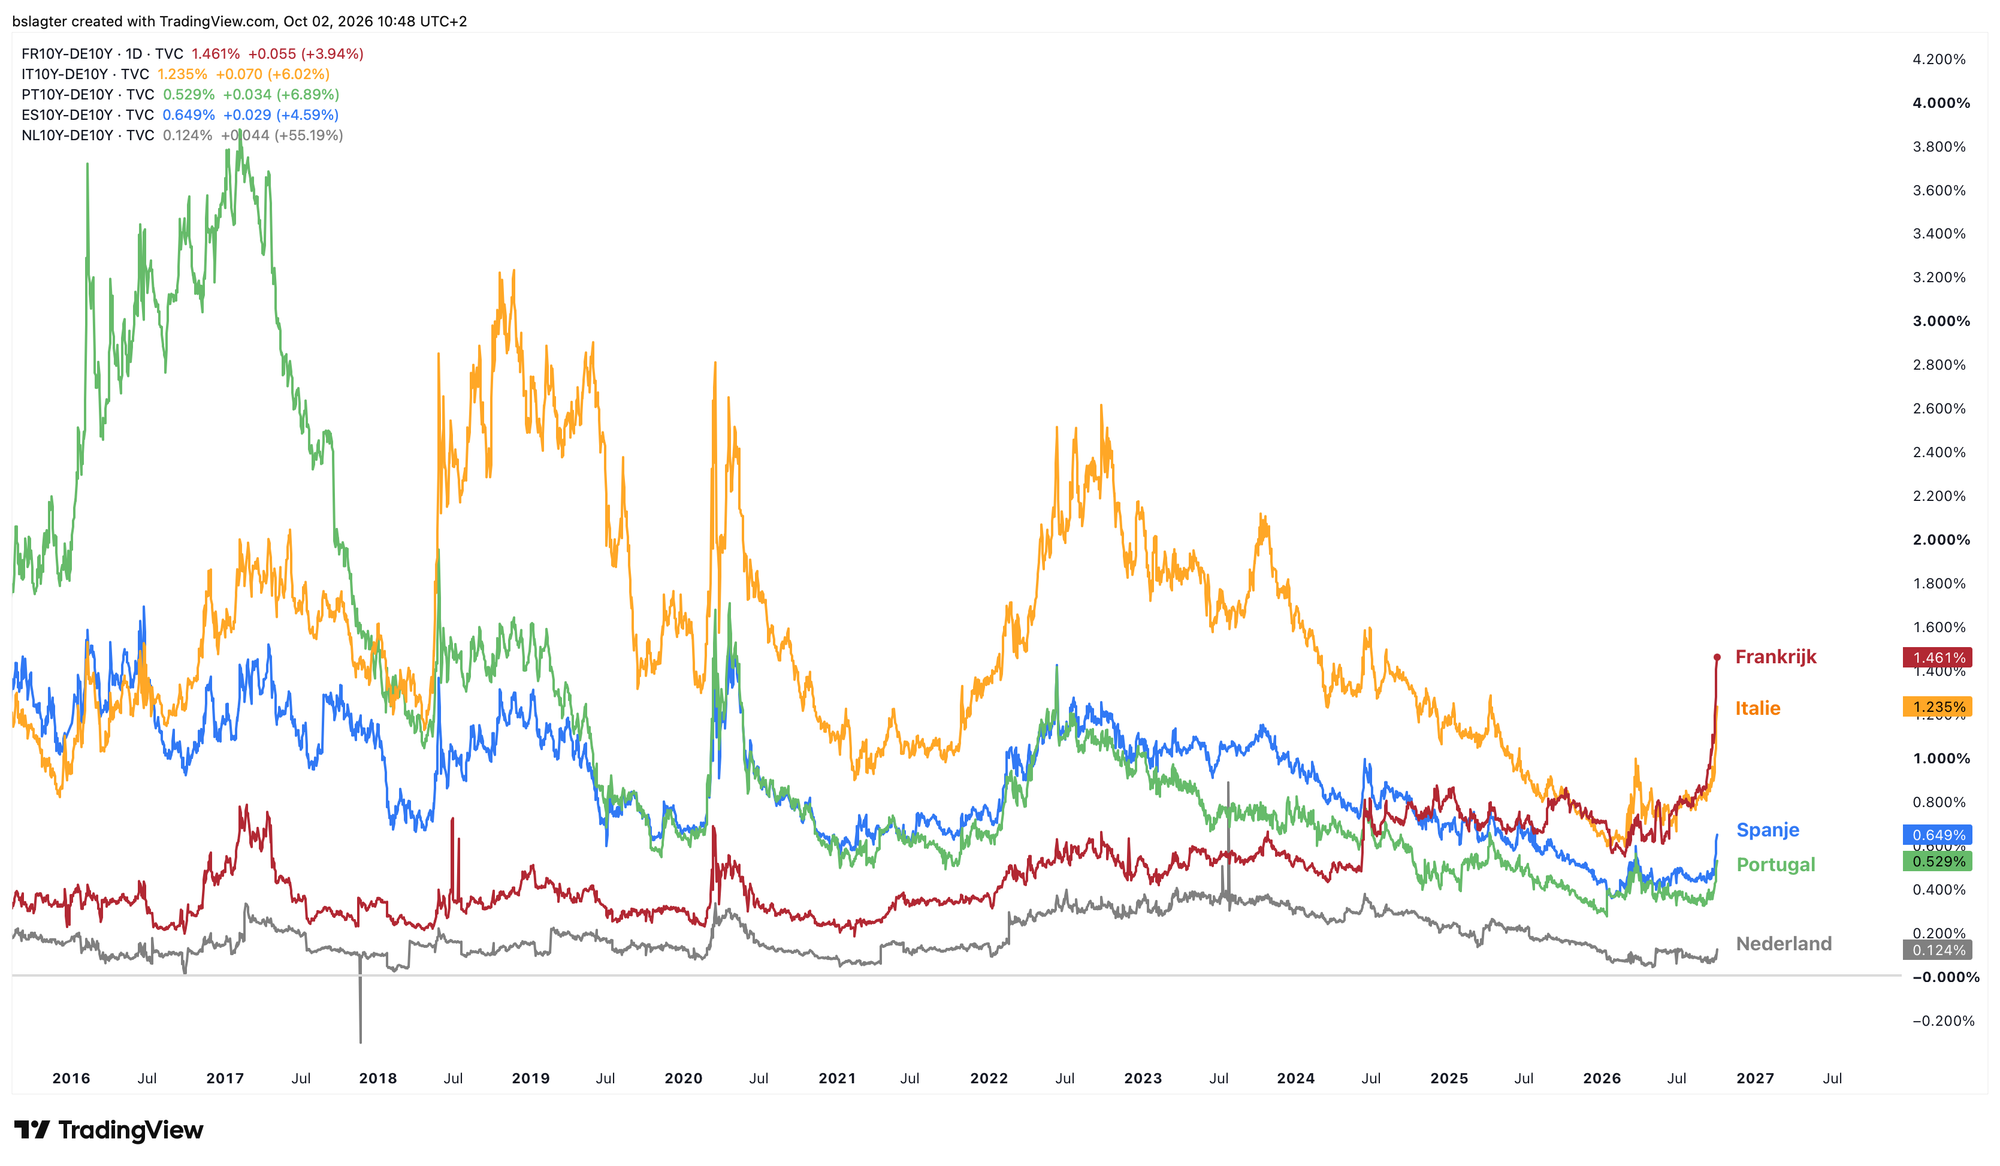
In Europe too, rising rates are raising eyebrows. Attention then turns to the weakest siblings in our monetary union, the southern countries. The premium on top of Germany's 10-year yield is used as a warning signal. The chart below shows the yield spreads for France, Italy, Portugal, and Spain.
In 2019 and 2022, Italy was the problem child. Before that, Portugal and Greece. Now France is in the spotlight. Its high national debt and political inability to cut spending are causing concern. But there's only one possible outcome: the ECB will step in.
The same goes for America, which in every respect matters more to financial markets than Europe. But intervention can only be justified once something has really gone wrong. It's a realistic scenario that stocks, bitcoin, and gold take a significant hit as a side effect of, for example, a crisis in the bond market or the banking system.
Our base case is that we're at the start of a new bull market. But exactly what that bull market will look like, nobody knows. On the scale of days, weeks, and months, external forces dominate. Only on the scale of years and decades do you see the market's own cycle and the secular movement behind it.
We continue with the following topics for our Alpha Plus members:
- Yearly, weekly & daily cycle
- External factors pose the biggest risk
- First cracks in the American economy
- First the sour, then the sweet
1️⃣ Yearly, weekly & daily cycle
 Contribution by
 Bert
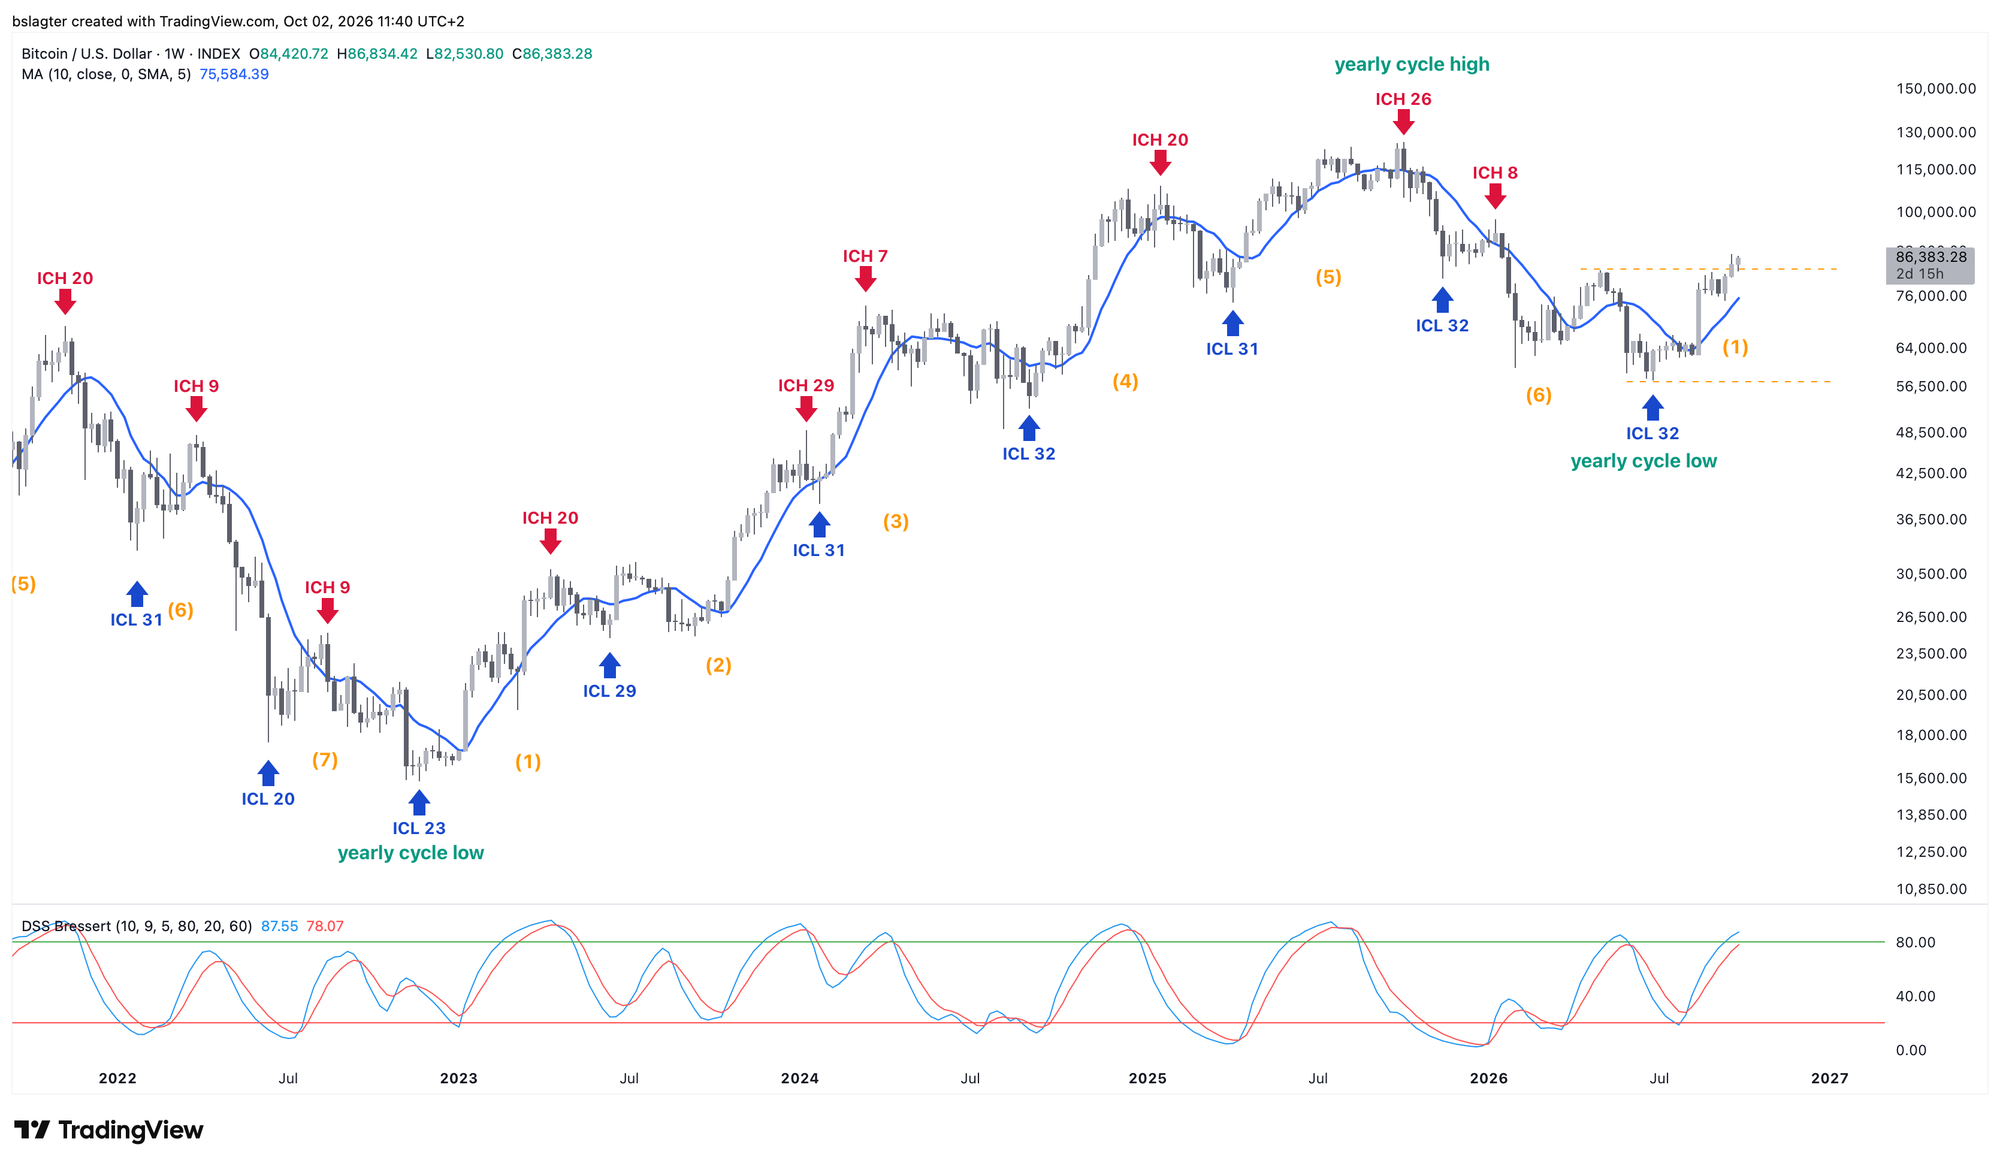
September's monthly close is a good reason to start with the yearly cycle, since that plays out on the monthly chart. Most signs point to the early beginning of a new yearly cycle, such as the continuation above the 10-month moving average and the rising movement of the oscillators at the bottom.
If we take July 1 as the starting point of this weekly cycle, we're now in week 13 of an average 31–32 weeks. That leaves us with a long stretch ahead, and we don't expect the next weekly cycle low (ICL) until January.
Even in a healthy, rising weekly cycle, a regular meeting with the 10-week moving average is normal. That's currently at $75,500 and rising by $2,000 a week. If we get a correction, a weekly close above that level would still fit with a continuation of the rising portion of this weekly cycle.
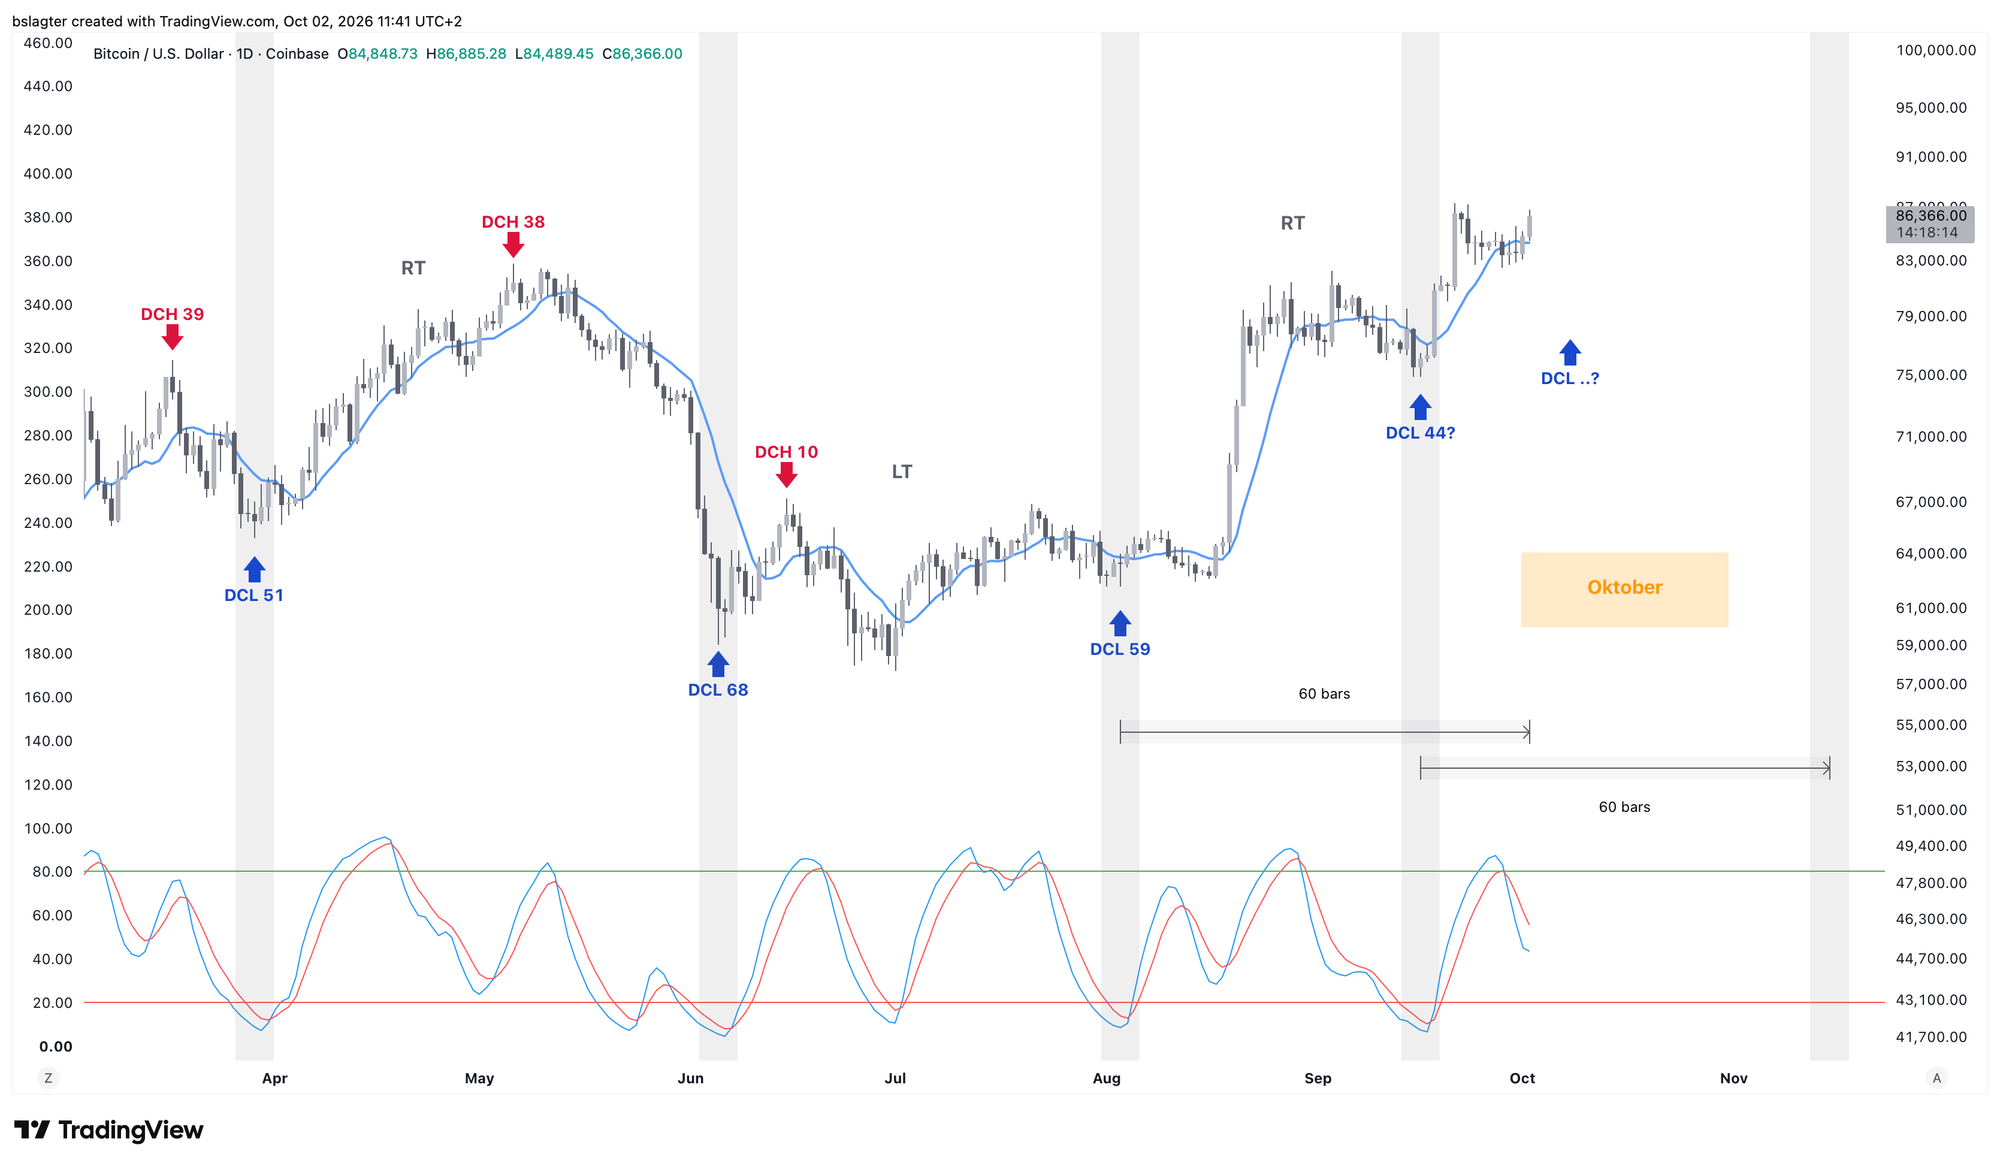
The daily cycle is a bit less clear. There's a case to be made for marking September 16 as the daily cycle low (DCL). But 44 days is awfully short for a daily cycle. Otherwise we'd now be on day 60 with no clear DCL on the chart. So we'll just have to wait and see how that unfolds over the coming weeks.
2️⃣ External factors pose the biggest risk
 Contribution by
 Sam
Let's start on a positive note. Bitcoin's recent weekly and monthly closes were both above $83,000. That means every timeframe from the daily chart up to the monthly chart is now bullish.
And given the circumstances, that's genuinely remarkable. Like gold, bitcoin pays no interest, and with a rising real yield, bonds become an increasingly attractive alternative with relatively little risk.
The real yield is measured by subtracting the inflation expectation over, say, 10 years from the yield you get on a bond with the same maturity. Right now rates are rising considerably, while inflation expectations remain fairly flat.
Below you can see how steeply the real yield is climbing, and there's a pretty clear negative correlation with the price of bitcoin. When the real yield falls, bitcoin moves up, and vice versa.
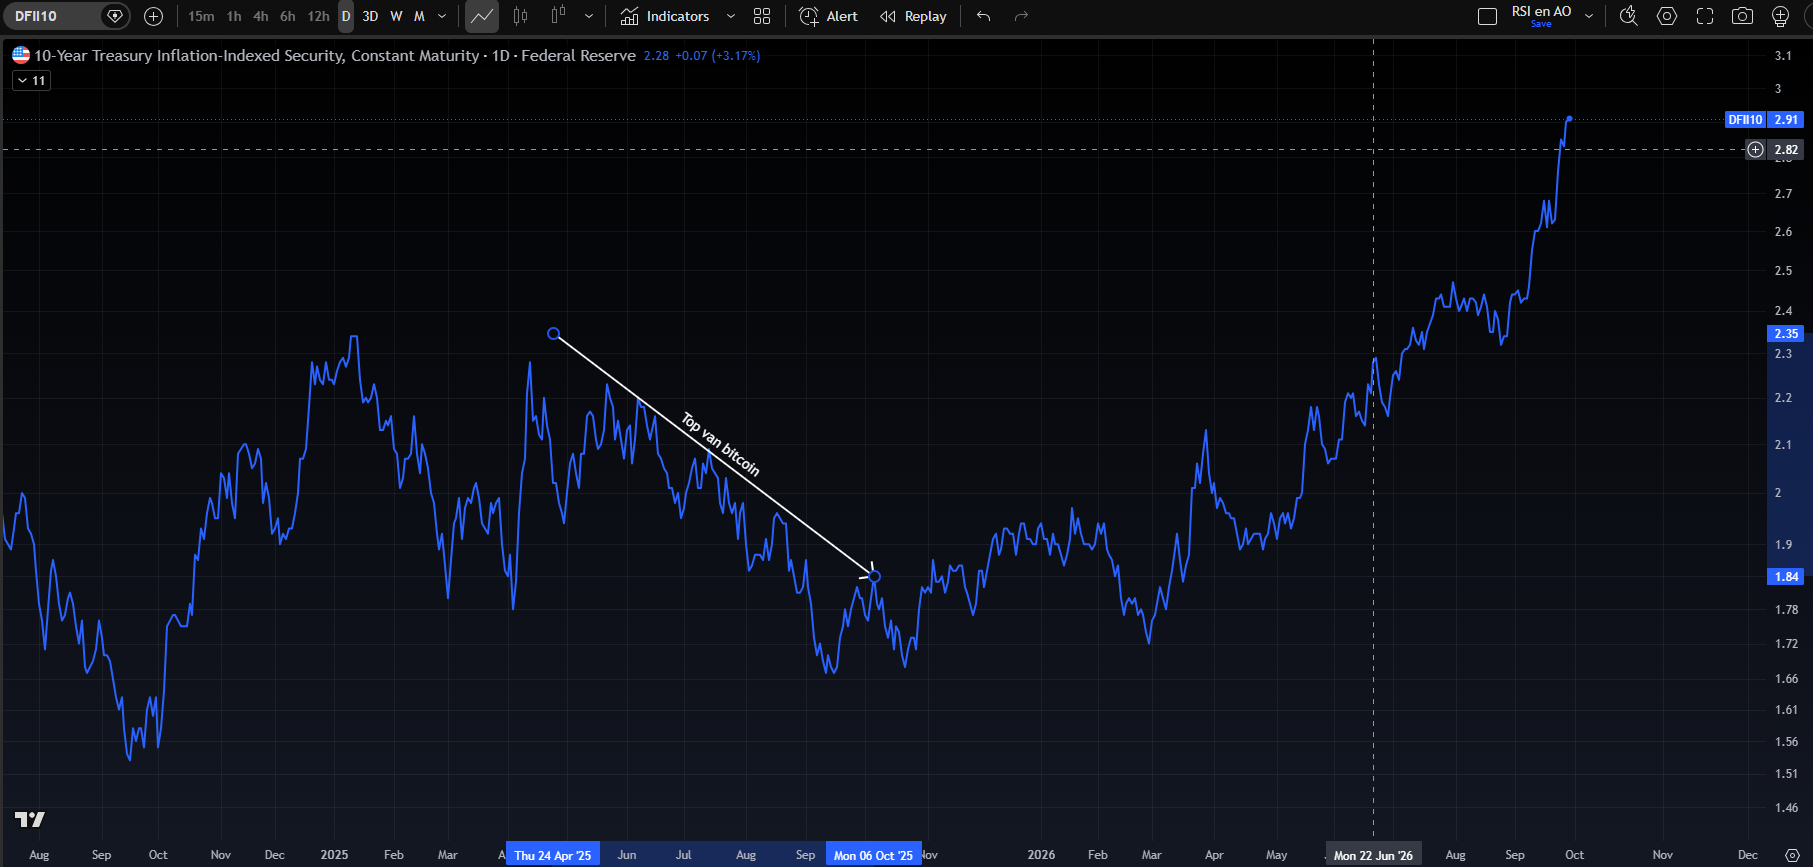
The fact that real yields are rising while bitcoin remains strong at the same time (especially compared to gold) suggests that one of them will turn around in the short term.
Partly because American rates are climbing so fast and the Federal Reserve may push through more rate hikes, the dollar is rising too. Since bitcoin is often measured in dollars, a rising dollar puts downward pressure on bitcoin's price.
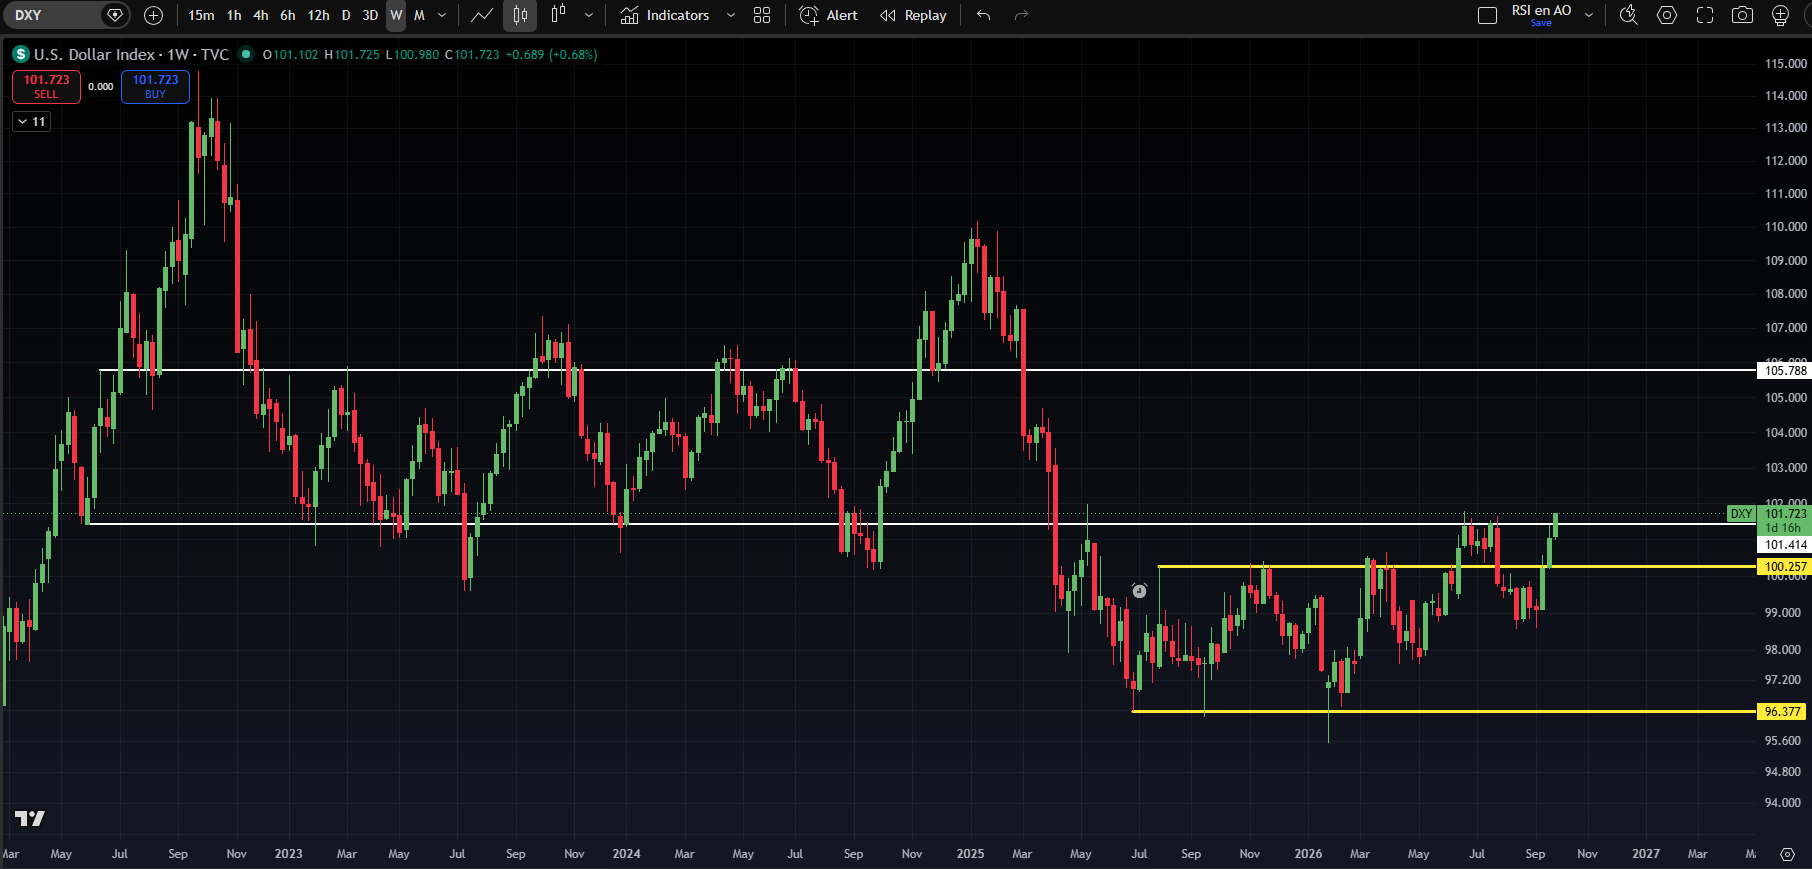
In summary, it's highly notable and a powerful signal that bitcoin has managed to post higher highs despite strong headwinds from the dollar and rates. It's therefore a very plausible scenario that if rates start to fall, due to government intervention for example, bitcoin makes a strong move to the upside.
With the US elections approaching, the timing for intervention would make sense. But the need doesn't seem to be there yet. The economy is simply doing just fine and the stock markets (one of Trump's showpieces) are close to their all-time highs.
Should bitcoin correct a bit more sharply in the coming weeks, then based on the charts, that would be an excellent opportunity to position ourselves for the upcoming bull market.
3️⃣ First cracks in the American economy
 Contribution by
 Thom
The American economy is still growing strongly, but clear divergences are emerging below the surface. While AI investments support growth, rate-sensitive parts of the economy are increasingly starting to struggle. That very fact could force the US central bank to be more cautious than the market currently expects, which would be positive for bitcoin.
This week we saw two signals of that. US consumer confidence fell to 81.9 points, the lowest level since 2014, while the number of job openings dropped back to 7.08 million.
On its own, that's no proof of a recession. Above all, it shows that the economy doesn't move as one single block.
The AI economy is still running at full speed: Big tech companies continue to invest hundreds of billions of dollars in data centers, chips, and energy infrastructure. As a result, a major part of corporate investment and economic growth remains strong.
Rate-sensitive sectors are feeling more and more pain: The housing market, construction sector, and parts of the consumer economy suffer far more from high financing costs. For these parts of the economy, the current rate level is already quite restrictive.
The US central bank hits the brakes: The central bank can't look only at strong economic growth or AI investments. Every additional rate hike also increases the pressure on sectors that are already weakening.
That may explain why John Williams, vice chair of the US central bank's rate committee, declared this week that there's no rush for further rate hikes.
That's relevant because financial markets are currently still pricing in roughly 78 basis points of rate hikes through the end of 2027. That amounts to a little over three standard hikes of 0.25 percentage points. And the US central bank isn't the only one the market is counting on for a series of rate hikes.
This is a worldwide phenomenon, as the image below shows.
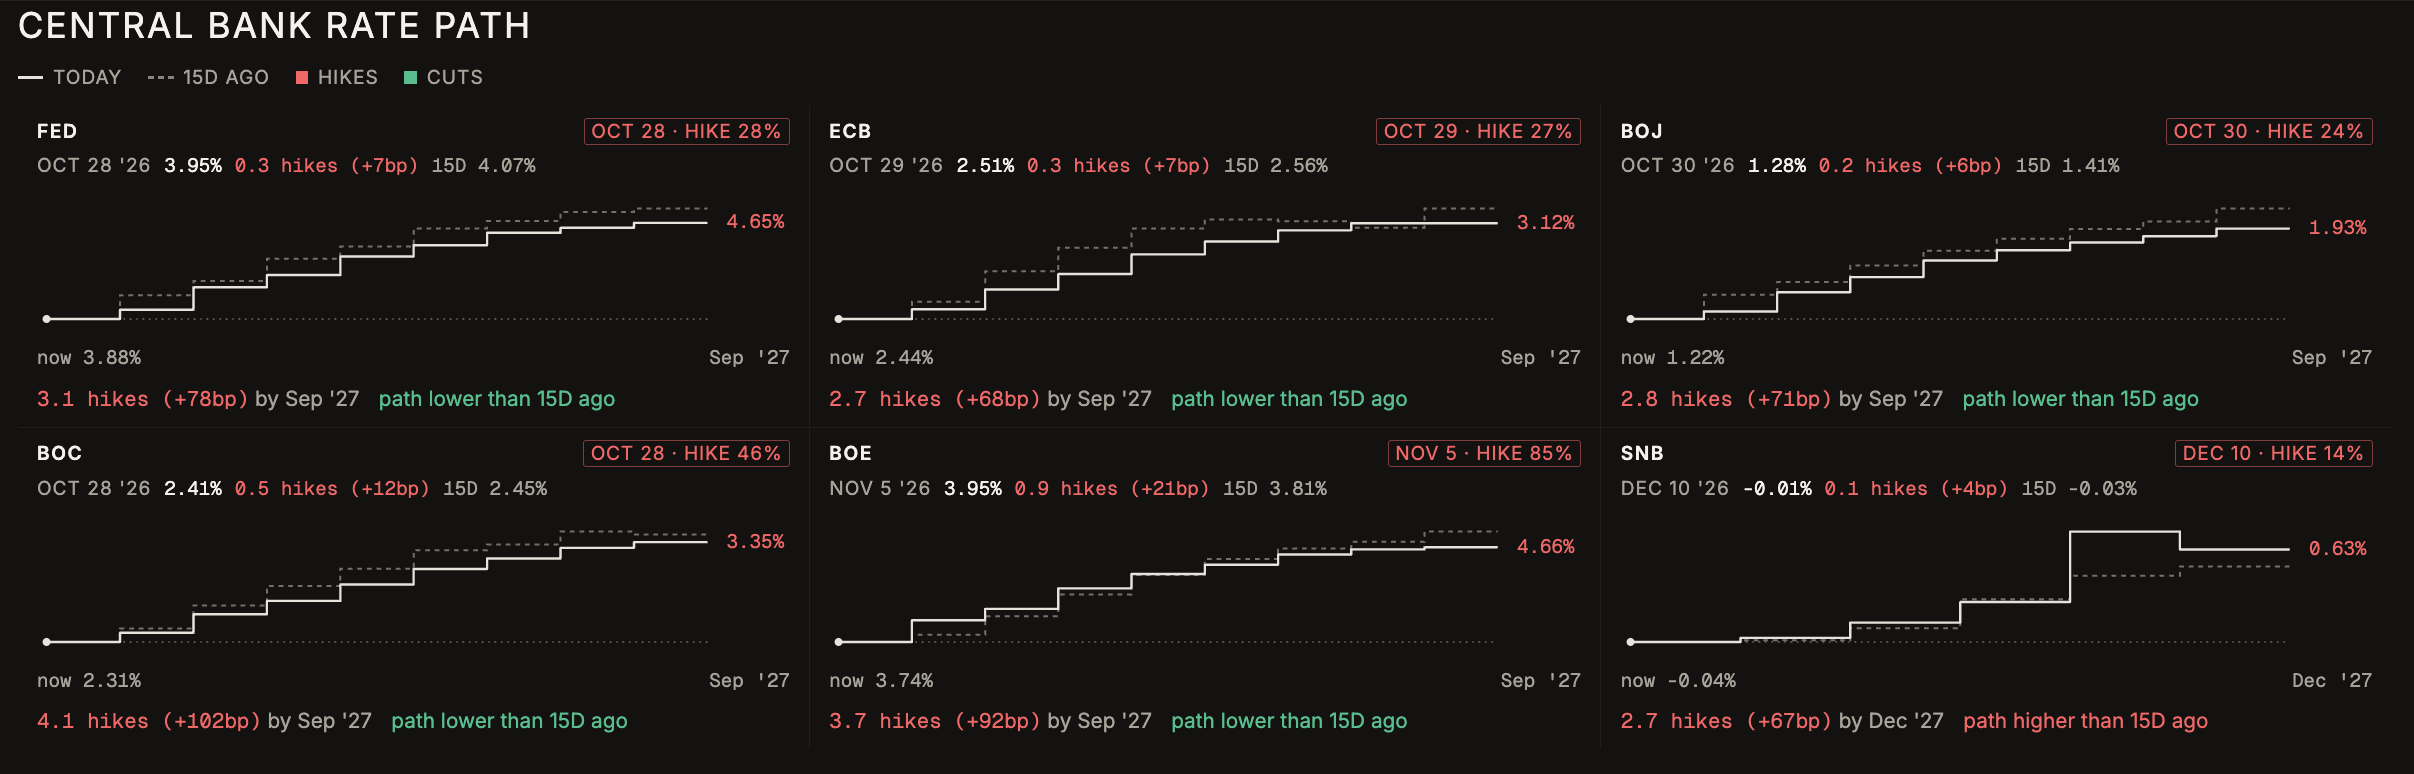
I have a feeling the market is considerably overestimating the room for rate hikes worldwide.
On top of that comes the oil price. Oil exports from the Gulf region are reportedly back at roughly 2025 levels. If the oil price falls further as a result, it also reduces a key source of inflationary pressure. That gives central banks even more room to turn cautious.
The strong AI economy can handle high rates, but weaker rate-sensitive sectors cannot. If bond yields keep climbing at this pace, I expect there will come a point where central banks have to step in with support sooner than they can tighten any further.
For bitcoin, that creates an interesting situation. In the short term, the storm will hit bitcoin too, but in the long term the digital coin, together with gold, actually looks like a very good hedge for this situation.
4️⃣ First the sour, then the sweet
Contribution by Thom
More and more big names from the traditional financial world are starting to speak out about rising bond yields. This time it was Michael Hartnett of Bank of America who weighed in. He argues that rising bond yields are now the biggest risk to the stock market's bull run.
For bitcoin, this creates a strange paradox. Higher long-term rates are negative in the short term, but over time they can actually trigger a policy response from governments and central banks that gives bitcoin wings.
According to Hartnett, the question isn't just how high rates can rise, but above all when that rise causes something to start breaking.
The backdrop against which rates are rising appears structural in nature. Large budget deficits, deglobalization, geopolitical tension, and stubborn inflation mean governments have to issue a lot of debt paper, causing the market to demand a higher premium to finance that debt.
For bitcoin, that produces the following situation:
- Higher rates draw liquidity away: US government bonds yield more. Credit becomes more expensive and financial conditions tighten. As a result, in theory, investors become increasingly unwilling to take risk. Bitcoin is highly sensitive to credit conditions and should in principle face headwinds from this situation. That makes it all the more striking that bitcoin has held up so well over the past period, and even posted a hefty rise.
- High rates then start to hit balance sheets: companies have to refinance at the higher rates, real estate comes under pressure, and the US government too sees its interest costs climb. The longer rates stay high, the greater the chance that a serious credit problem emerges somewhere.
- An unstable bond market: ultimately the bond market itself can become unstable. For that, Hartnett watches the MOVE index, which measures volatility on US government bonds. A rapid rise in it is dangerous, because these government bonds form the most important collateral within the global financial system. More volatility means they're worth less as collateral.
That last point is crucial. A gradual rise in the 10-year yield is something the market can still absorb. A rapid and volatile rise can put pressure on credit markets, collateral valuations, and leveraged positions. And in theory, that could cause a serious financial storm.
But that's where the interesting part for bitcoin begins. While the US central bank can steer short-term rates reasonably well, it has less control over the 10- and 30-year yields. Those are determined mainly by the market, and the extra risks for which investors want to be compensated.
If long-term rates climb too far, policymakers may be forced into measures such as rate cuts, stopping quantitative tightening, new liquidity facilities, or other forms of support for the bond market.
Hartnett uses a well-known quote for this: "Markets stop panicking when policymakers start panicking."
For bitcoin, that could be the moment the regime flips and a flight to scarcity begins. A strong policy response from the US central bank to suppress long-term rates can cause three things.
- Falling real yields.
- More doubt about monetary and fiscal discipline.
- And of course a weaker US dollar.
So the bond market currently poses the biggest threat to bitcoin, but it can ultimately become the trigger for the next bull market too. The question, then, is at what point policymakers have to intervene. That's hard to predict, however, because these are things that tend to happen quite suddenly.
Just look up the MOVE index on TradingView. You'll see that the real spikes often came incredibly fast and pretty much out of nowhere.
Finally
You can revisit all previous editions of Alpha Markets in the archive. Questions, comments, and suggestions are more than welcome in the community.
Thank you for reading!
To stay informed about the latest market developments and insights, follow our team members on X:
- Bart Mol (@Bart_Mol)
- Peter Slagter (@pesla)
- Bert Slagter (@bslagter)
- Mike Lelieveld (@mlelieveld)
We appreciate your continued support and look forward to bringing you more comprehensive analysis in our next edition.
Until then!