
Aggressive Fed Puts Markets Under Pressure
Bitcoin crashed below $62,000, but it didn't fall alone. Stocks, gold and silver bled too as a hawkish Fed puts every risk asset on edge. Is this capitulation the bottom, or the start of a brutal winter?

 Contribution by
Bert
We removed a dose of accommodation so that financial and credit conditions would be more consistent with our ultimate objectives.
— Kevin Warsh, 16 September 2026
When he took office, new Fed Chair Kevin Warsh made it clear from day one that he would do things completely differently. Investors and traders know far better, and far more precisely, what is needed than a committee of grey-haired men. So he would talk less and listen to the market more. Out with forward guidance: no more trying to steer prices with words. Instead, the Fed would listen to what prices have to say.
He wanted to end the “hall of mirrors” in which the Fed and the market were trapped. Investors look to the Fed to form their expectations, and the Fed then uses those same expectations to assess the economy. The result is a circular information loop.
It's an excellent idea. When push came to shove, the bond market was always in charge. Warsh is simply acknowledging reality.
But then you actually have to follow through.
On Wednesday 18 November, Fed Governor Chris Waller stepped up to the mic on business network CNBC. Inflation is rising, he said, so the Fed needs to be more aggressive. That means either a jumbo hike of 50 bps in December, or a 25 bps hike with a promise of another 25 bps in January.
Waller throws a spanner in the works in three ways. First, he is shaping market expectations after all. Second, he is effectively arguing for a return of forward guidance. And finally, he is judging inflation through the rear-view mirror.
It's not the first time, and he's not alone. Between 10 and 19 November, nine different Fed officials used speeches and interviews to argue for further hikes in December. Bloomberg described it as “a blitz of speeches and interviews” with which the Fed locked in a December rate hike.
The chart below neatly shows how the market is ‘making room’ for a policy rate hike by pushing 3- and 6-month rates higher in advance.
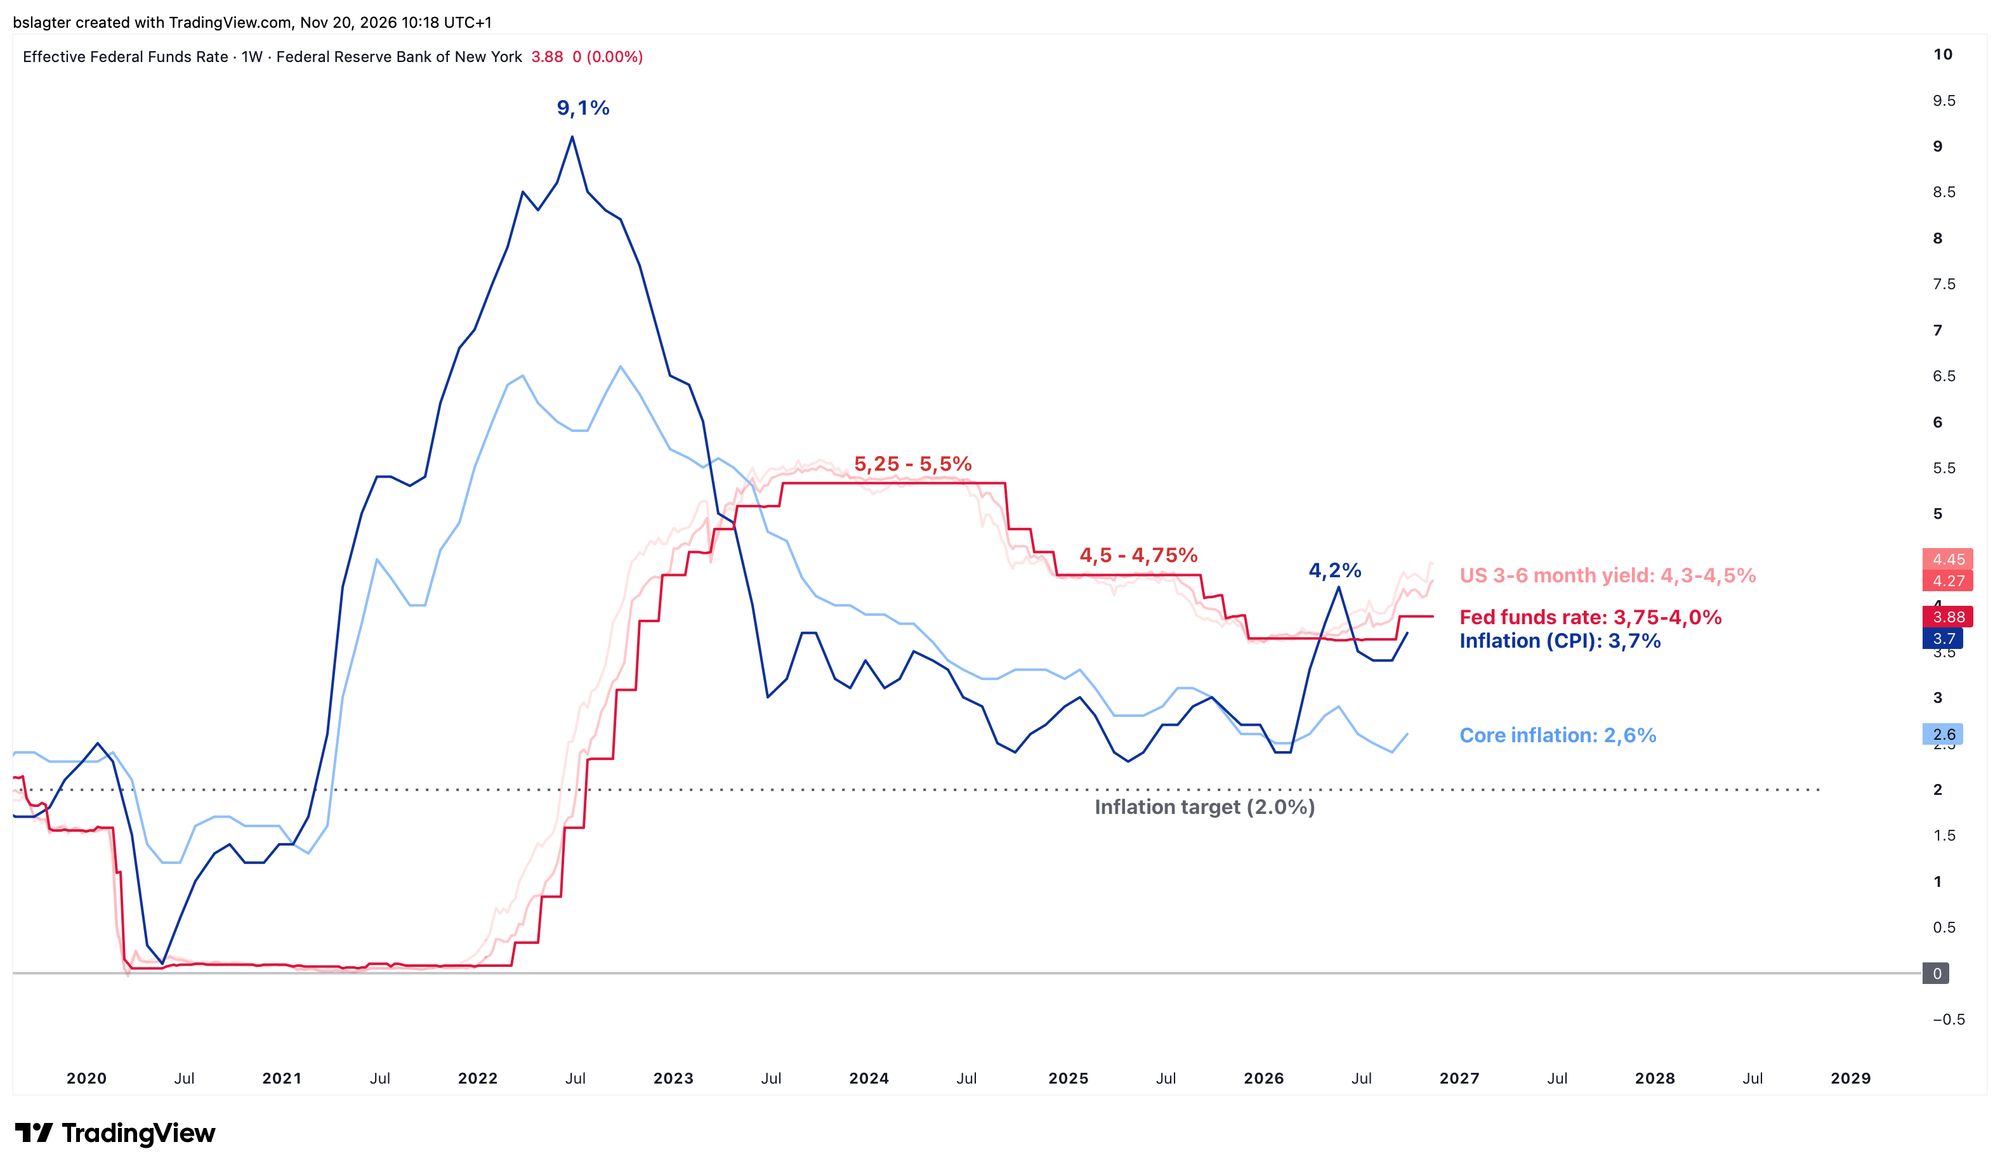
The big question is whether tightening the screws is the right move right now. There's a lot to be said for restraint, for three reasons.
First, there's the yardstick used to measure inflation. CPI and PCE are backward-looking: they capture how pricier energy, commodities and chips hit the economy after a long journey through the supply chain. Look ahead, and you see that many of those price increases will drop out of the year-on-year figures in the coming months.
The rollback of import tariffs will trickle into the data over the coming period. February marks one year since oil prices exploded due to the war in Iran. And memory chip prices have started to fall, with some types already 30% below their peak.
A second variable is the state of the economy. According to the Fed, the economy is strong and the labour market is in excellent shape. Yet plenty of data give reason to question that, at the very least. On average, things may look decent enough. But that average masks the fact that large parts of the economy are creaking and groaning.
The prospect of higher rates certainly doesn't help. Mortgages, business loans, credit cards and car loans all become more expensive immediately. Consumer confidence, already fragile, comes under even more pressure.
But isn't that exactly what the Fed is after? Inflict some pain on the economy so that demand cools and inflation falls back to the 2% target?
True, but you can only get away with that when the economy is firing on all cylinders and inflation is the result of overheating. Do it when the economy is already struggling, and the collateral damage is severe.
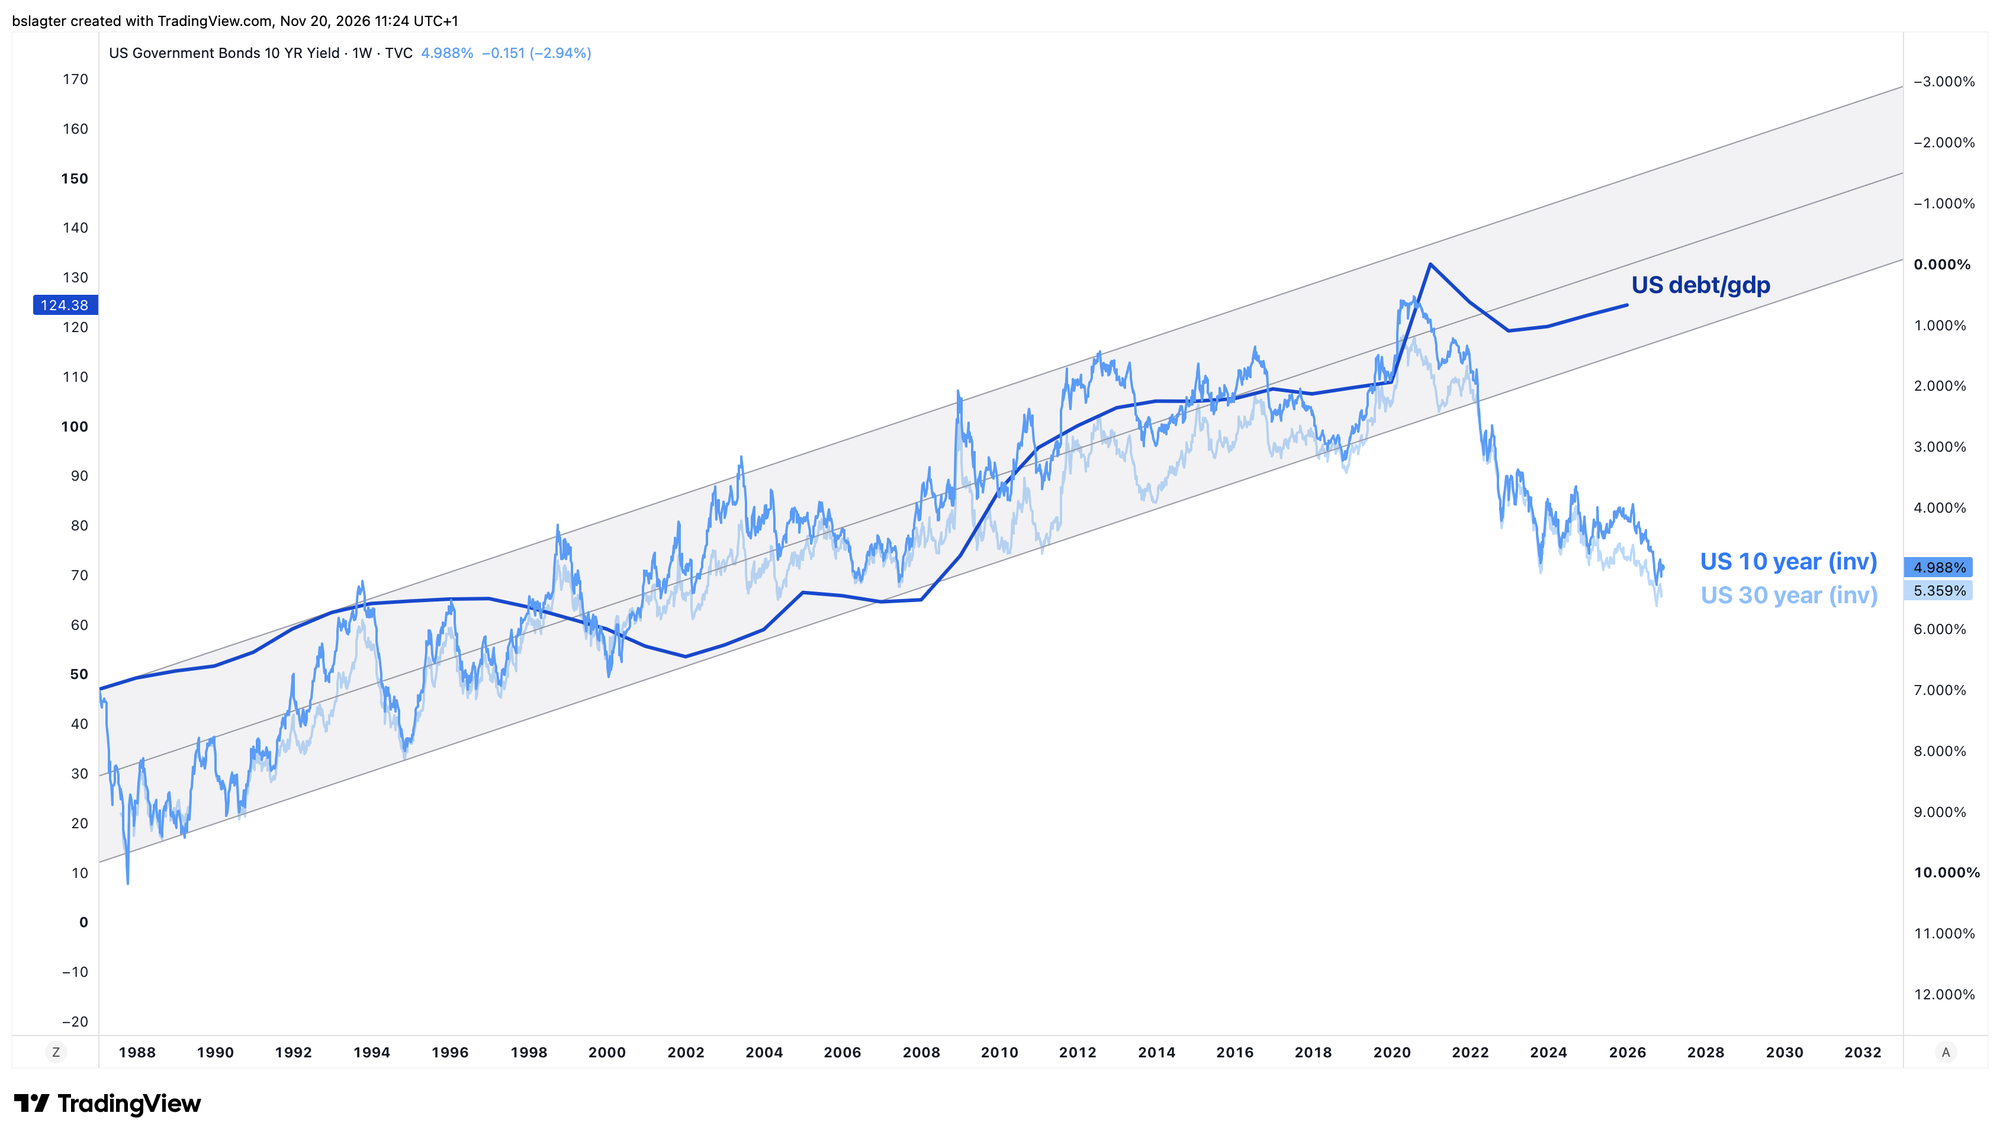
A third angle is whether 2% is even a realistic target. We're in a different regime from the 40 years between 1980 and 2020. The pendulum is swinging the other way: towards less globalisation and more strategic autonomy in commodities, energy and defence. On top of that, AI is claiming a share of production capacity. Perhaps we need to accept higher average inflation for a while.
The ‘AI trade’ kept spirits up in recent years. First it ran through the Magnificent Seven (Google, Amazon, Apple, Meta, Microsoft, Nvidia and Tesla). Later it moved to the companies building AI infrastructure, including the chipmakers.
Over the course of this year, we've reached the stage where trillions of dollars' worth of plans actually have to be executed. That's when you run into the friction and messiness of the physical world: permits, grid connections, construction projects, protests from local residents, scaling up production, and matching supply with demand.
For more than six months now, worry and doubt have dominated among tech investors. The Nasdaq 100 is back at the levels of April 2026, January 2026 and October 2025. Nvidia is 40% below its peak, back at the levels of June 2025 and Q4 2024.
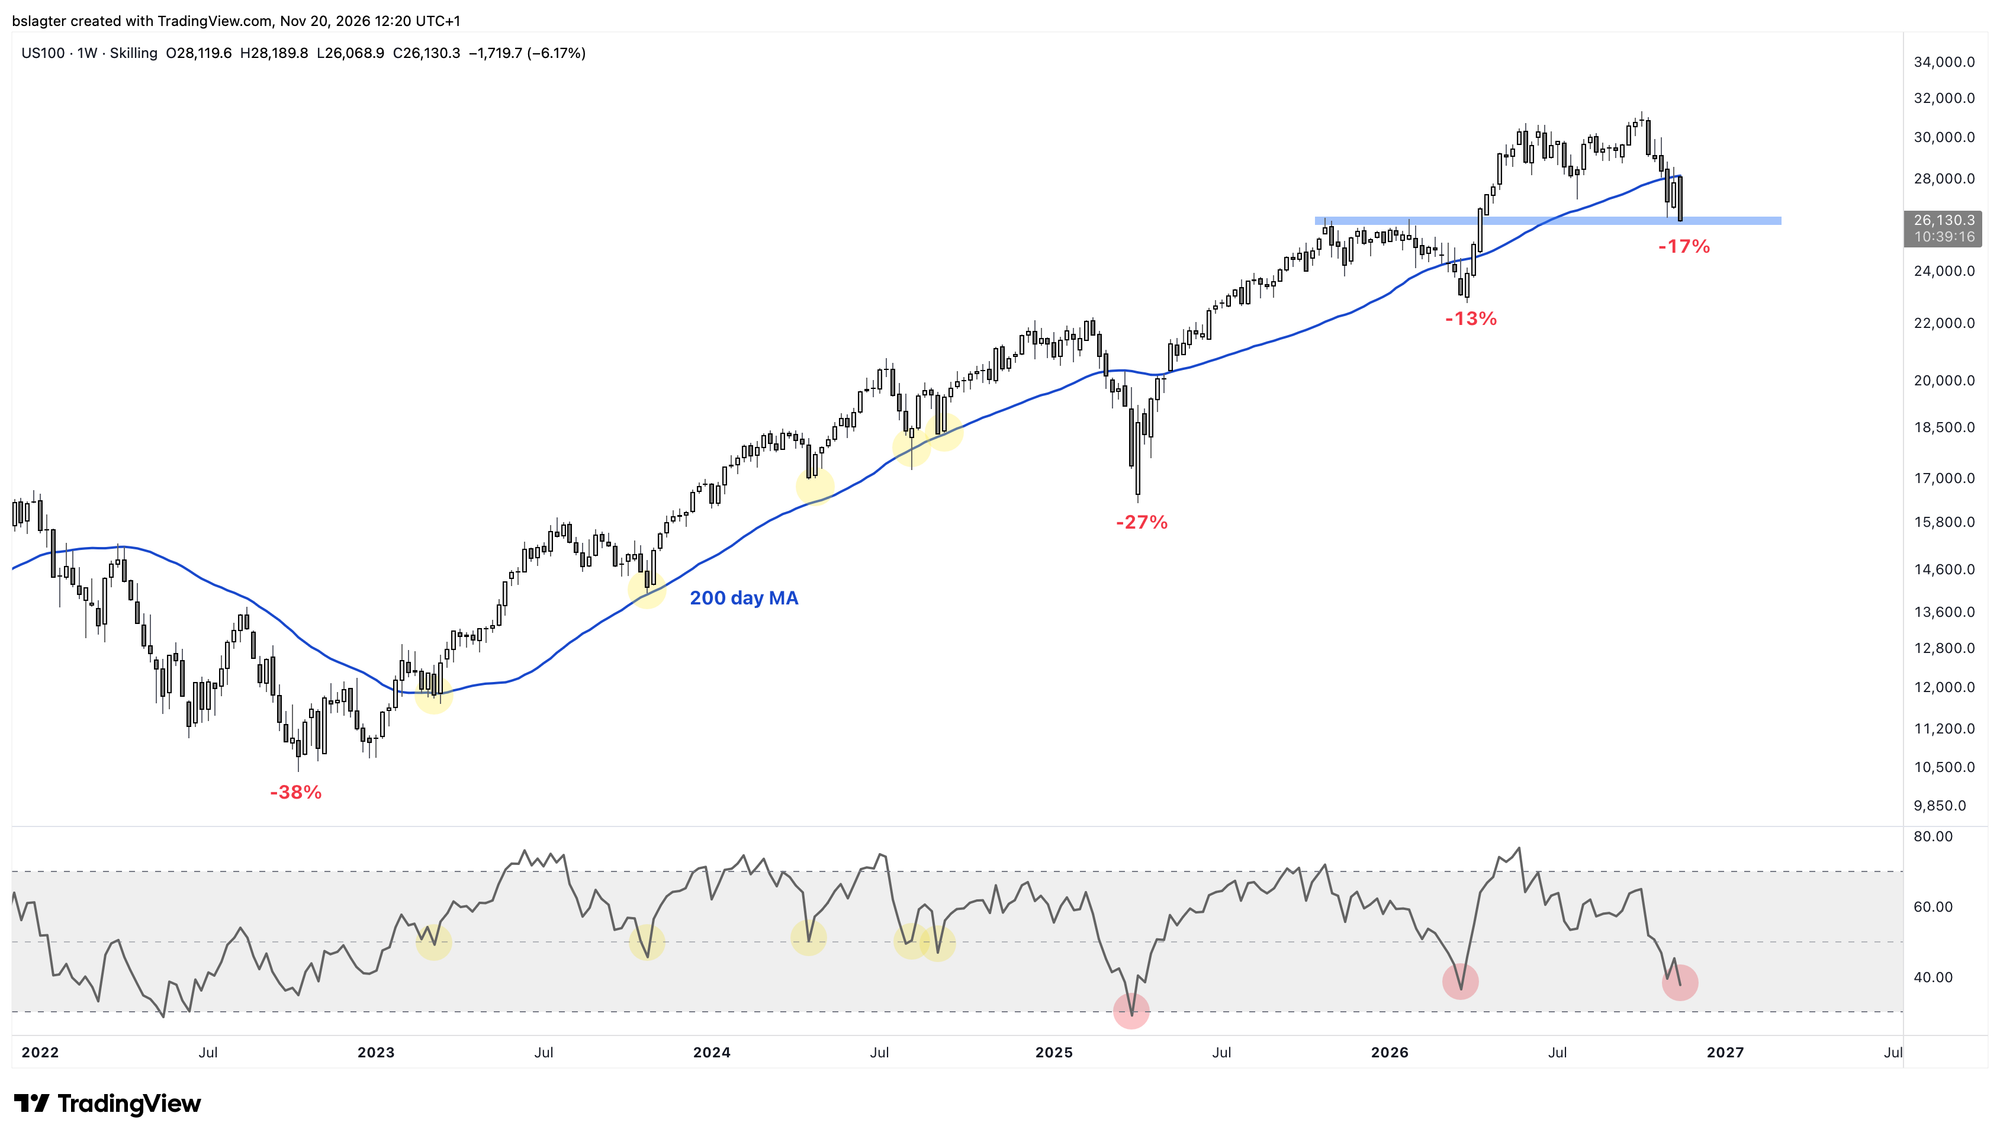
Tech stock valuations are at their lowest point since the COVID crisis, wrote The Kobeissi Letter.
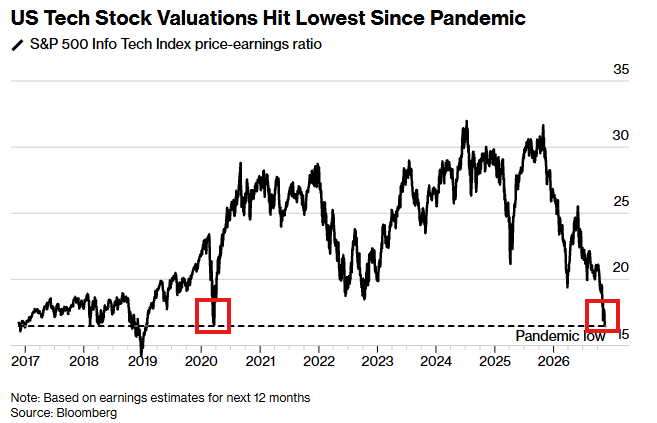
The chart above shows the ratio between the total market value of the companies in the S&P 500 Info Tech index and the earnings they're expected to generate over the next twelve months. A low P/E can mean the stocks are cheap. It can also mean earnings have been overestimated and will disappoint later on.
The market fears it's the latter. The bubble has burst, you hear almost everywhere, complete with a fitting front cover of The Economist.
Let's look at whether that fear is justified, and what it means for stocks, gold and bitcoin.
First, we need to understand that two things can be true at the same time: (1) demand for AI will grow enormously in the coming years, and (2) some of the companies currently in the AI trade are heavily overvalued.
I expect the pace at which AI capabilities improve to hold up over the coming year, or even accelerate. The translation into productivity and economic growth is much slower. Still, I think we'll see the first concrete evidence of that in 2027 as well.
I also think households and businesses will spend far more on AI in the coming years. AI revenues at OpenAI, Anthropic, SpaceX, Google, Meta and Microsoft should rise sharply as a result.
I don't believe “the bubble” is bursting now. Nor do I think we're at the start of a 90-95% price collapse for the big AI players, like the one Amazon and Cisco suffered after the dot-com bubble popped.
At the same time, it's quite conceivable that we'll have to go through a correction, or even a (cyclical) bear market, in the coming months. The reshuffling of the AI market plays a part. But that could just as well have been absorbed through a long consolidation.
The deciding factor is Fed policy.
As the ‘AI trade’ stalls, a source of income also dries up for the many Americans who invest. Sentiment takes a nosedive. And right at this moment, an aggressively tightening central bank piles on top. That's the story we started with today.
Tighter ‘financial conditions’ have been weighing on risk assets for a few months now. In recent weeks, this has escalated into liquidity that is simply too tight.
Across stocks, precious metals and crypto, we're seeing the same pattern of accelerating declines at the same time. Investors need dollars, so they're selling indiscriminately, without the patience to wait for a better moment.
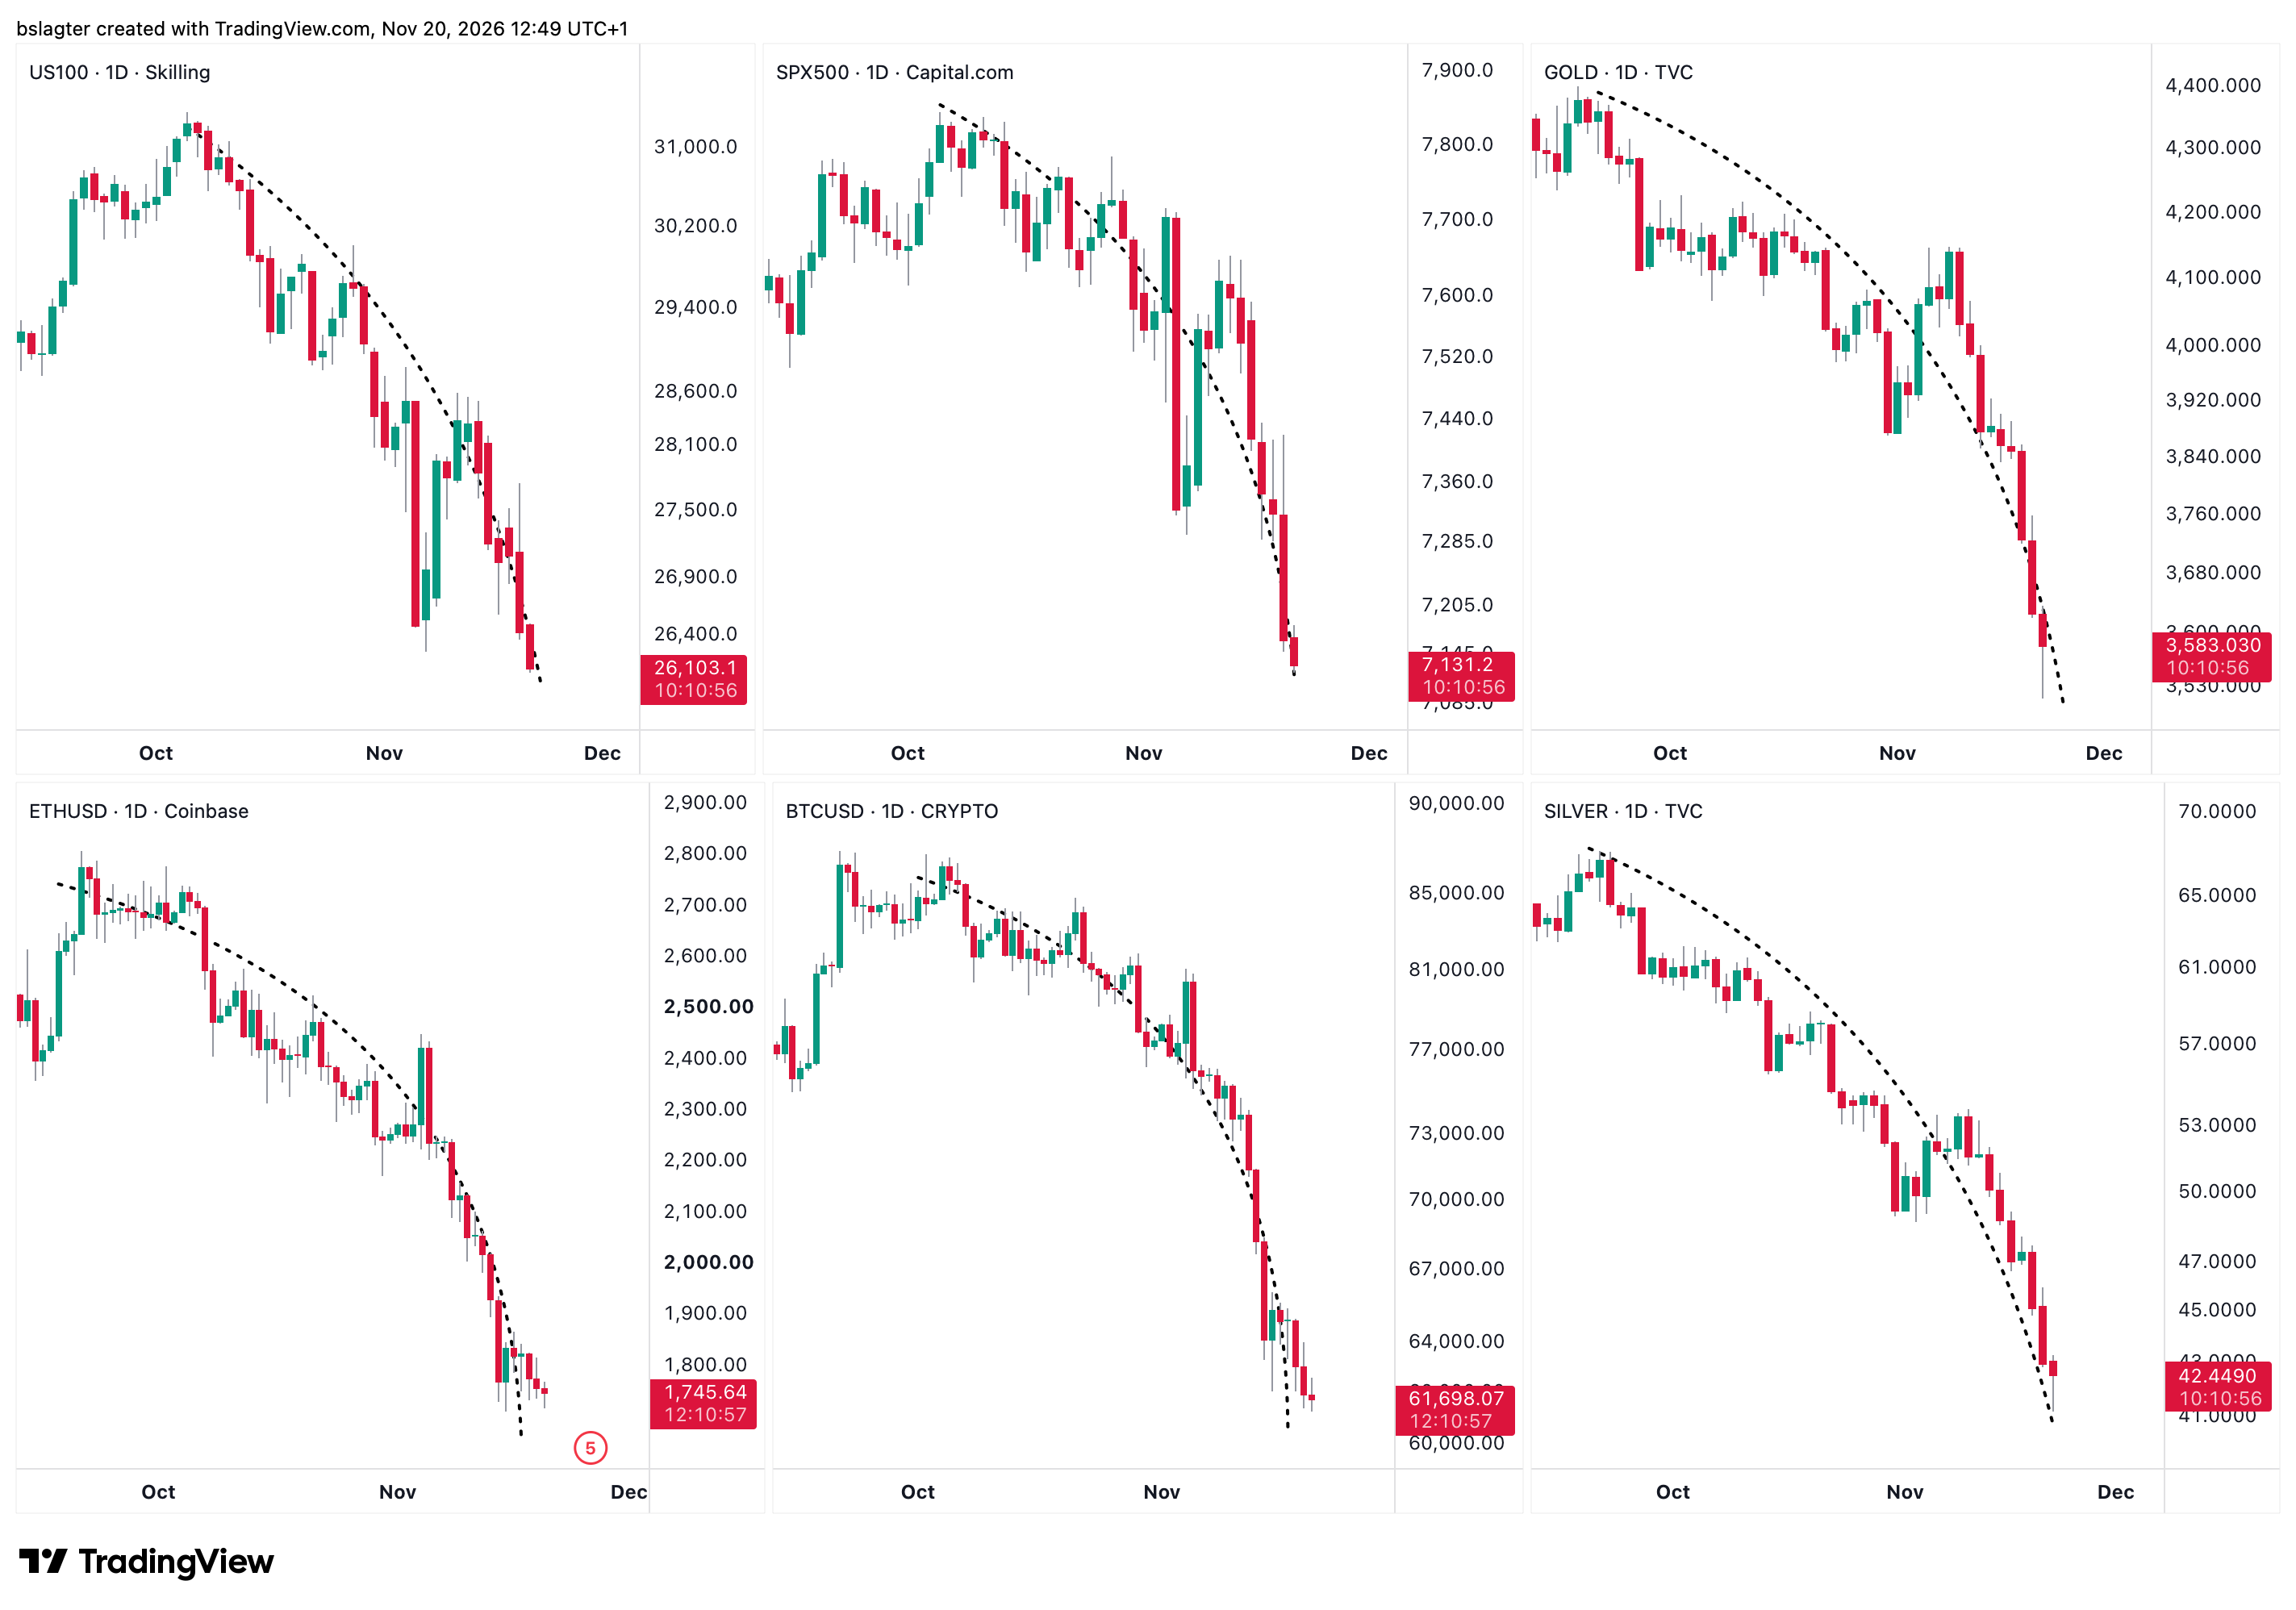
We need to allow for the scenario that a few tough months lie ahead. In that case, this won't stop at a brief correction. The harsh macroeconomic climate would instead create strong headwinds for risk assets.
The impact differs from asset to asset:
- Stocks set new all-time highs only recently. They still have plenty of room to fall.
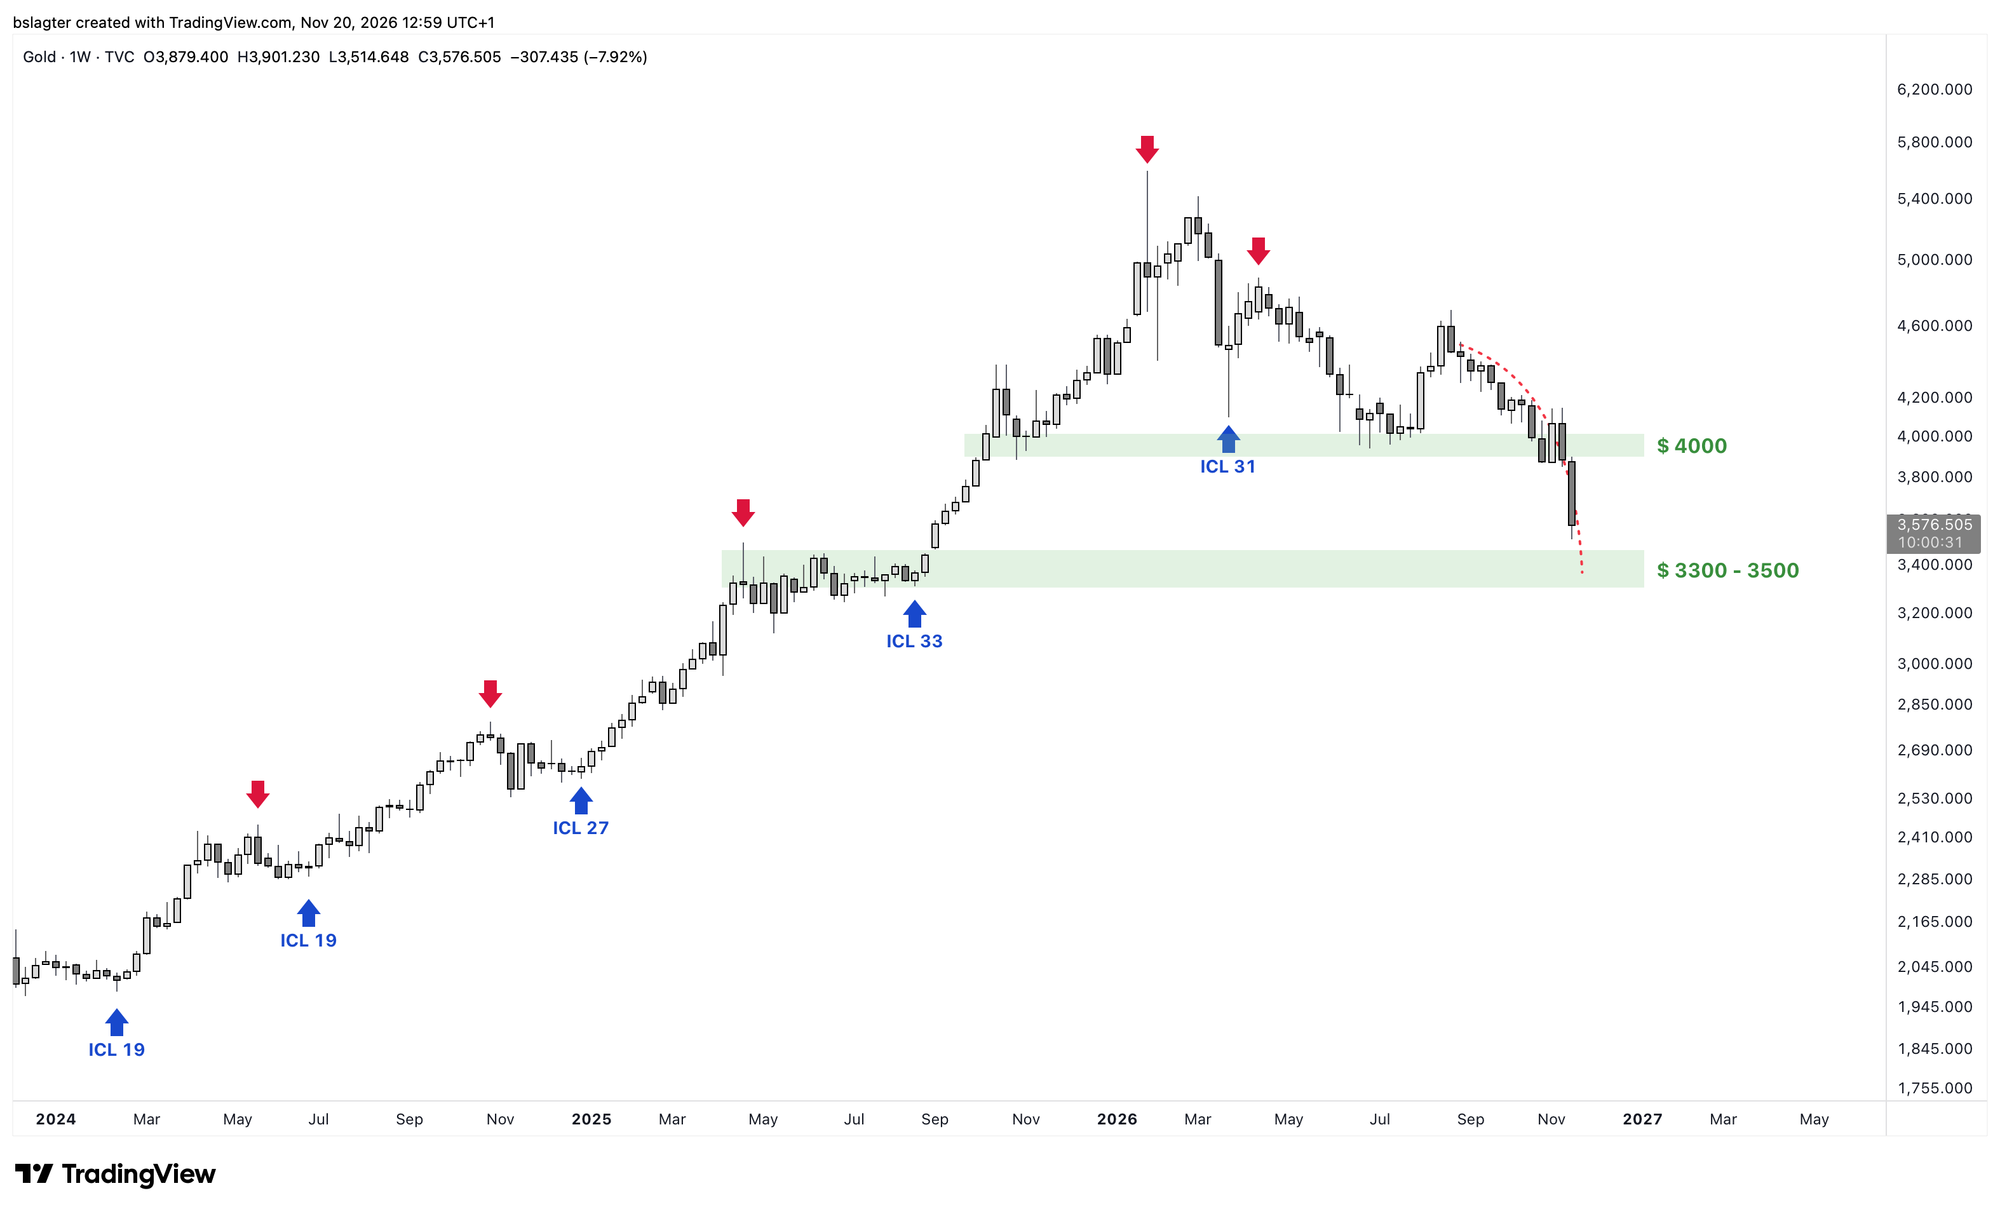
- Gold and silver peaked in January 2026 and have already worked through a large part of the correction. For gold, a price around $3,500 could be an attractive entry point for the next leg of the bull market in the coming years.
- Bitcoin peaked in October 2025 and, judging by the rhythm of the market cycle, is actually due for a new bull market. It stands to reason that bitcoin will bottom first.
The first quarter of 2027 is a logical window for major bottoms. Inflation will come down, mainly because of the year-on-year effects we described earlier. The Fed will nonetheless hold that up as proof that its intervention worked. That gives it room to take its foot off the brake.
We continue with the following topics for our Alpha Plus members:
- Bitcoin's fourth capitulation
- Scenarios and probabilities
- Bullish for the long term
- Another long sideways stretch ahead?
1️⃣ Bitcoin's fourth capitulation
Contribution by Bert
Last week I wrote:
A fourth capitulation could well be in the making. [..] There isn't enough evidence yet for a typical capitulation, even though sentiment is pretty grim.
By now, we can safely call it a capitulation. The decline kept accelerating, with long streaks of red candles and very low readings on momentum indicators such as the RSI.
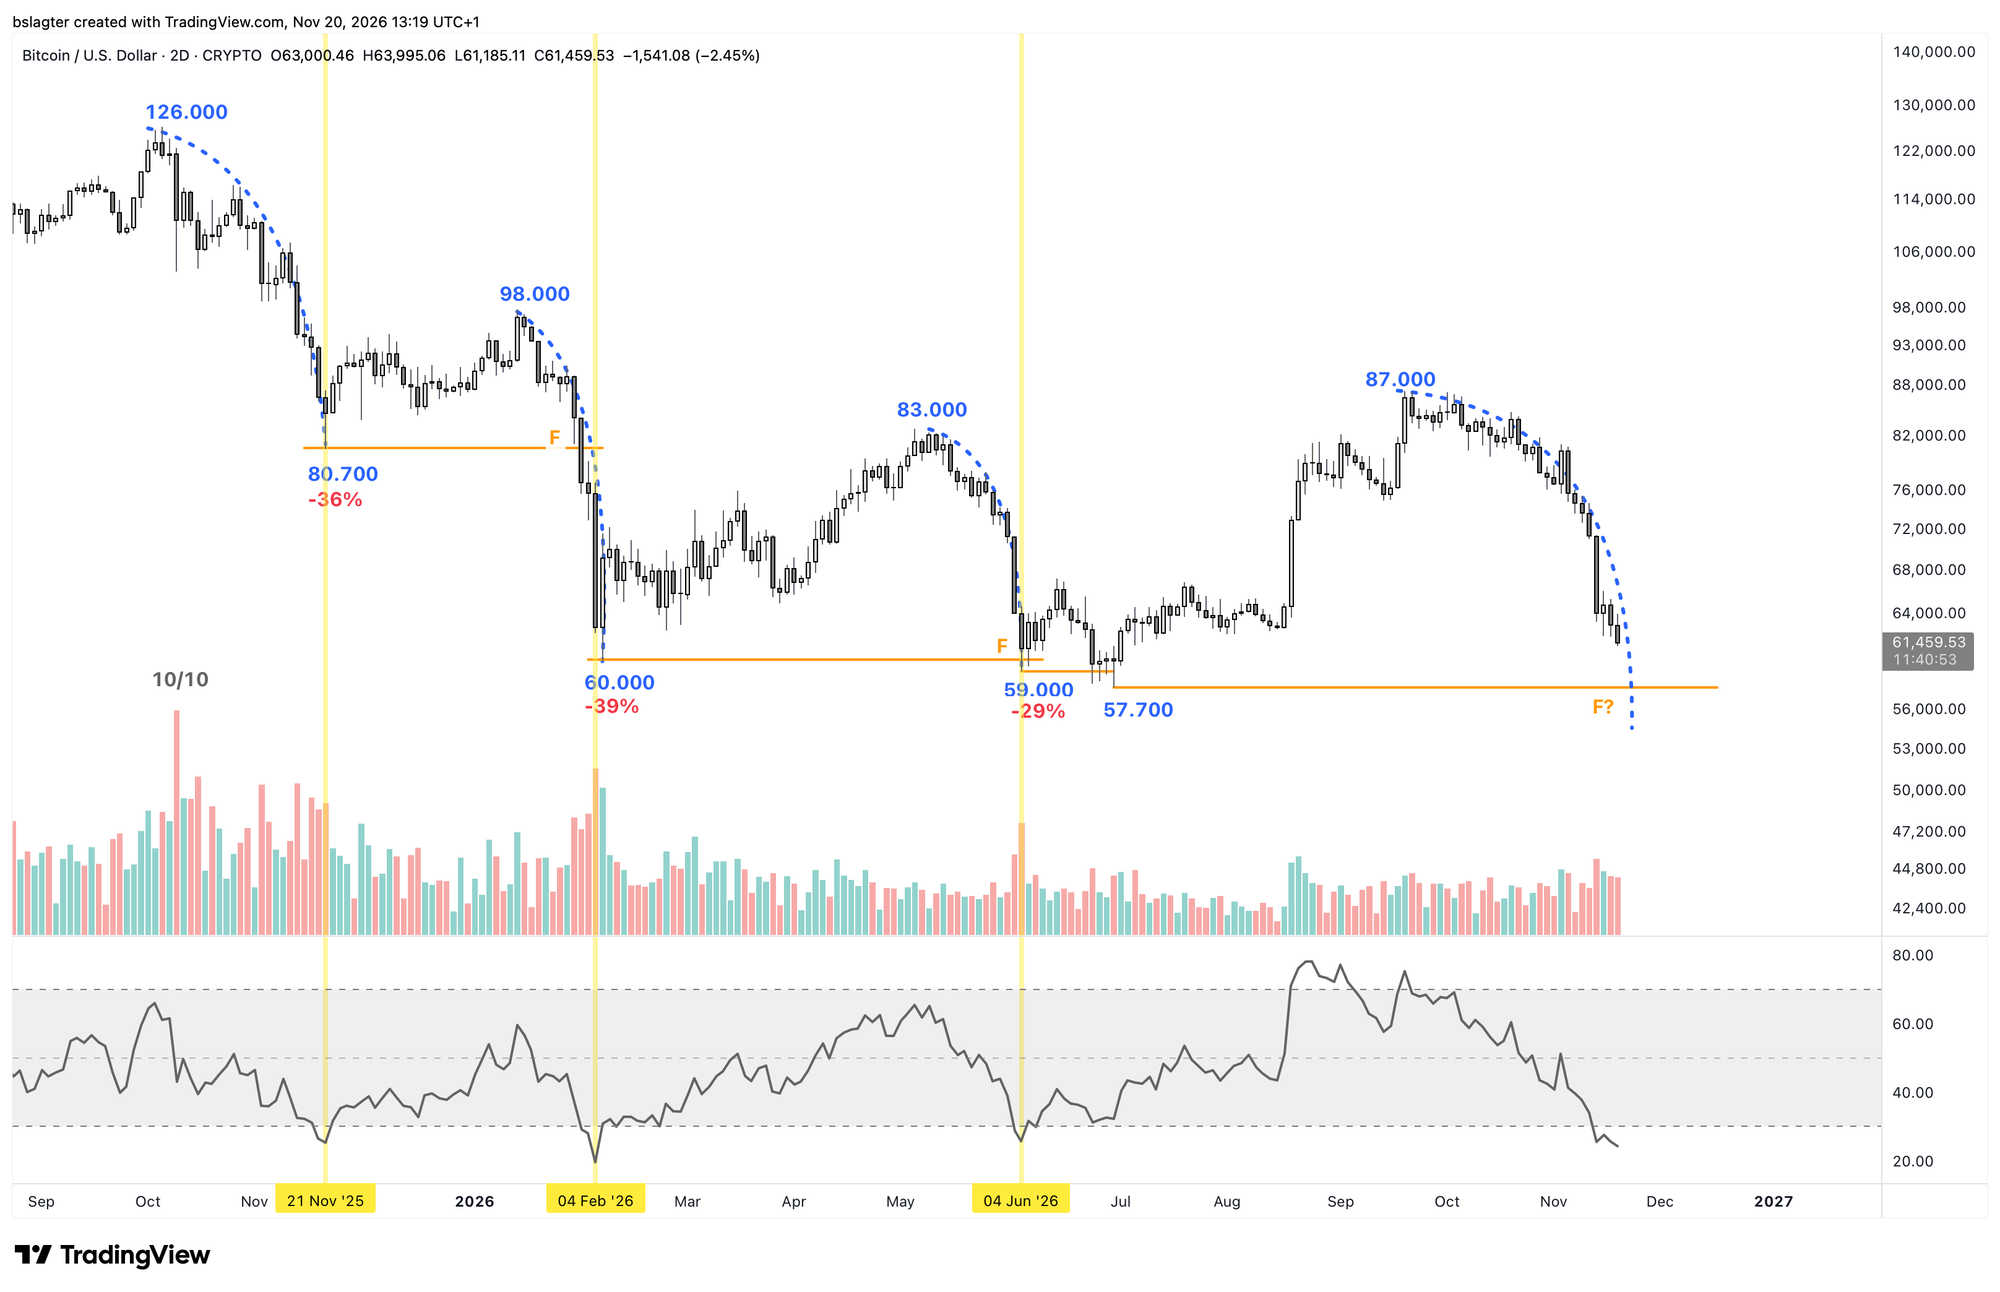
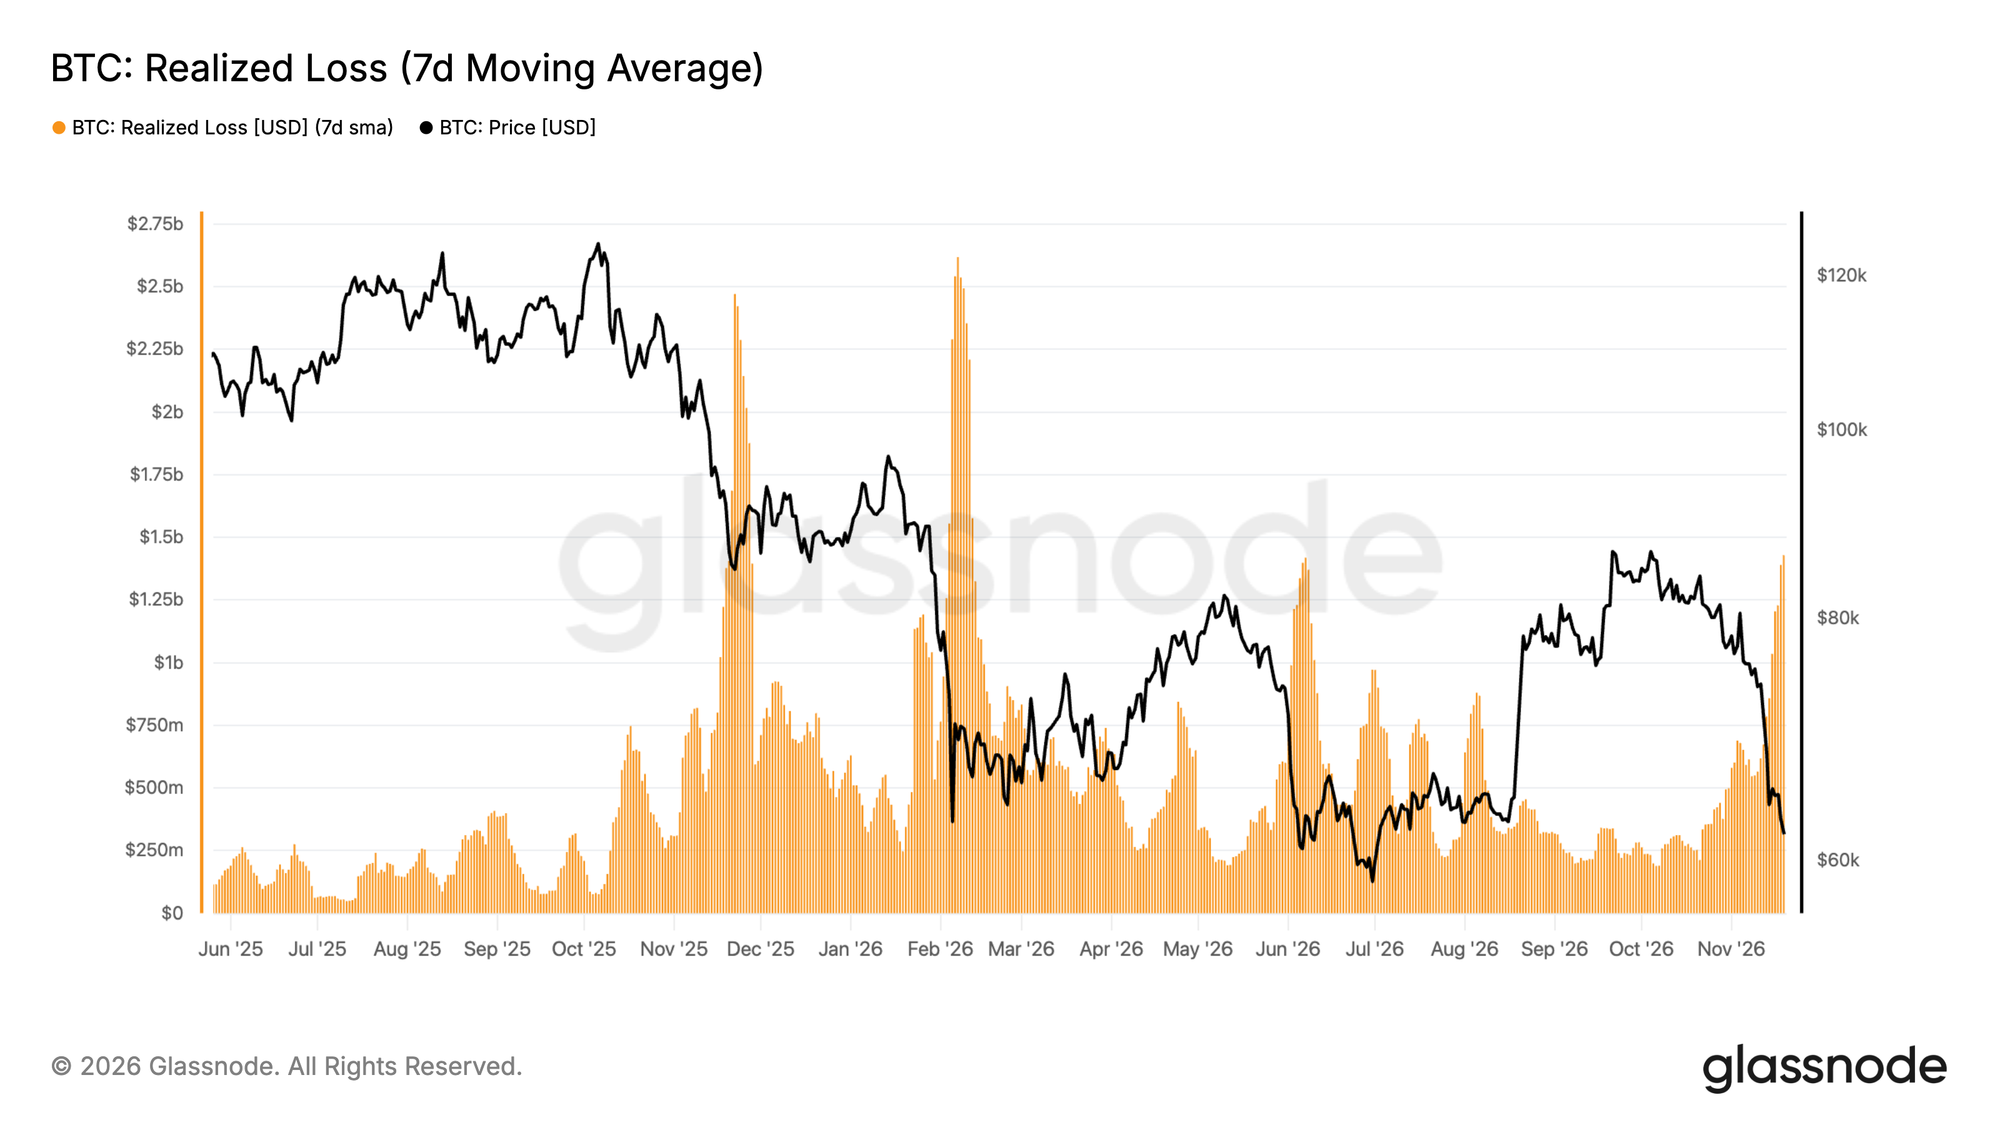
The 7-day average of realised losses in onchain data is even slightly higher than during the June capitulation.
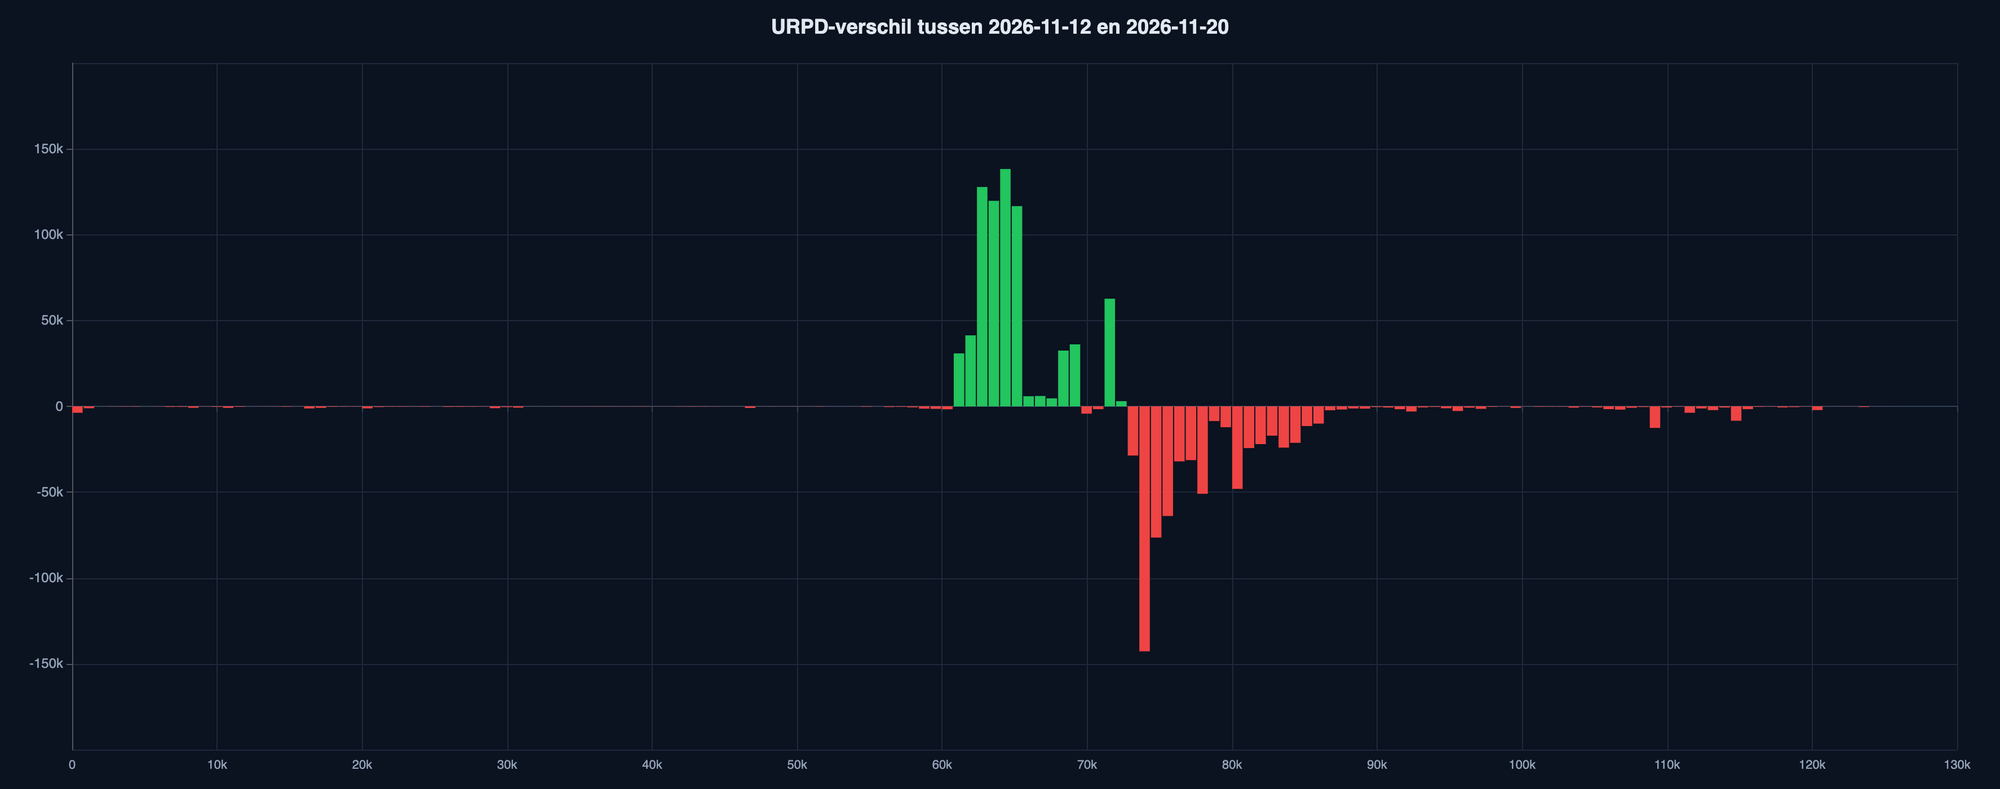
Below you can see how bitcoins moved between different purchase price levels between 12 and 20 November:
- The sellers are mainly people who bought between 70k and 78k.
- There are hardly any new ‘top sellers’, meaning people who bought in above 100k and are now capitulating.
- There are hardly any long-term holders taking profit right now.
That last point matters. Profit-taking by long-term holders would signal that they've lost faith. Evidently, that isn't happening. It's mainly short-term holders who are panicking.
2️⃣ Scenarios and probabilities
Contribution by Bert
I last updated my scenarios and probabilities on 23 October:
- 80% - a new bull market
- 15% - a mild, prolonged bear market
- 5% - a deep, prolonged bear market
Through a Bayesian lens, we need to factor the new information from recent weeks into this probability distribution.
These are the key considerations:
- Loss of all relevant moving averages (for the trend on the weekly chart)
- Back at the bottoming formation from earlier this summer
- No quick V-shaped recovery from the 60k bottom
- A deteriorating macroeconomic environment
Here's how I now see the probabilities:
- 50% - a new bull market (= 57.7k holds as the bottom)
- 30% - a mild, prolonged bear market (= a slightly lower bottom)
- 20% - a deep, prolonged bear market (= much lower bottom(s) in 2027)
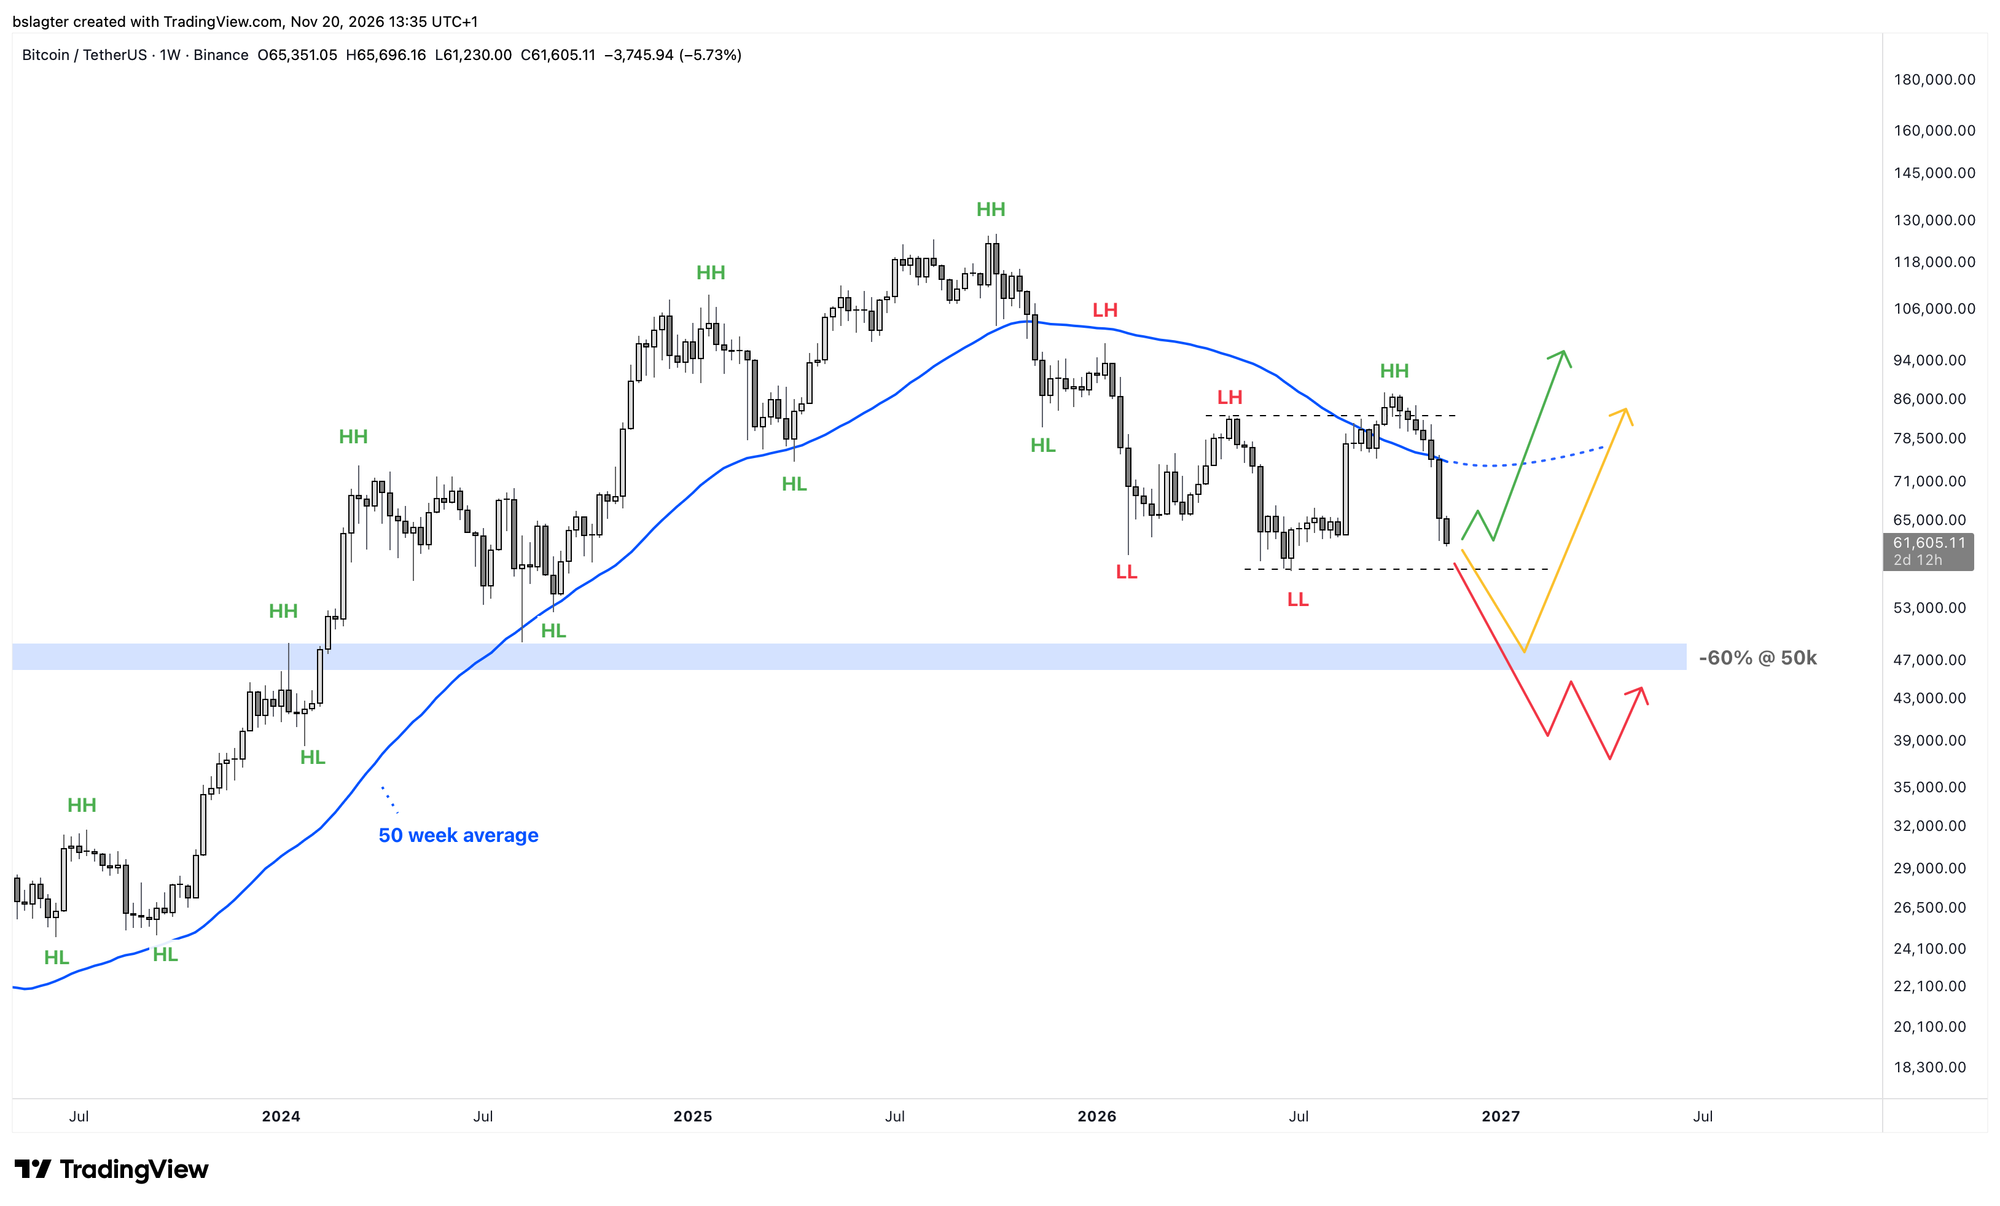
You could say it's 50/50 between “bull market” and “no bull market”. So what good is that?
I'd like to make two points about that.
First, you could just as well frame it as 80/20 between “transition from bear market to bull market” and “prolonged bear market”. That's already a far more meaningful split.
Second, sometimes the world simply isn't clear-cut. Sometimes the near future is a ‘coin flip’ that could land either way.
I'm in good company, it turns out. Legendary investor Stanley “the Druck” Druckenmiller doesn't quite know what to make of it either. He's neither long nor short. “I can't remember a time when we had so little visibility.” It is what it is!
*DRUCKENMILLER: WE'RE NOW SHORT COPPER. THE FED IS NOT CUTTING, THEY'RE HIKING
— Fireside Alpha (@firesidealpha) November 17, 2026
*DRUCKENMILLER: WE'RE NOT LONG EQUITIES. WE'RE NOT SHORT EQUITIES. I WOULDN'T DARE GO SHORT
*DRUCKENMILLER: I CAN'T REMEMBER A PERIOD WHERE I HAD LESS CLARITY ON WHERE WE'RE GONNA BE IN 12 MONTHS… https://t.co/EI9RIn8nKN pic.twitter.com/uMt02Ej54b
3️⃣ Bullish for the long term
Contribution by Bert
So far, this edition of Markets has focused mainly on the short term, meaning the coming months. The longer-term picture for the years ahead, however, is unchanged. Nothing stops this train.
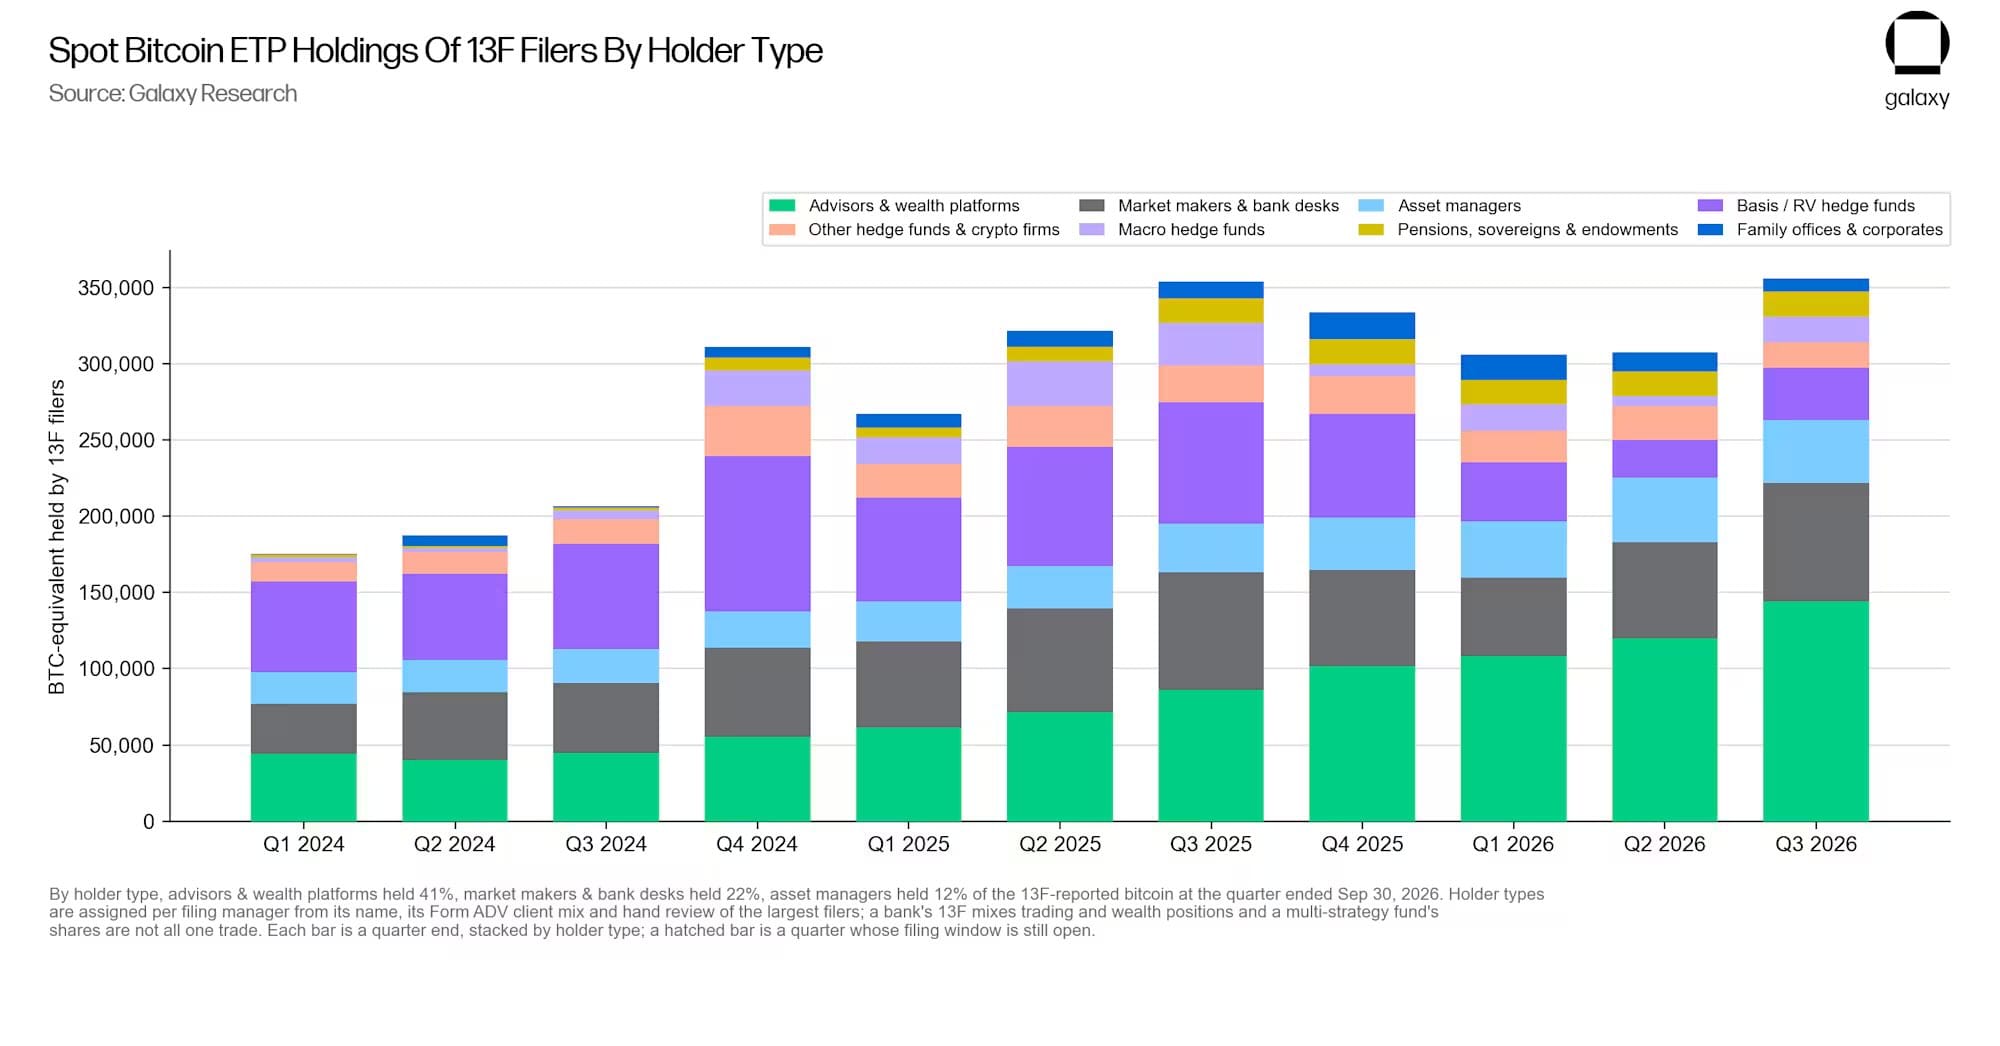
Investors in the “advisors & wealth platforms” category realise this too. Every quarter they add more bitcoin to their portfolios through the bitcoin ETFs, regardless of price or market sentiment.
Galaxy analyst Alex Thorn wrote on X:
It's crazy. Financial advisors and wealth managers are adding bitcoin to their portfolios at a rapid pace. This chart tells the story best. Look at the green section at the bottom, which keeps growing every quarter. That's what it's all about: bitcoin is earning a permanent place in strategic asset allocation.
4️⃣ Another long sideways stretch ahead?
 Contribution by
Sam
Bitcoin has shown some momentum in recent weeks. Unfortunately, it was in the wrong direction. The weekly close below $75,000 was followed last weekend by a forceful move down to $62,000.
Last week I wrote that my base case had shifted from an upward trend to a sideways range between $83,000 and $60,000. That decisive weekly close also produced a lower low below $75,000. As a result, the odds have unfortunately risen that the price will trade below $58,000 again.
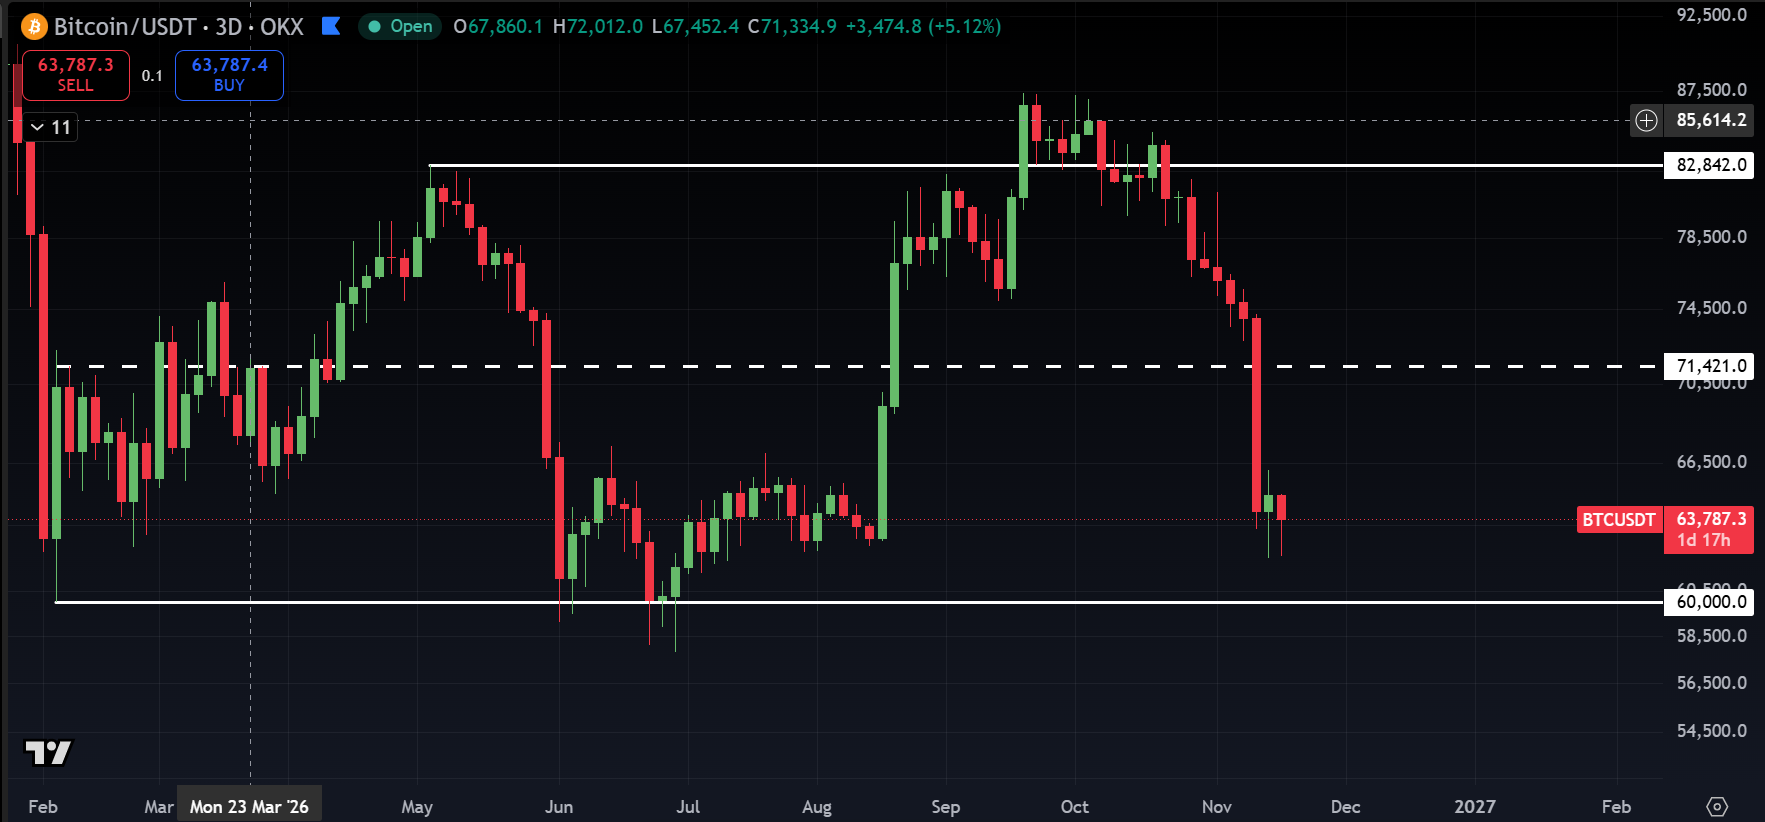
Since the sell-off climaxed on Saturday night, the price has been moving sideways between $62,000 and $66,000. This area has served as a support zone before, so it's reasonable to expect the bulls to show at least some sign of life here.
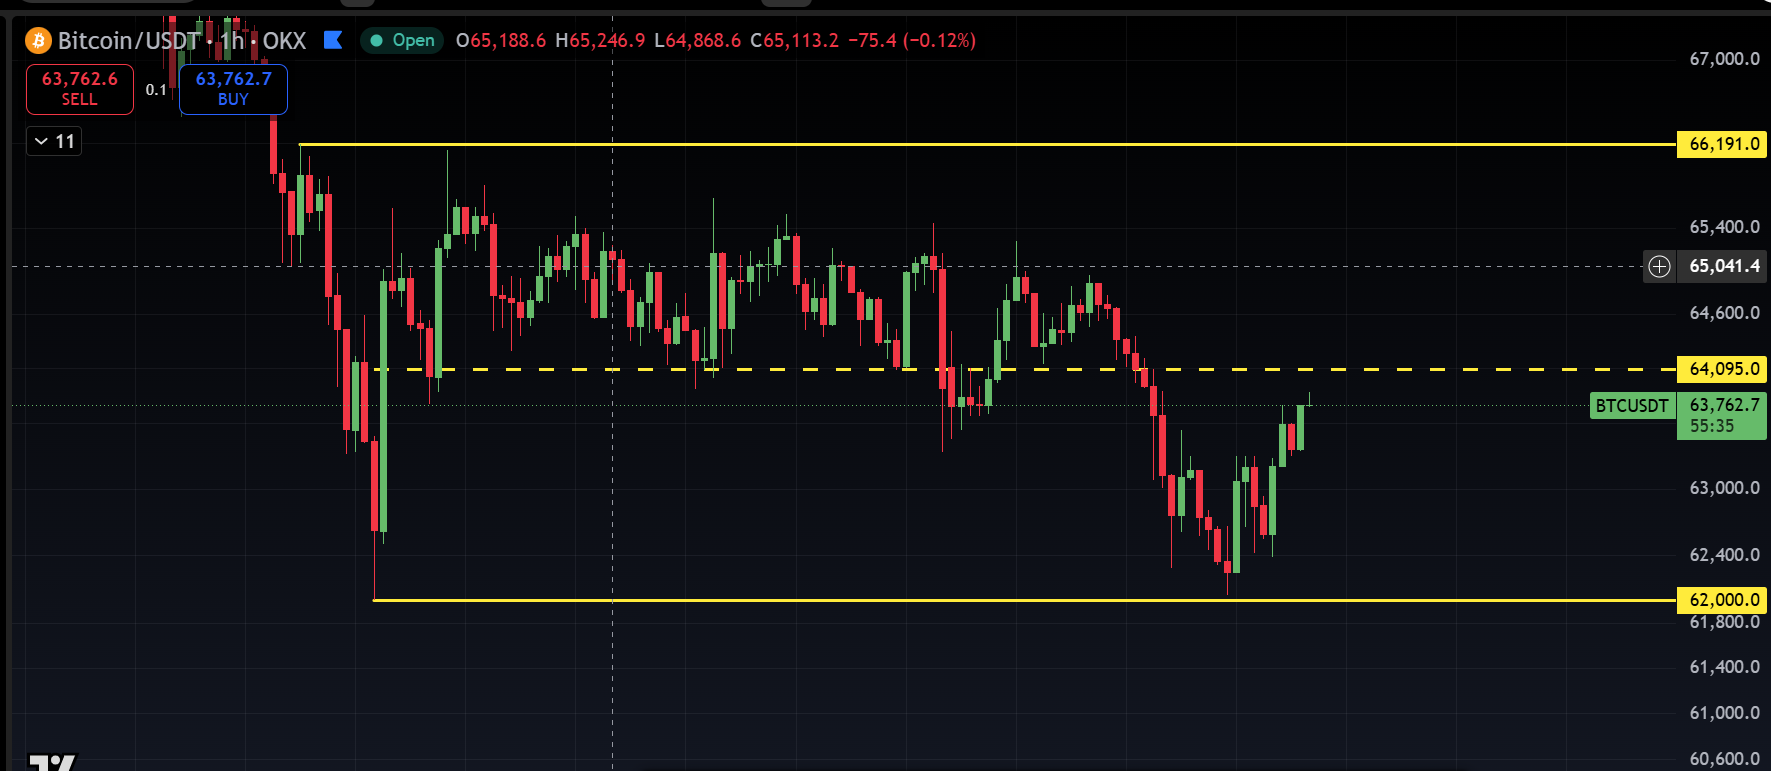
The million-dollar question is what comes next. In line with how bitcoin has behaved in recent years, the expectation is that the price will move sideways for weeks or even months.
In fact, volatility could well fade. The price might range between $62,000 and $66,000 for weeks, then stay trapped between $60,000 and $83,000 for months after that.
In the charts above, it therefore pays to be cautious above the dotted lines (the upper half) and optimistic below them. Of course, whether you act on this depends entirely on your own investment horizon.
In short, here's how I see it:
Zoomed out, this is the zone where I want to be optimistic, as long as the price doesn't drop below the July bottom of $58,000. If the price climbs above $70,000, I'll turn cautious.
Zoomed in, the reactions above $66,000 and below $62,000 are key. They will signal whether a trending move is on the way or a longer period of sideways action within this range.
In closing
You can read all previous editions of Alpha Markets in the archive. Questions, comments and suggestions are always welcome in the community.
Thank you for reading!
To stay informed about the latest market developments and insights, follow our team members on X:
- Bart Mol (@Bart_Mol)
- Peter Slagter (@pesla)
- Bert Slagter (@bslagter)
- Mike Lelieveld (@mlelieveld)
We appreciate your continued support and look forward to bringing you more comprehensive analysis in our next edition.
Until then!