A New Upward Trend
Bitcoin’s riding a razor’s edge: a short-term uptrend tests $94K above the 50-day MA while US stocks stand at a crossroads amid Trump’s trade war uncertainty. Will gain momentum prevail or is another dip looming?
A trend is simply the direction in which a financial market is moving. In an uptrend, prices are rising—but never in a perfectly straight line, as even the strongest run is interrupted by brief pauses. An uptrend is characterized by a series of progressively higher highs and higher lows.
Think of it as similar to the annual temperature cycle. In the spring, temperatures gradually increase. While there are alternating warm and cool weeks, the overall highs and lows continue to climb. In the summer, temperatures tend to stabilize for a while, followed by a downward trend in autumn, and then leveling off again in winter.
Trends exist on different timeframes. Just as a fern’s frond mirrors the whole plant, each trend contains smaller trends. In the bitcoin market, we distinguish between two: the long-term trend and the short-term trend:
- The long-term trend is observed on the weekly chart and spans years. An upward trend over this period is known as a bull market, while a downward trend is called a bear market.
- The short-term trend is seen on the daily chart and lasts for several months. These consist of the rising phases and corrections within a bull market, and vice versa in a bear market.
Within a trend, you can usually identify a dominant moving average that guides its direction. For the short-term trend, we use the 50-day moving average, and for the long-term trend, the 50-week moving average.
A key trait of an uptrend is that prices typically remain above the dominant moving average, which then acts as support. If prices fall below this average, it often signals the end of the trend.
Investor sentiment is closely tied to the trend's direction. The short-term trend is usually more immediately reflective of market mood. Even within a robust bull market, sentiment can turn negative during a correction as fear and uncertainty take over.
Last week’s Markets headline read “Caught Between Bull and Bear.” The short-term trend was downward even as the long-term upward trend persisted. Prices were squeezed into an ever-narrowing zone between the two moving averages. Which trend will prevail?
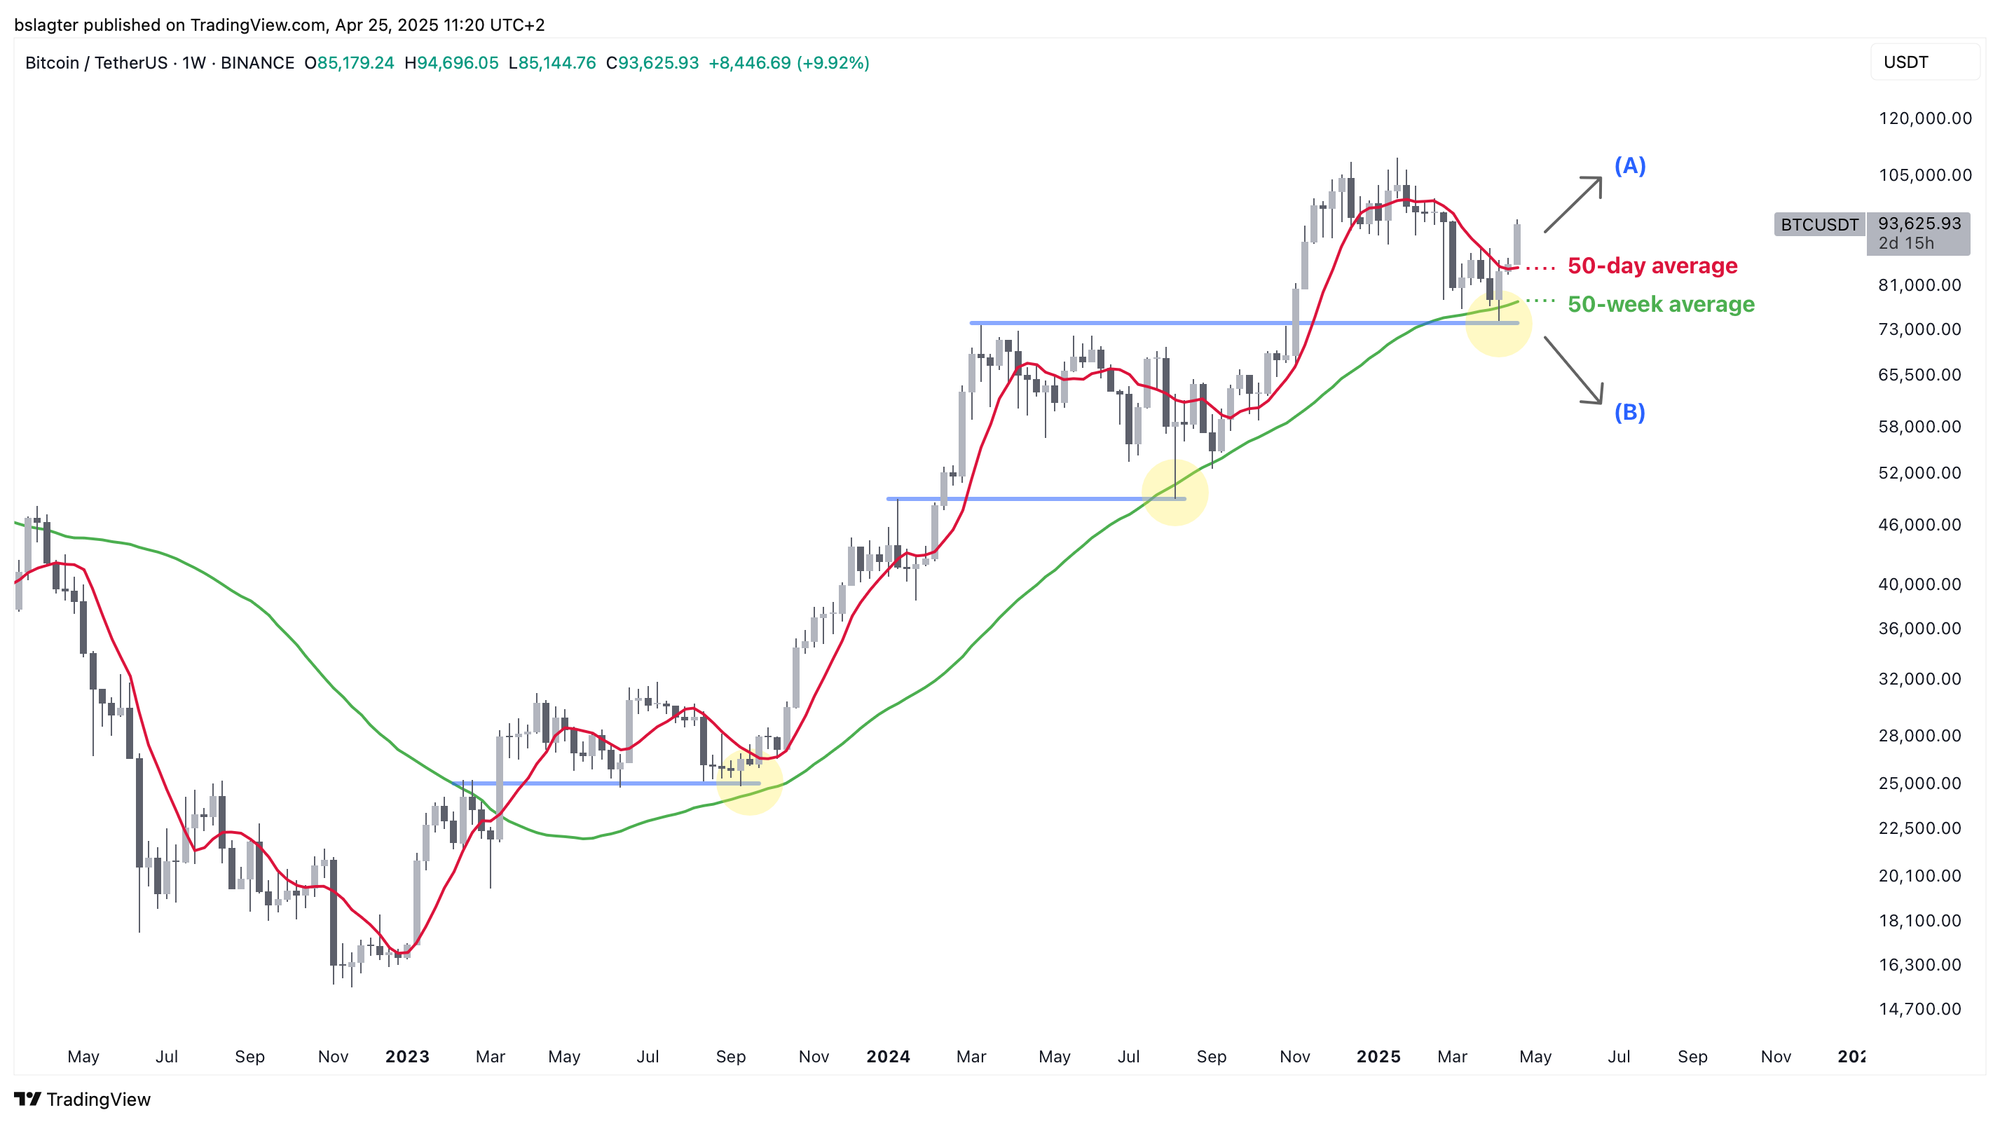
Last week, we described the upward move with three key milestones: $86,000, $89,000, and $92,000. All of these levels have now been reached. We are currently above the 50-day moving average, have set a new higher peak, and have returned to the price range observed from November to February.
The current hypothesis is that the short-term trend is upward.
Therefore, we expect:
- Higher highs and higher lows,
- For the 50-day moving average to act as support instead of resistance,
- For horizontal resistance levels to be broken and subsequently retested as support.
Prices have been fluctuating around $94,000 for several days now. The pause in the upward trend occurs as we reach an area where significant resistance is likely. A lot of trading activity has taken place in this range, and short-term holders now have an opportunity to exit without incurring losses. It seems probable that we will first see the formation of a higher low in the coming week before prices can move decisively above $96,000.
A logical price target in this scenario would be between $87,000 and $89,000 – the range between the 50-day moving average and the March 24 peak. However, in an overly enthusiastic market, these target levels are often surpassed. After a new all-time high is reached, prices sometimes surge even higher, as illustrated at point (A) below.
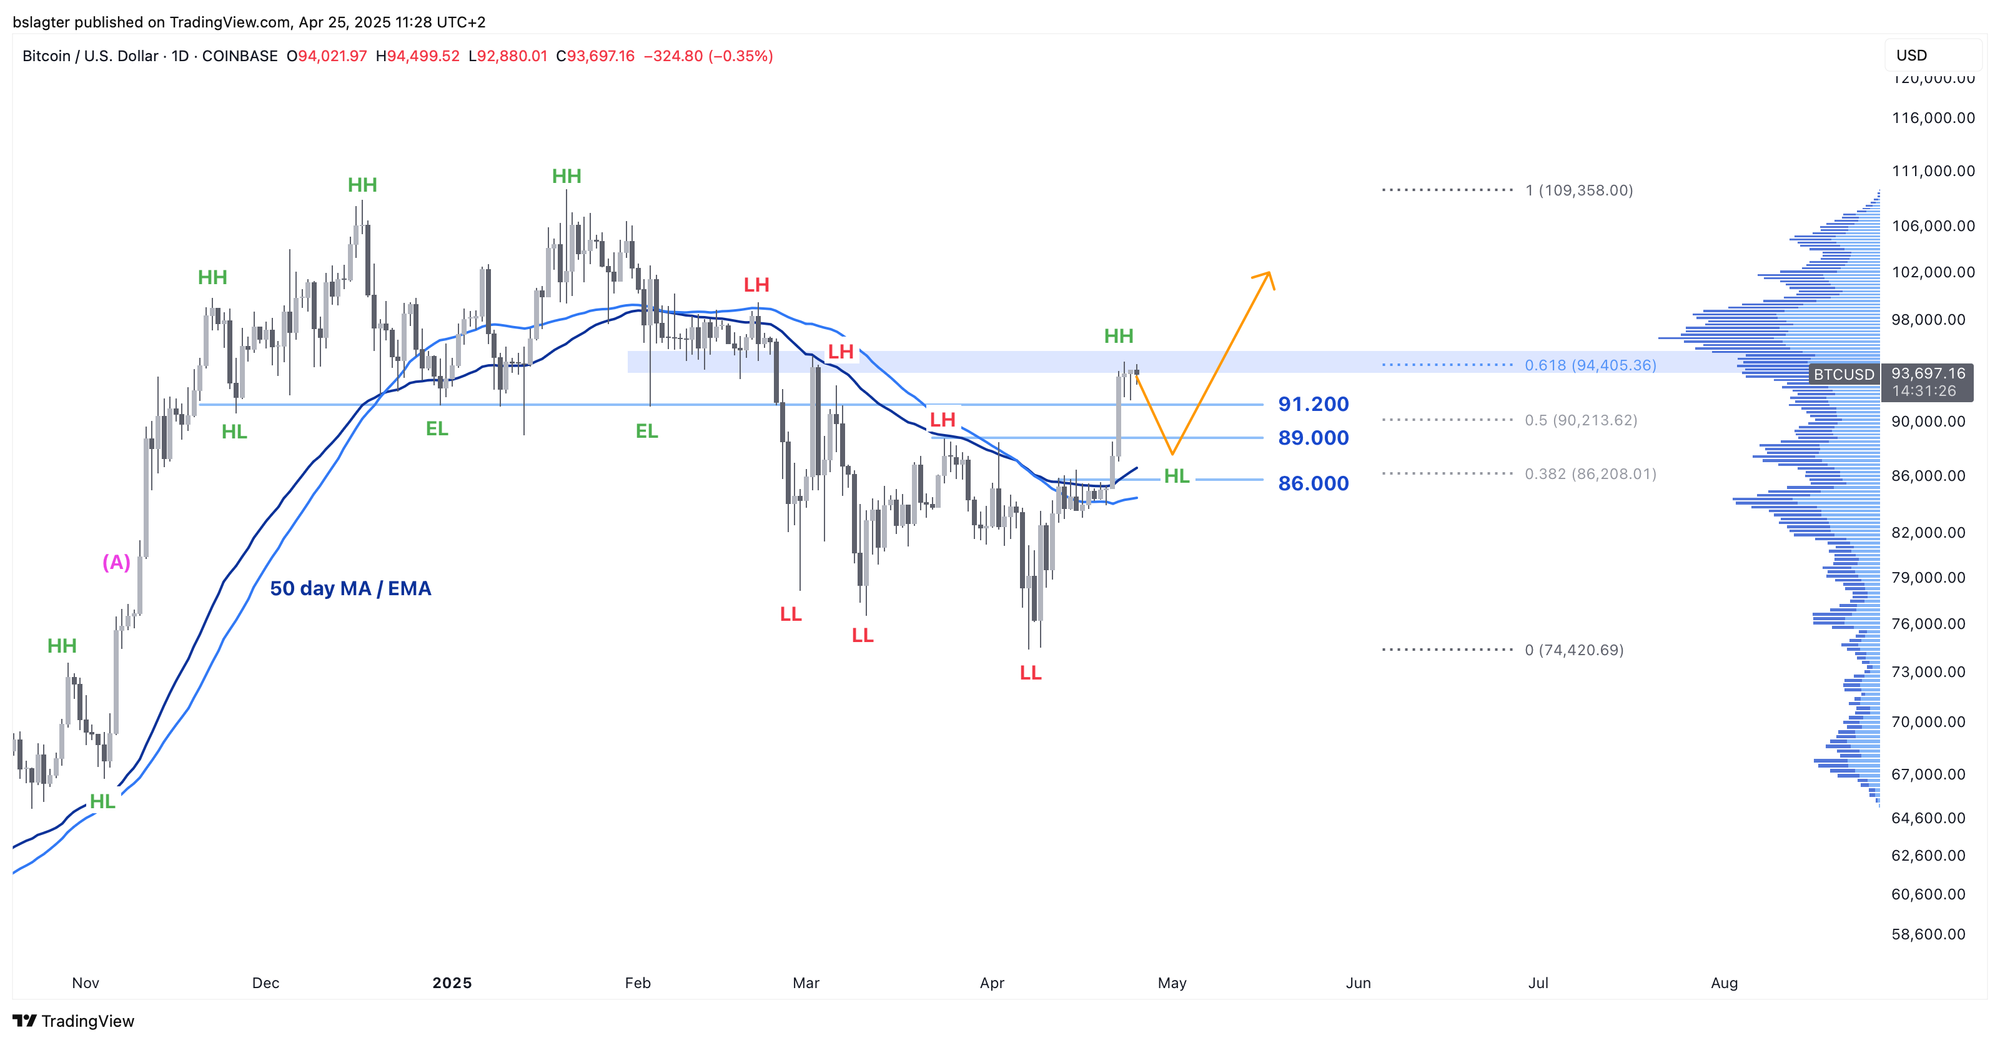
Often, a new uptrend follows a downtrend. Over the past two years, we have witnessed bitcoin’s price double four times during such rising short-term trends. It would be exciting to experience another such leap upward.
However, there are reasons to remain cautious.
Firstly, a technical consideration. Although an uptrend often follows a downtrend, it doesn’t always do so. Sometimes the market enters a period without a clear trend, moving sideways around the dominant average. We observed this last summer. Such periods can be challenging for investors, who are caught between bouts of optimism and fear—oscillating between the belief that “it’s all over” and “we’re back on track.”
Secondly, a fundamental consideration. Current conditions remain concerning. Trump’s trade war has sparked global uncertainty and diminished risk appetite. Although some would argue that bitcoin was created for such times, as it represents an alternative to traditional money, many investors still consider bitcoin a high-risk asset.
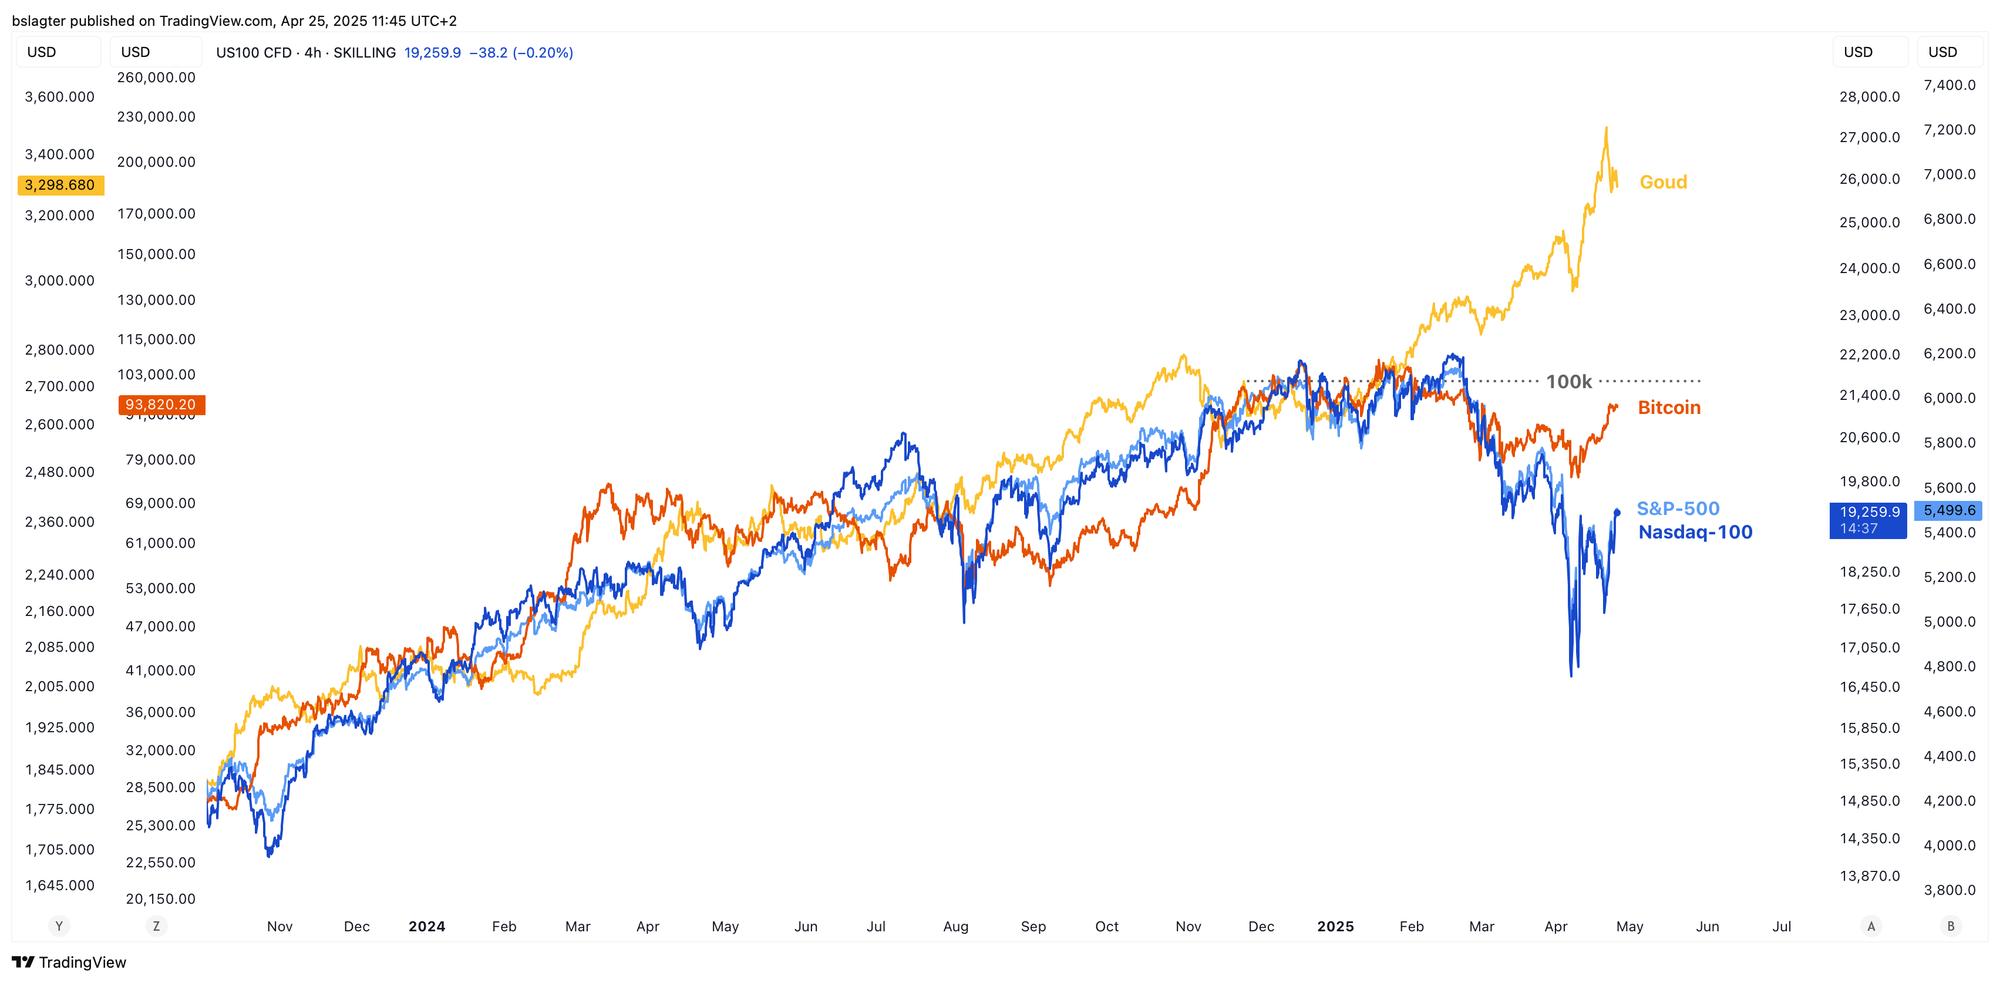
We will continue to closely monitor the chart below to observe how bitcoin fares against US stocks and gold. So far, the signs are promising, although not definitive. We are eager to see how events unfold in the coming weeks.
We will also continue discussing the following topics for our Alpha Plus members:
- US Stocks at a Crossroads
- Risk Appetite Making a Slight Return
- “Nothing Ever Changes”
- Positive Signals for Bitcoin from the White House
1️⃣ US Stocks at a Crossroads
Bert
Every bear market starts with a correction, but not every correction develops into a bear market. The S&P 500 has reached a crossroads. On April 7, the index fell to 20% below its all-time high—a sharp correction, yet not enough to label it a bear market.
Since then, the broad stock index has rebounded and is now only down by 10%, recovering roughly half of the decline. This brings us to an important juncture.
If this correction deepens into a bear market, we expect the recovery to stall in this zone. Specifically, recovery may reach between the 50% and 61.8% retracement levels of the initial decline before the downward trend continues. Conversely, if the correction is over, we should see prices resume their upward trajectory.
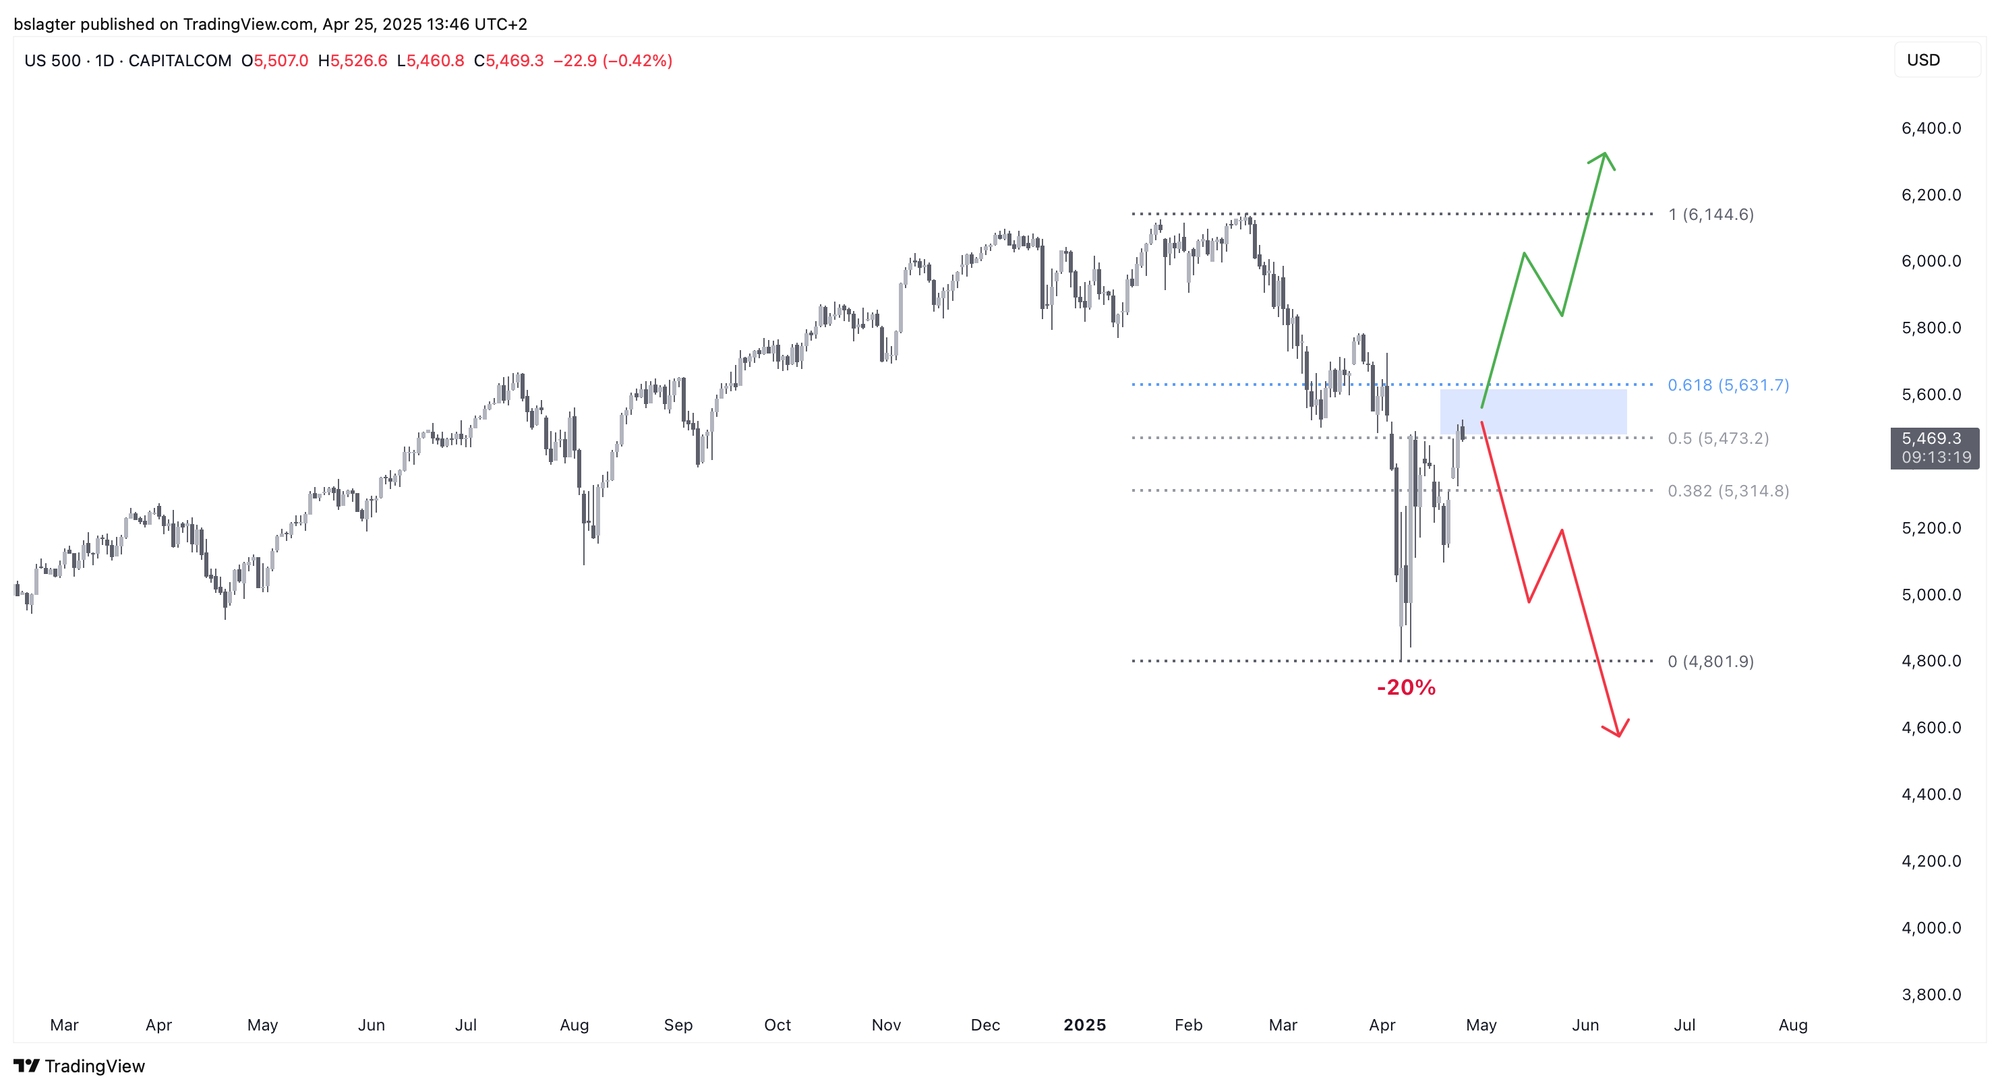
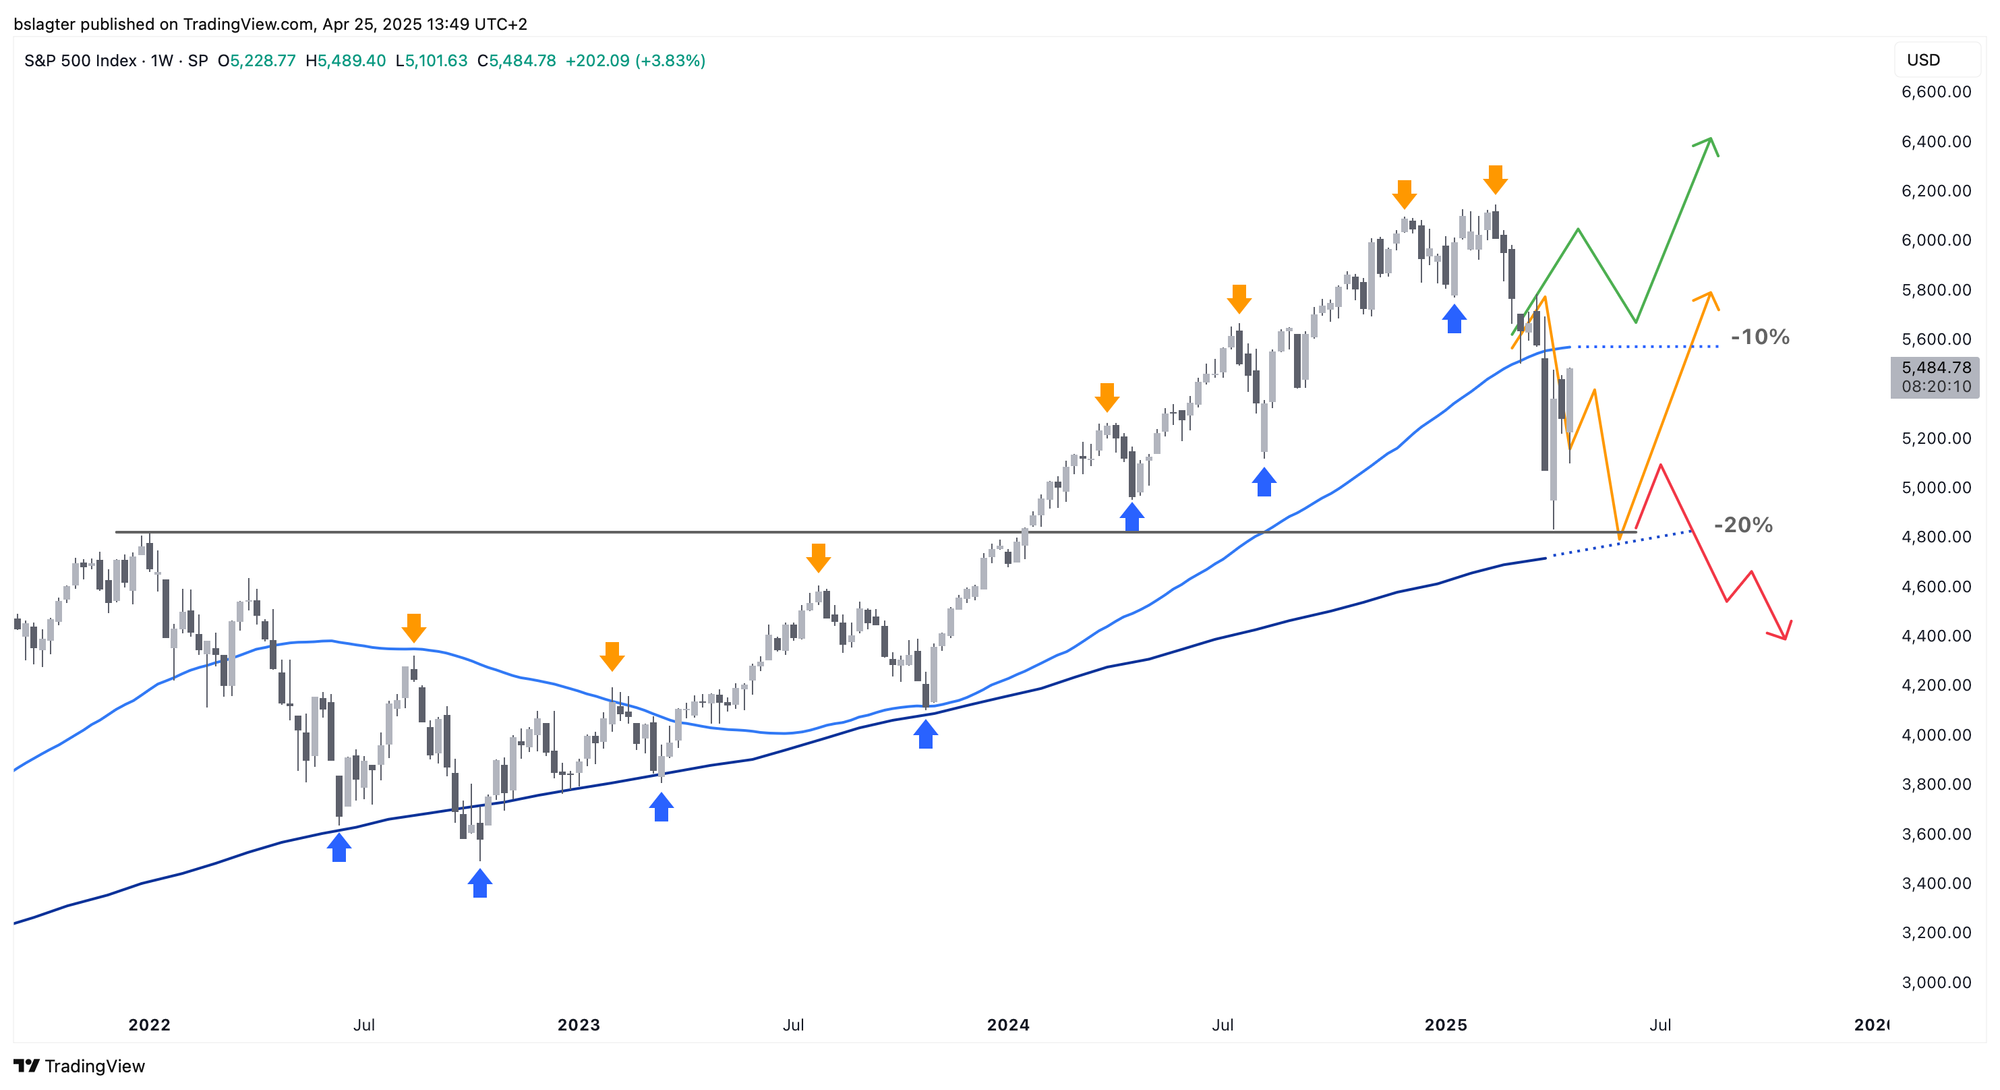
The chart below displays the weekly cycle of the S&P 500 with two moving averages. The light blue line (10-month average) supports the dips, while the dark blue line (40-month average) cushions the corrections.
I prepared this chart at the end of February to illustrate three scenarios. With the green dip, it’s clear that the support didn’t hold. The market could now either be experiencing a mere correction (yellow) or potentially entering a bear market (red).
Optimists are expecting the S&P 500 to recover above $5600, signaling the end of the correction and a move toward new all-time highs. The issue, however, is that we are still early in this weekly cycle. The bottom reached on April 7 falls in week 12—a very early stage for a full cycle.
The natural rhythm of the market suggests that another dip might occur in the coming weeks, possibly revisiting the $4800 range by late May or early June. To rule out that scenario, stocks would need to show a strong, confident move upward, surpassing both the 10-month average and the 61.8% retracement level.
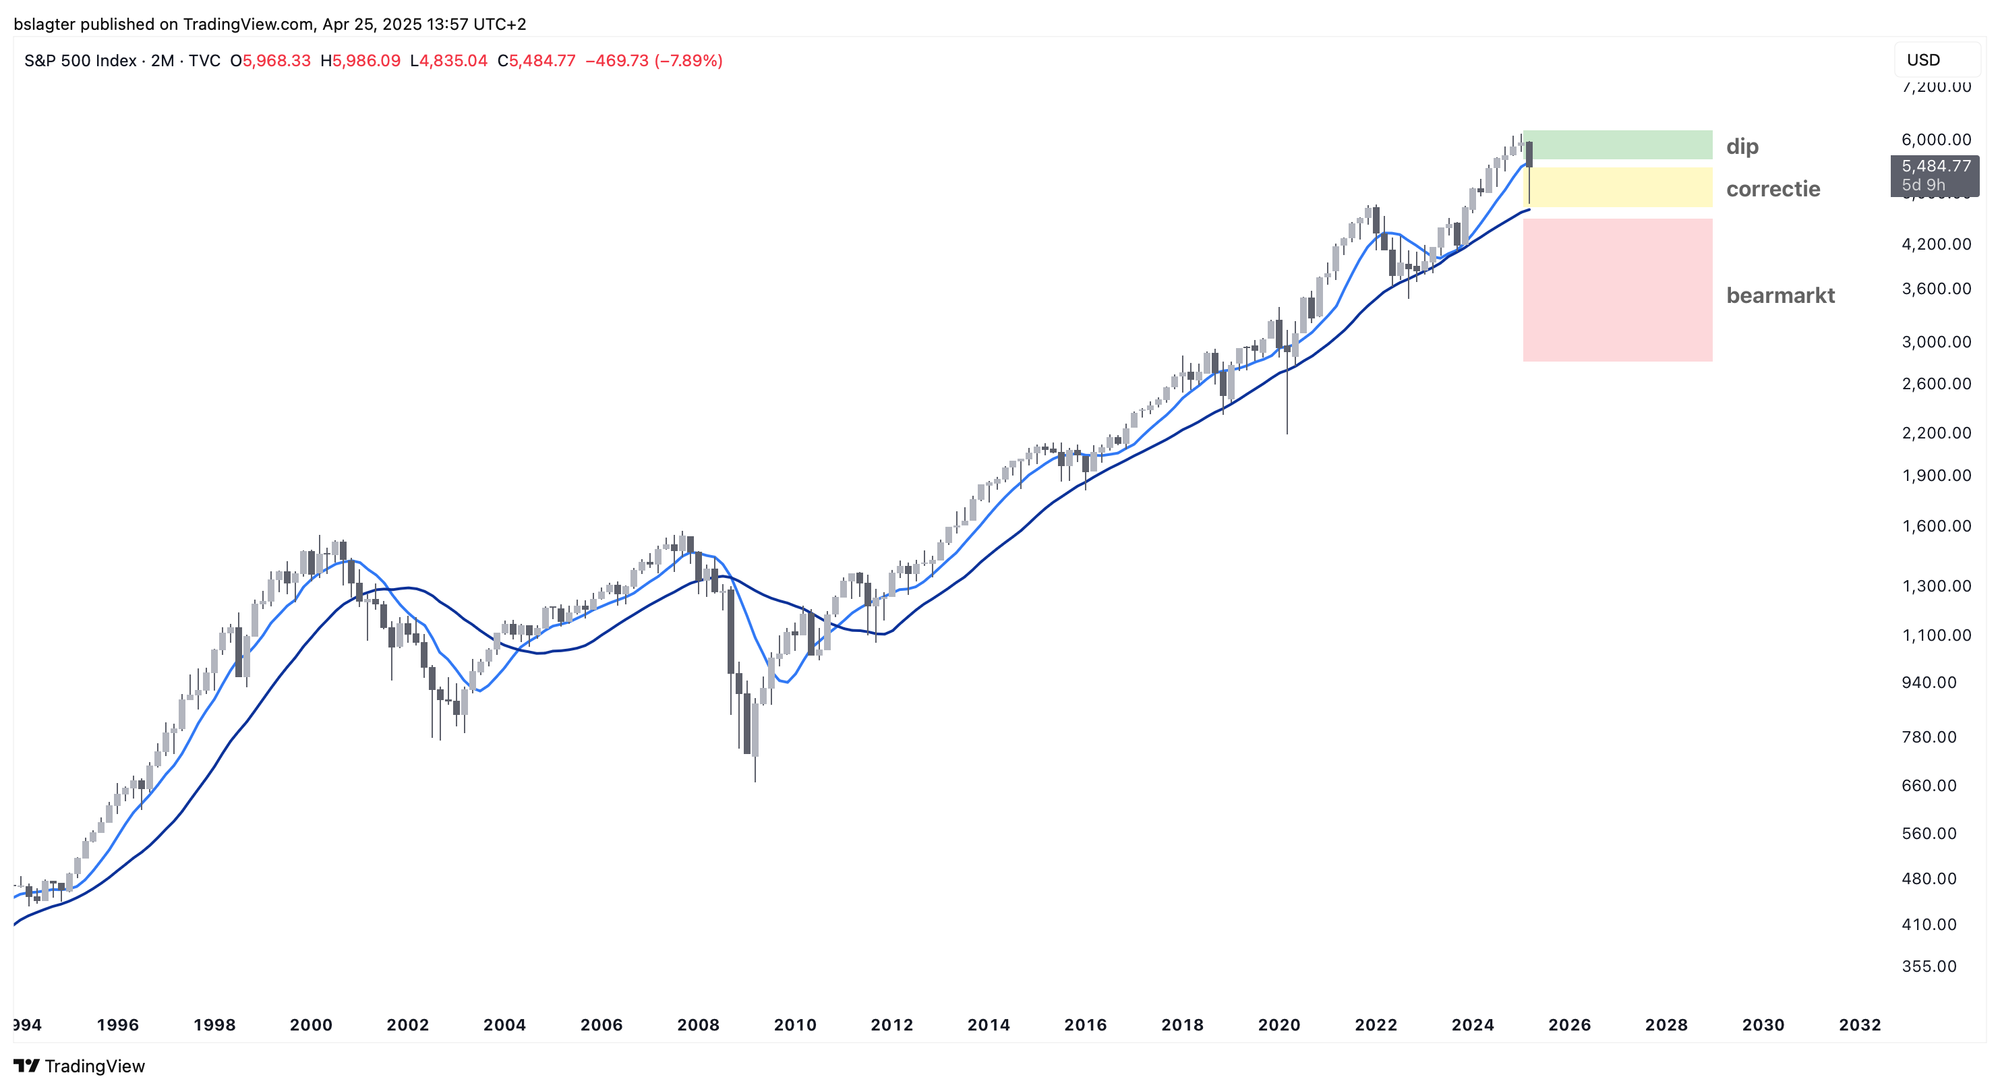
Finally, take a look at the S&P 500 chart spanning the past 30 years, again with the 10-month and 40-month moving averages. These averages clearly demarcate dips, corrections, and bear markets. Notably, the last true bear market occurred in 2008; since then, we have only seen corrections within one prolonged bull market.
In five days, this current candle will close. In a few years, will we view Trump’s trade war as a minor blip, or will another bear market emerge later this year? Regardless, it is likely that bitcoin will ride the wave of the prevailing optimism or pessimism that accompanies these outcomes.
2️⃣ Risk Appetite Making a Slight Return
Bert
A renewed risk appetite among investors would be a boon for all risk assets, bitcoin included. Although bitcoin has shown unexpected strength amid the turbulence of the trade war, many investors still view it as an emerging technology and the "hot sauce" of their portfolios.
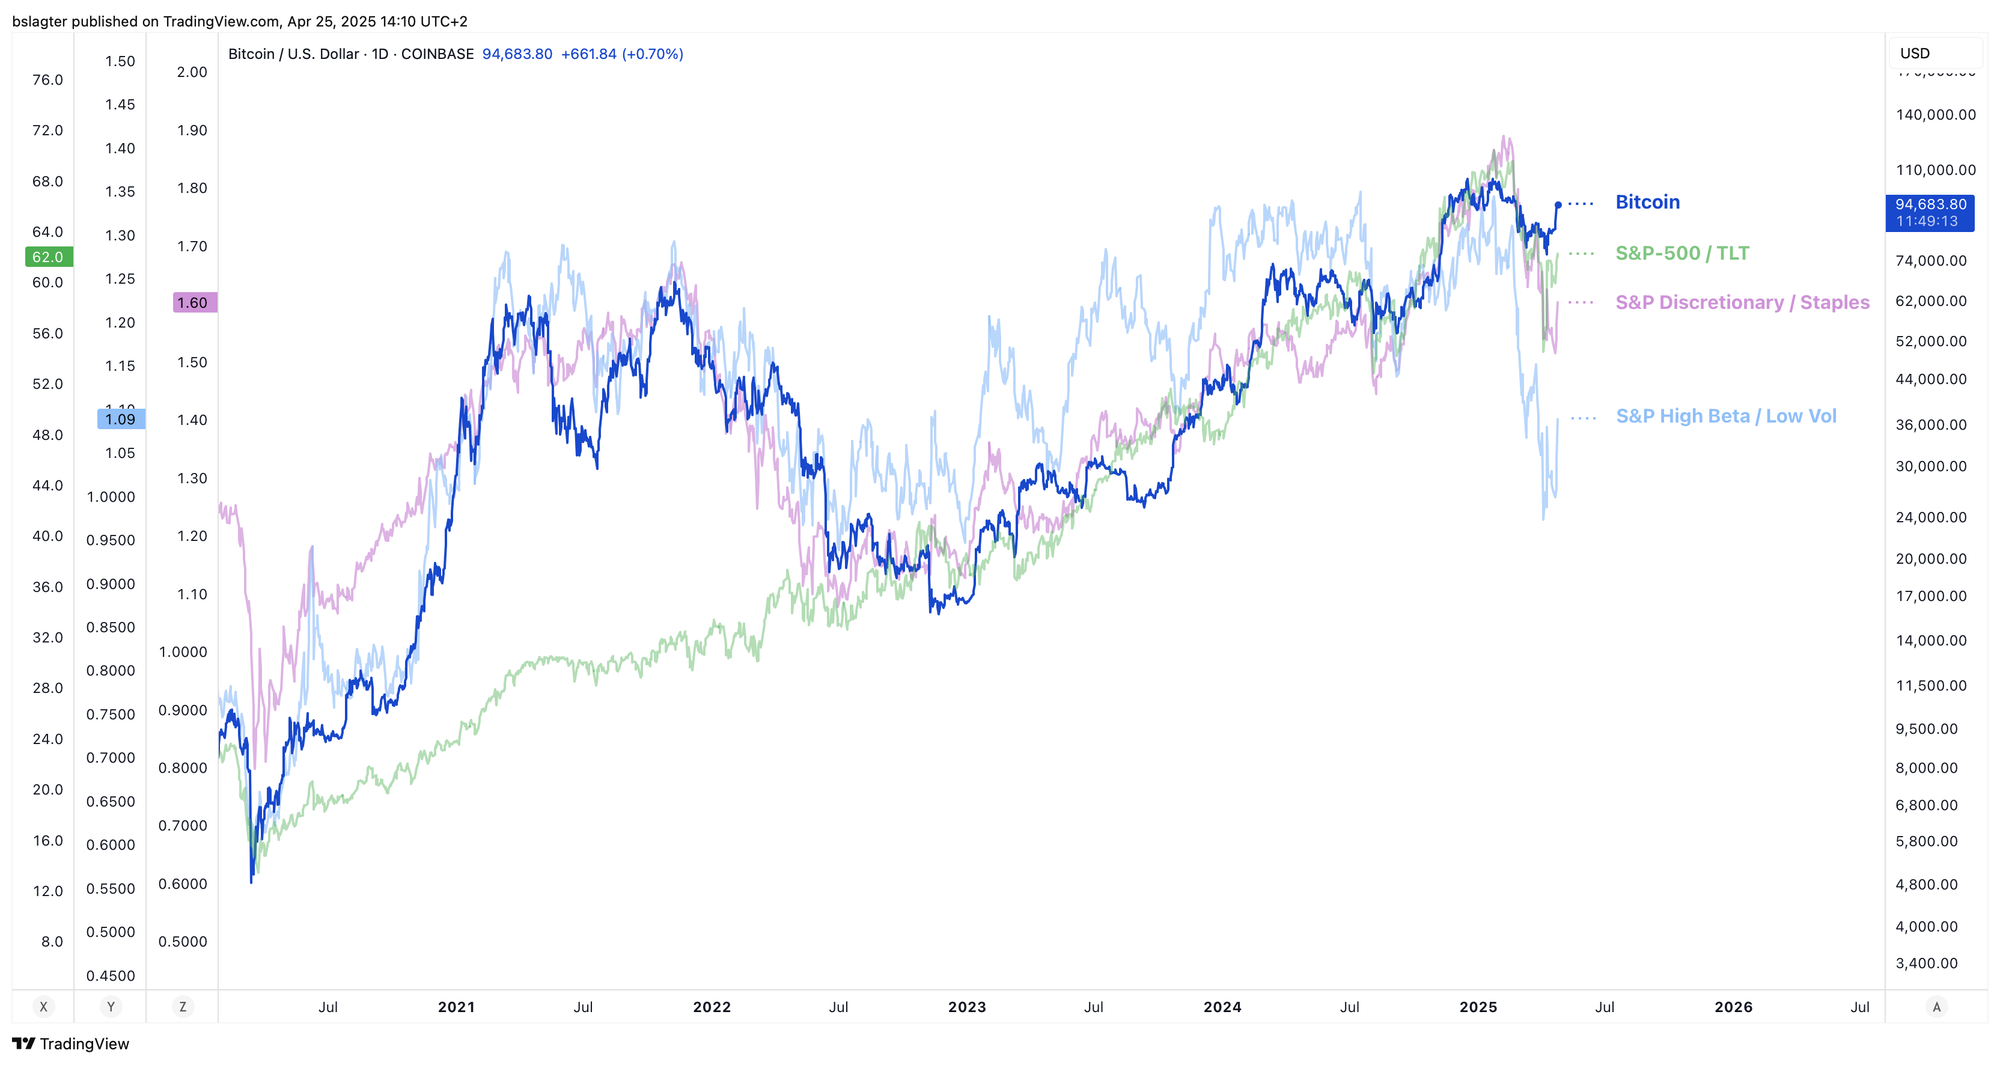
To gauge sentiment, I consider indicators such as:
- The rising SPX/TLT (stocks vs. bonds) ratio,
- The increase in the RSPD/RSPS (discretionary vs. staples) ratio,
- The growing gap between SPHB and SPLV (high beta vs. low volatility),
- The performance of the Mag-7 stocks,
- A decline in bitcoin’s dominance (comparing altcoins to bitcoin).
The first three indicators are shown in the chart below alongside bitcoin’s performance over the past five years. While the absolute levels are less important than the direction and strength of the moves, they do provide insight into market sentiment.
In recent days, we have observed tentative signals suggesting a reversal of the previous downtrend. If this trend continues, it could pave the way for further gains in bitcoin.
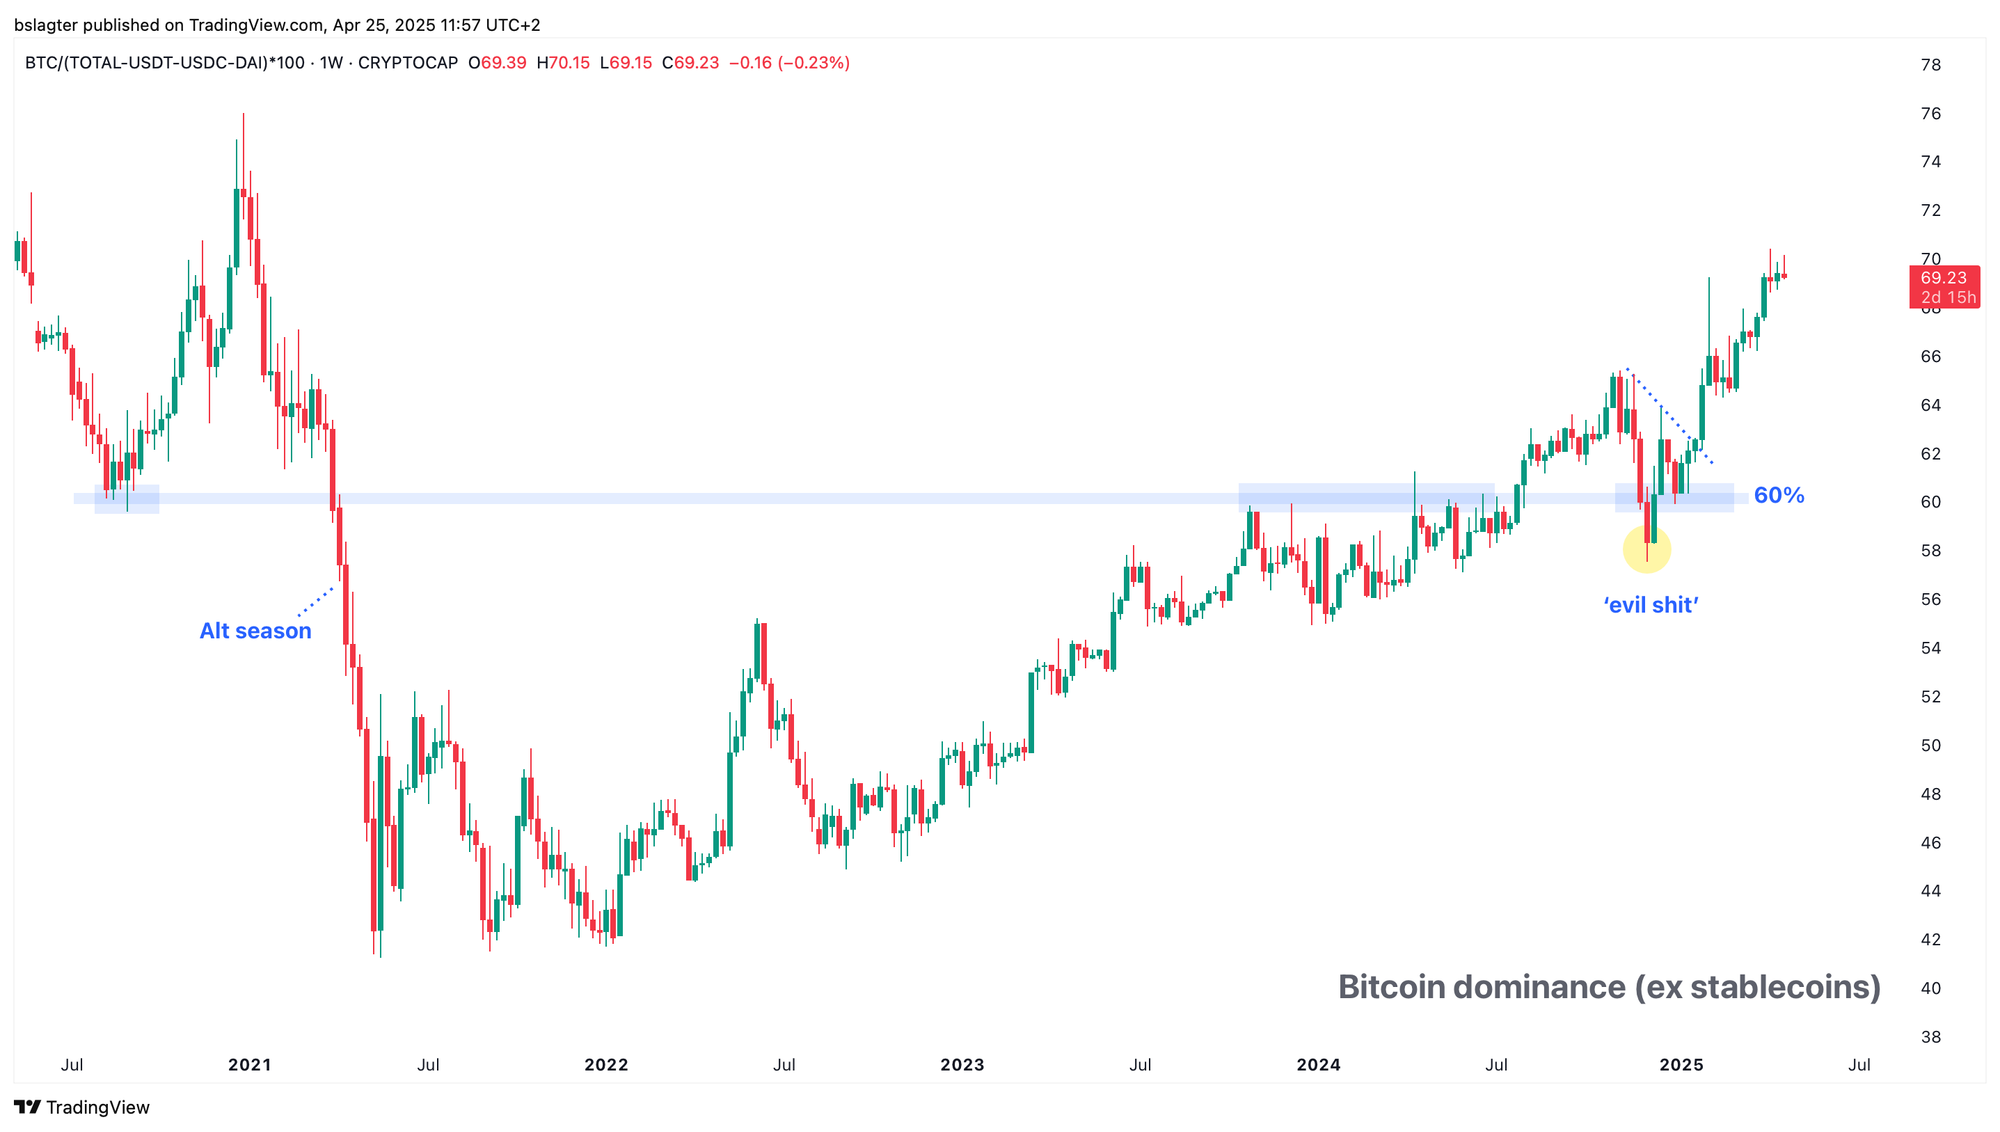
Let’s also examine bitcoin dominance, which represents bitcoin’s market share relative to the overall cryptocurrency market. A declining dominance suggests that investors are taking on slightly more risk by allocating capital to altcoins.
Over the past few days, some altcoins have rebounded strongly from their lows. Notably, SUI surged by 70% in just four days, though this is more of an exception than the norm. Overall, the altcoin market has performed comparably to bitcoin.
The weekly chart of bitcoin dominance below shows that while the current week’s figure is slightly lower, there is no clear reversal of the overall trend yet. If you’re curious about the reference to “evil shit,” check out our Markets section under the heading “The most evil shit that's happened this cycle.”
3️⃣ “Nothing Ever Changes”
Thom
The US stock markets are experiencing difficult times, and the media is quick to lay the blame on President Donald Trump. The Wall Street Journal even described April as the worst month since 1932.
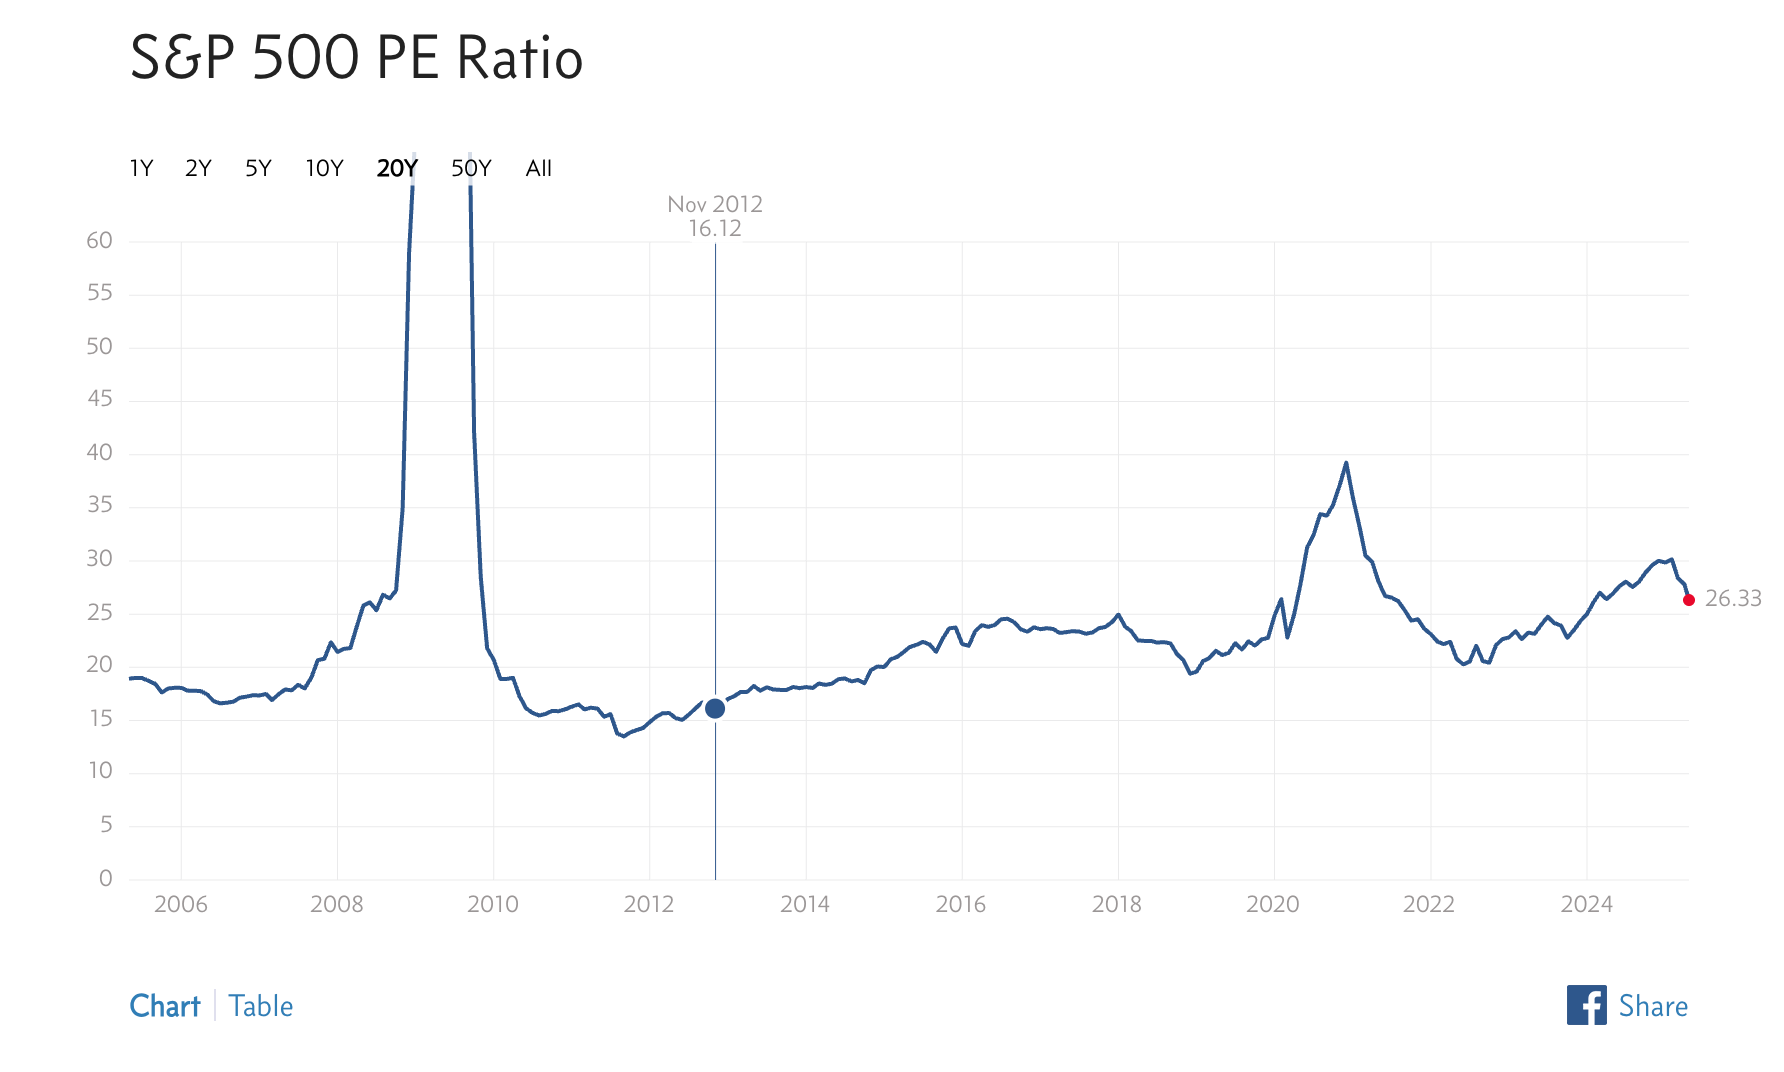
While it’s likely that Trump’s trade war set off the initial domino effect, the question remains whether political unrest is solely responsible for the correction. US stocks have been trading above historical averages for years.
Even now, the S&P 500’s price-to-earnings ratio remains well above the long-term average of 16. Since the end of 2012, stocks have become structurally more expensive, partly due to low interest rates and extensive stimulus measures.
I’m not trying to defend Trump’s policies here, but rather to note that it was only a matter of time before a catalyst emerged to bring stock valuations back to more sustainable levels.
This is a common market behavior: correcting overvaluation. Often, these corrections overshoot into undervaluation because market sentiment is driven by prevailing narratives.
It is often wise to approach the market with a “nothing ever changes” mindset.
Over the past year, stocks like Nvidia and the Nasdaq, in general, traded as if the AI revolution had fully taken hold—almost as if robots were set to replace every job and scarcity was a thing of the past.
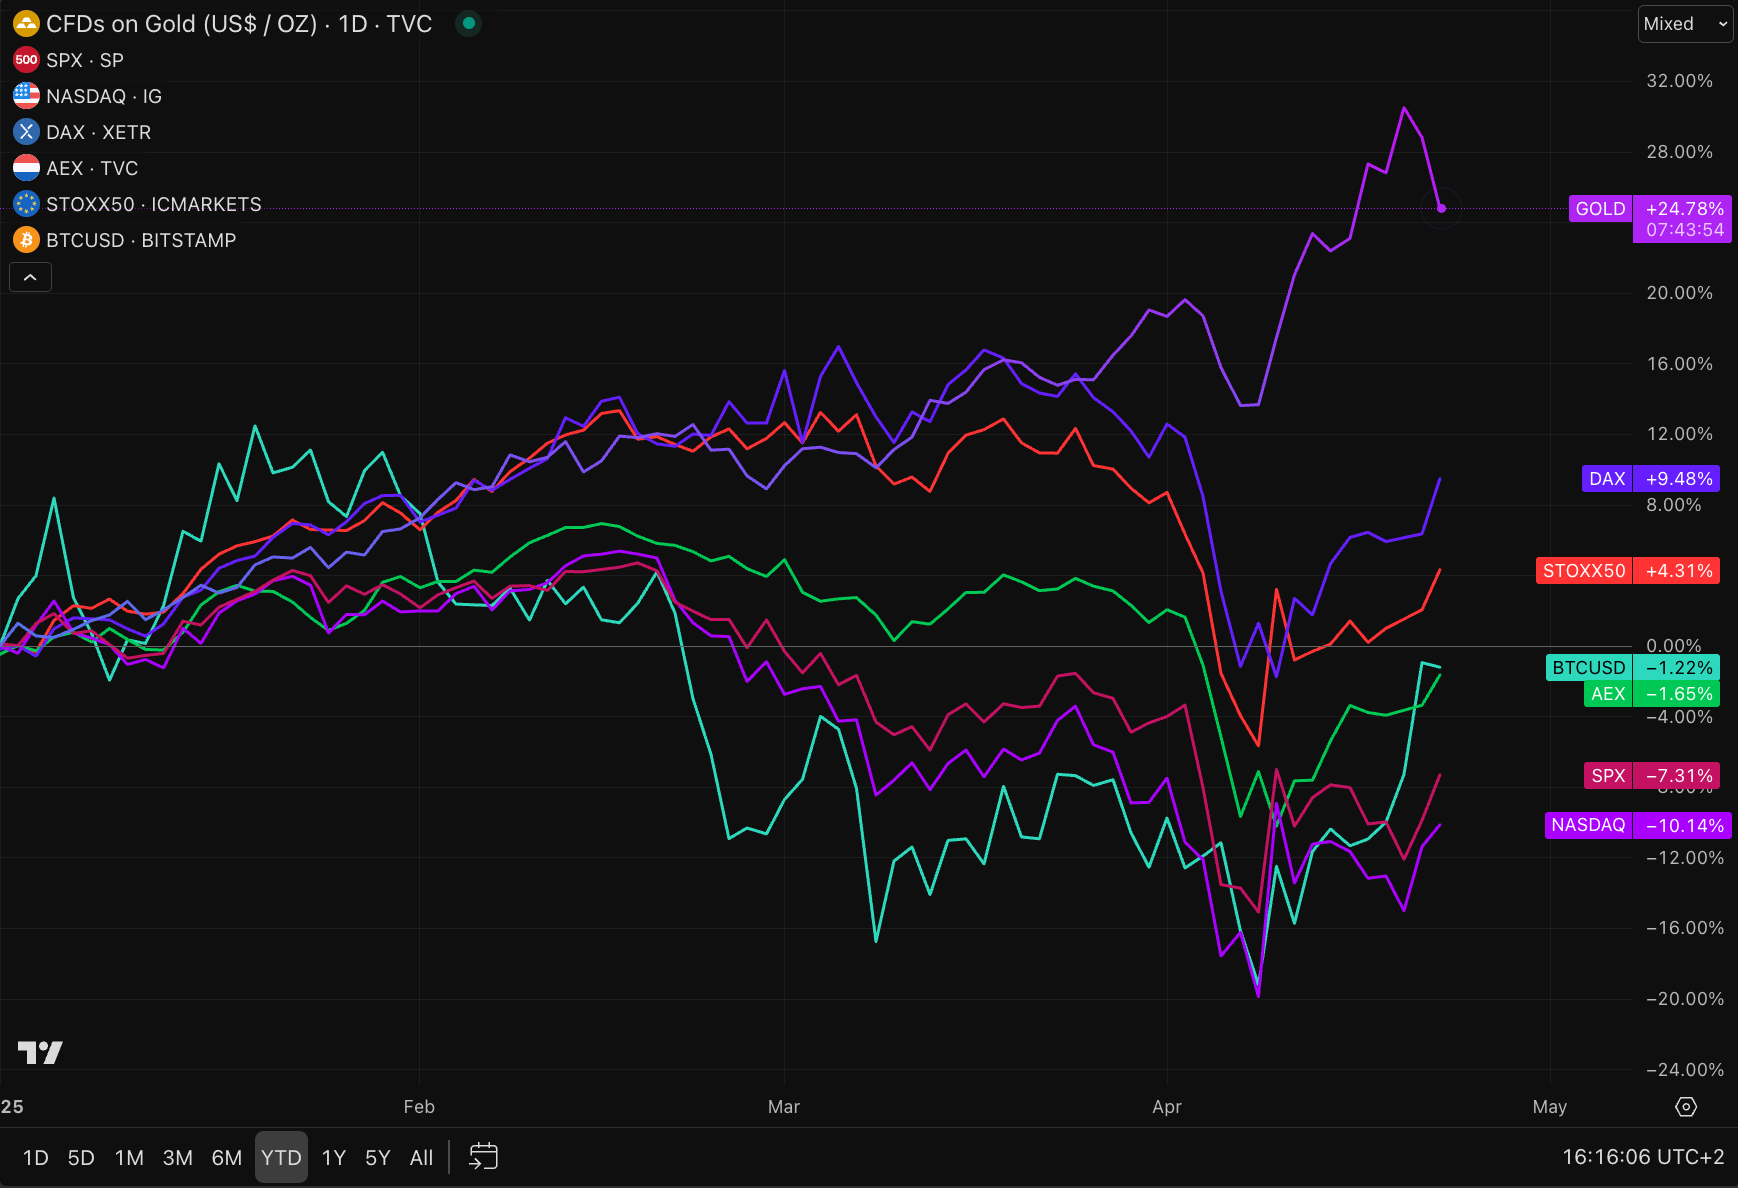
At the peak of such enthusiasm, even the most implausible valuations can seem justified. We witnessed a similar phenomenon with gold in recent months.
Despite a favorable investment climate for gold, traditional gold enthusiasts began speculating again about a return to the gold standard and a rapid surge to $10,000 per ounce.
The sharp spikes in gold prices, juxtaposed with underperformance in other asset classes, led some, like Peter Schiff and Willem Middelkoop, to believe that gold’s “rocket moment” had finally arrived.
Perhaps they are right, but it is more likely that we are simply witnessing a temporary retreat from risk, with investors viewing gold as a safe haven. This week, as risk appetite cautiously resurged, gold responded with gains of several percentage points.
“Nothing ever changes.”
The same is true for bitcoin. Even if the recent rally continues and new all-time highs are reached, don’t expect bitcoin to dominate overnight or to hit $1 million within a year.
The classic “fear of missing out” mentality rarely holds up. At a bitcoin price of $180,000, a correction to more realistic levels is far more likely than a leap to $500,000.
4️⃣ Positive Signals for Bitcoin from the White House
Thom

Less than three months into his second term, President Donald Trump is already signaling a potential easing of the trade war. I remain convinced that this uncertainty will not plague the financial markets for much longer, as it is impossible to sustain the announced import tariffs indefinitely.
Trump understands that prolonging the trade war not only risks plunging China and other economies into recession but could also harm the United States.
In my view, especially considering the 2026 midterm elections, we are likely to see only a few more months of these erratic moves from Trump and his administration.
It’s no coincidence that gold prices dropped a few percentage points after the de-escalation of the trade war and that indices such as the S&P 500 and Nasdaq 100 briefly rallied.
I suspect that the recent instability is largely attributable to this situation—which, by the way, is not entirely resolved. Trump isn’t likely to back down easily, particularly if it would cost him face.
Based on current developments, we cannot yet declare the trade war definitively over. I also don't expect this to immediately clear the path for a sustained bull market. Uncertainty remains high, as evidenced by various risk indicators.
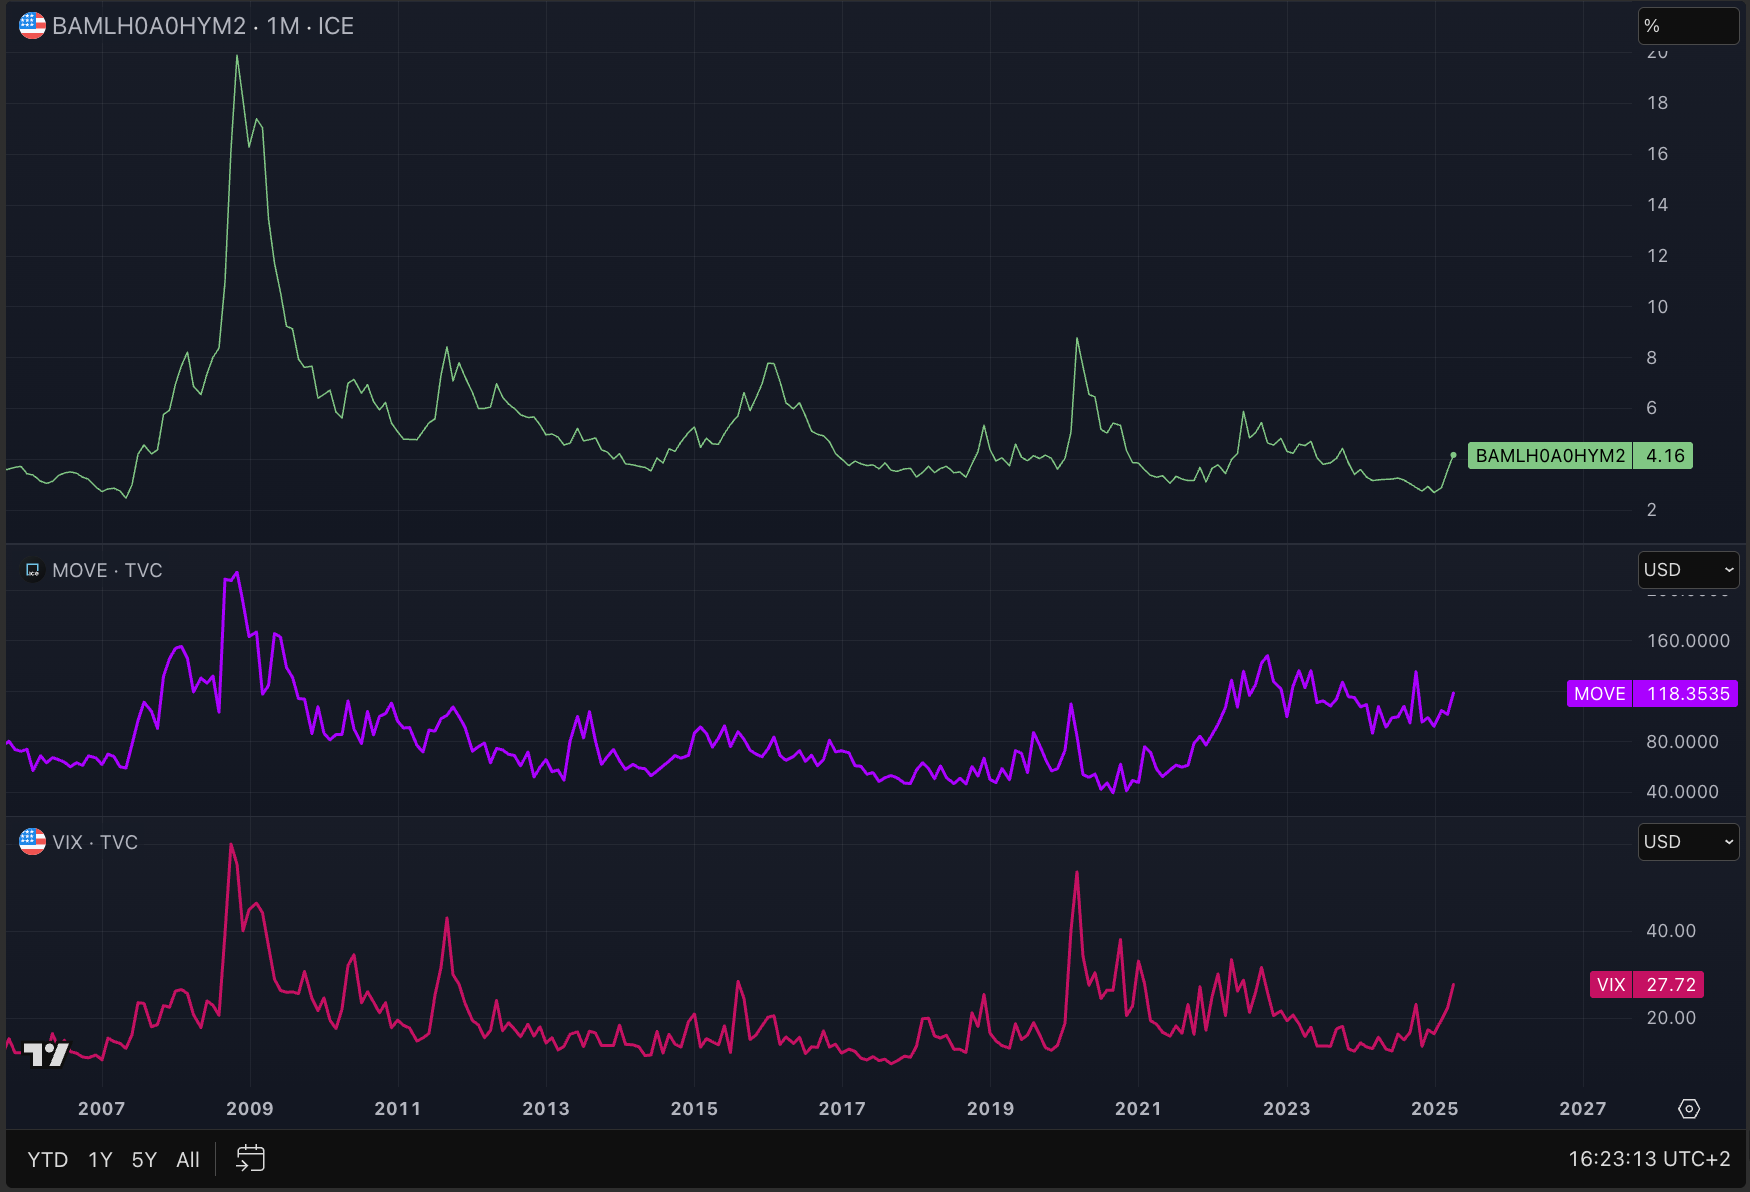
As long as uncertainty about Trump’s policies lingers, risk and volatility indicators will continue to hinder bitcoin and other risk assets from reaching new all-time highs.
These indicators reflect the degree of credit creation within the financial system. When risks spike, lending standards tighten, capital flow diminishes, and ultimately, there is less money available for investments.
For a sustained bull run, these indicators need to ease—and an end to the trade war could be key. In my view, once that barrier is removed, few obstacles remain for a new bull market, especially given the robust underlying economic data in the United States and the lack of any recession signals.
While we should not celebrate prematurely, these are the first signs that better times may be ahead for bitcoin and other risk assets.
Thank you for reading!
To stay informed about the latest market developments and insights, you can follow our team members on X:
- Bart Mol (@Bart_Mol)
- Peter Slagter (@pesla)
- Bert Slagter (@bslagter)
- Mike Lelieveld (@mlelieveld)
We appreciate your continued support and look forward to bringing you more comprehensive analysis in our next edition.
Until then!