
A Lower Bottom for Bitcoin at $55K
Bitcoin plunged to $55,000 overnight, its lowest level since September 2024, shattering the July low. Panic is everywhere, but with so much bad news priced in, the odds may be quietly tilting back in favour of the bulls.

This is a special edition of Alpha Markets following bitcoin's drop to $55,100 on 21 November, below the 1 July low of $57,700.
The past two weeks have been truly exceptional. You see a correction this deep roughly once or twice a year. But the way sentiment flipped and a liquidity crisis erupted is something you might see once every four years.
Let's start by setting the scene. For about six months now, investors have been on edge, gripped by worry and doubt about the ‘AI trade’. We can all see that AI is an extraordinary technology, but how will it affect financial markets? ‘Your guess is as good as mine.’
Three events were piled on top of that shaky foundation:
- First, the Fed meeting on 28 October, where Chair Kevin Warsh struck a hawkish tone, stressing that inflation will be fought at all costs.
- Then the midterm elections on 3 November, which left a Democratic anti-AI narrative as the aftertaste.
- Finally, on 12 November, the resignation of Jensen Huang. He is the linchpin of Nvidia, and Nvidia is the linchpin of the AI revolution.
That's the backdrop against which the following played out. Over the two weeks from Monday 9 through Friday 20 November, Fed officials took the stage almost daily, addressing high inflation in speeches and interviews, and at times even explicitly calling for an aggressive rate hike on 9 December.
The market's conclusion? The Fed is willing to inflict serious pain on the economy and financial markets to bring inflation below 2%. The potential price of this ‘victory’ is a recession and a bear market.
On Friday 20 November, it all culminated in a mass stampede for the exits. Broad-based de-risking. Everything was dumped, and there weren't many buyers to absorb the supply. Stocks, tech, gold, silver, bitcoin, crypto.
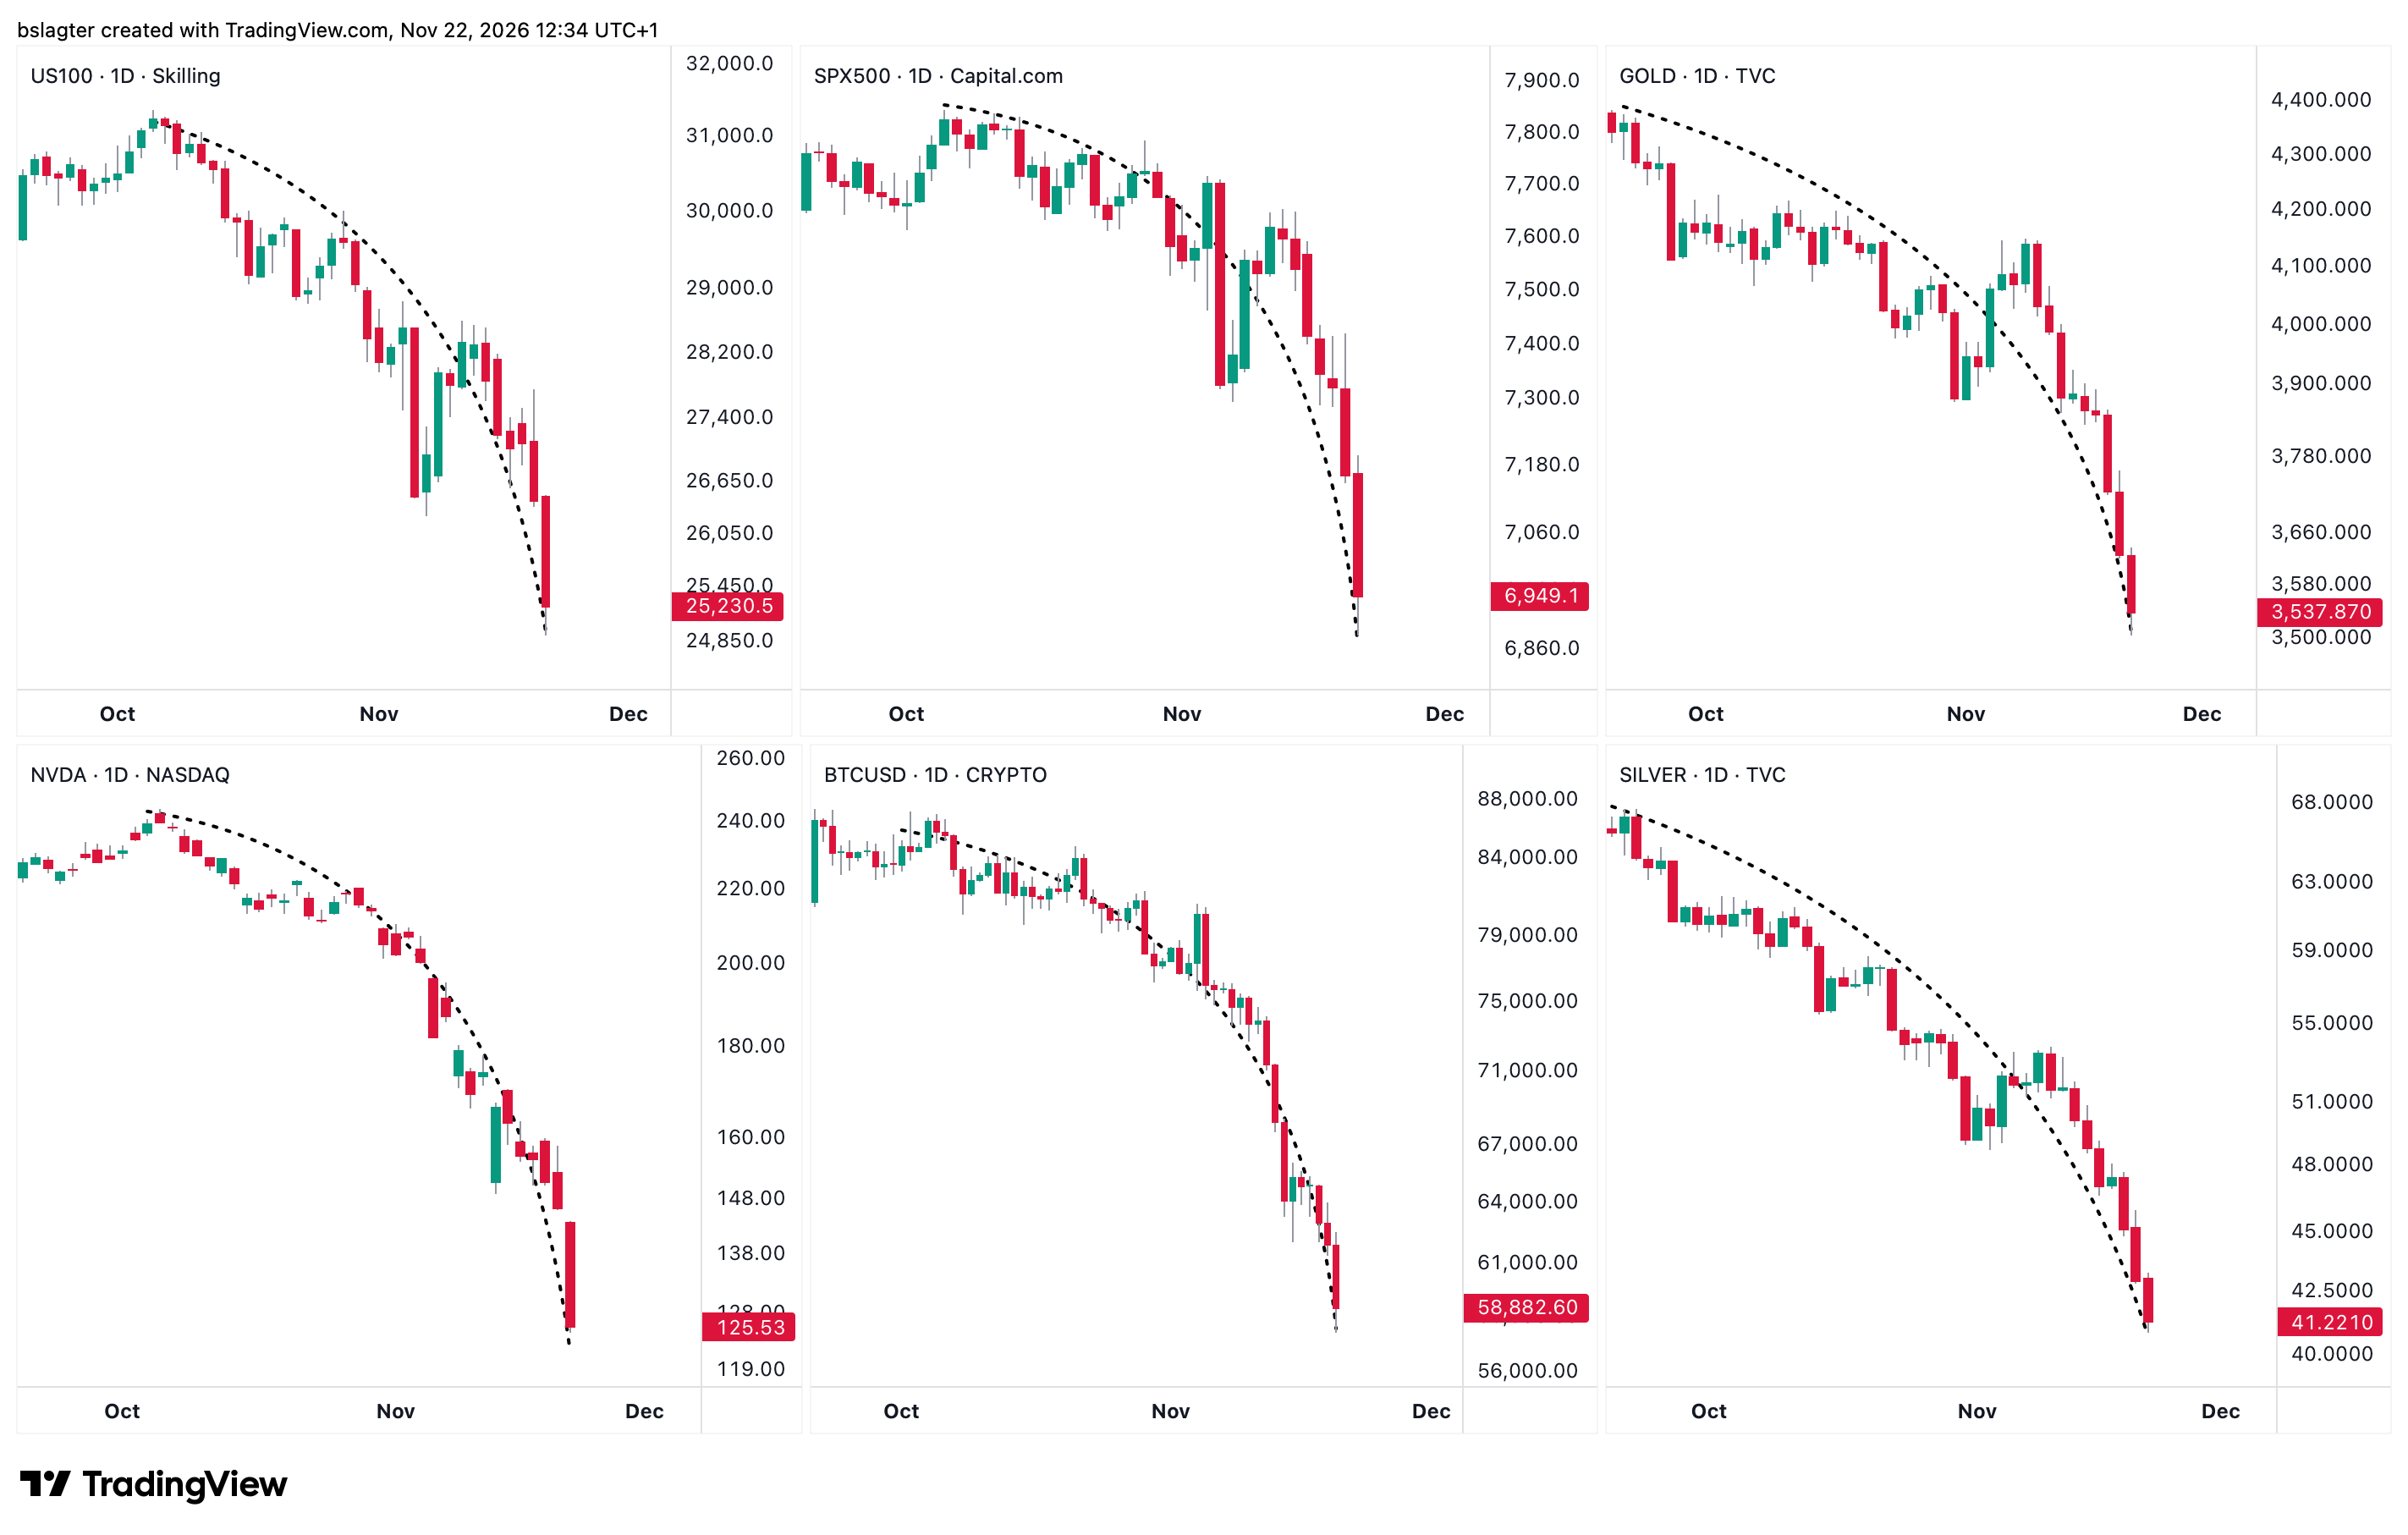
We sometimes talk about “what the market has priced in”. “Pricing in” means incorporating new information or shifts in expectations into prices. The key word is “shift”.
Suppose there is now a broad expectation that:
- AI will face stricter regulation
- AI will run into trouble because of Nvidia/Huang
- Investment in AI infrastructure will disappoint
- The Fed will hike rates aggressively
Then an awful lot has to go wrong to make things even worse, so that this new, even-worse information can be priced in.
Put differently, the balance between “potential disasters” and “potential upside surprises” is starting to tilt in favour of the surprises. And those are the moments with a favourable risk/reward ratio.
That's not to say we've definitely seen the bottom. Who knows what happens next week. Or the week after.
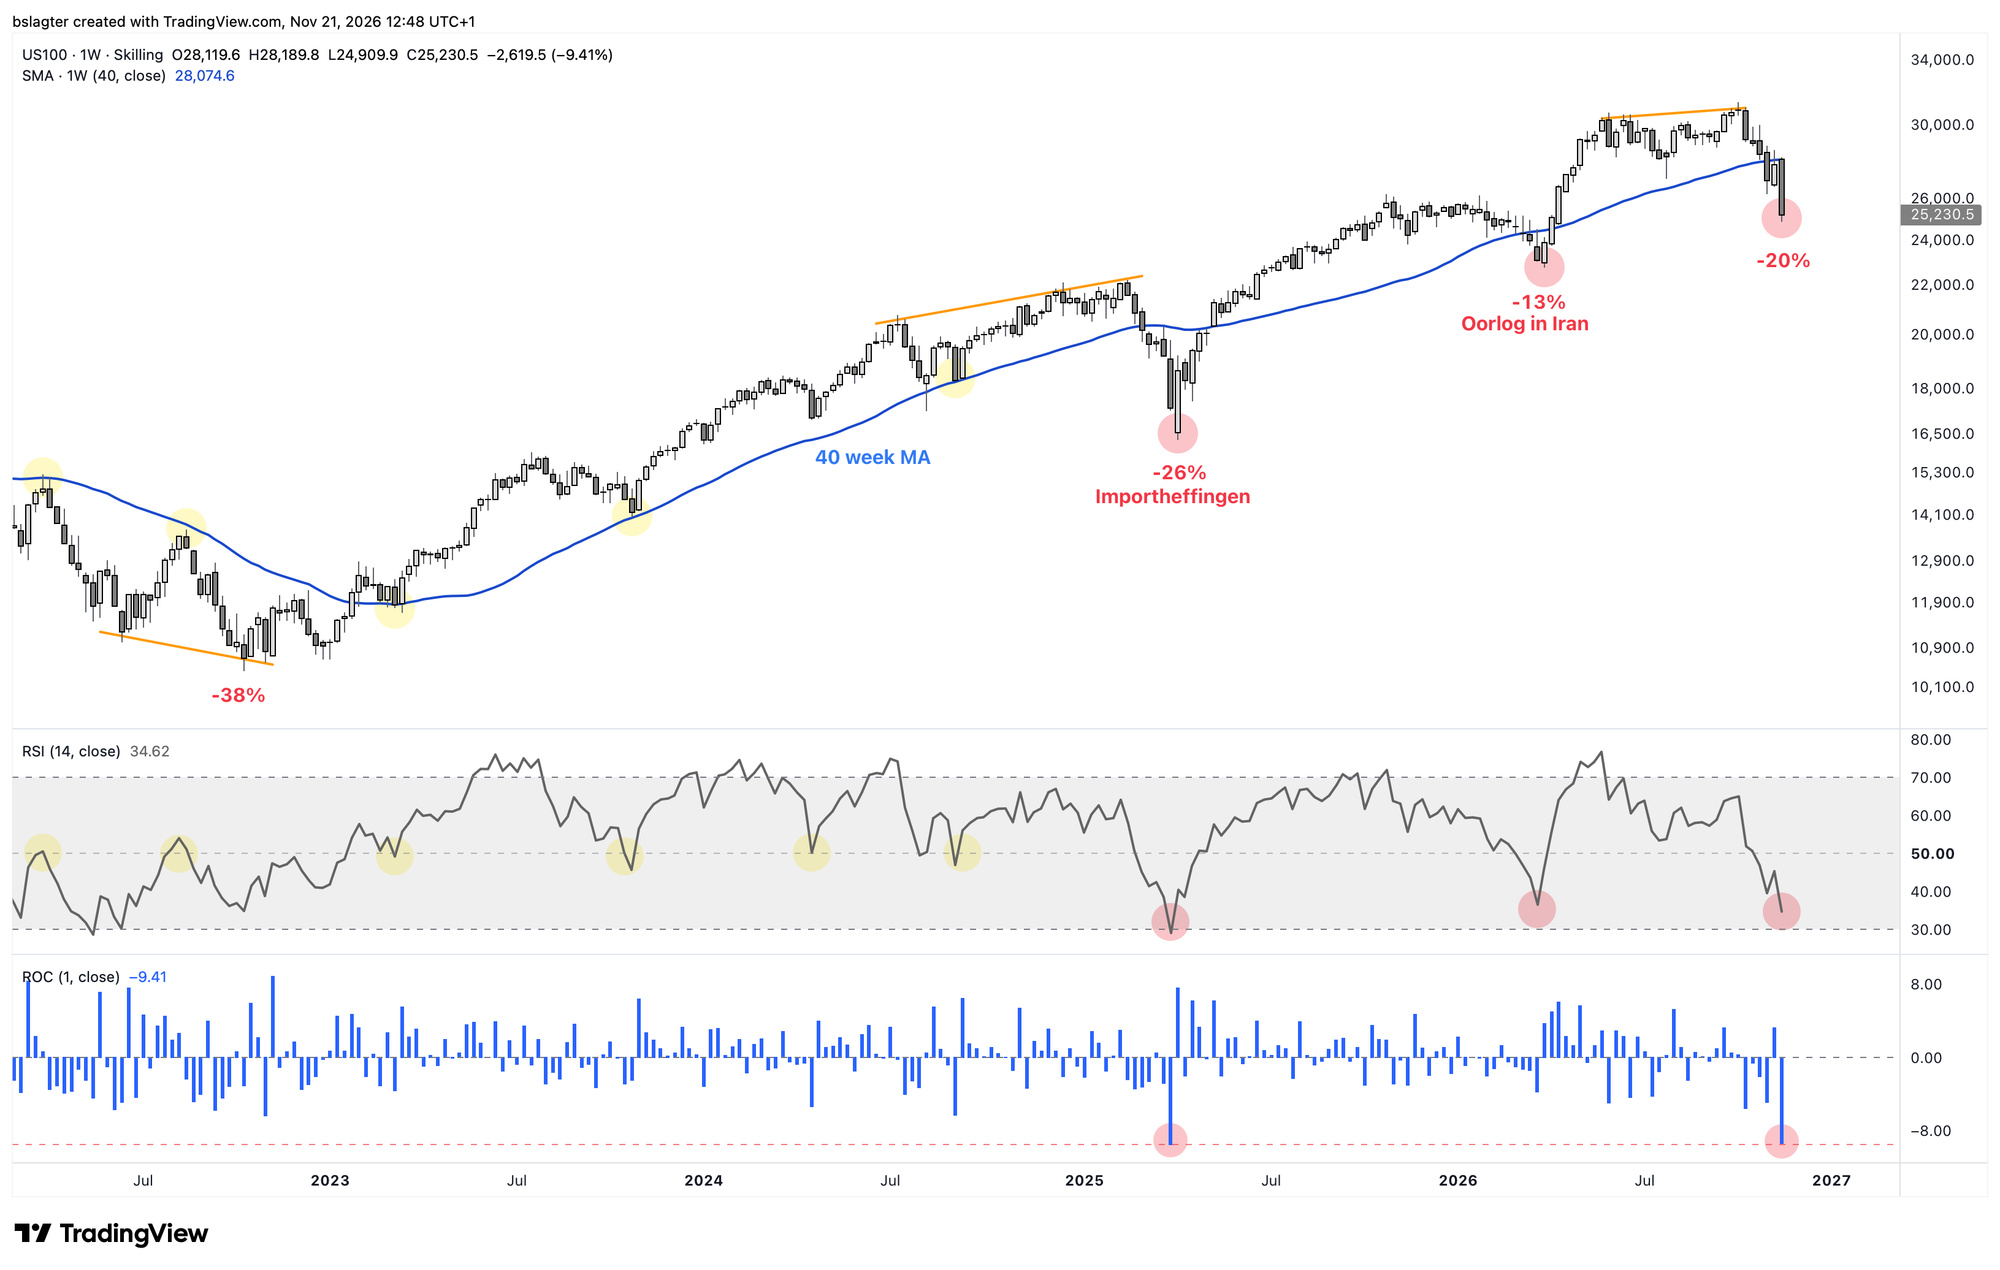
But after a week in which sentiment shifted to “the bubble has burst” and “we're heading into a deep bear market”, I also want to highlight the possibility that this remains a correction, like the ones we've seen several times in recent years. Think of spring 2025 with the tariffs, or spring 2026 with the Iran war.
Is this the bottom? Will it stay a correction? Nobody knows. But it doesn't need to go much lower.
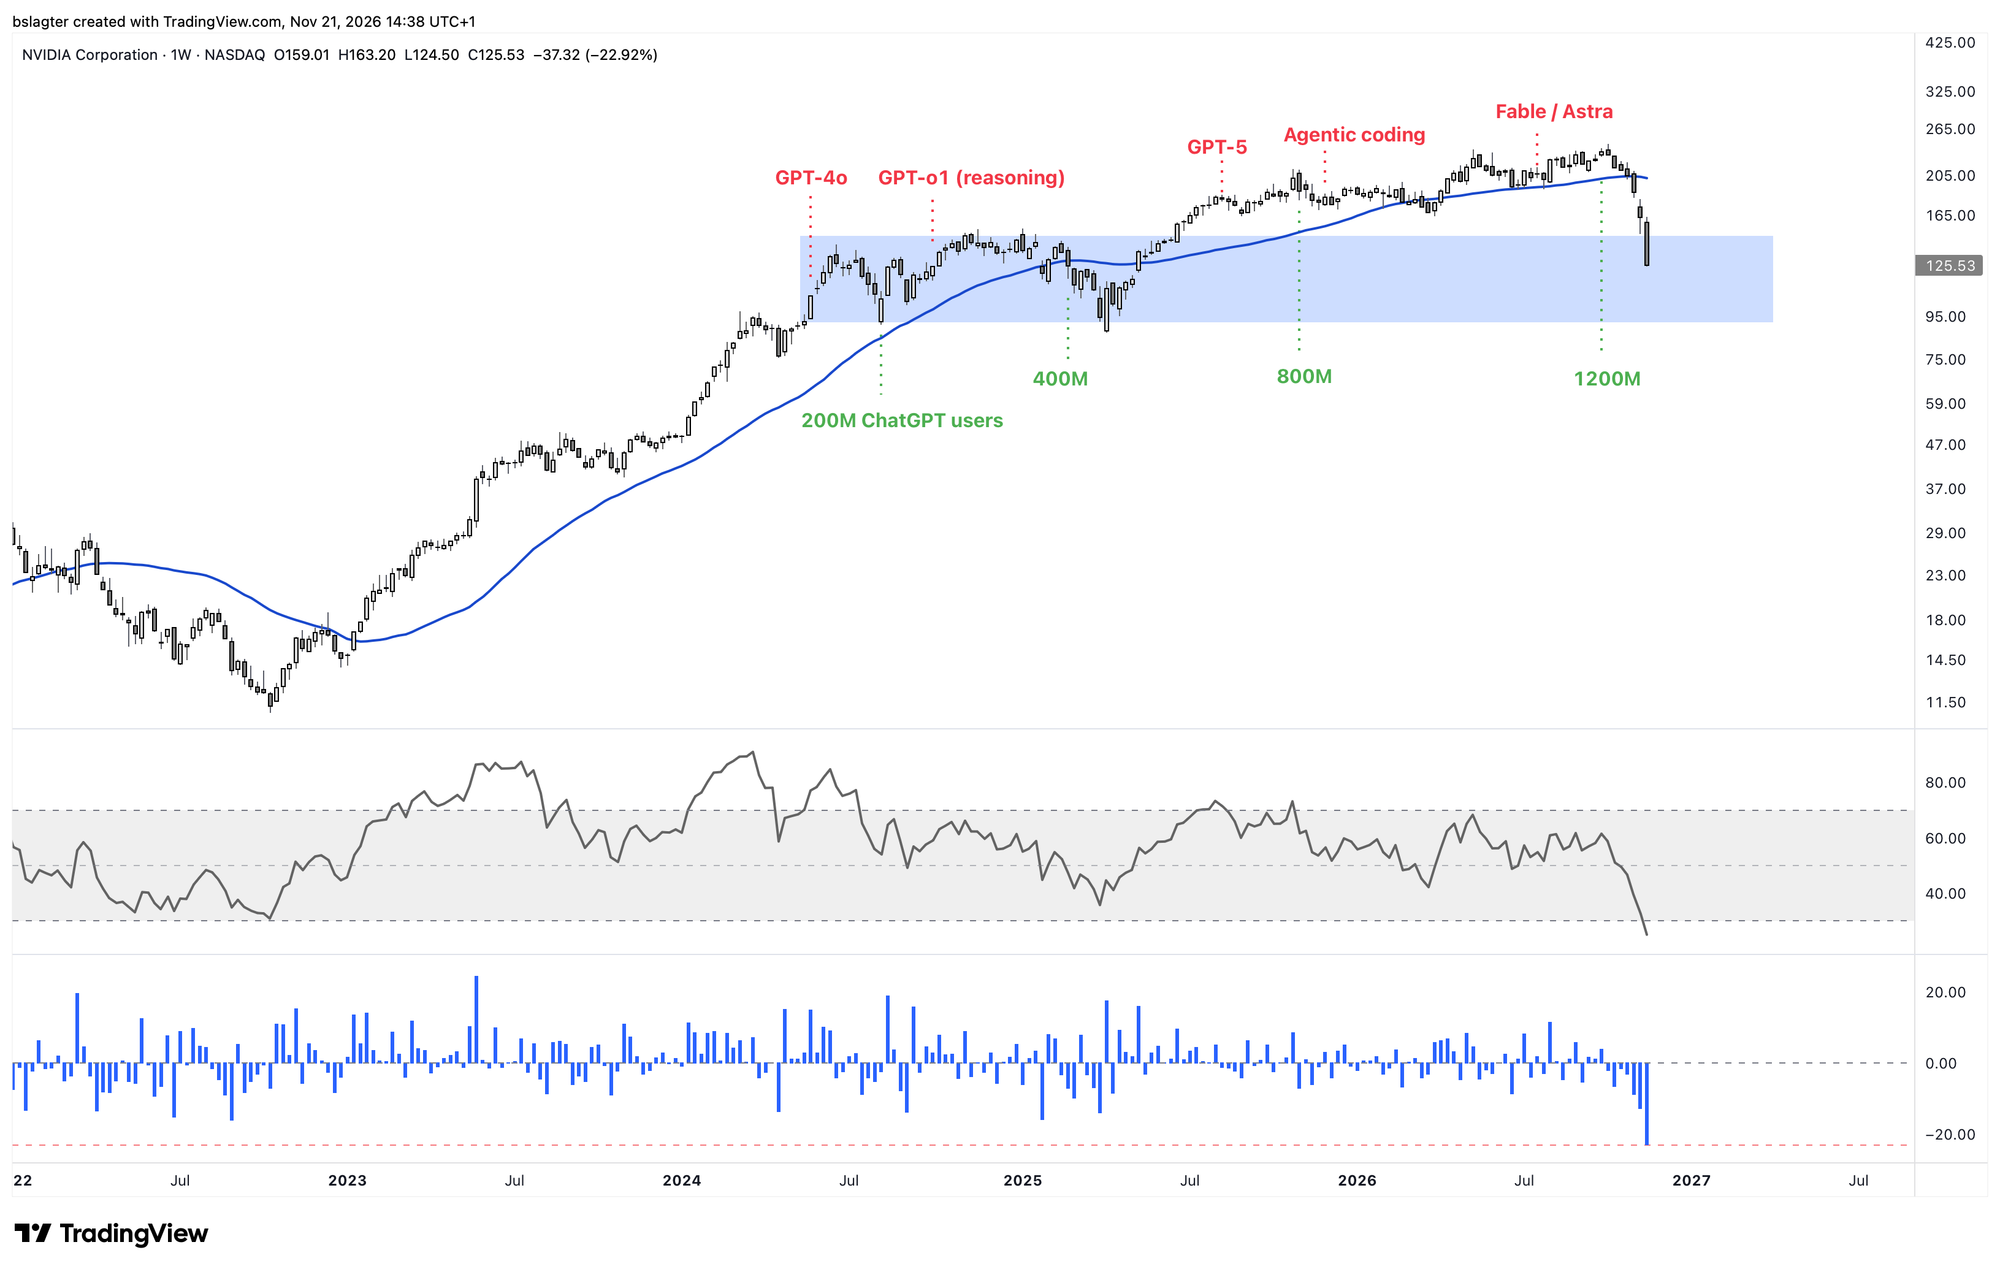
Let's pull up the Nvidia chart. At the bottom, we see the biggest weekly drop since 2008 and the lowest RSI reading since 2008. The share price now sits 49% below its early-October peak.
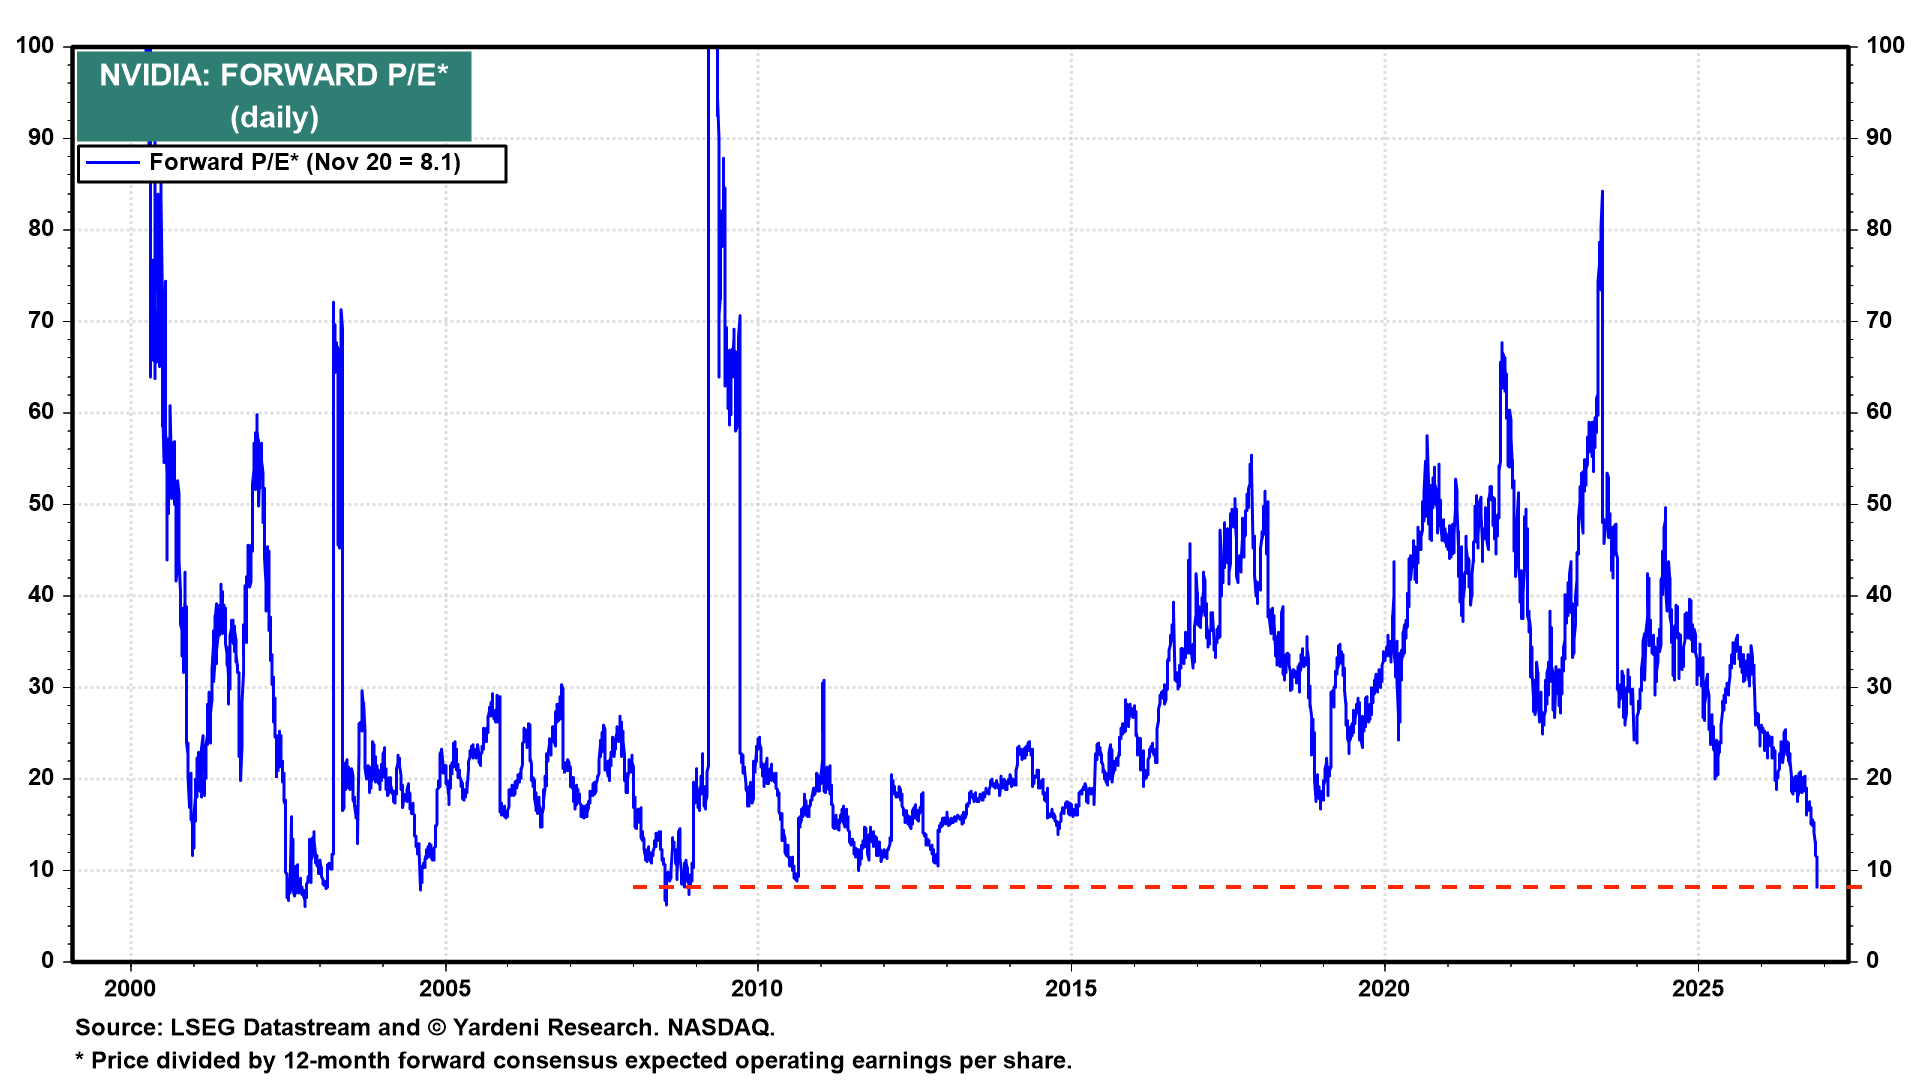
My sense is that the pessimism is overdone:
- At the current share price, the company has a total market cap of $3.0 trillion.
- Expected net income for FY2027, ending 31 January 2027, is $235 billion.
- Expected net income for FY2028, ending 31 January 2028, is $402 billion.
That works out to a price-to-earnings ratio of 7.5 to 13. That's very low. Far below the average for tech stocks, and the lowest since the 2008 financial crisis. That can mean one of two things: either earnings are about to collapse, or the stock is very cheap.
I think AI matters so much to the US (geopolitically and economically) that they'll keep their foot firmly on the accelerator. At most they'll ease off slightly to spend a little extra time on safety, but that's it.
And in that scenario, demand for ‘compute’ is going to get much, much bigger. In this interview, Elon Musk talks about Terafab. He expresses annual AI chip production in gigawatts (GW). This year, around 25 GW will be produced—meaning that if you plugged in all those chips, they'd collectively draw 25 GW of power.
He expects the entire world combined to produce roughly 35–45 GW worth of chips in 2027. According to him, that's nowhere near enough. It should quickly scale to 1,000 GW per year.
I'm seeing more analysts forecast 10x, 20x, 30x growth over the coming years. Demand for compute will vastly outstrip supply for years to come. Production will need to double every year for years on end.
It won't just be general-purpose AI chips for large data centres, like Nvidia's Vera Rubin line, but also specialised AI chips for smartphones, cars, drones and robots. Of course, Nvidia won't be the only one making those chips—in fact, Musk is going to make them himself at his Terafab.
Either way, there's a solid case to be made that Nvidia at $125 a share is a bargain, especially over the long term. And along with Nvidia, other AI stocks too.
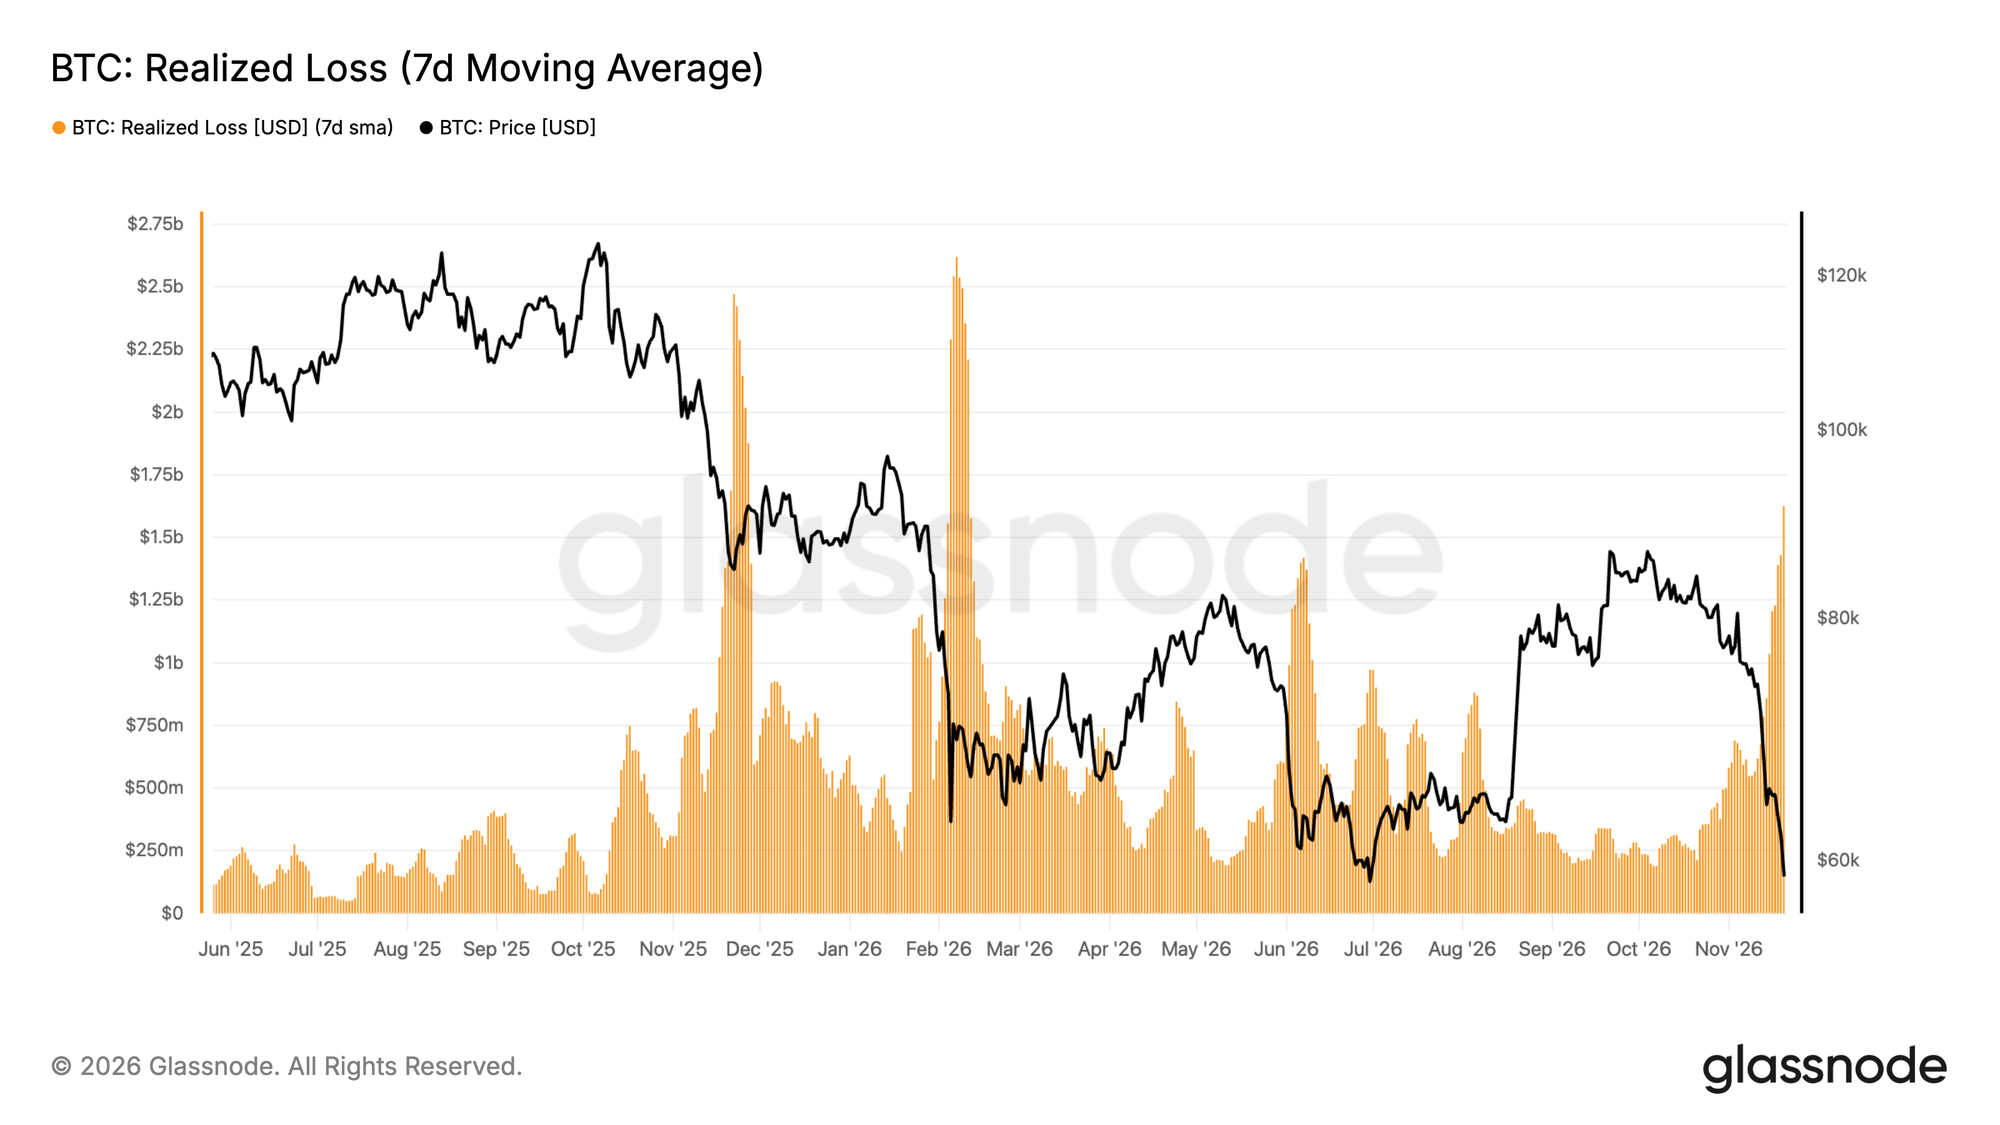
Now let's look at bitcoin. The fourth capitulation is a done deal. We discussed this in the last two editions of Markets. All the hallmarks are there:
- Accelerating price decline
- Significant trading volume
- A spike in realised losses (on-chain)
- A spike in liquidations (derivatives)
- Deeply negative sentiment
The 7-day moving average of realised losses is now higher than in June.
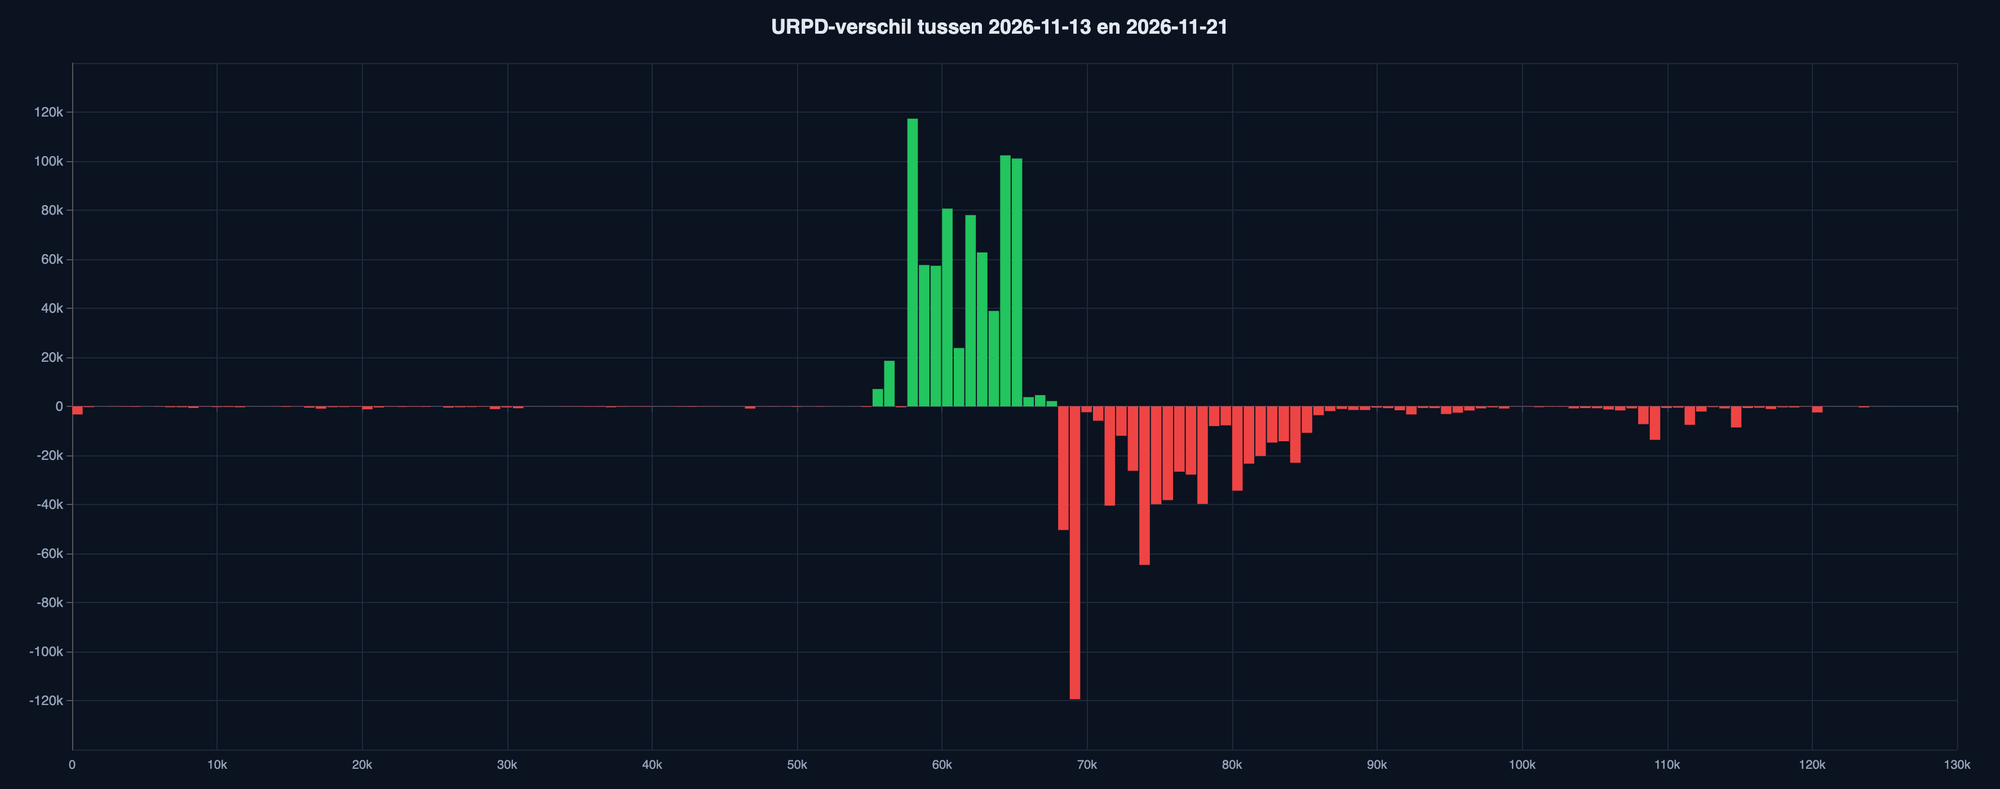
The sellers are mainly players who bought in around 70k. Plus, over the last few days, some people who bought near the top. The older investors who got in at much lower prices—the OGs—sold nothing.
I take that as a sign that there's no fundamental problem with bitcoin, and that what we're mostly seeing is (short-term) investors reducing risk across their entire portfolio.
But however you slice it, during the night from Friday to Saturday the price fell to $55,100, below the $57,700 low of 1 July.
The scenario in which 1 July marked the bear market bottom is off the table. In other words, we need to update our scenarios.
This is where we stood:
- 50% - a new bull market (= 57.7k remains the bottom)
- 30% - a mild, prolonged bear market (= a slightly lower bottom)
- 20% - a deep, prolonged bear market (= much lower bottom(s) in 2027)
Note that the top two are both variants of the “mild bear market” scenario as we framed it in November 2025.
I've said this often in recent months: we're seeing plenty of signs that we're transitioning from a bear market to a bull market. That leaves two options: either the 57k of 1 July was the bottom, or it will come in the months ahead.
Well, the “1 July was the bottom” option is now gone. I'd now split the odds like this:
- 70% - a mild, prolonged bear market (= a bottom between 48k and 57k)
- 30% - a deep, prolonged bear market (= much lower bottom(s) later in 2027)
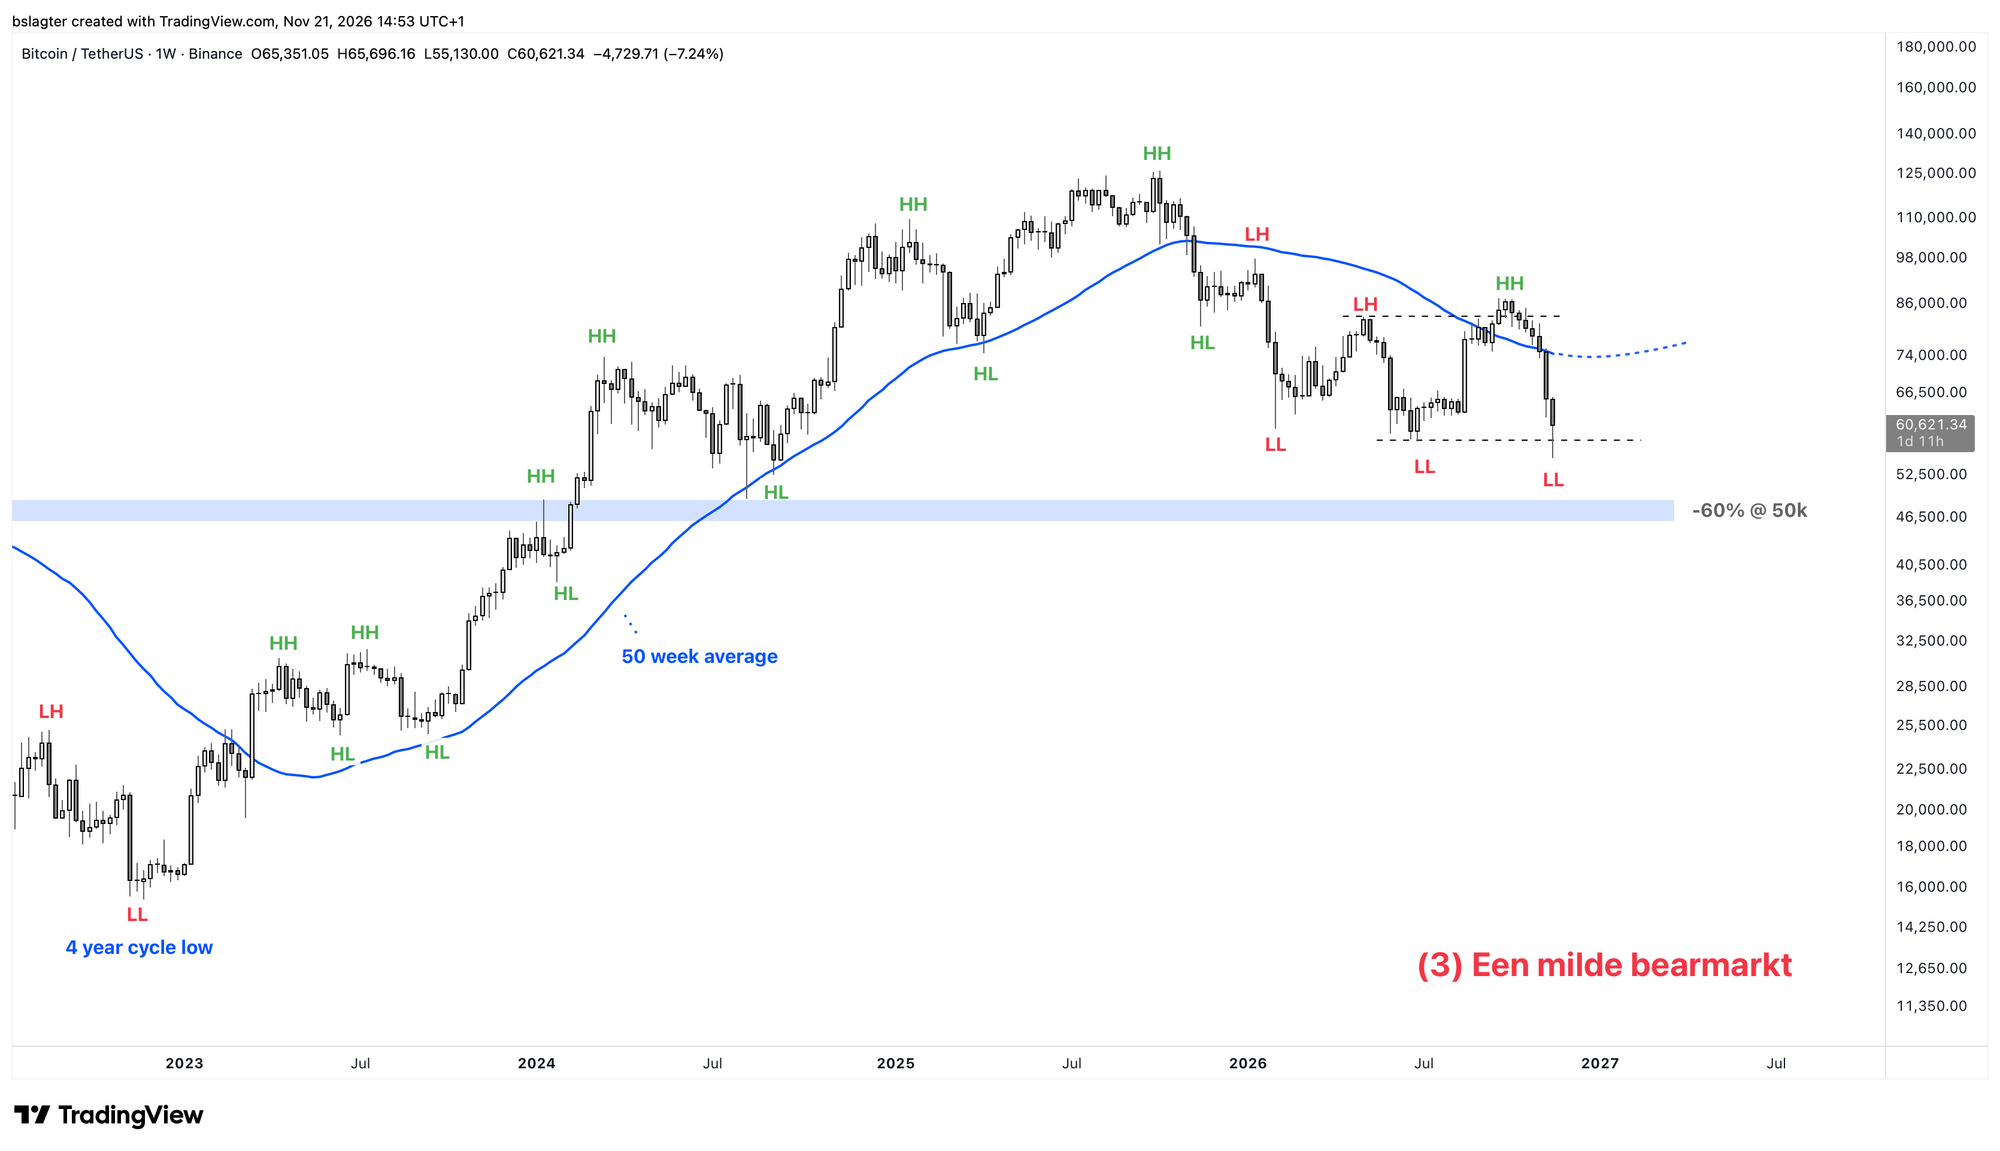
How optimistic I remain will depend heavily on the coming weeks.
- Do we recover quickly from here? Then we'll read this as a double bottom (57k in July + 55k in November) and a clean transition from a downtrend to an uptrend on the weekly chart.
- Does the mood in financial markets stay sour? Then a further drop to $48,000 would still fit within the “mild bear market” scenario.
- Does the turmoil in financial markets escalate, tipping stocks into a bear market? Then the “deep, prolonged bear market” scenario comes more sharply into focus.
Personally, I'm in no rush to buy. Let's see what things look like once the dust has settled.
If I see evidence that we're leaving a local bottom behind us, and confidence, optimism and liquidity return to the market, then I'm interested in tech stocks (such as Nvidia, Google and Microsoft) and bitcoin.
For gold (and especially silver), I first want to see more evidence that the decline from the January peak is over. Gold prices between $3,000 and $3,500 are interesting if you expect the bull market to resume.
Finally, a word on the checkmarks.
They're meant to track progress in the transition from bear market to bull market—the shift from a downtrend on the weekly chart to an uptrend.
And now we have an interesting combination of a higher high (HH) and a lower low (LL). I don't think it matters much whether you start again from zero or leave two checkmarks in place. Either way, the transition from bear to bull market isn't complete yet.
Here's how I'm keeping it:
✅ A weekly close above the 50-week moving average
✅ A higher high (HH) above the $83,000 of 6 May
⏹️ A higher low (HL) above the $55,100 of 21 November
⏹️ That moving average turning from falling to rising
But all the checkmarks do go if we make a lower high (LH) below the $87,000 of 21 September.
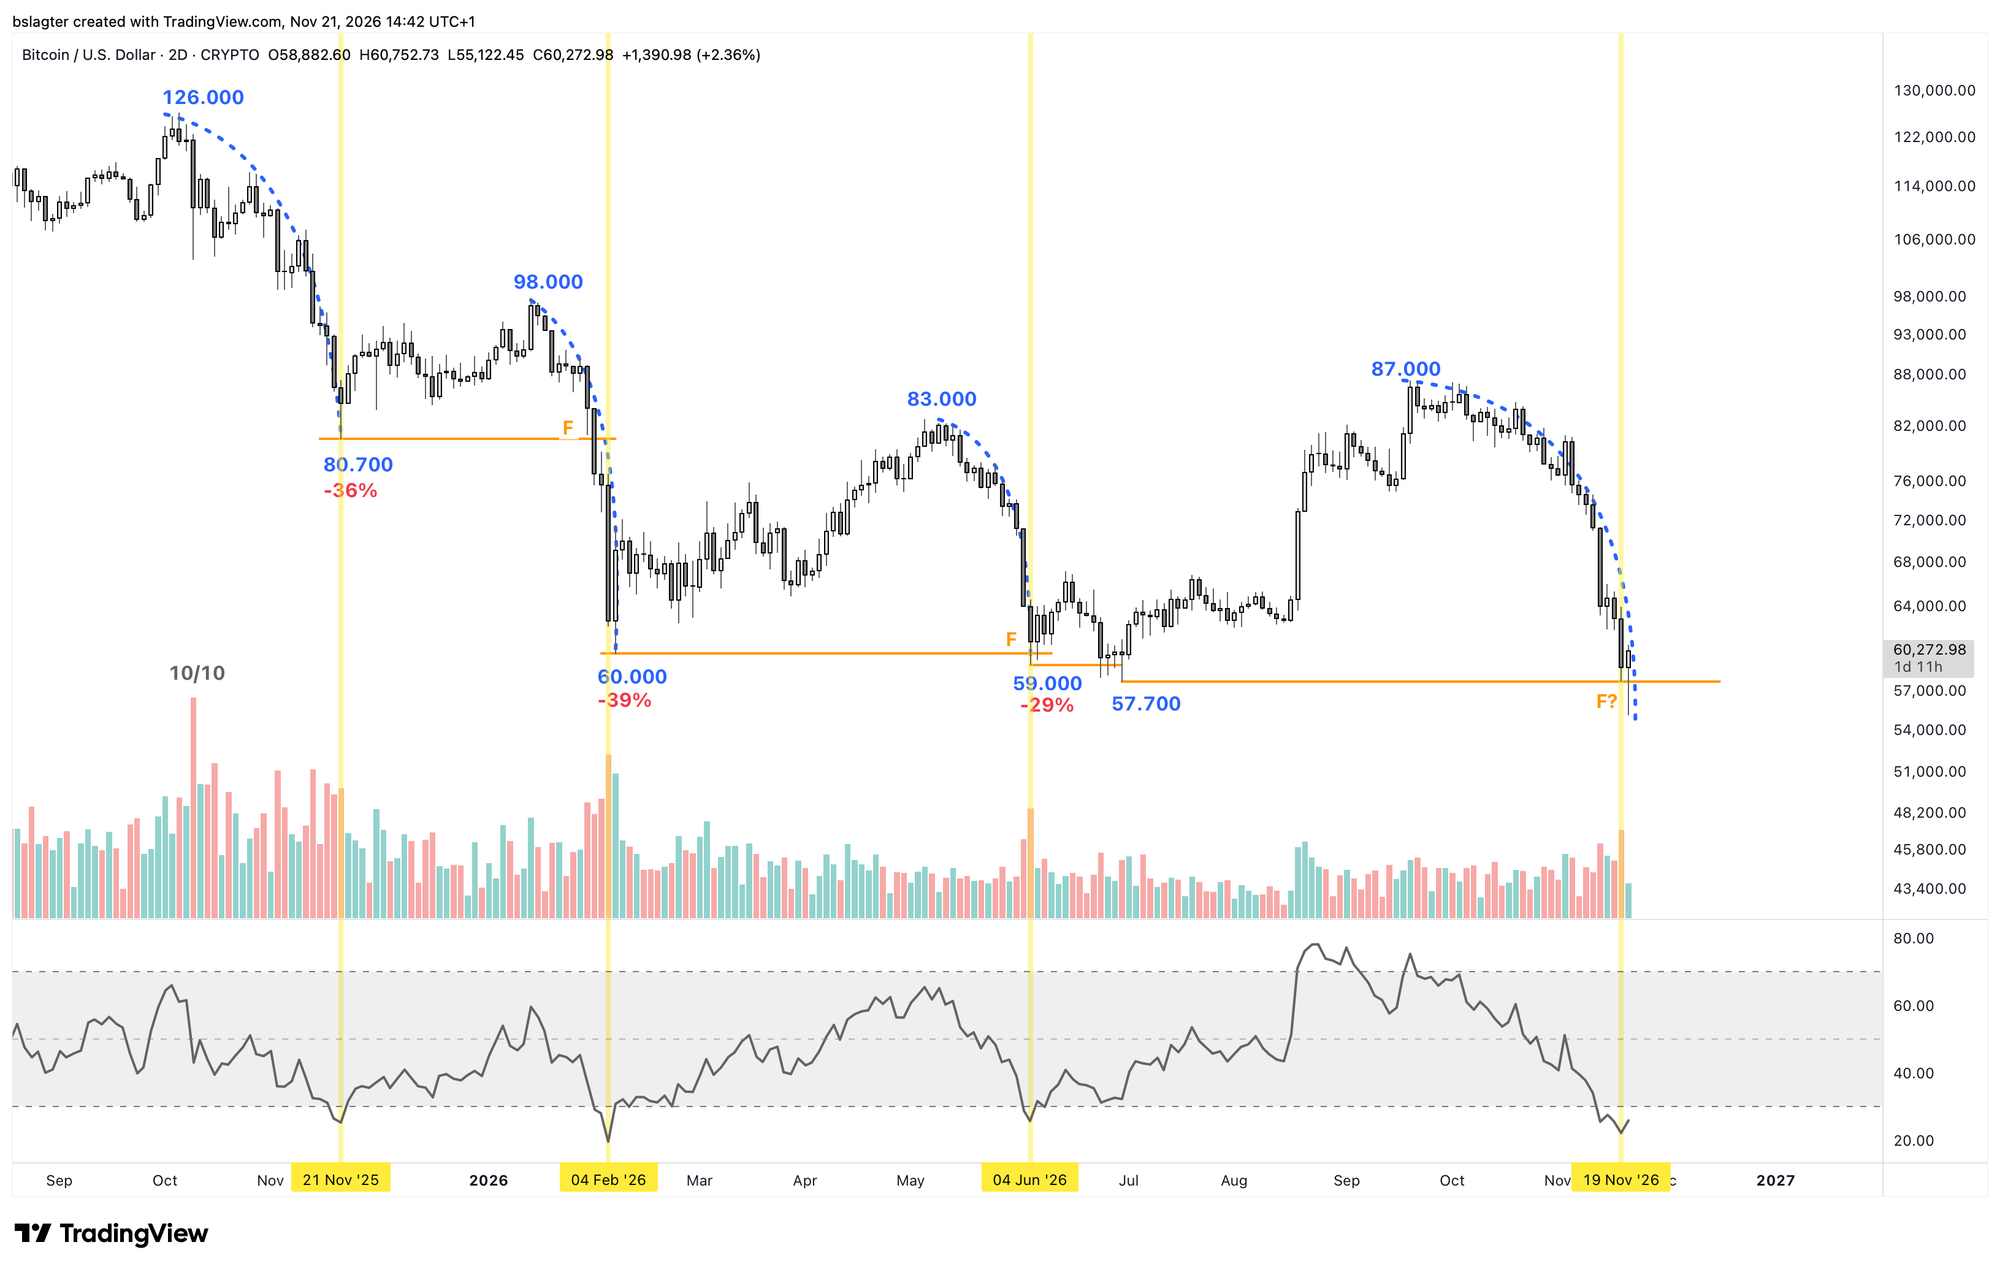
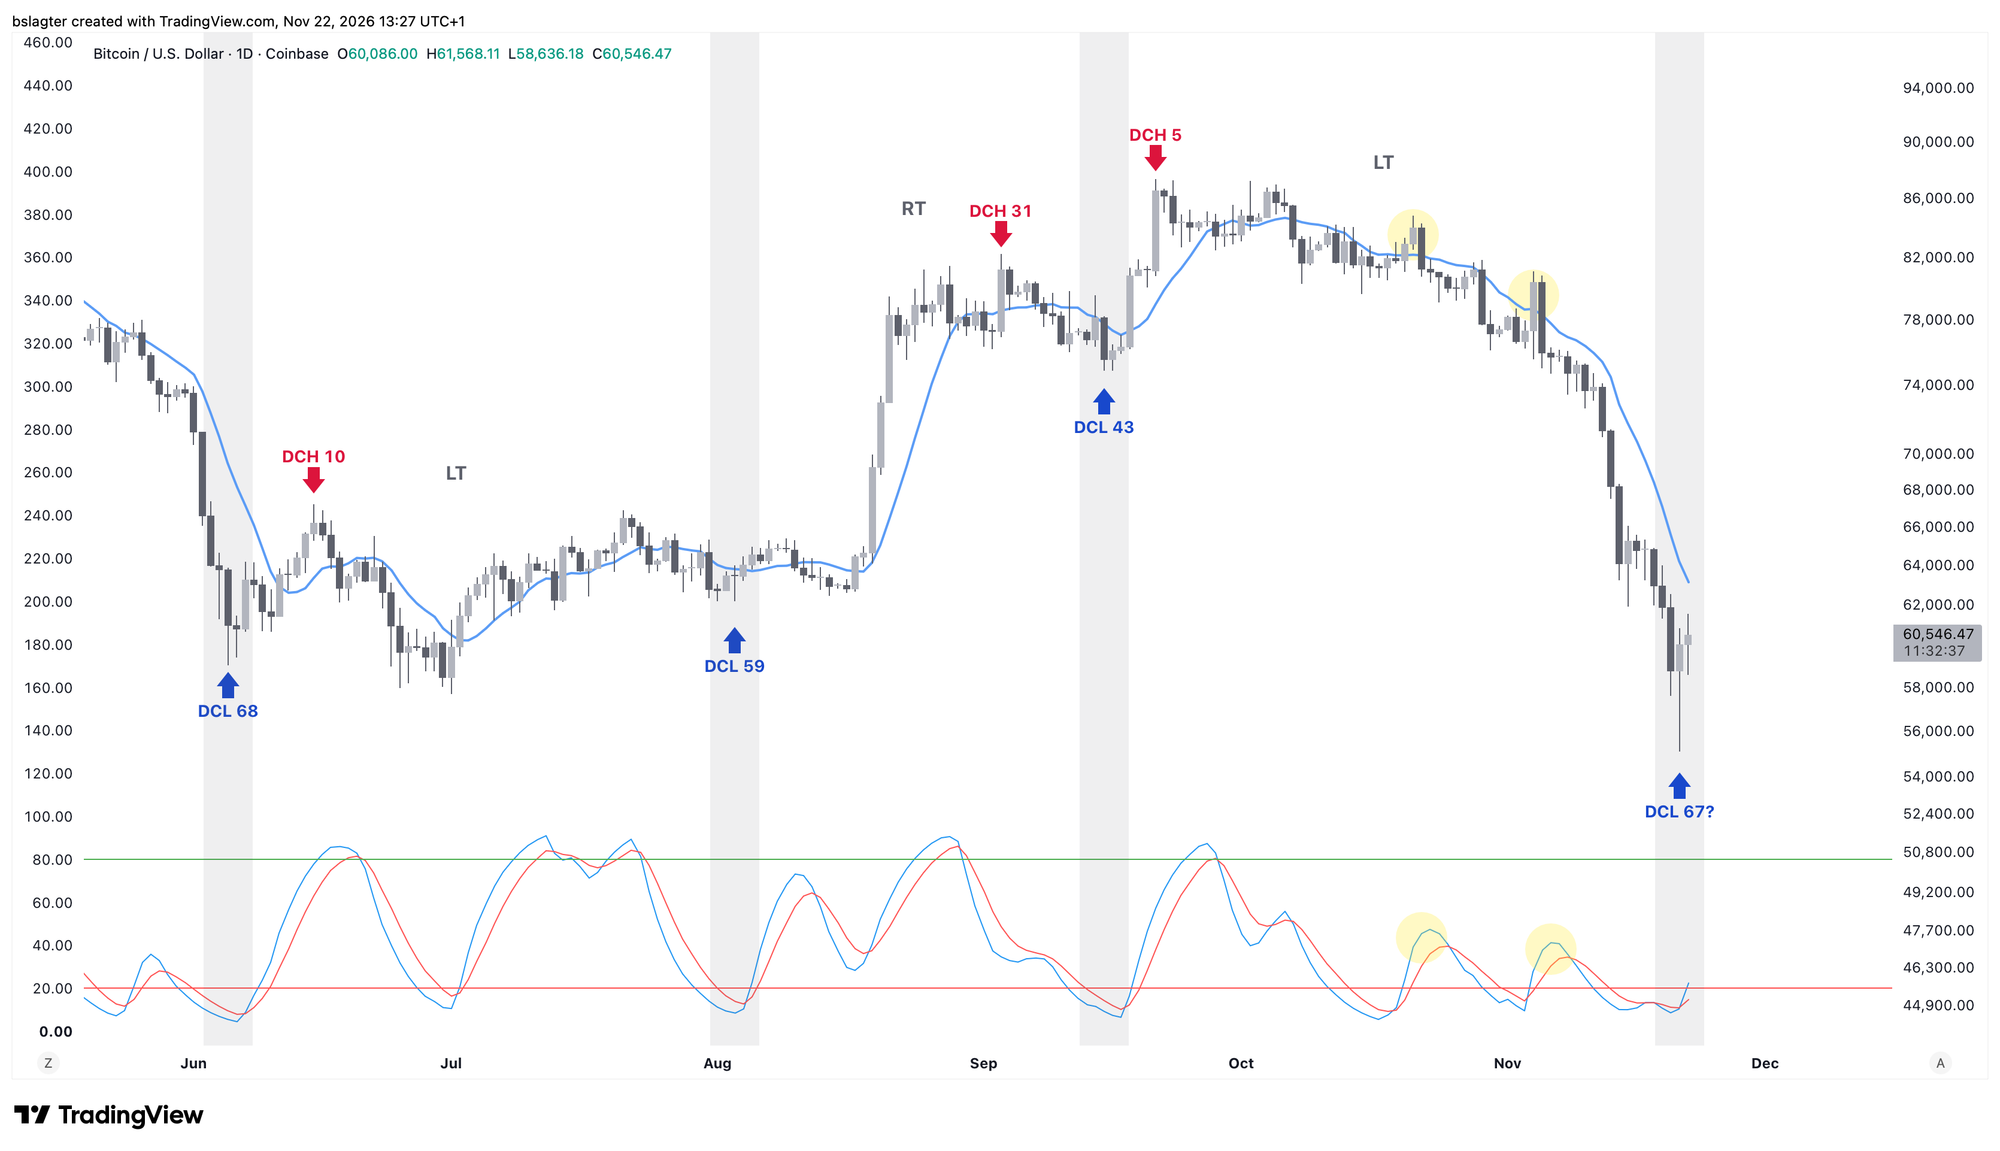
Let me wrap up with a bitcoin chart showing the daily cycle. It's been tricky to interpret for a while now. But this drop could well become a useful reference point. The provisional bottom would then fall on day 67, which is perfectly reasonable for a daily cycle.
Before drawing any conclusions, we first want to see the usual signals of a new daily cycle, such as a daily close (and further acceptance) above the 10-day moving average, currently at $63,100.
After that, we'll also look at where the weekly cycle stands. I'll give an update in Markets on Friday, and possibly sooner in Discord.
Have a great week!
In closing
You can read all previous editions of Alpha Markets in the archive. Questions, comments and suggestions are always welcome in the community.
Thank you for reading!
To stay informed about the latest market developments and insights, follow our team members on X:
- Bart Mol (@Bart_Mol)
- Peter Slagter (@pesla)
- Bert Slagter (@bslagter)
- Mike Lelieveld (@mlelieveld)
We appreciate your continued support and look forward to bringing you more comprehensive analysis in our next edition.
Until then!