
A Fourth Capitulation for Bitcoin?
Bitcoin took a beating this week. While stock markets eagerly bounced back, bitcoin kept tumbling, slipping below its key 50-week average. Is a fourth capitulation of this bear market unfolding, or is a golden entry point taking shape?

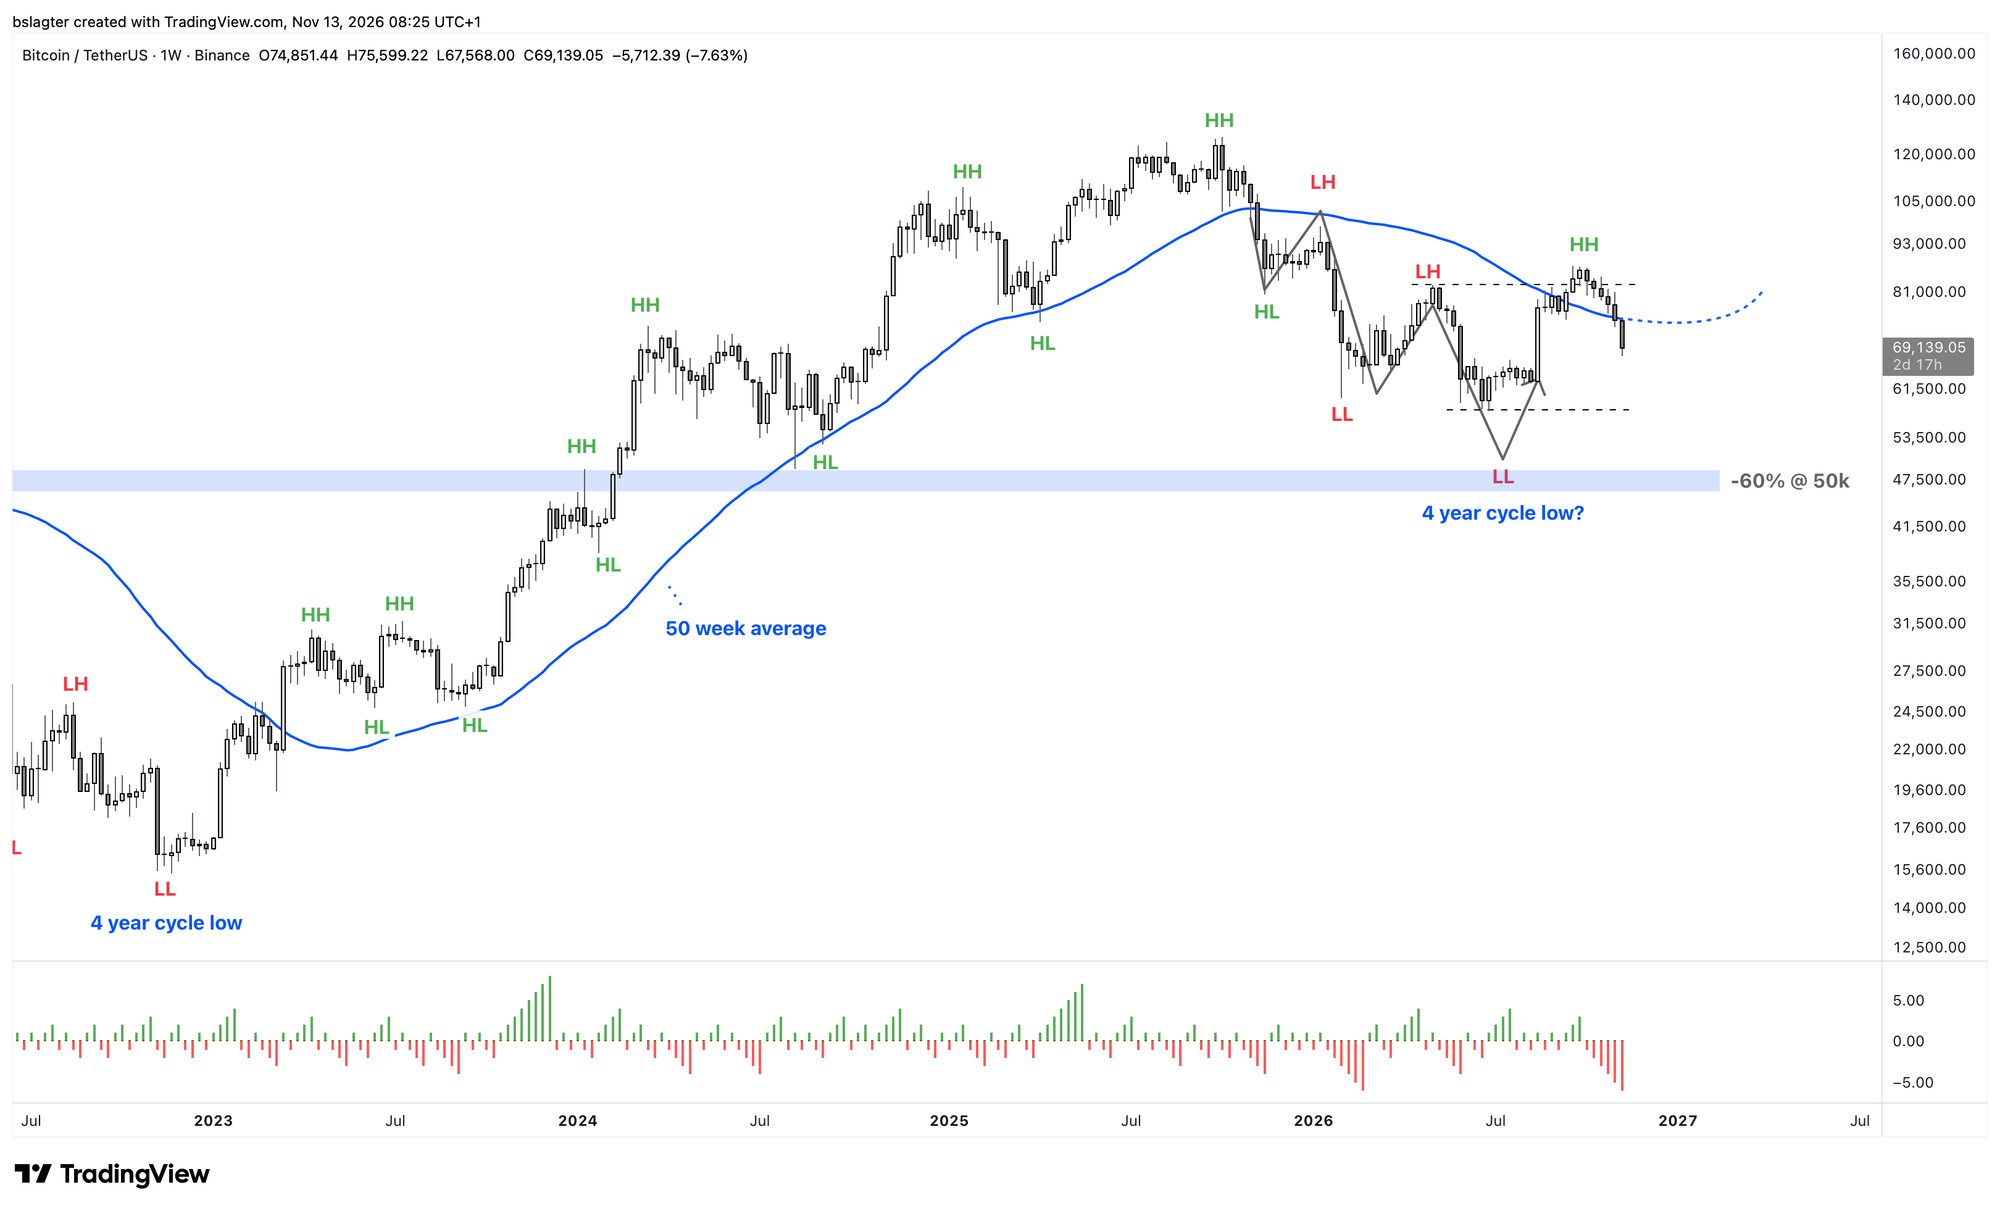
On September 21, bitcoin posted its first weekly close above the 50-week moving average in ten months. Time to release the handbrake, we wrote. And not just because the average had been reclaimed, by the way. A broad range of indicators pointed to a transition from bear market to bull market.
The handbrake was the first checkmark. On October 2, we could tick the second box thanks to a weekly close and a monthly close above the May 6 high of $83,000. Things were looking bright.
✅ A weekly close above the 50-week moving average
✅ A higher high (HH) above the $83,000 of May 6
⏹️ A higher low (HL) above the $57,700 of July 1
⏹️ A change in the direction of that average from falling to rising
We were also quick to point out that we had landed in a fragile position. With prices around 85k, we weren't trading far above the 50-week average at 75k. If this was the top of the weekly cycle, it was almost inevitable that we would drop below 75k on the way to the weekly cycle low.
At the end of October, we put it like this:
The route with the higher high is strongly preferred, and not just because we simply like higher prices. It offers the chance to put some distance between price and the dominant average, and to put that average back to work as support in the bull market.
That didn't happen. We're now in the sixth consecutive week of decline. A rare streak. And on top of that, the price has fallen below the 50-week moving average.
Does this mean we have to hand our checkmarks back?
The checkmark for the higher high (HH) above $83,000 stays put regardless. The checkmark for the average is up for debate. You could argue that it's not just about breaking through the average, but also about the average functioning as support.
The risk of that view is that we place too much weight on the dominant average as an indicator. It isn't infallible. Every now and then there are false positives, where you get a signal that later turns out to be no signal at all.
You can reduce the number of false positives by choosing a longer average. But then you also get your signal later. It's a trade-off between accuracy and timeliness. In the chart below, you can see at which moments the signal was right (green) and (temporarily) wrong (red).
It's a textbook case of “all models are wrong, but some are useful”.
Despite its fallibility, the roughly one-year average has proven to be a pretty useful tool. As a guide to the trend on the weekly chart. As support in bull markets, resistance in bear markets, and a reasonable indication of a trend reversal.
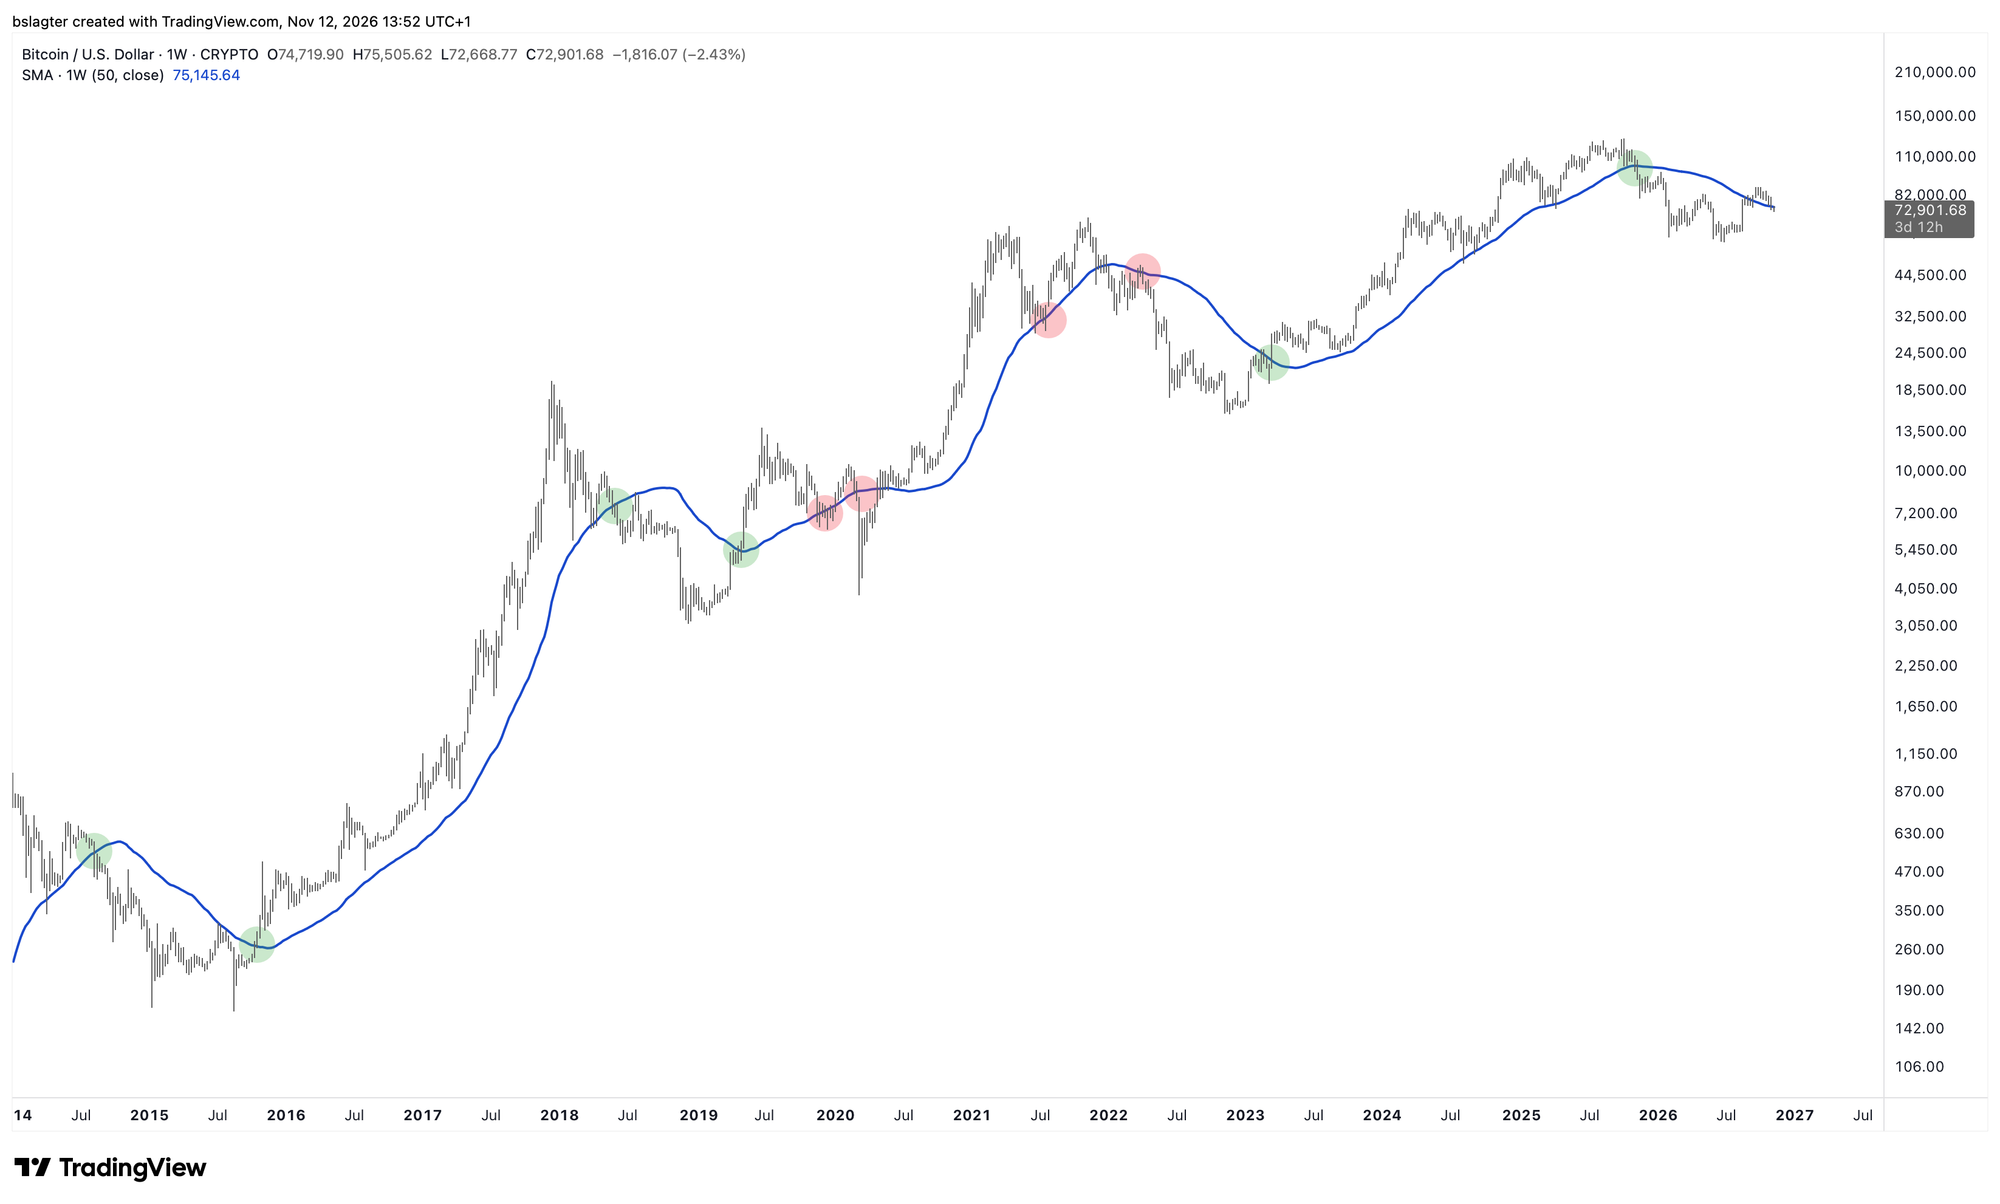
In 2021 and 2022 these were brief deviations; in 2021 it was no more than a few dollars and a single week. If you squint, it was simply a nice test of support. But a signal is a signal, right? Should the checkmark go?
The four-checkmark checklist sits within the context of the market cycle, where we're looking for the transition from a downtrend on the weekly chart (bear market) to an uptrend on the weekly chart (bull market). And in that context, the first weekly close above the average after a bear market is a perfectly good progress indicator.
In other words, both checkmarks stay. Now we'll watch whether the next weekly cycle low (ICL) produces a higher low (HL) above the $57,700 of July 1. That's the third checkmark.
Of course, there's a scenario in which we don't get that third checkmark and instead see a lower low (LL) below $57,700. Then we'll have to conclude that the higher high (HH) above $83,000 was an anomaly, and the weekly close above the average a false signal. In that case, we're back to zero checkmarks.
The chart below shows the three major capitulations of this bear market. In the previous bear market of 2022, we gave them names: Luna, BlockFi and FTX. This time, it's harder to slap a label on them. We know them by their dates: November, February and June.
It's quite possible that a fourth capitulation is now being added to the list. Let's take a look.
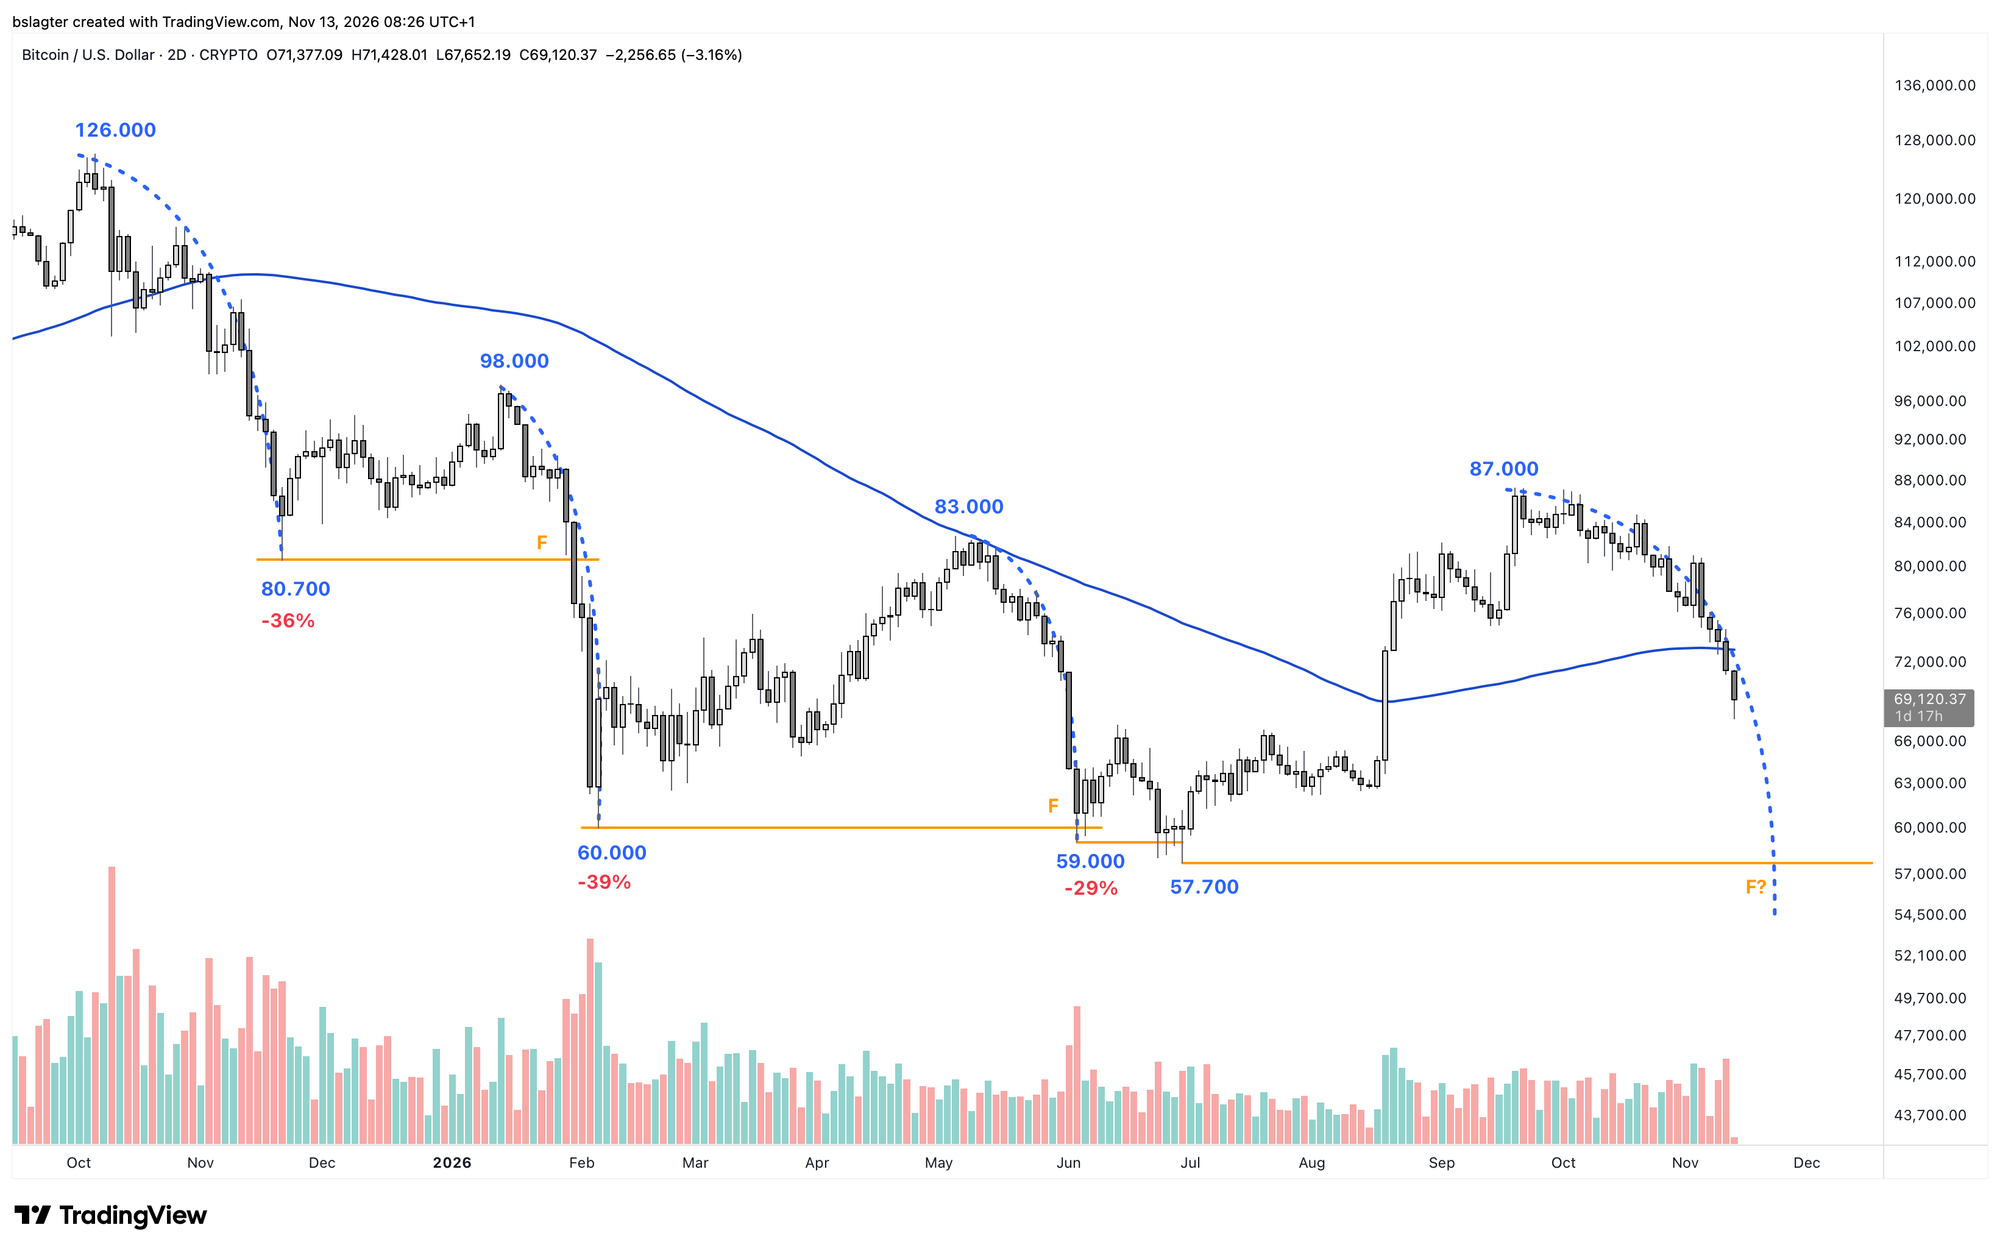
The shape of the chart already looks quite similar to the earlier capitulations. But the spike in trading volume is still missing. And in the chart below, we can see that realized losses haven't yet shown the spike that typically accompanies capitulations either.
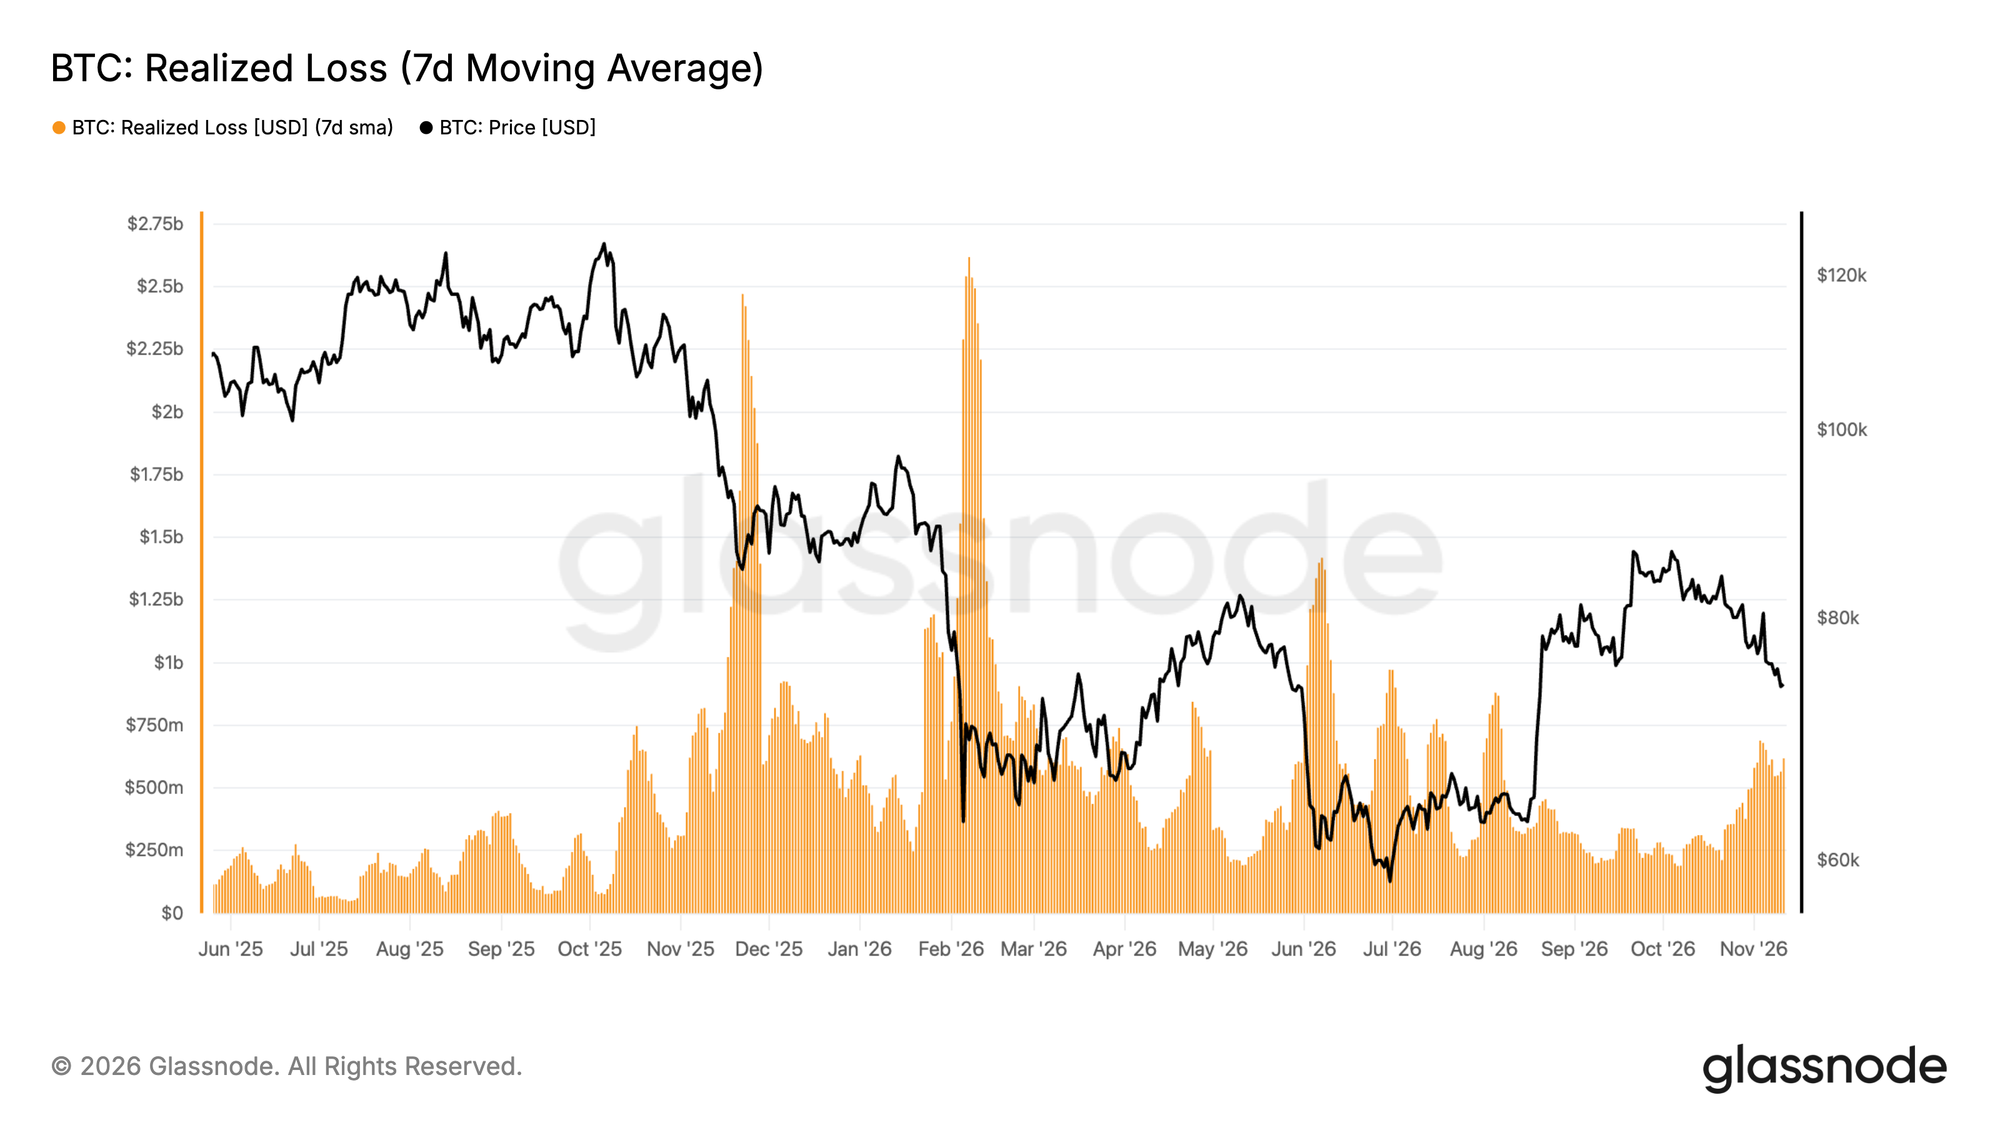
There isn't enough evidence yet for a typical capitulation, even though sentiment is pretty grim. So let's not get ahead of ourselves, and instead look for a logical landing zone for this decline.
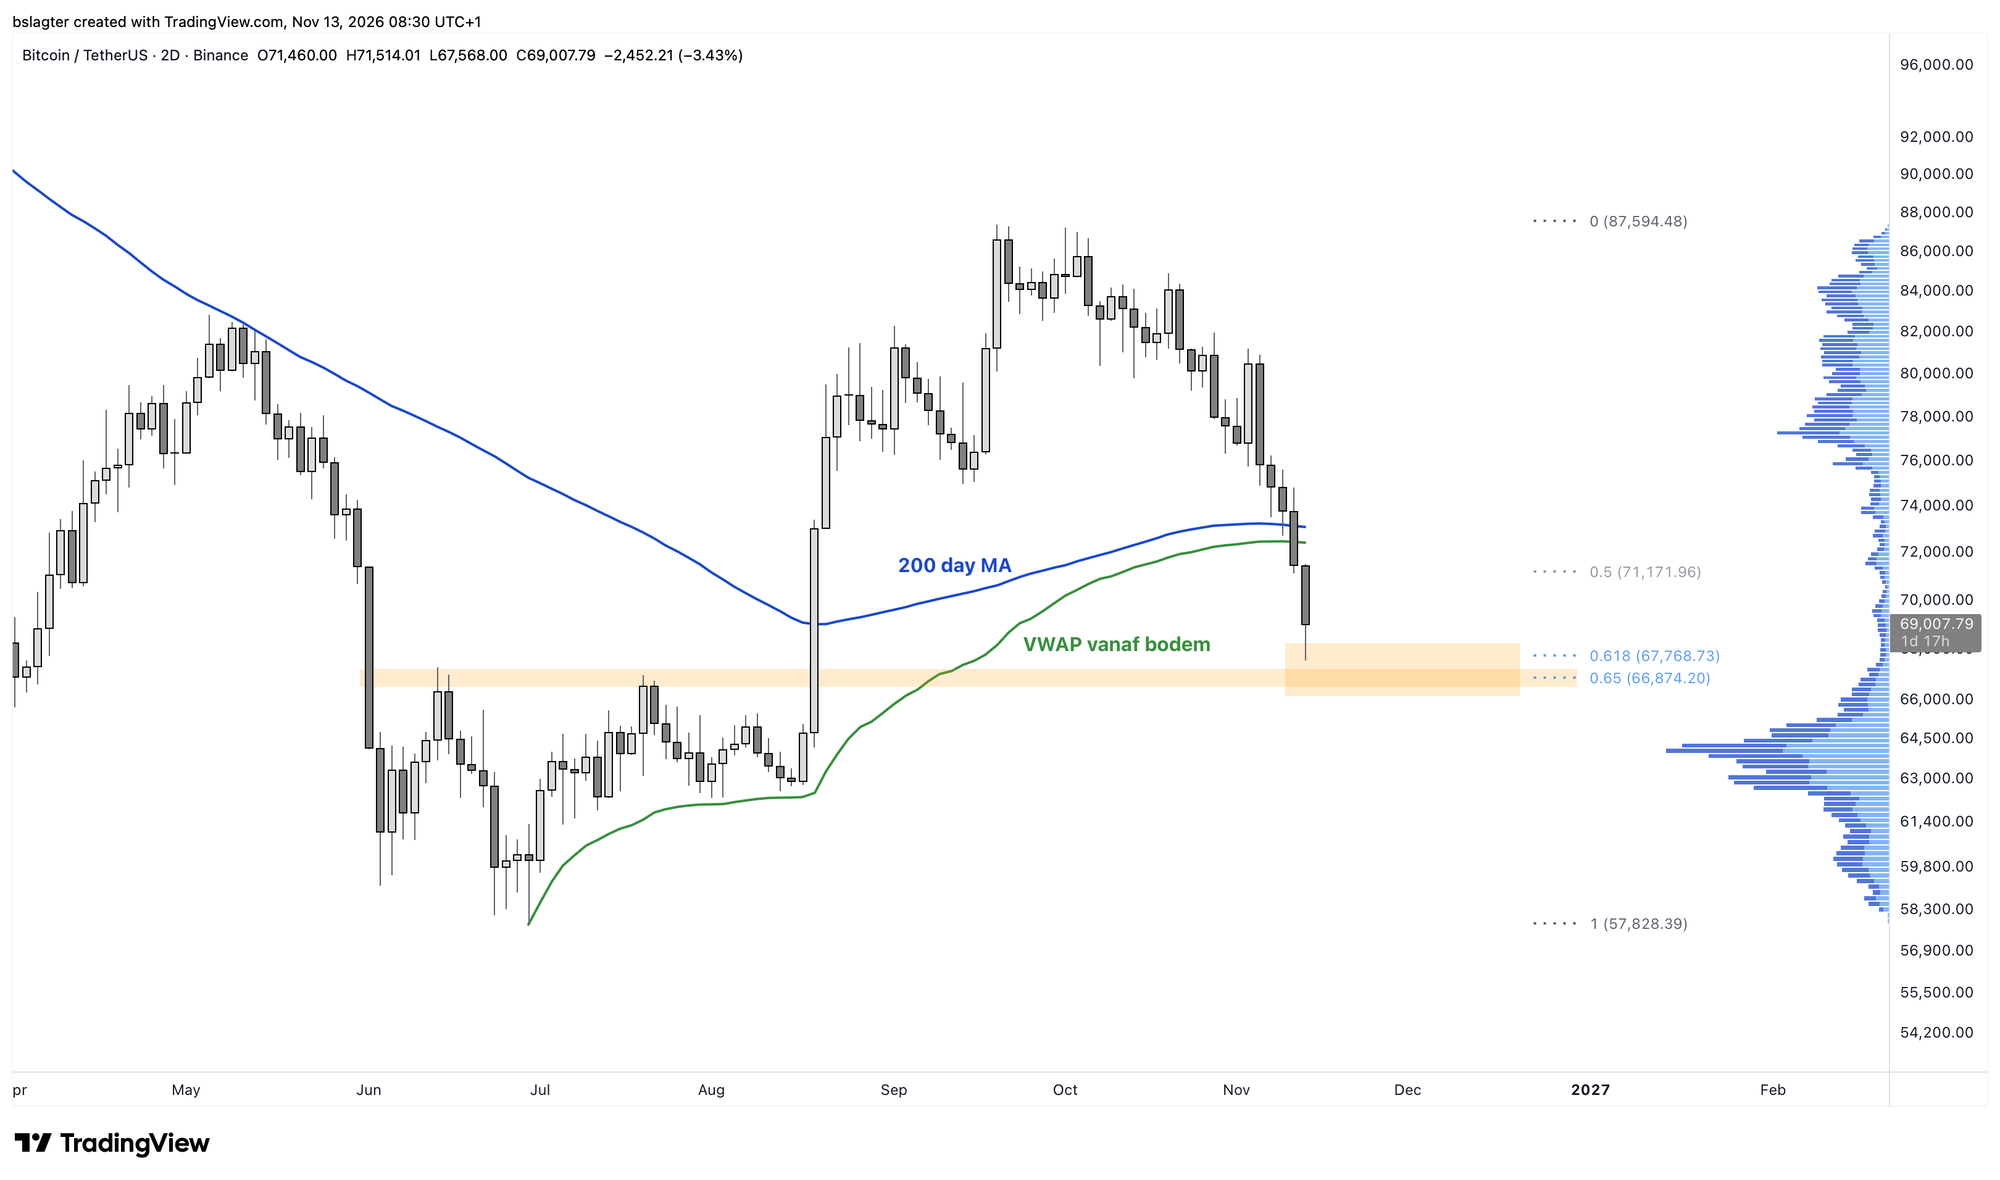
Now that we've dropped below $75,000, we're in a thinly traded area all the way down to $66,000. That's where a logical support zone lies. We'd then be retesting the breakout from the bottoming formation. It's also where the ‘golden pocket’ of the rally from $57,700 to $87,000 sits.
In almost every respect, we've now endured enough pain for a weekly cycle low (ICL). Sentiment is very gloomy. The Fear & Greed Index is brushing up against ‘extreme fear’. The correction is deep enough. The only thing that doesn't quite fit is the timing window.
We'll discuss the daily and weekly cycle in a moment. Strictly speaking, we don't expect an ICL until January. Early ICLs are more common around bear market bottoms, so it wouldn't be surprising. But it doesn't hurt to prepare for a while longer of weakness.
That said: if we do indeed put in a higher low (HL) above $57,700 somewhere around $65,000, that would be both the next checkmark and a fantastic entry price for the rest of the bull market!
We continue with the following topics for our Alpha Plus members:
- The daily & weekly cycle
- Severe turbulence at Nvidia
- Americans are selling bitcoin
- A lower low on the weekly chart
1️⃣ The daily & weekly cycle
 Contribution by
Bert
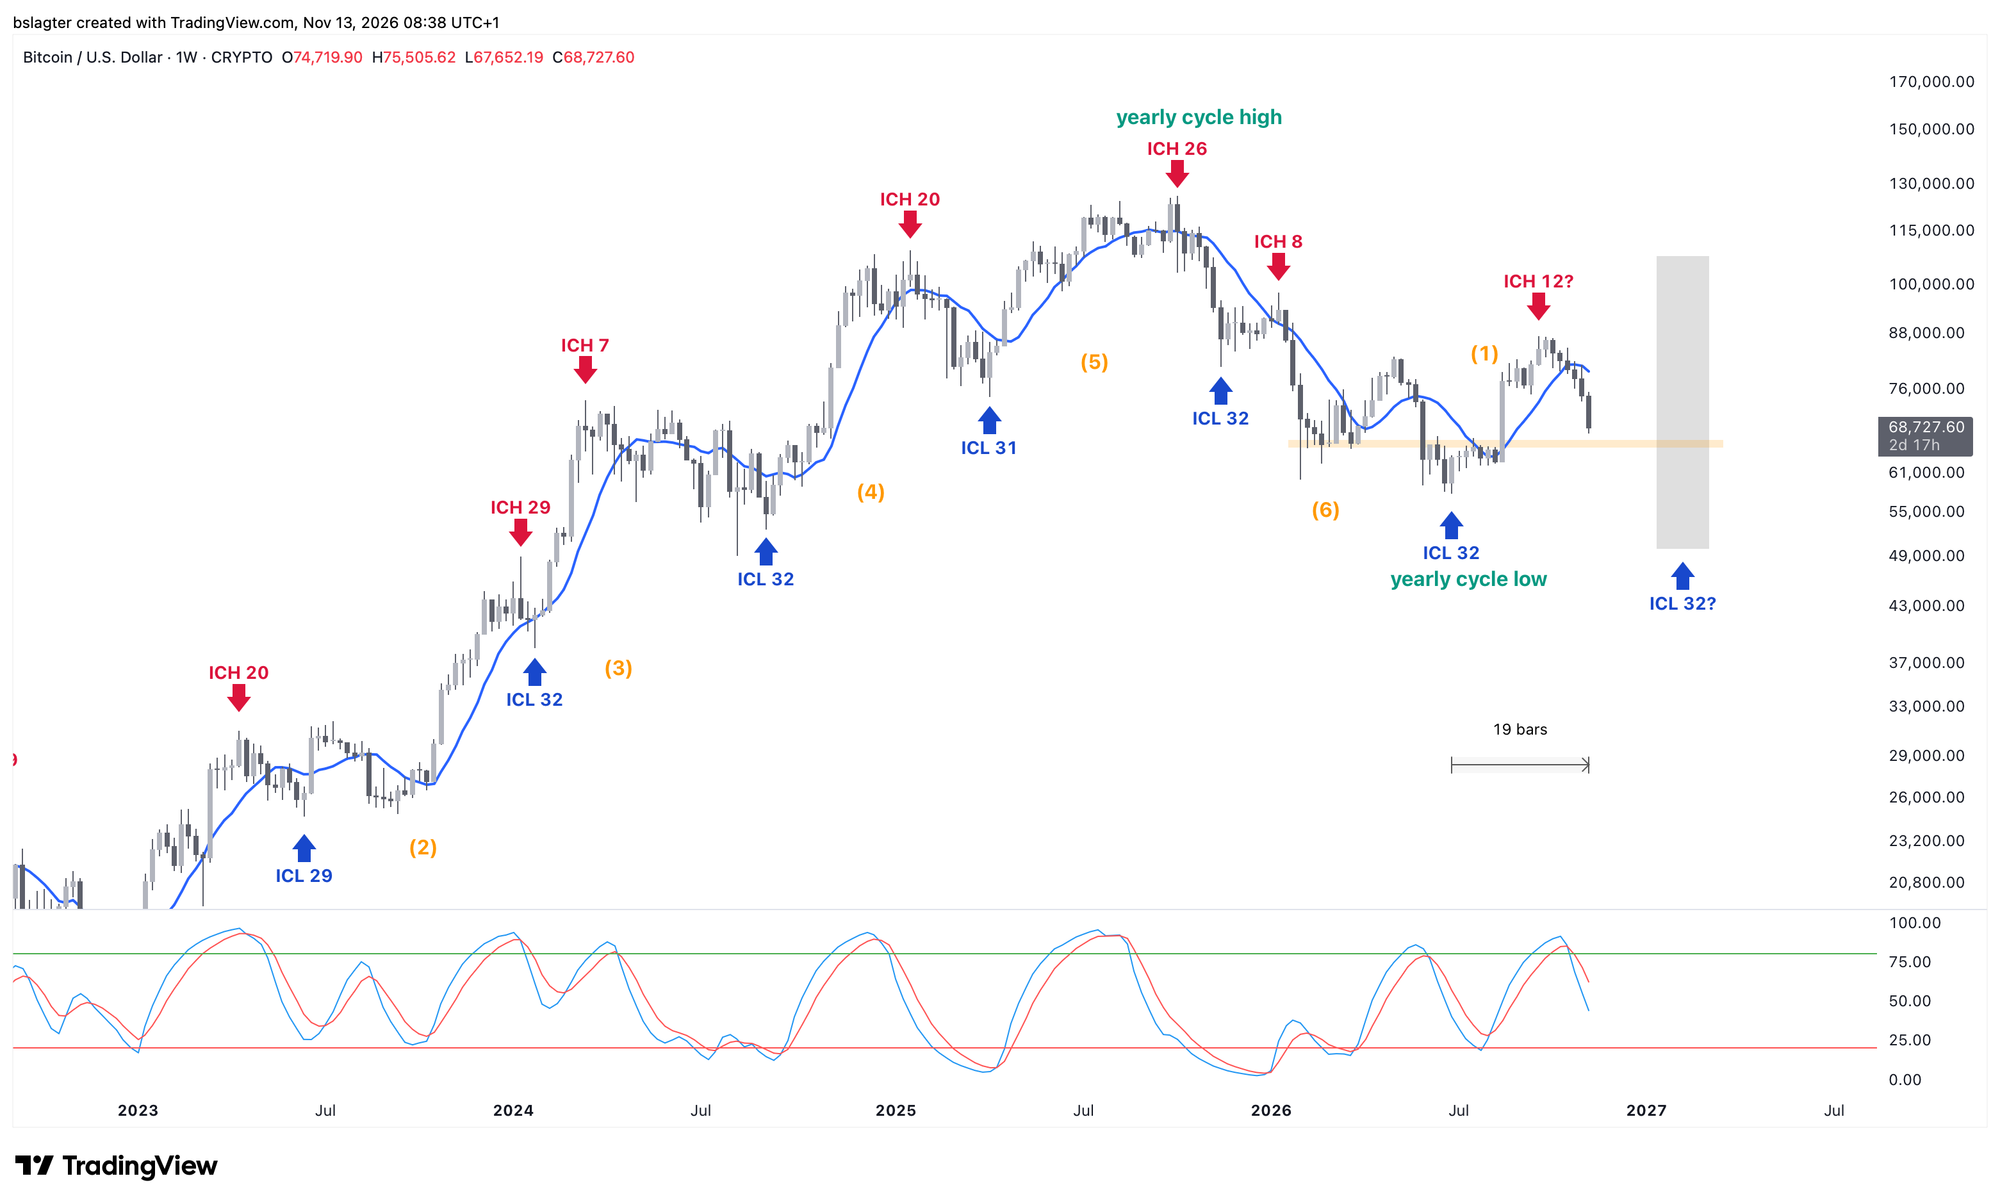
We're in week 19 of this weekly cycle, which in recent years has usually lasted 31 or 32 weeks. We saw somewhat shorter cycles around the end of the previous bear market, at 20 and 23 weeks.
In principle, then, we expect a weekly cycle low (ICL) around the end of January 2027. But a bottom in November, December or early January wouldn't be exceptionally early.
The final verdict can only be given in hindsight. If we stage a serious rally from a significant low, find acceptance above the 10-week moving average, and eventually climb to a higher high (HH) above $87,000, then we'll know for sure that we're in a new weekly cycle.
For now, we'd note that the oscillator at the bottom still has plenty of room for a few more weeks of weakness. That doesn't have to be one long string of red weeks; there's every chance of a ‘countertrend rally’ to around $80,000 in between.
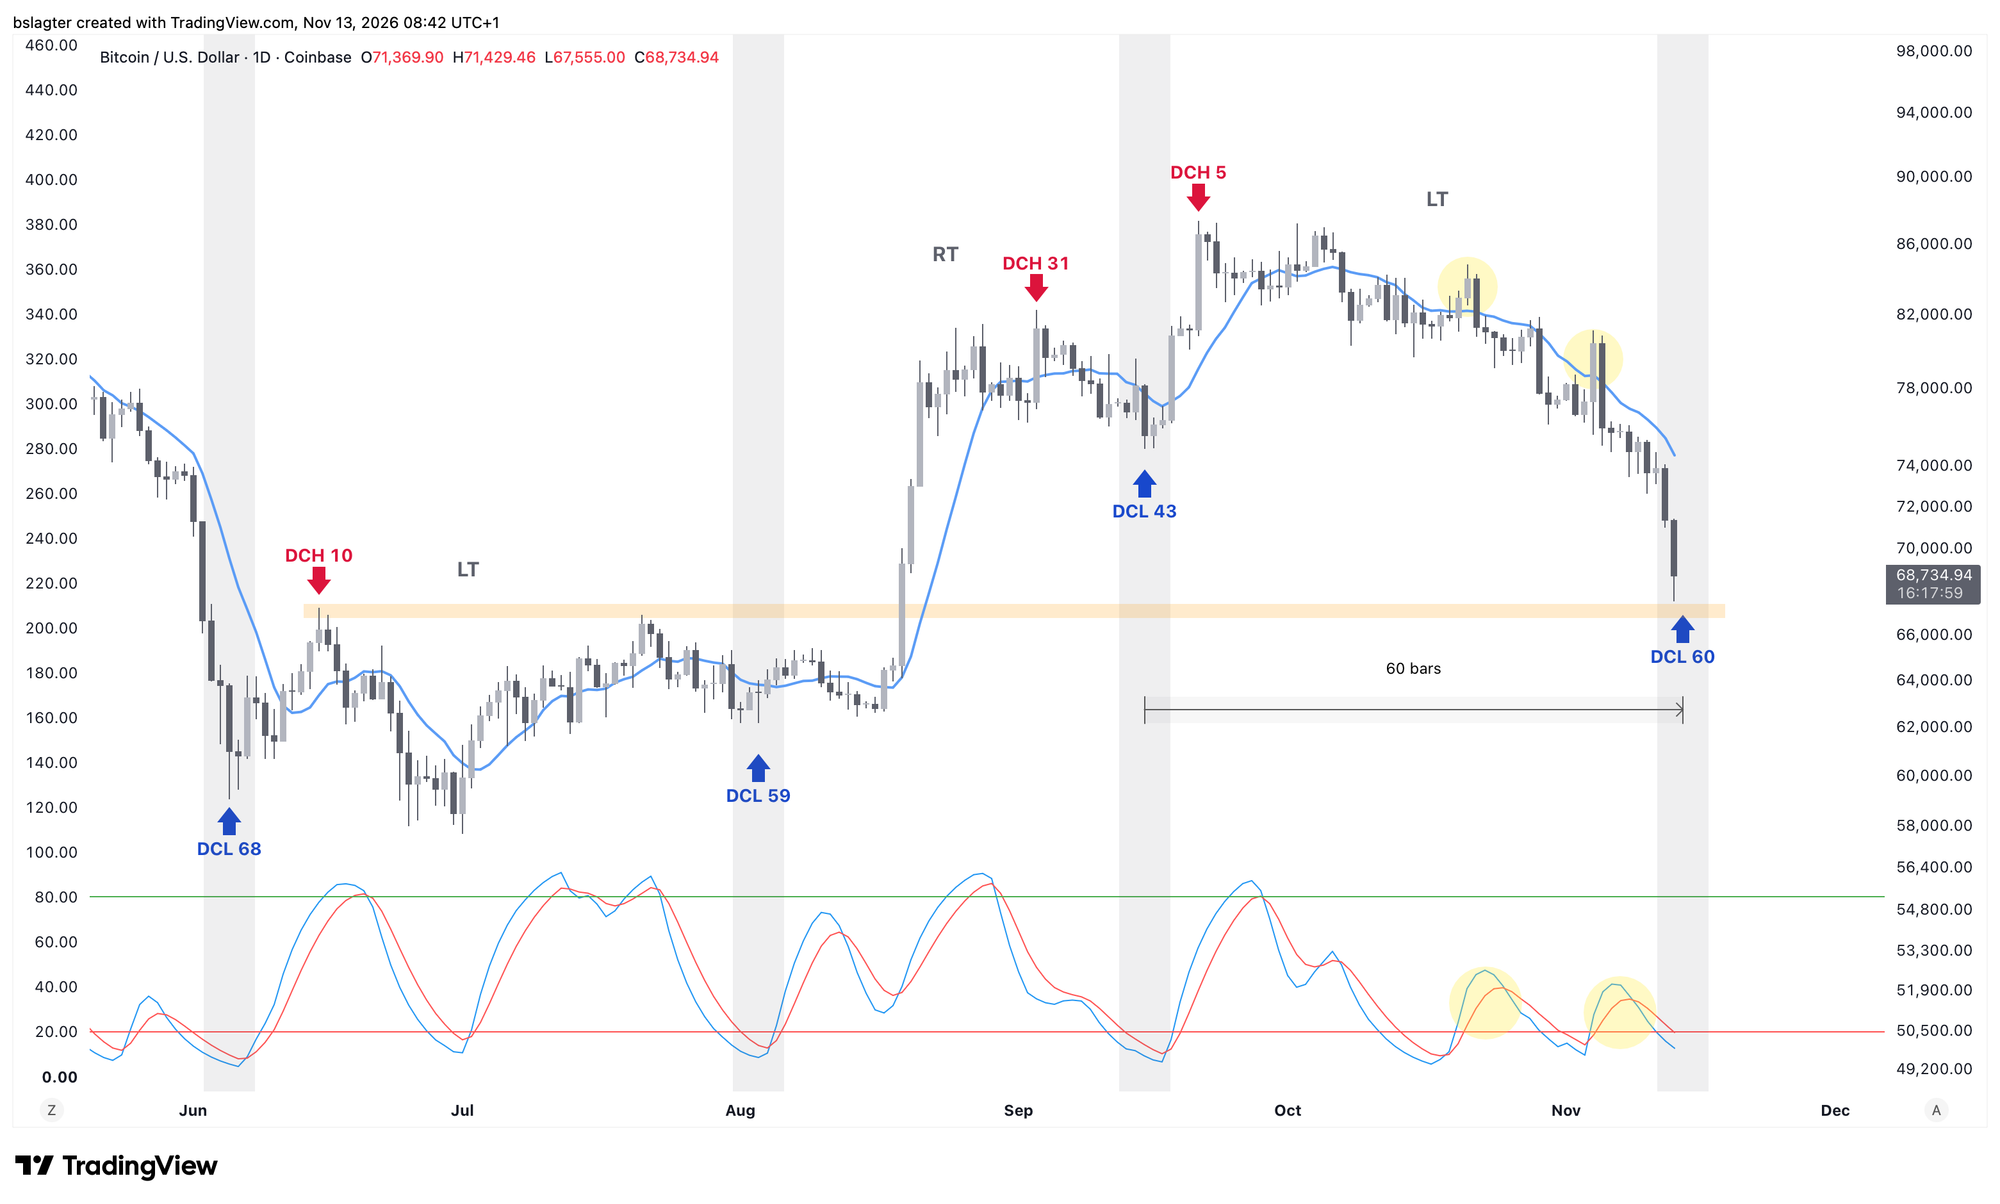
The daily cycle is a mess. It's hard to find a convincing interpretation. At the moment, I'm leaning toward the count below.
In that case, we'd be in the tail end of this daily cycle. The two failed breakouts above the 10-day moving average and the oscillator at the bottom show that every flicker of optimism has been firmly stamped out. You rarely see this kind of negativity in bull markets.
You could take that as evidence that we're not in a bull market at all, but an explanation based on events inside and outside the crypto market is also plausible. More on that in a moment.
The question is whether this daily cycle low (DCL) is also the weekly cycle low (ICL), or whether that comes one cycle later. So it's either an ICL in week 19-20, or roughly 8-9 weeks later.
2️⃣ Severe turbulence at Nvidia
Contribution by Bert
For a few months now, there have been concerns about the valuations of AI companies. Are the AI labs actually earning enough to pay their bills? Will the hyperscalers and neoclouds manage to get their data centers up and running? Can the chipmakers deliver on time?
The ‘blue tsunami’ brought these questions into sharp focus. Let's be clear: the Democrats are just as keen to win the AI race and reap the rewards in terms of economic growth and defense. Still, investors took an extra-critical look at their concerns.
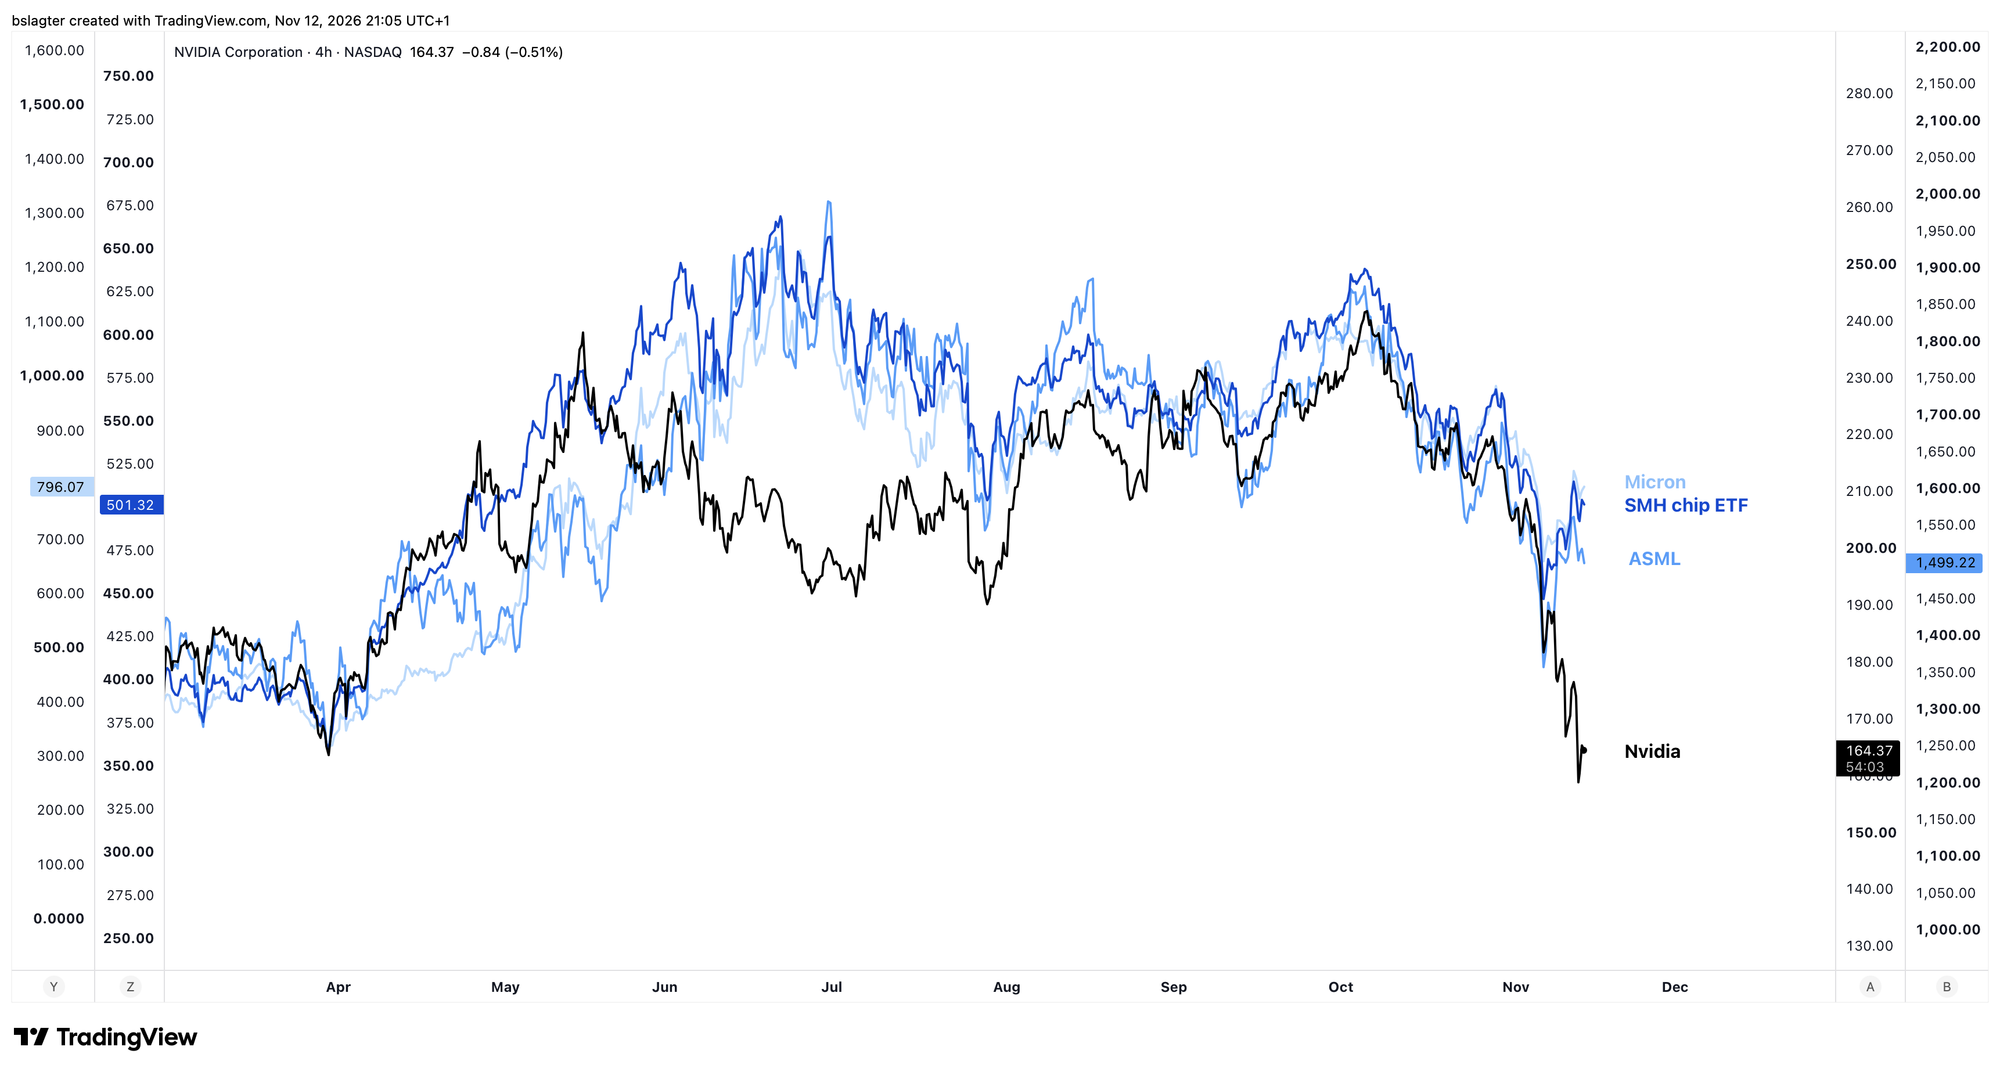
Many AI stocks recovered quickly from the midterms crash. The major stock indexes have already made up their losses. The same can't be said for Nvidia.
CEO Jensen Huang offered his resignation following revelations about his private life that also affect the company. He allegedly had relationships with colleagues and with a Chinese spy. No hard evidence has been presented yet, but the suspicion was enough.
Huang himself has often said that Nvidia is run like a startup. The next CEO will have to reshape the company.
Jensen’s exit strategy is basically: Good luck, figure it out.
— Bert Slagter (@bslagter) November 12, 2026
“They just have to reshape the company for the next CEO. [...] The next CEO, whatever their personality is, they can figure it out.”
True founder mode. pic.twitter.com/DAW9oK6Lpc
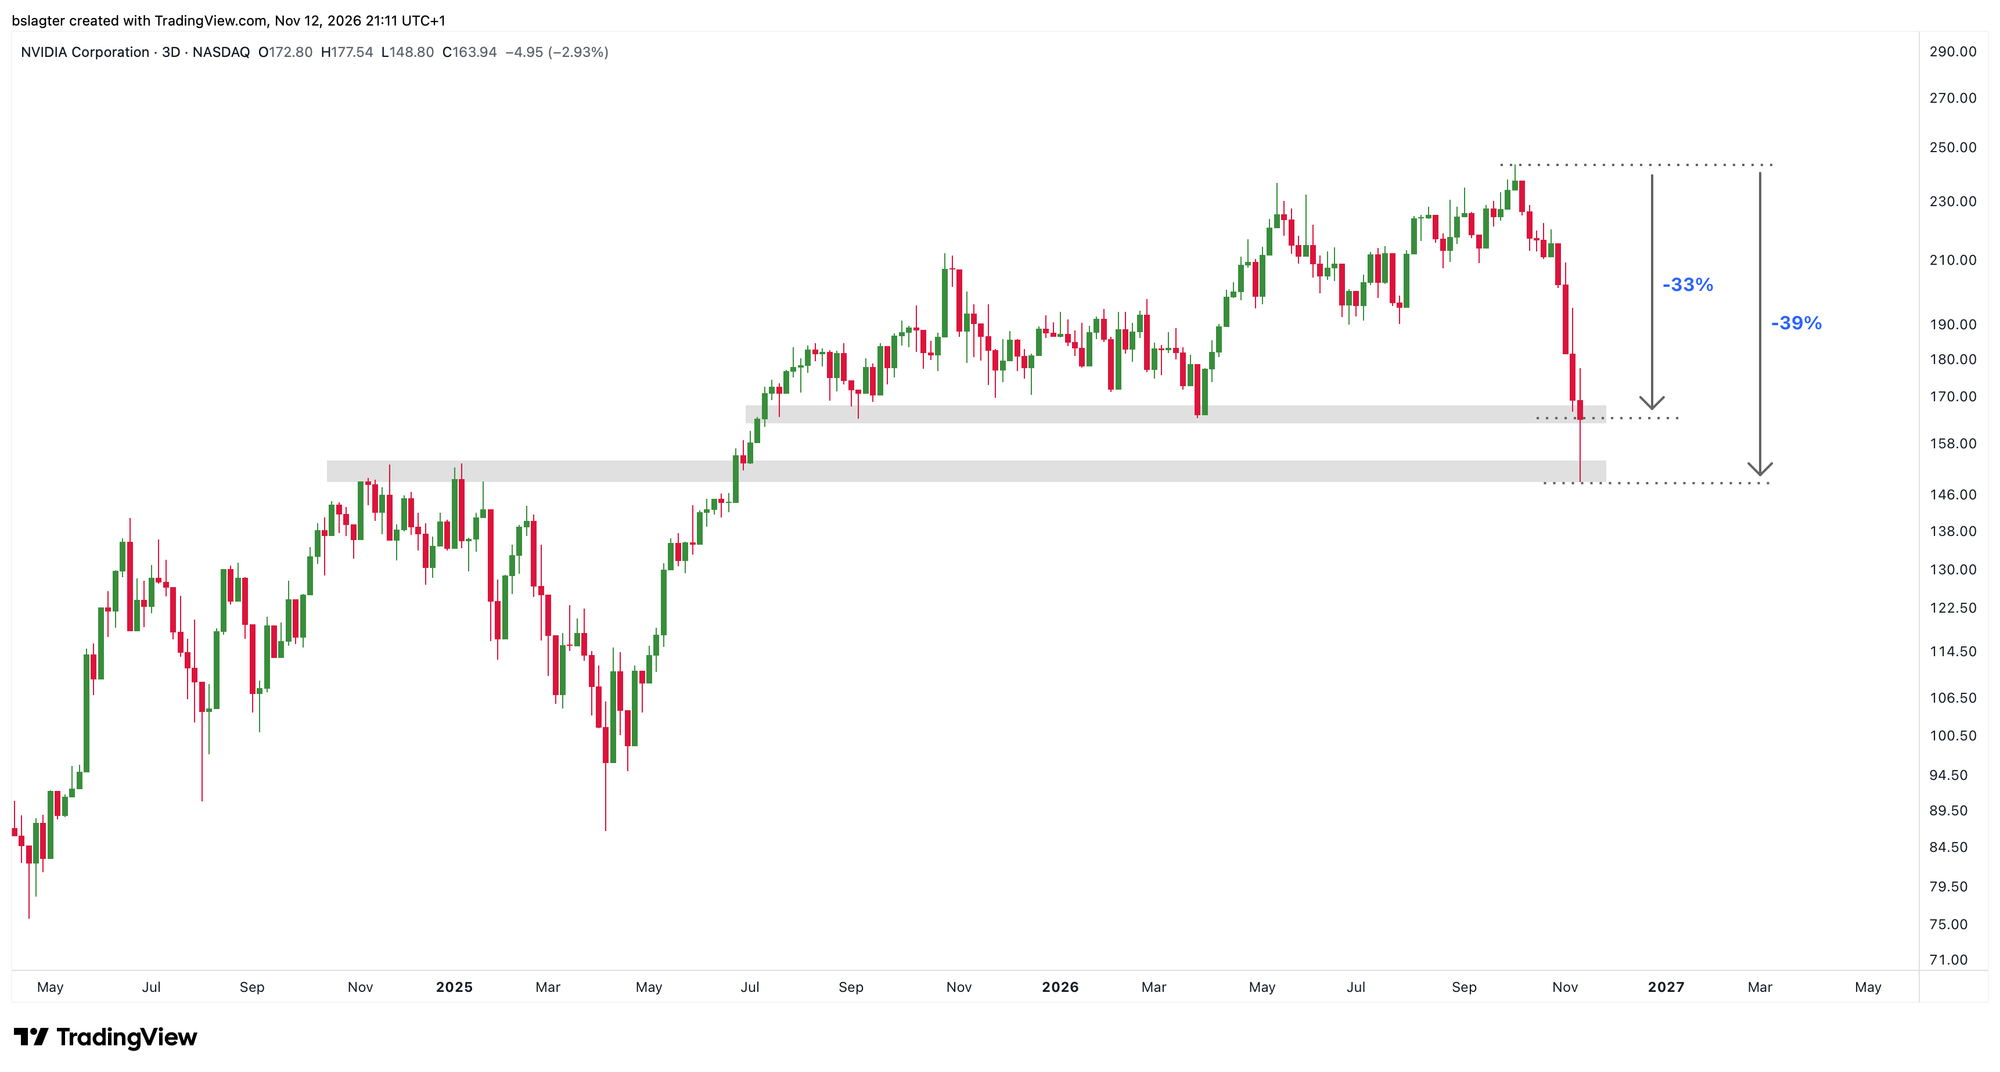
That explains the share price slide. The stock closed yesterday 33% below its September high. At its lowest point, it was down 39%.
Nvidia will do just fine in the coming years. There's a strategy in place, the order book is well filled, and the company holds a unique position in the market. The numbers won't change anytime soon because of Huang's departure.
The uncertainty lies in the period after that. Did Huang really make the difference? Can the company reinvent itself without him? Will Huang join another company to compete with Nvidia?
These are legitimate questions, but there's a real chance investors won't be dwelling on them a few weeks from now. That could make this a great entry point. The linchpin of AI infrastructure at the price you were paying in late 2024 and early 2025!
3️⃣ Americans are selling bitcoin
Contribution by Bert
Whenever prices plunge wildly, the same question always does the rounds: who's selling? Usually we can say something about that by looking at trading volumes, timing and premiums.
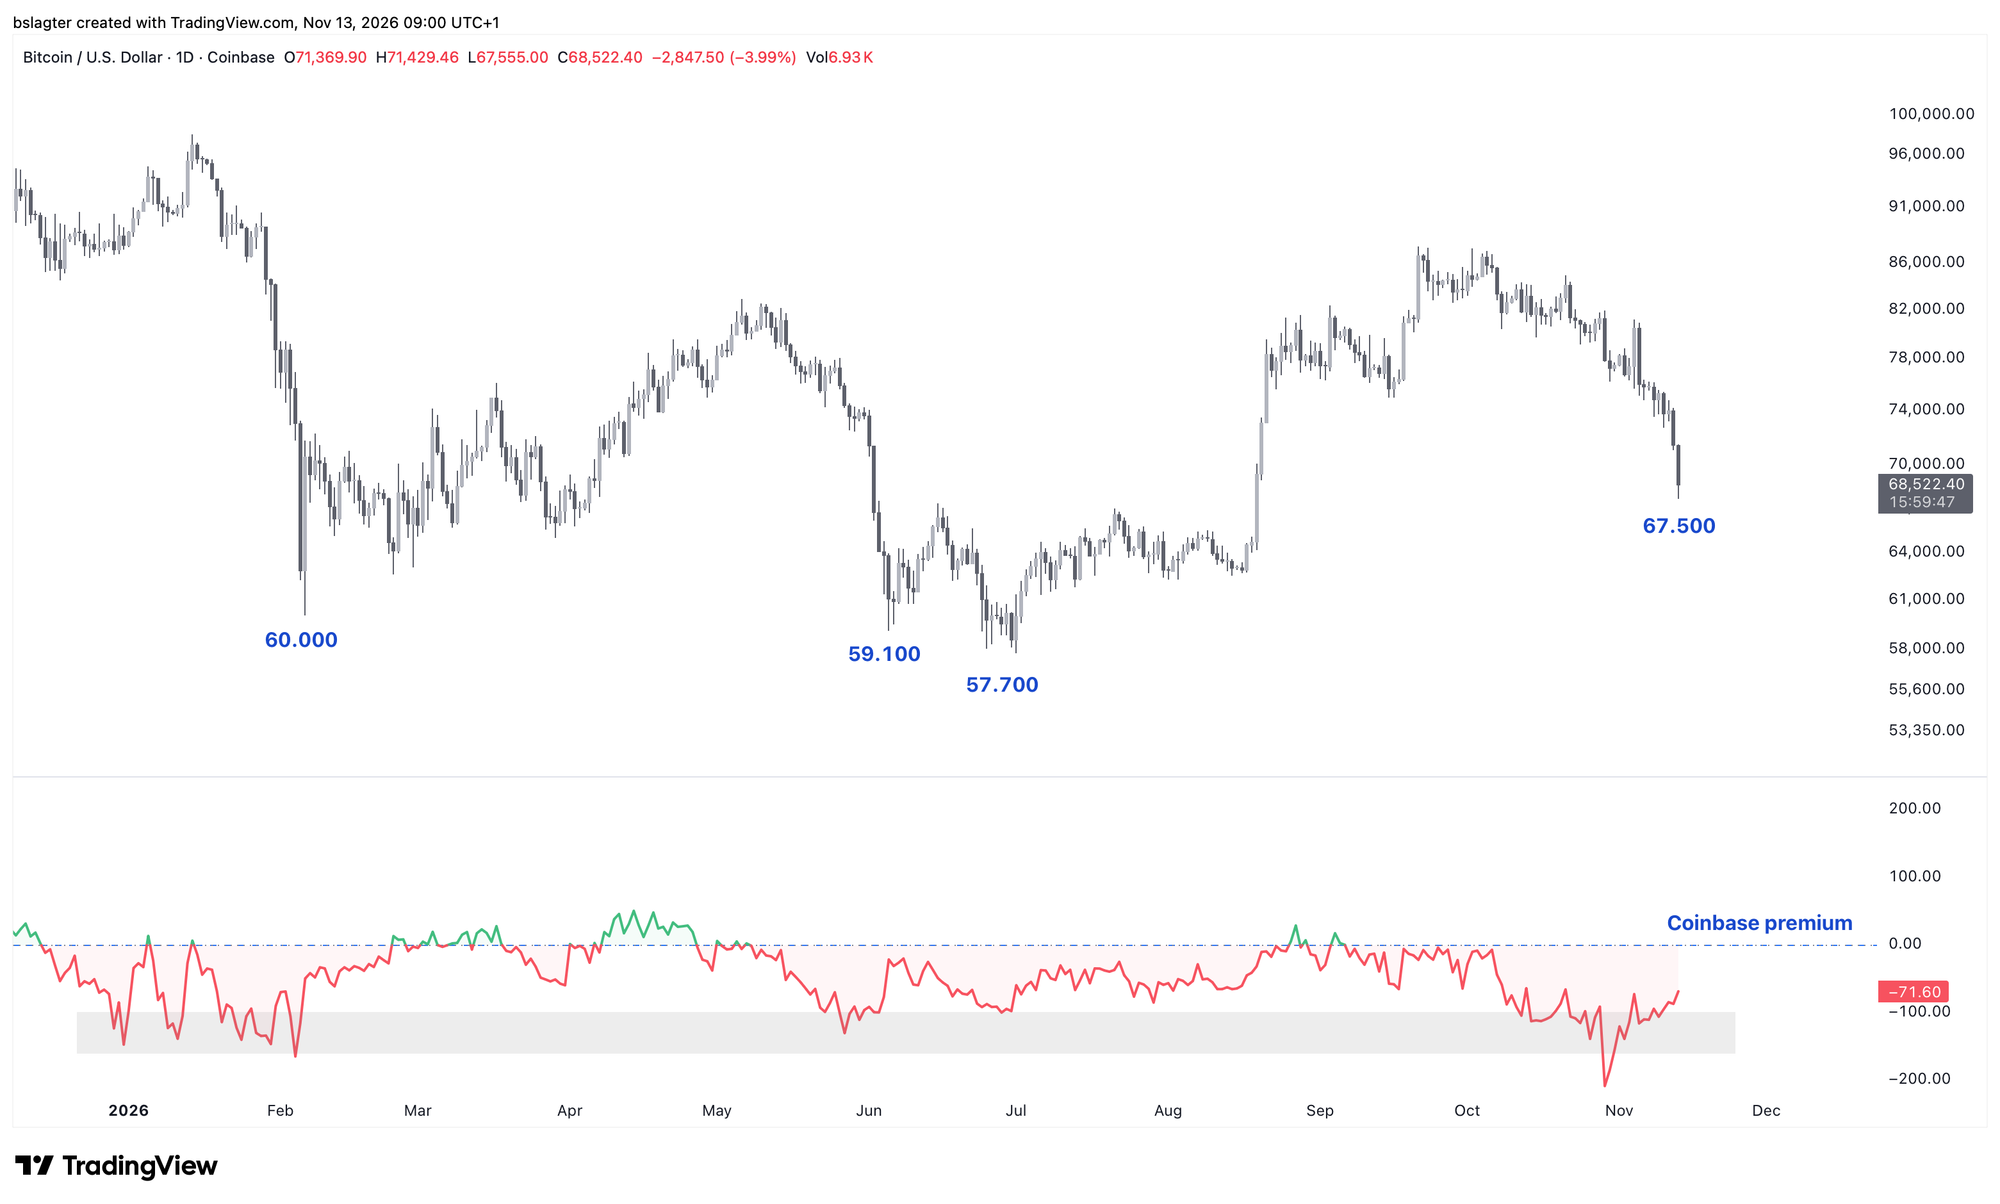
In this case, America appears to be the source. The chart below shows the Coinbase premium. That's the extra amount Coinbase users (US) pay for a bitcoin compared to Binance users (global, Asia).
The chart below comes from David Lawant, a researcher at Anchorage. For four exchanges, it shows how ‘sell volume’ and ‘buy volume’ compare. When sellers dominate, the line falls. White is Coinbase.
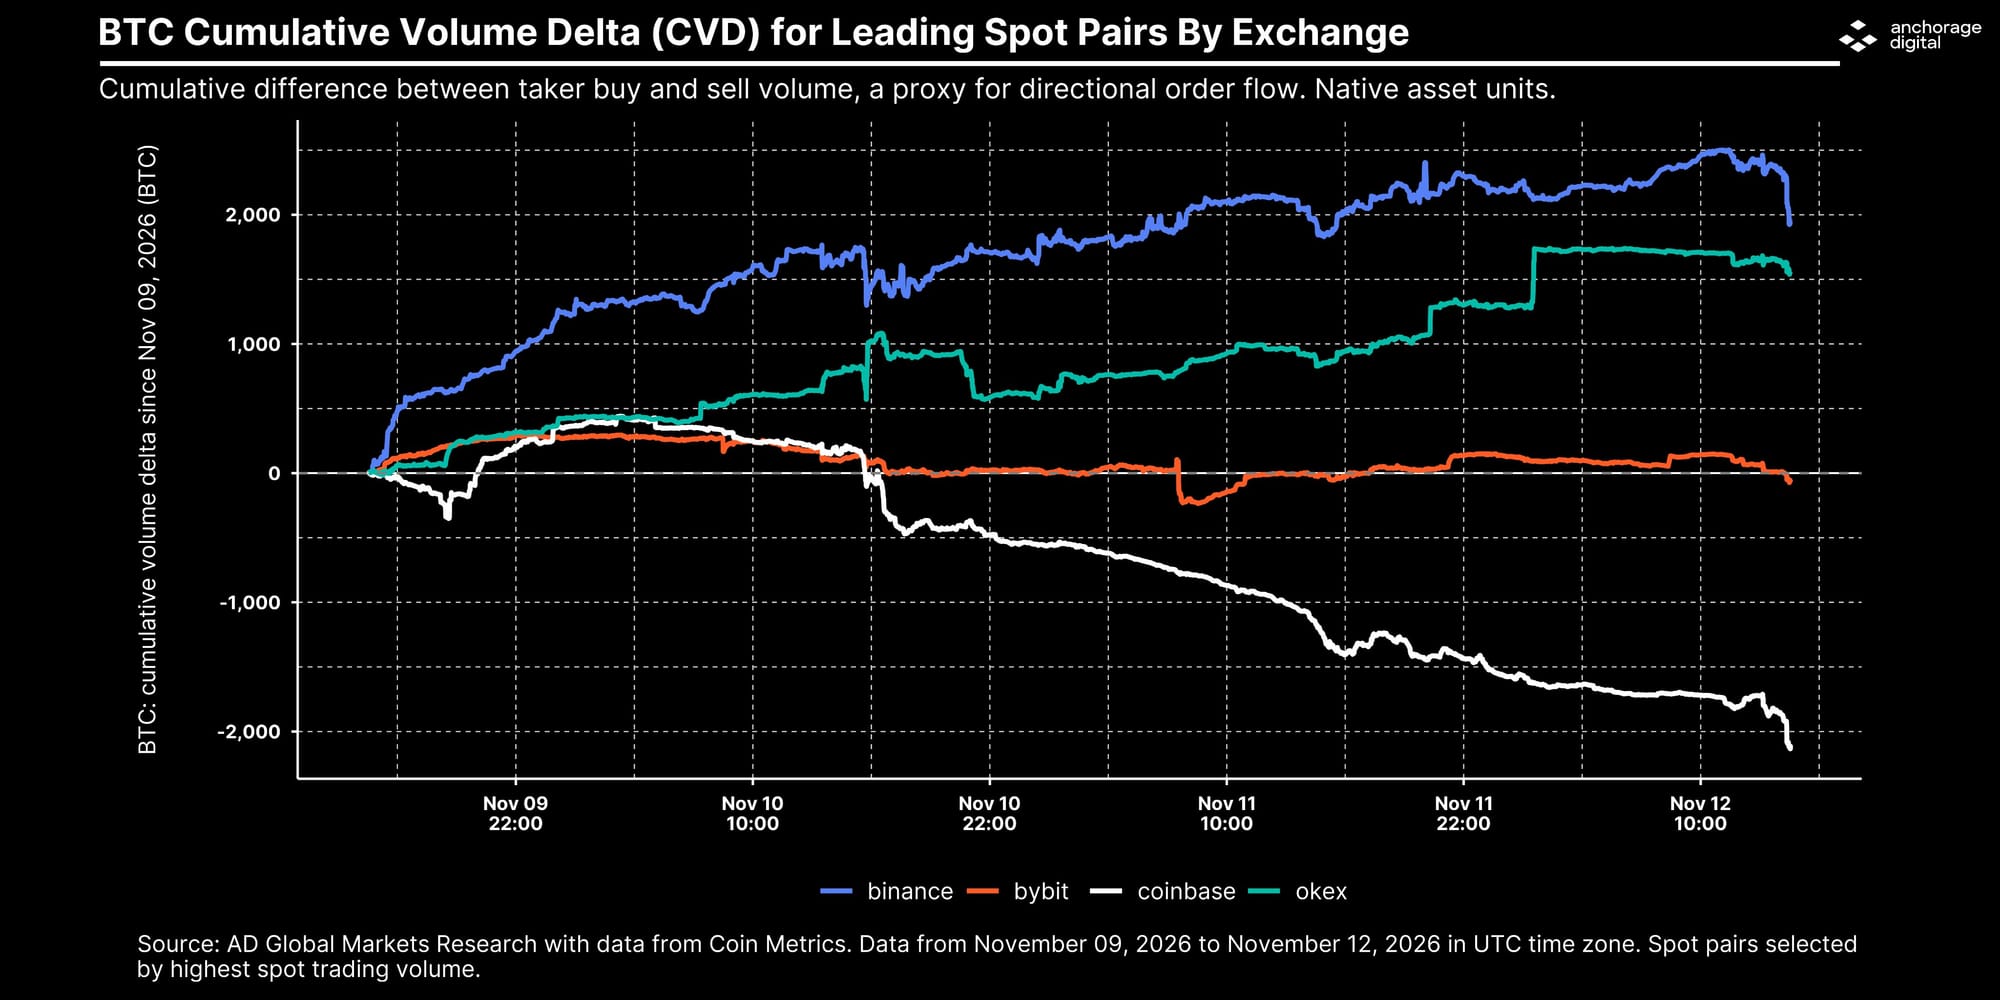
It's a reasonable assumption that Americans are driving this fourth capitulation. Possible reasons include:
- A reaction to the Democrats' victory and the return of an anti-crypto regime.
- Freeing up cash to take part in Anthropic's IPO on Thursday, November 19.
- Concerns about Strategy being removed from MSCI's indexes.
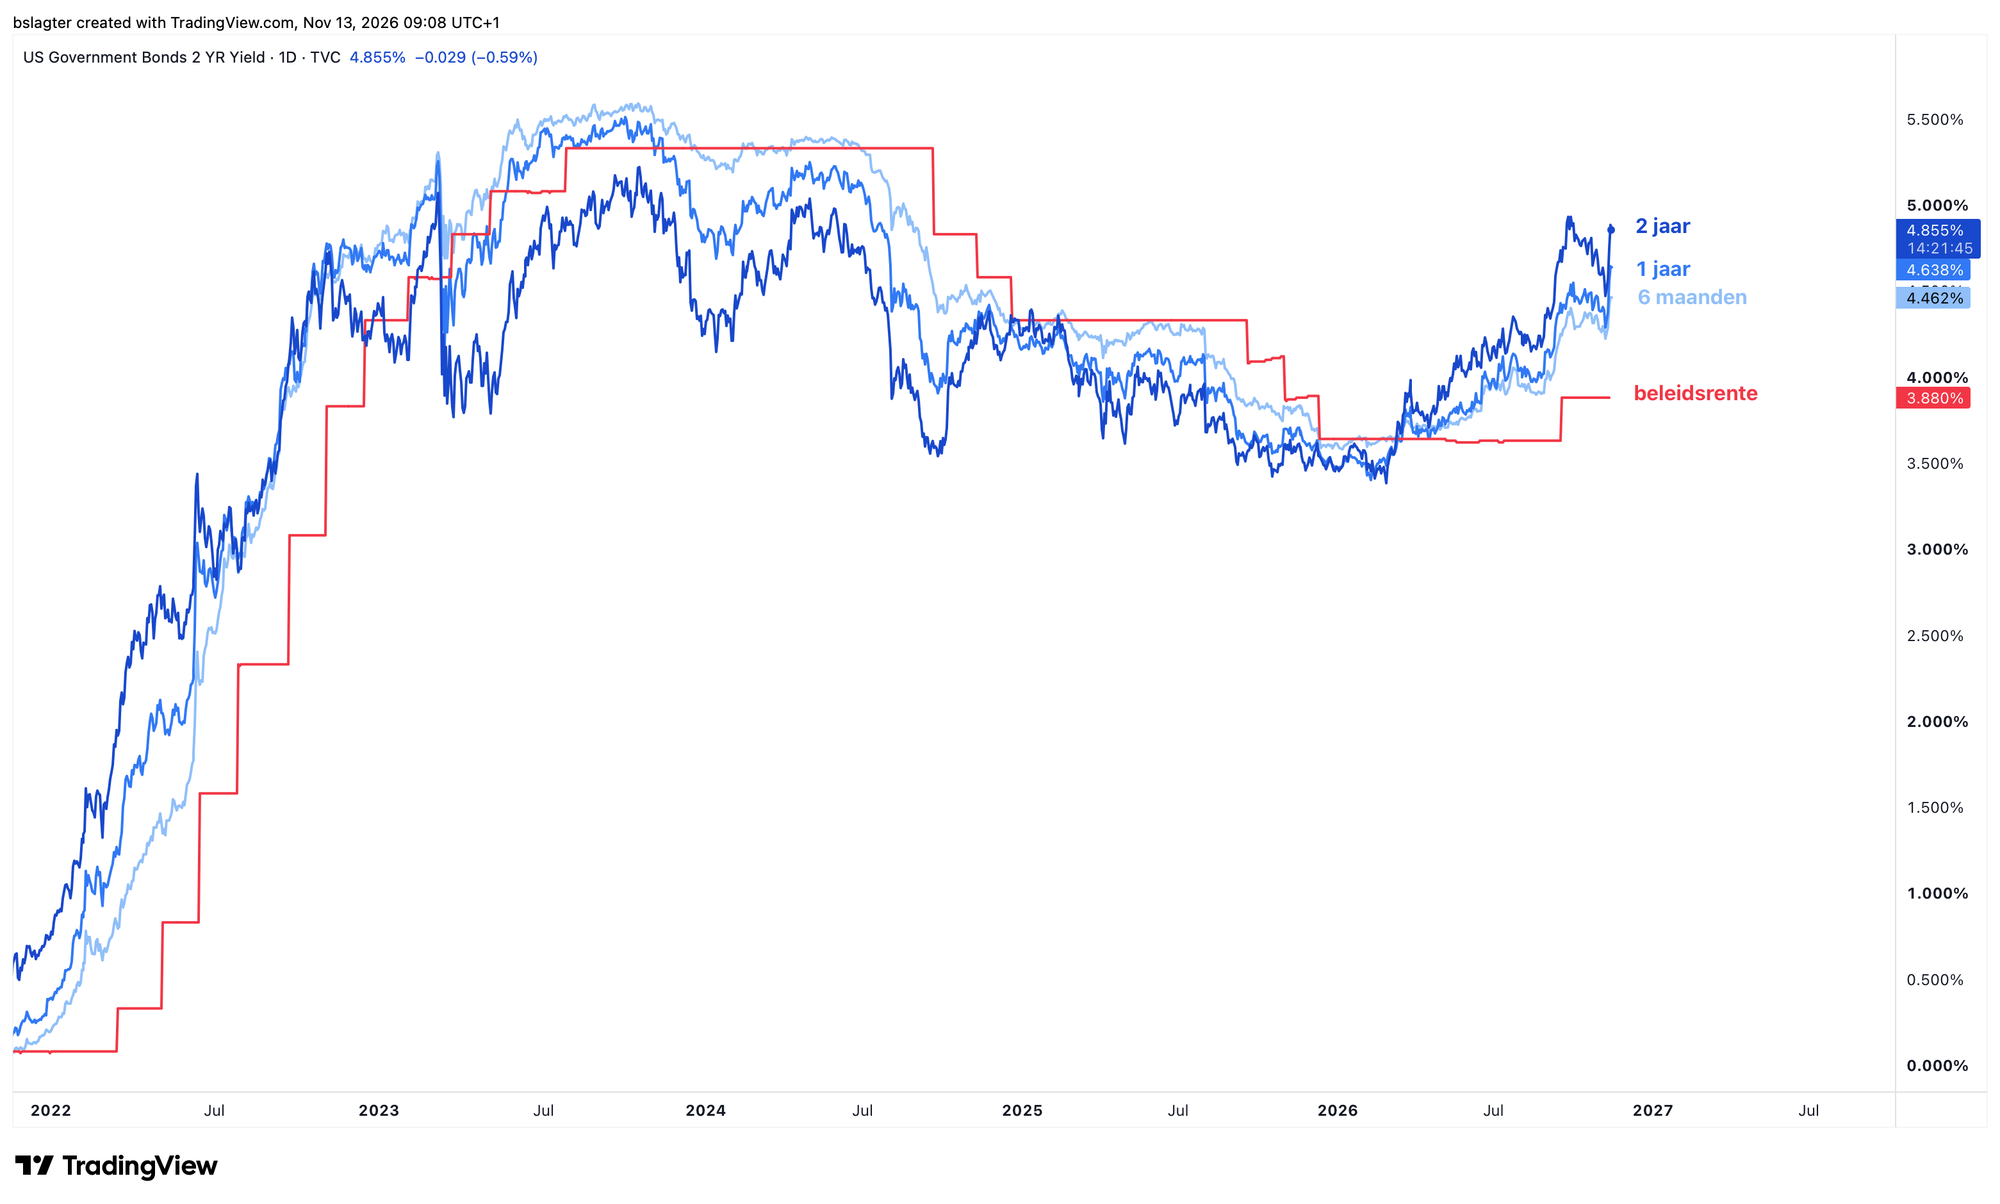
- A reaction to rising interest rates, the stronger dollar, and expectations that the Fed will push through a hefty rate hike in December.
That last one holds up well. Gold and silver also took a hit. Short-term rates already jumped sharply this week. Logically, the dollar strengthened too.
The other points are more emotion than reason. But on a financial market, that doesn't matter. Especially not when fear is being fueled by ever-lower prices.
4️⃣ A lower low on the weekly chart
 Contribution by
Sam
We have to start with the unpleasant fact: there's a weekly close below 75K. That puts a lower low on the weekly chart, and the bullish market structure of recent months is no longer intact.
Still, there were some arguments for giving it another week before drawing a definitive conclusion. The close came in just below the crucial level, and the drop below $75,000 only happened on Sunday evening, right before the weekly close. It was outside regular trading hours, and investors didn't have much time to process this new information and act on it before the week closed.
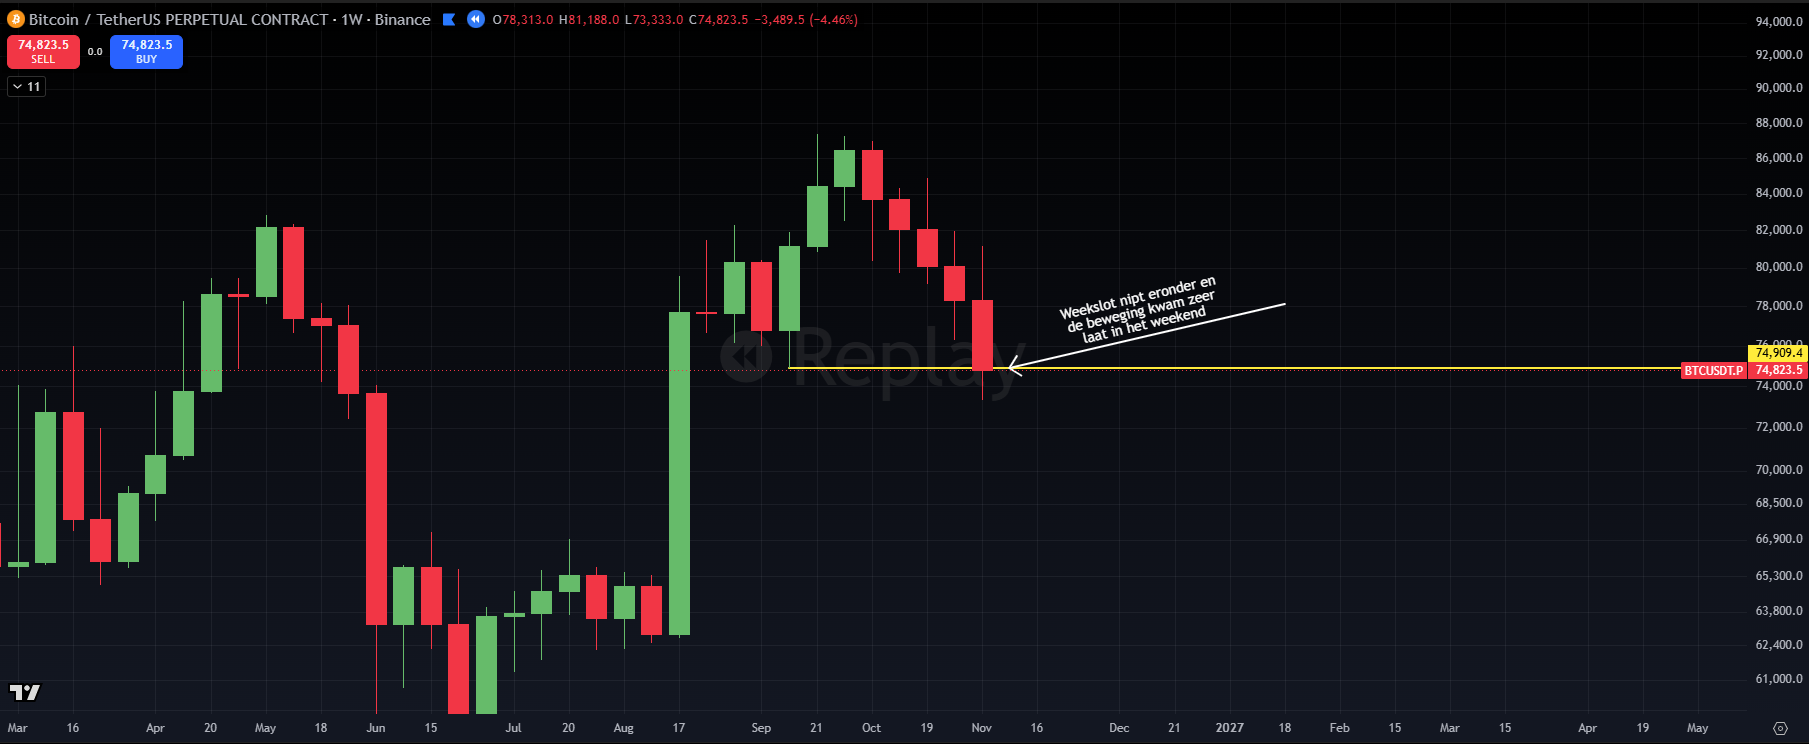
The above is very much a nuance. The hard data shows that a lower low was set on the weekly chart. That puts the burden of proof on the bulls this week, with $75,000 as the ‘line in the sand’. If the price stays below it, the lower low is confirmed.
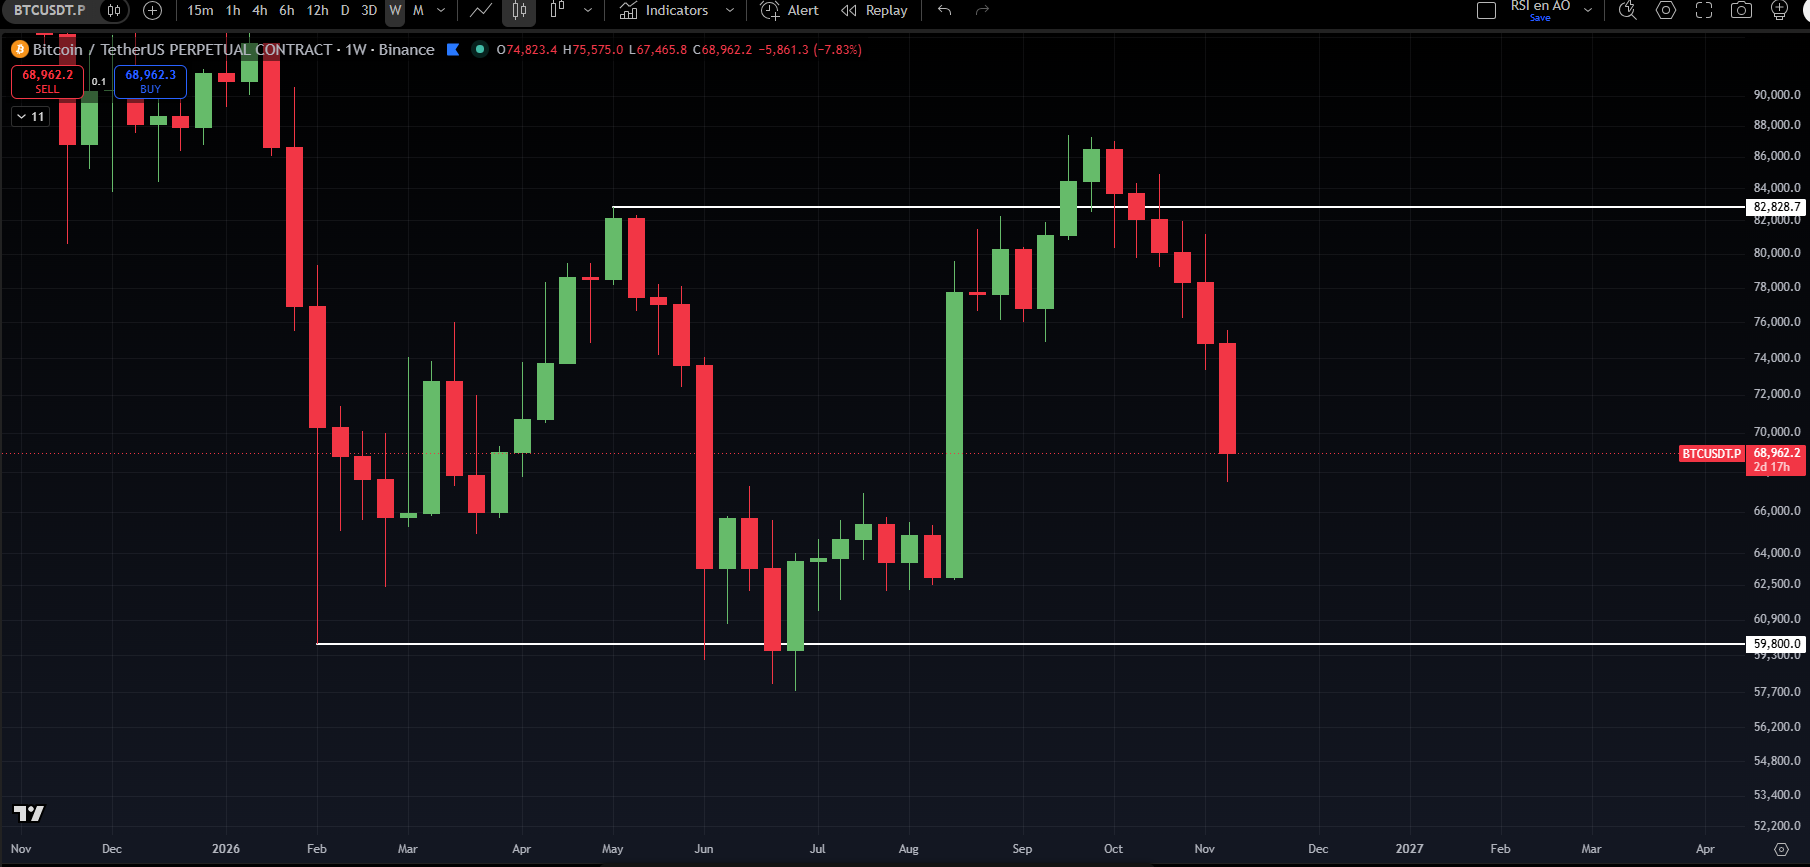
Overnight on Thursday, the price fell below $68,000, which leaves $75,000 a long way off. It also means the signal from last week's close deserved to be taken seriously.
This also changes something in my scenarios, assuming the price doesn't climb back above $76,000 in the coming days. The odds of a strong uptrend in the coming months have dropped considerably. The odds of a lower low below $57,000 have increased, but that's not yet my base case.
Right now, my base case is that the price will move sideways for an extended period between $60,000 and $83,000. Along with that, the trading mindset shifts from an uptrending market (“buy the dip”) to a sideways market: optimistic at the bottom of the range and cautious at the top of the range.
Final thoughts
You can read all previous editions of Alpha Markets in the archive. Questions, comments and suggestions are very welcome in the community.
Thank you for reading!
To stay informed about the latest market developments and insights, follow our team members on X:
- Bart Mol (@Bart_Mol)
- Peter Slagter (@pesla)
- Bert Slagter (@bslagter)
- Mike Lelieveld (@mlelieveld)
We appreciate your continued support and look forward to bringing you more comprehensive analysis in our next edition.
Until then!