2025 Predictions Revisited
A quiet week on the bitcoin market: higher low, lower volume, then a push to $94K. Did $80.5K mark the bottom? We revisit 77 predictions for 2025—and the results are brutal.

The past week was quiet on the crypto market. The chart looks pretty much the same as last week. On Monday, we saw a higher low on lower volume. After that, the price climbed to a higher high at $94,000. This increases the likelihood that the $80,500 level from November 21st was the bottom of this correction.
Only when price is accepted above $100,000 can we be certain the correction is over. At that point, we'd be above previous support and above the trendlines and moving averages that have been guiding the decline from the top. If another drop were to begin after that, it would be a new correction.
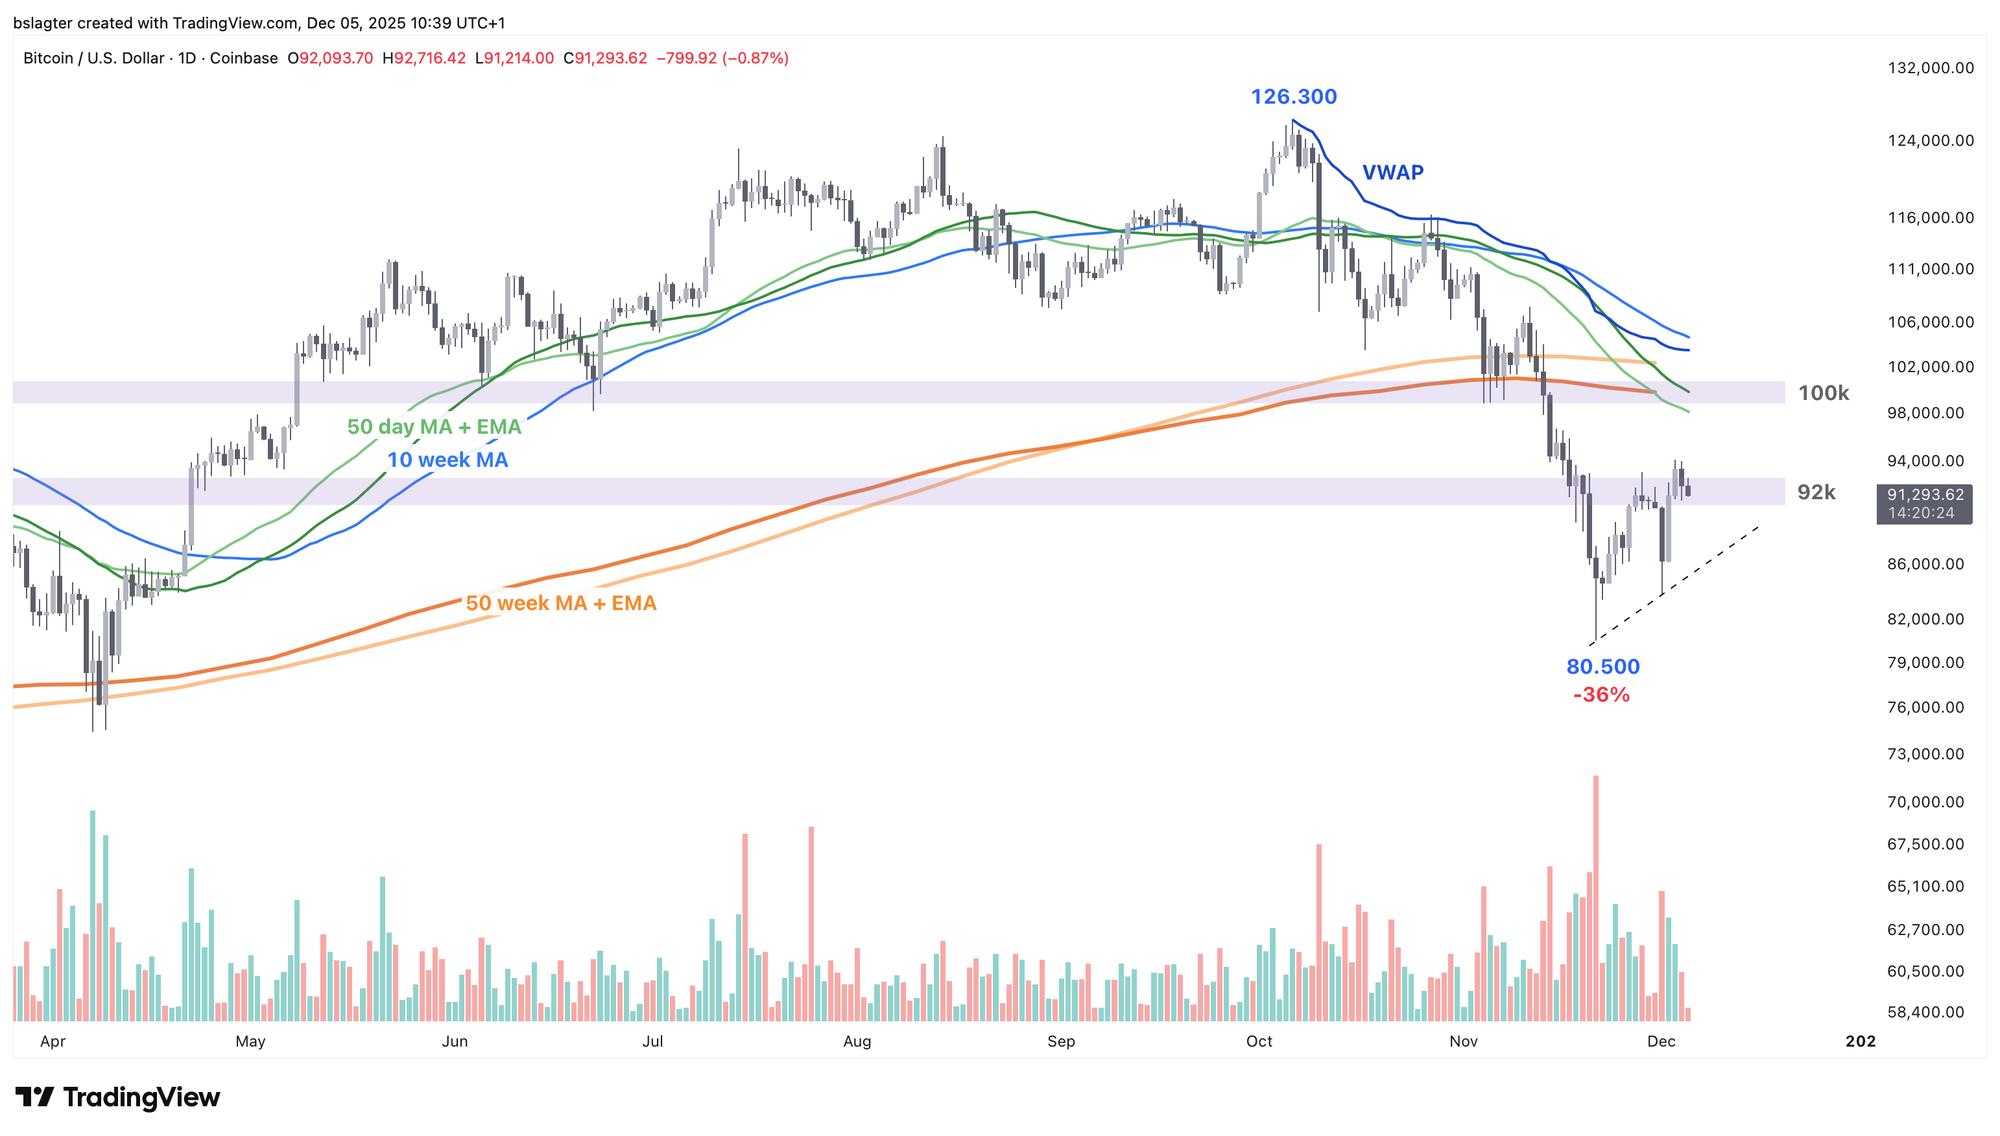
From a cycle analysis perspective, a weekly close above the 10-week moving average is a strong indication that a new weekly cycle has begun. Even in bear markets, a weekly cycle almost always rises above that average, even if only for a few weeks. That average currently sits at $104,000 and is declining by roughly $2,500 per week.
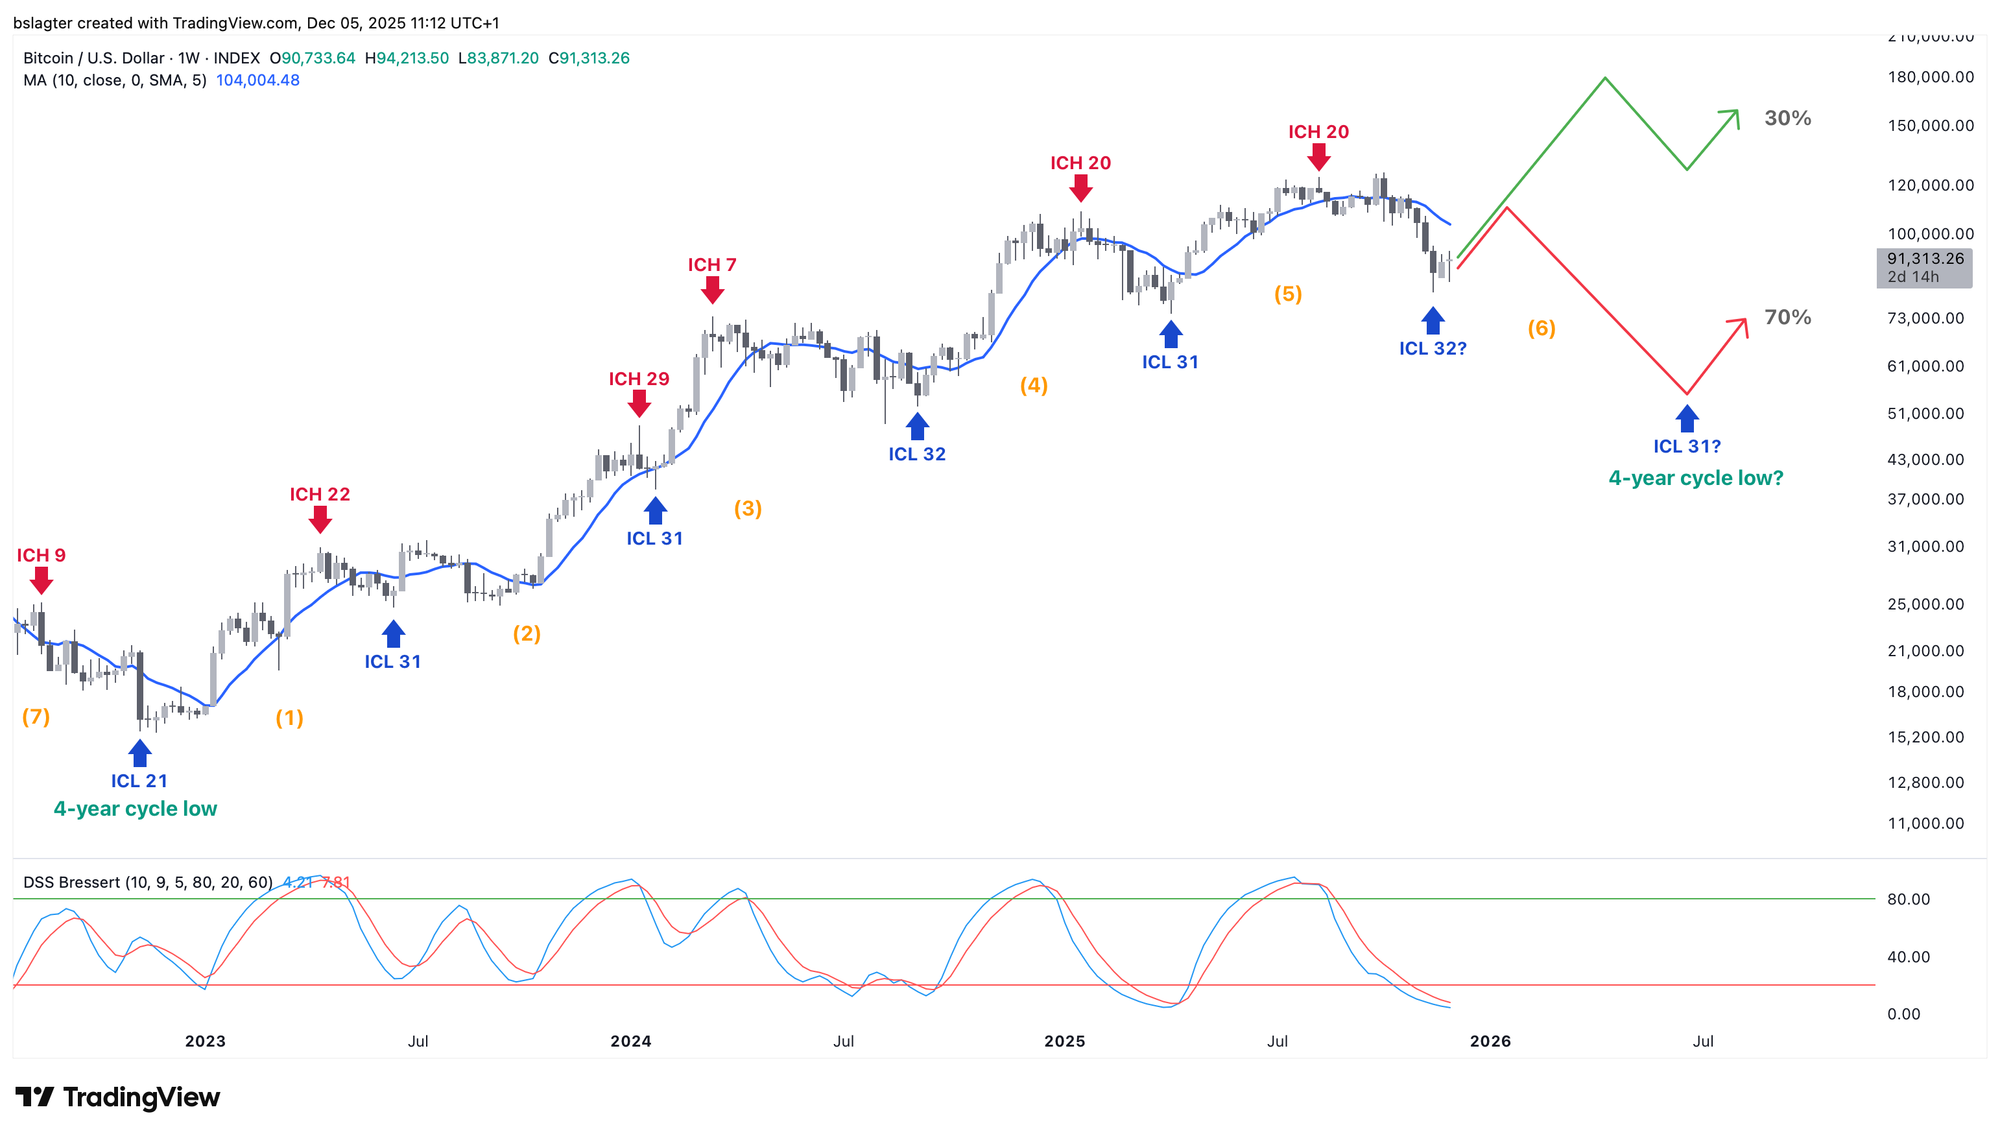
Let's assume for a moment that November 21st was indeed the weekly cycle low (ICL). That would place it in week 32, which fits nicely with the 31-32 week rhythm. That would mean we're now in the third week of a new weekly cycle.
In the chart below, we've drawn two potential paths for this new weekly cycle.
In green: a new rising weekly cycle that resembles previous rising weekly cycles. This scenario aligns with the 'Bull Market Resumption' scenario from the November 14th Alpha Markets, and we assign it a 30% probability.
In red: a declining weekly cycle. In technical terms: left translated (the top is left of center) and failed (the end is lower than the beginning). Don't focus too much on the depth—cycle analysis doesn't make specific claims about that. This represents the rest of our scenarios and gets the remaining 70% probability.
If we're heading for the red path, the ideal outcome would be that the upcoming weekly cycle low also serves as the yearly cycle low. Or in plain terms, the bear market bottom.
After that, we'll cover the following topics:
1. Bitcoin compared to...
2. 2025 Predictions Revisited
3. No strong arguments for a deep bear market
4. US economic data paints a mixed picture
Not a Plus member yet? Check out our party month offer at https://bitcoinalpha.nl/feest
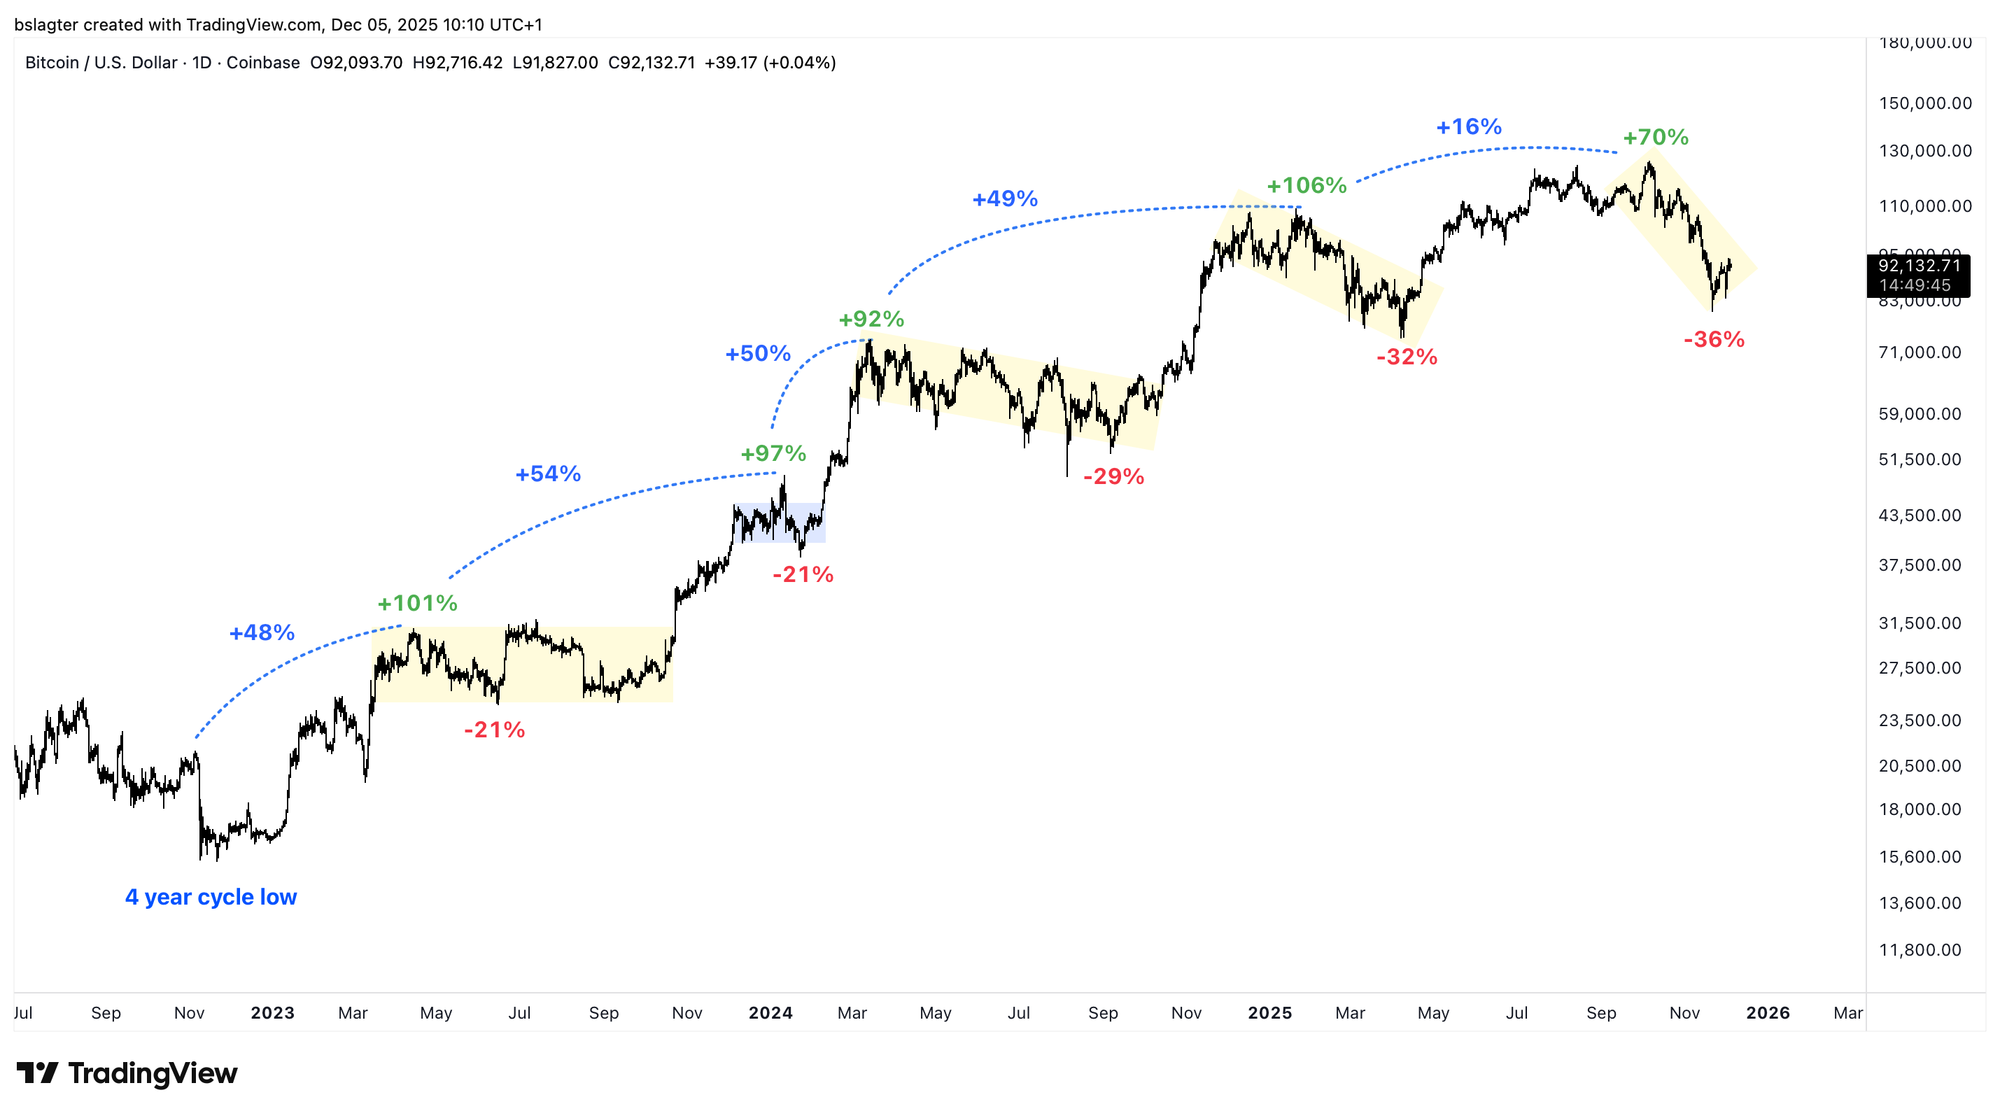
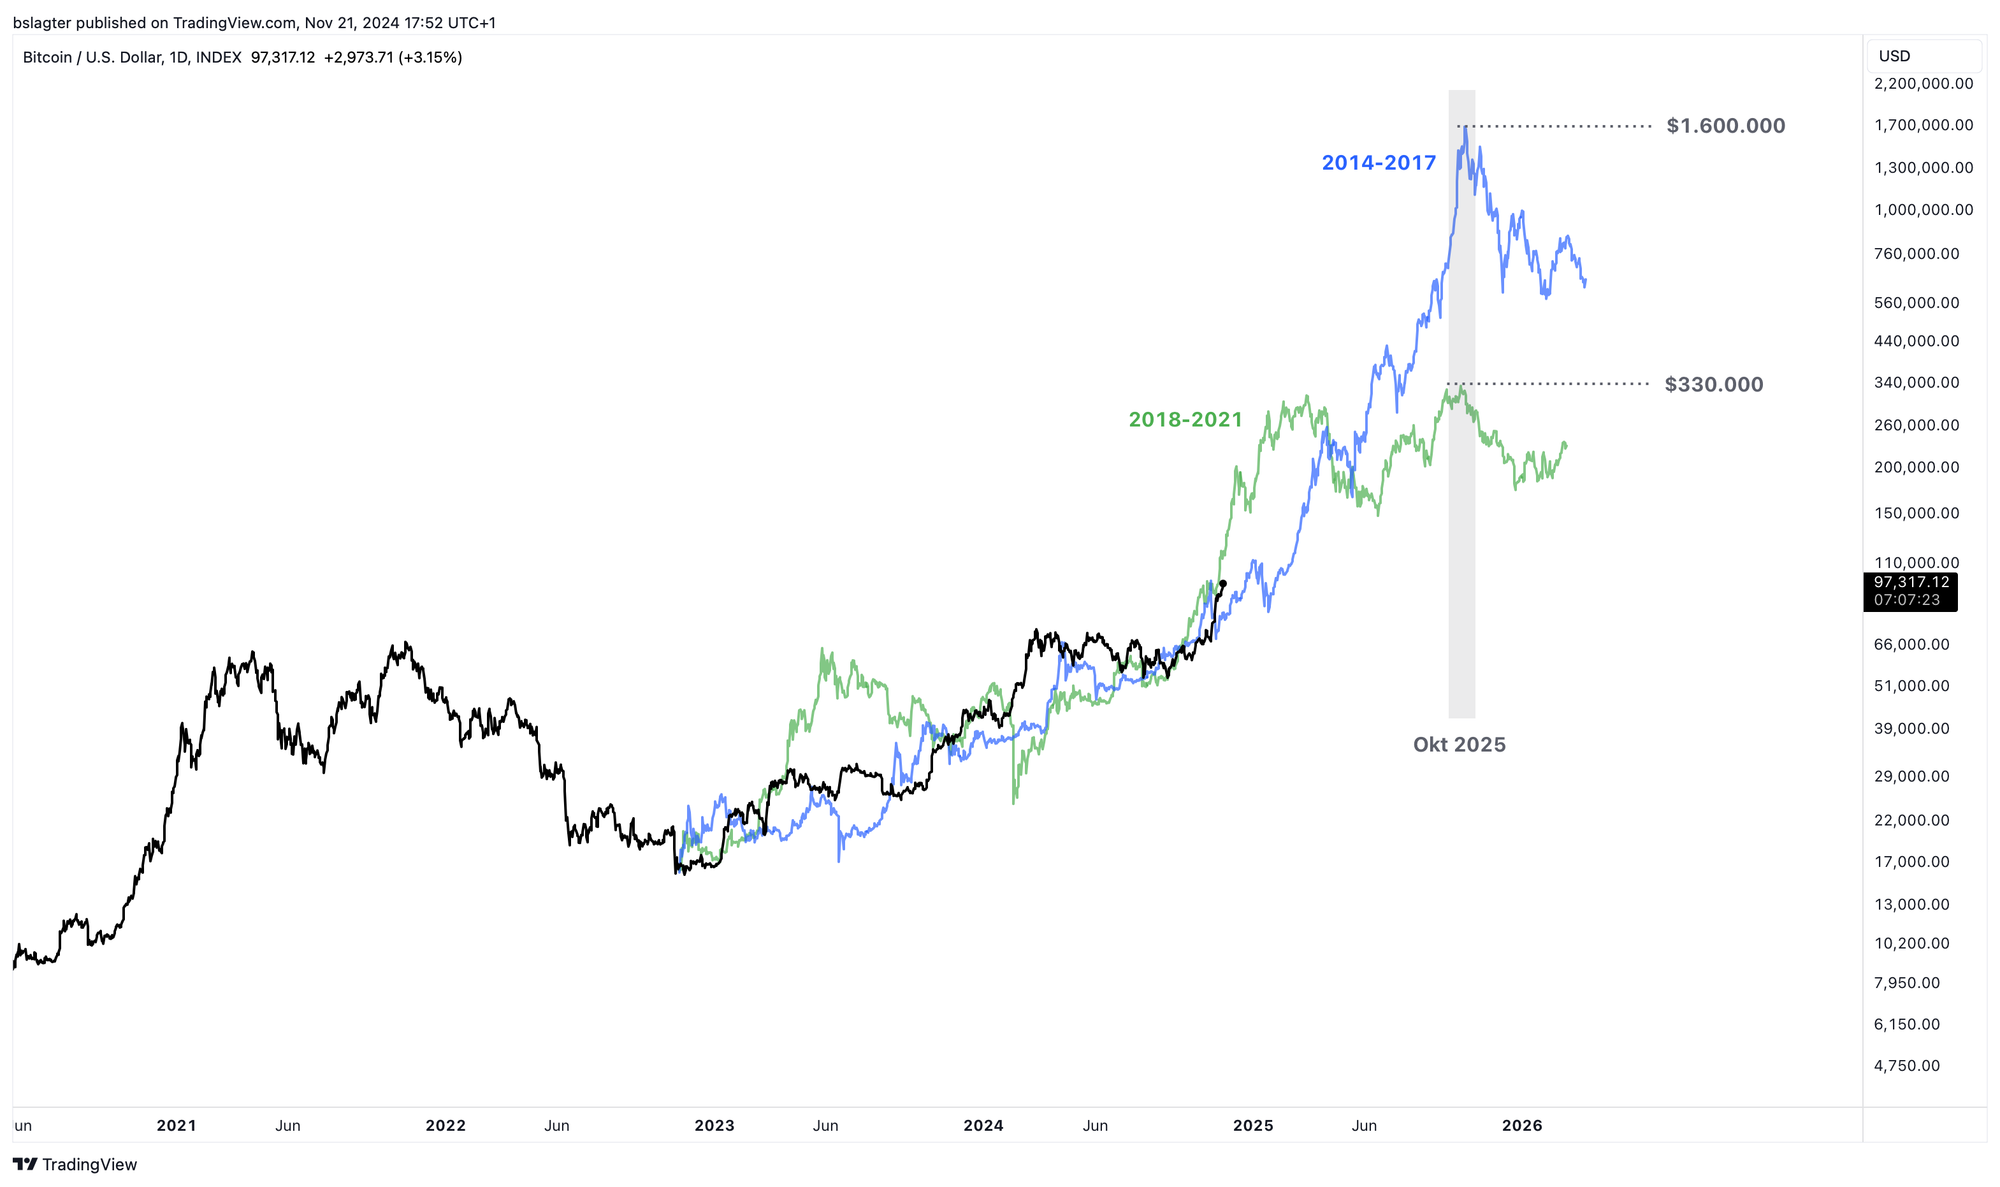
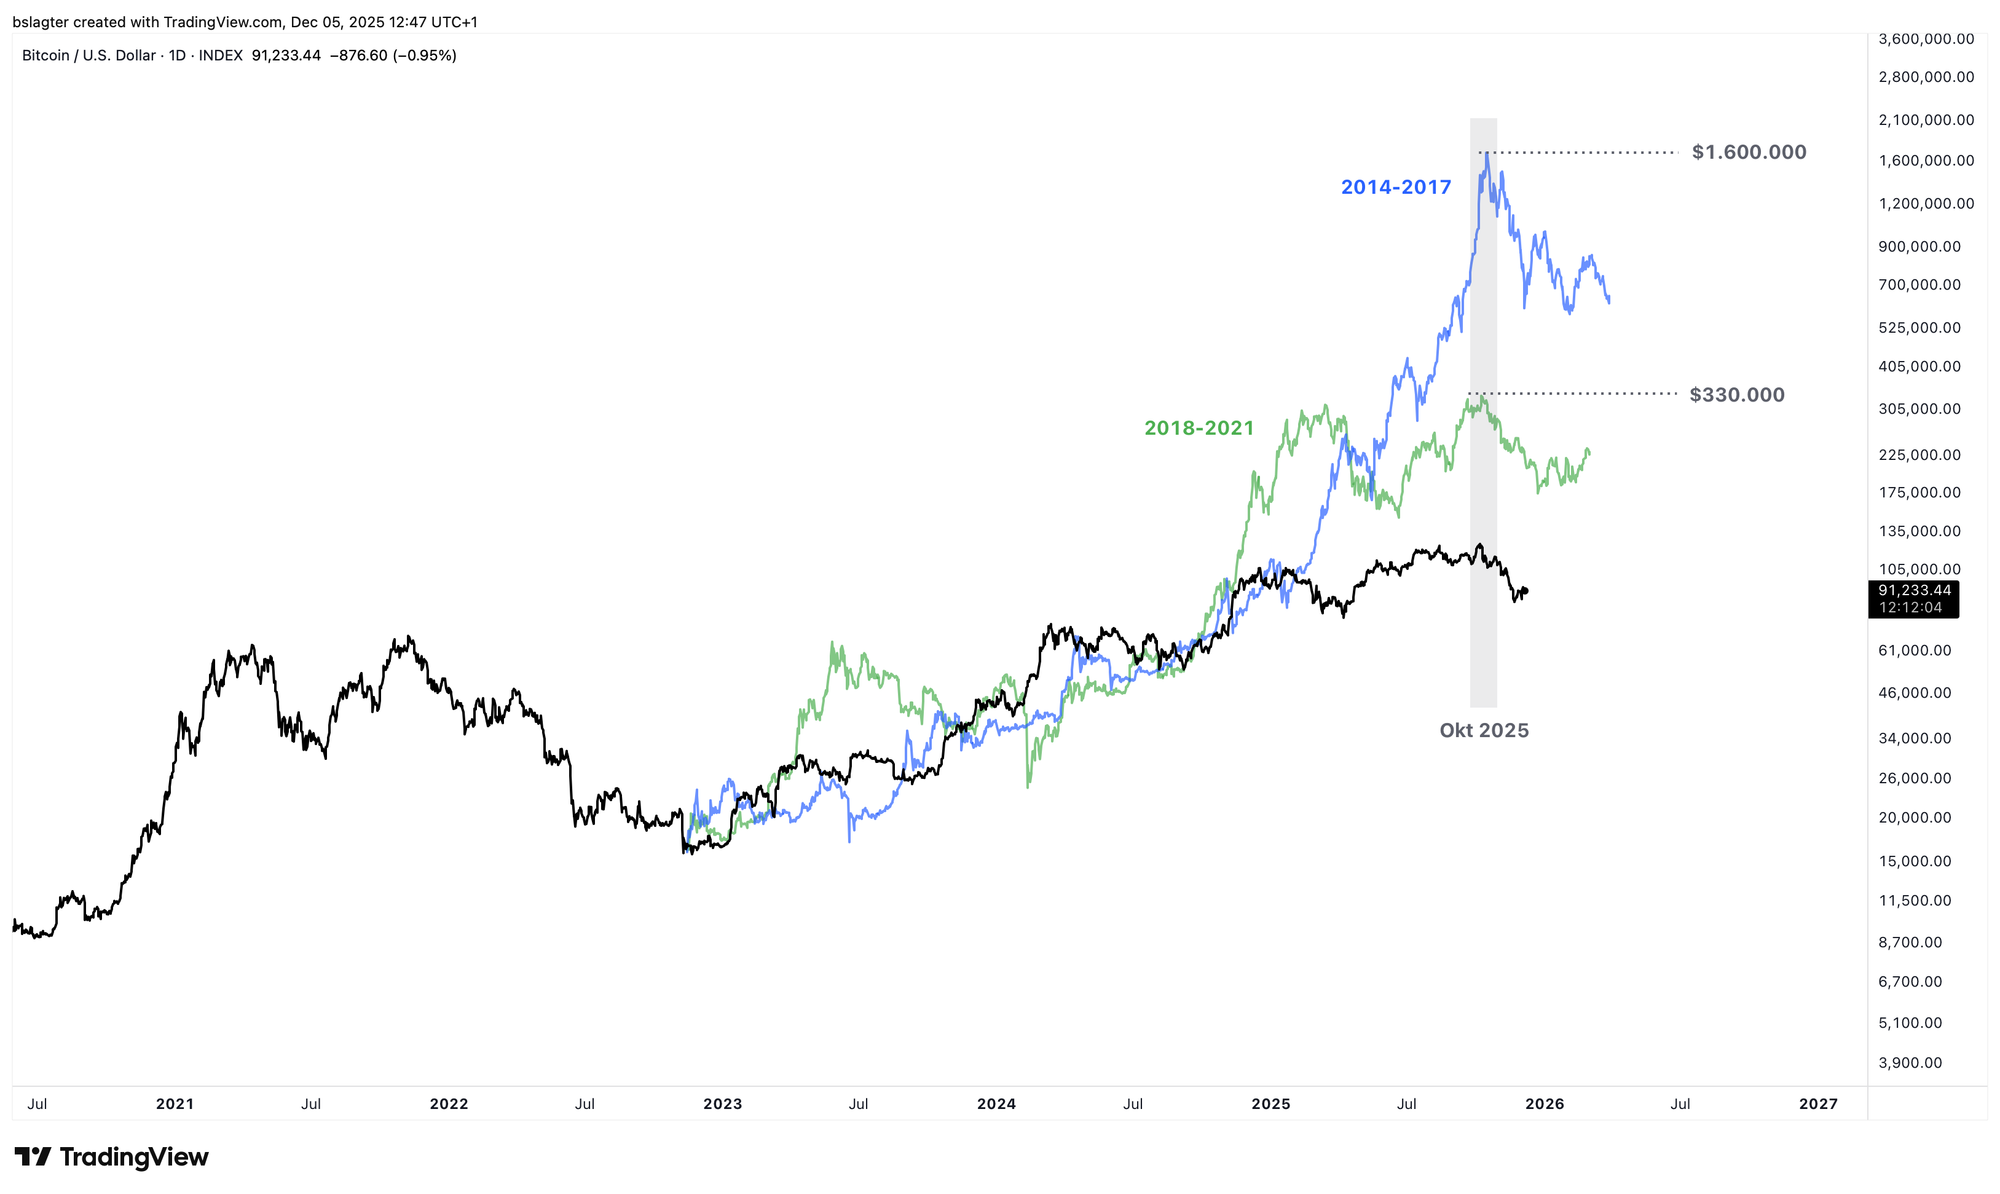
The recent weekly cycle was disappointing—not just in sentiment, but in the numbers too. The top at $126,000 was only 16% higher than the previous top at $109,000. And the rise from the bottom was just 70%—significantly less than previous cycles, which roughly doubled.
What's also striking is that the shape of the correction has gradually shifted from horizontal to sharply declining as this bull market has matured. The depth has increased from 21% in the first two corrections to above 30% in the last two.
This illustrates the fading momentum of this bull market. Is it over? We'll only know for sure with a lower high (LH) below $126,000 and a lower low (LL) below $80,500. But when we lay out all the clues like puzzle pieces on the table, the picture that emerges really does suggest we're heading toward the yearly cycle low.
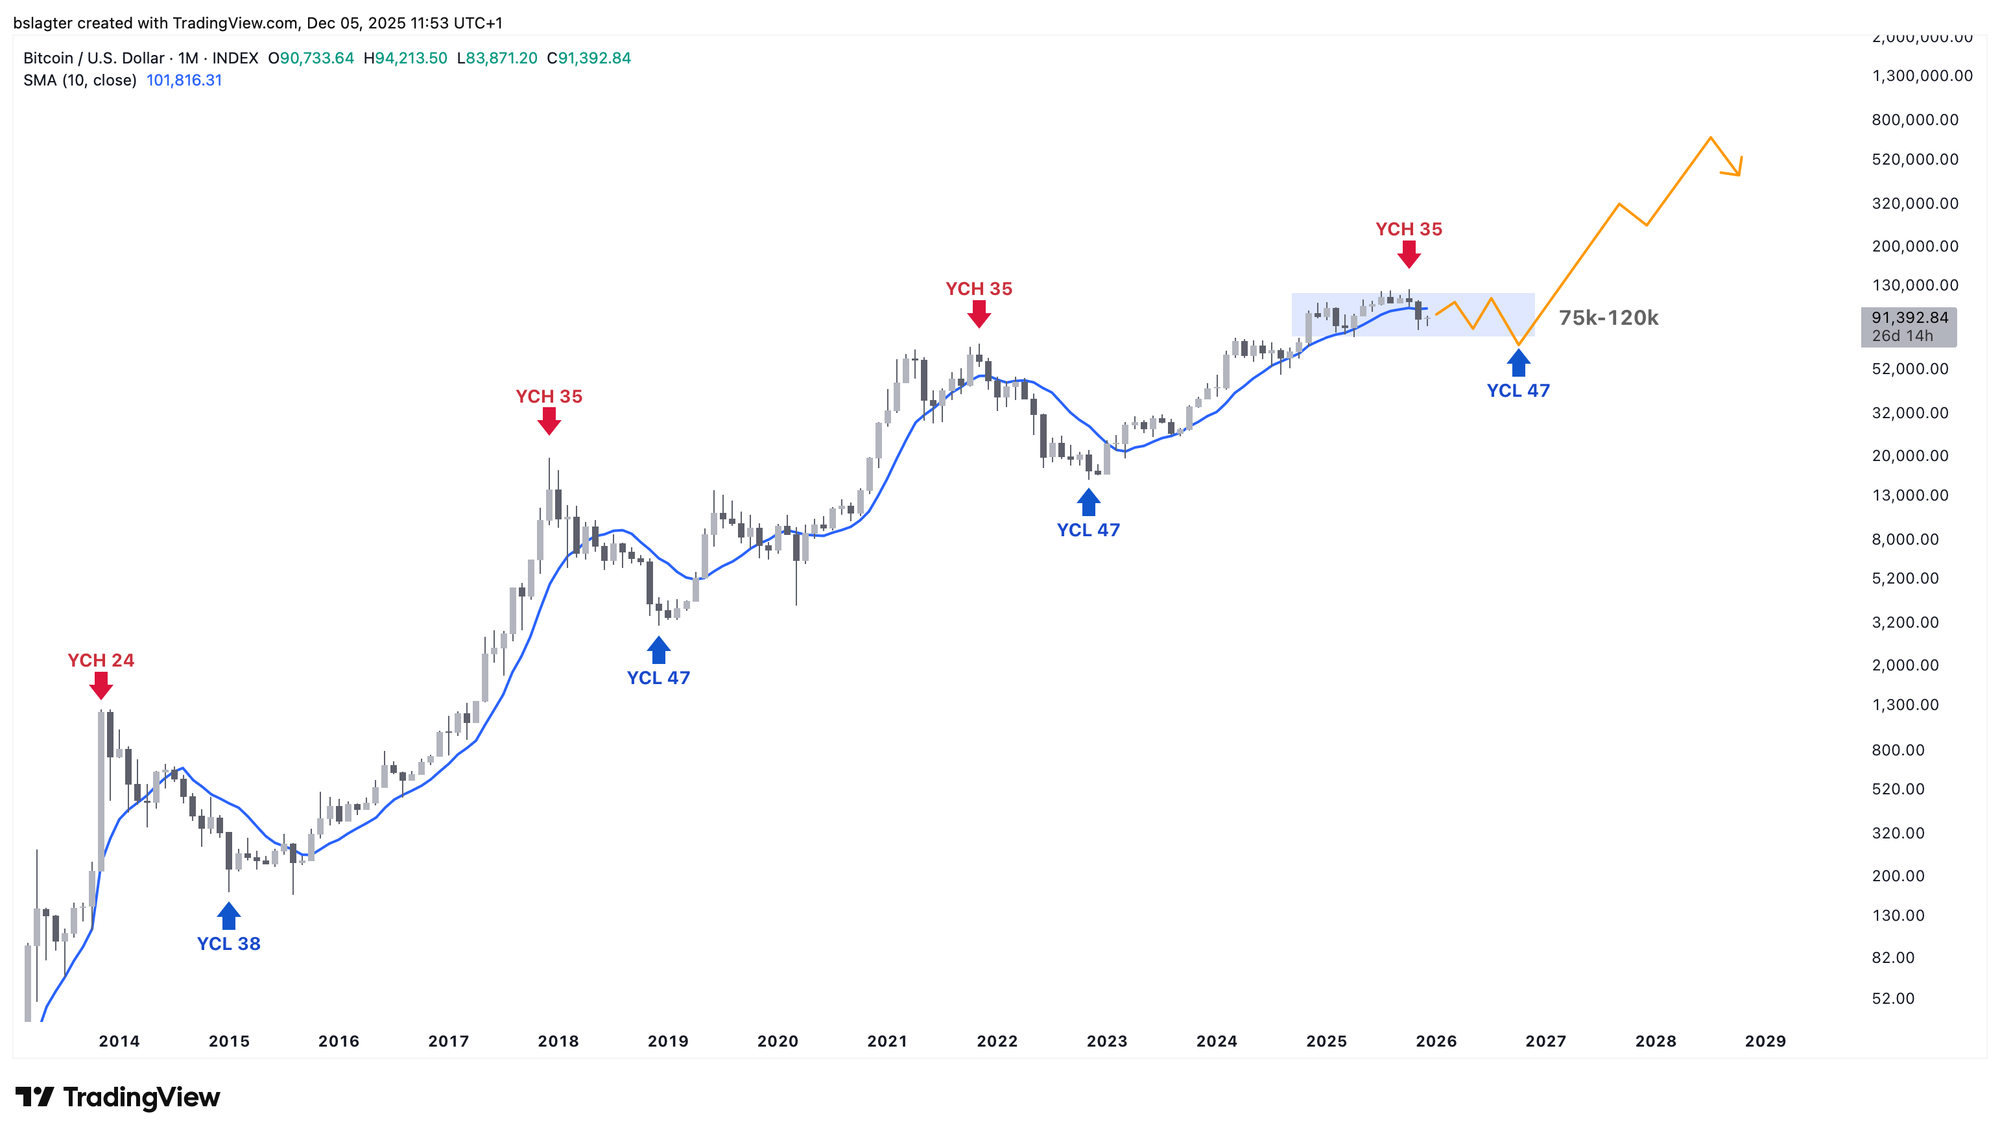
In the November 14th Alpha Markets, we described three variants of a bear market. The mildest variant will feel like a long, deep correction. The harshest variant is a typical crypto winter with an 80% decline.
For now, we're leaning toward the milder end of the spectrum. In the ideal case, it will feel like an extended correction. Perhaps in a few years, we'll look back and see the entire 2025-2026 period as one long trading range between roughly $75k and $120k.
The chart below shows Bitcoin's yearly cycle, with a sketch of what a shallow bear market could look like.
1️⃣ Bitcoin compared to...
Bert
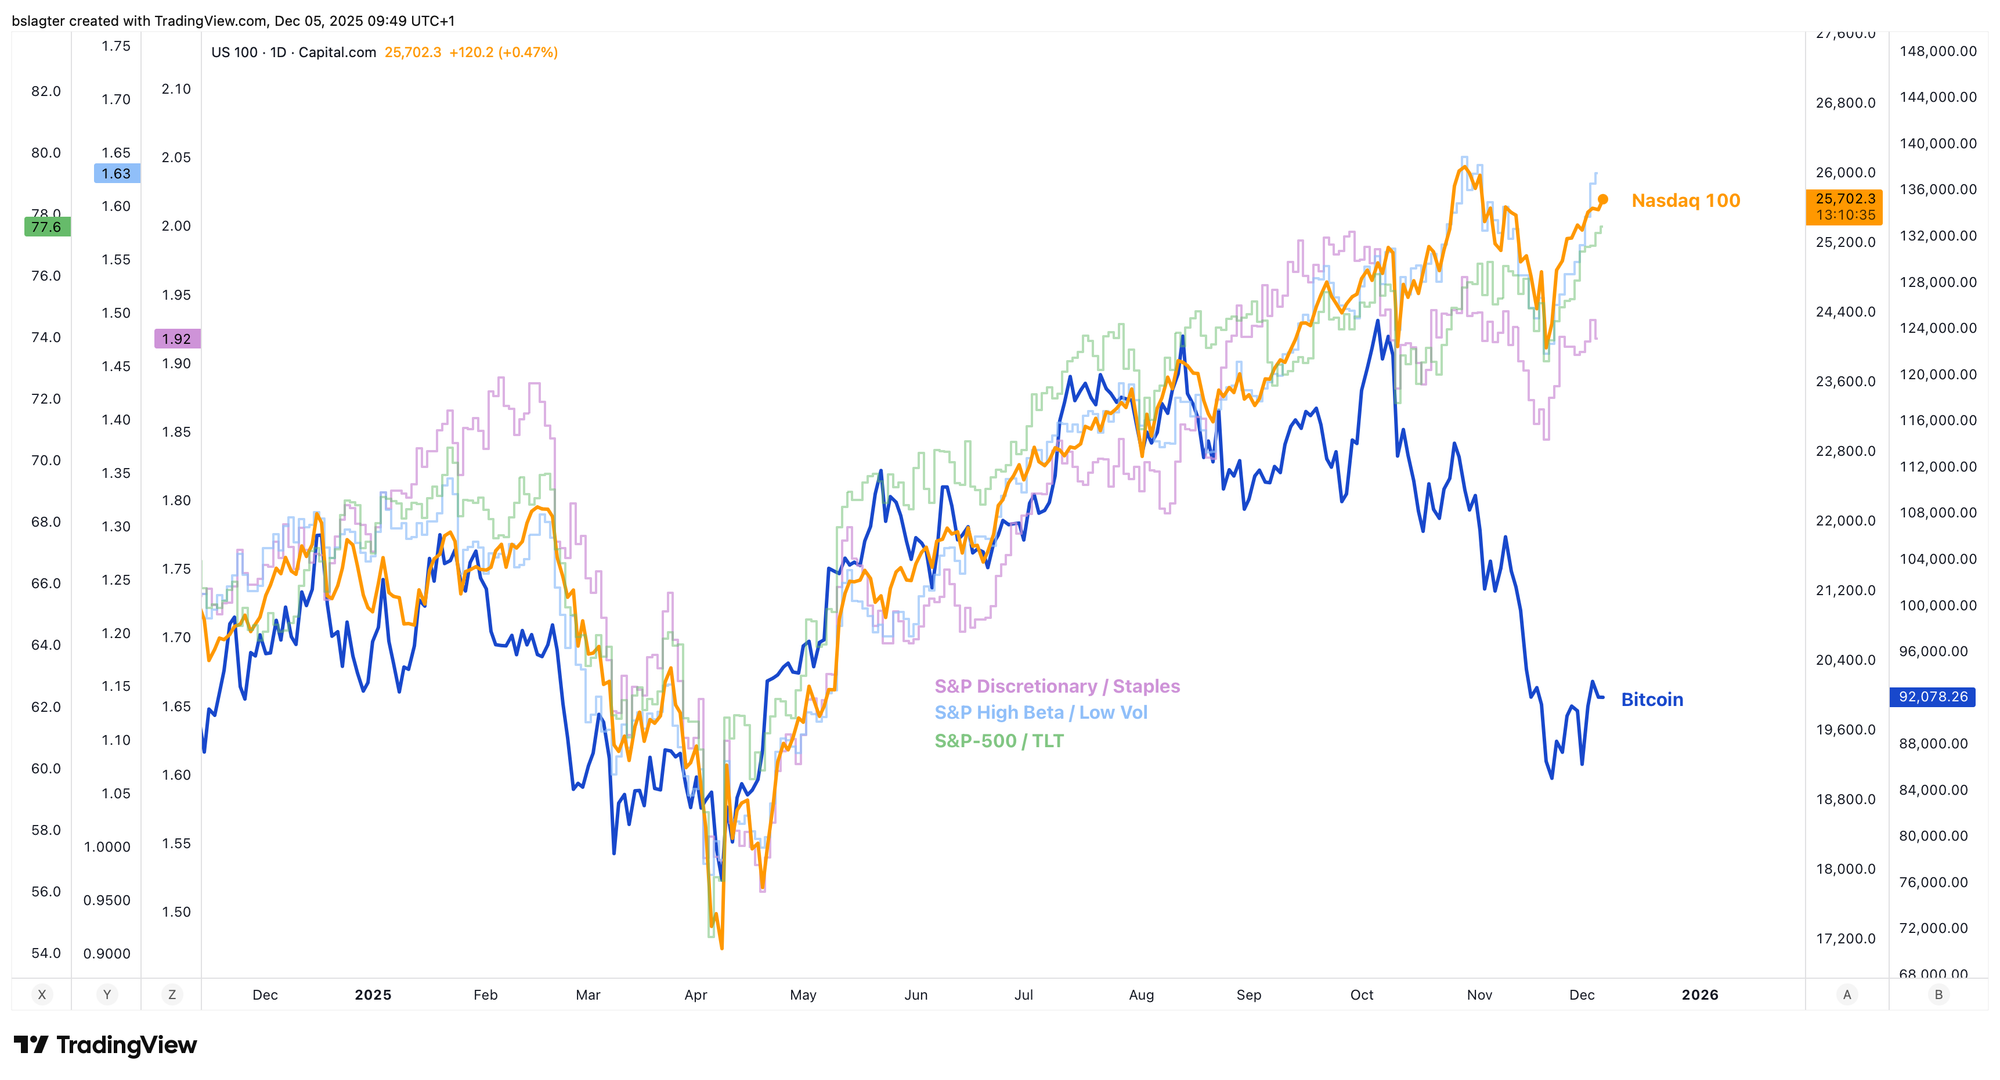
Increasing risk appetite is typically good for bitcoin. The same goes for an optimistic mood in the stock market. In the two charts below, we try to capture those forces. We created them earlier; now we've updated them with the latest data.
First, risk appetite. We measure it using three ratios:
- S&P High Beta vs. S&P Low Volatility
- S&P Discretionary vs. S&P Staples
- S&P 500 vs. TLT (bonds)
The first item in each pair performs better in a risk-on environment, while the second does better in a risk-off environment. In an optimistic market, these ratios rise; in a defensive market, they fall. We can clearly see how bitcoin and the Nasdaq-100 tech index move in sync with these ratios. Until August, when bitcoin suddenly started lagging.
Since then, the relationship has only become more skewed, while the Nasdaq-100 continues to move in lockstep.
Next, stock market sentiment. We discussed the chart below in the November 7th Alpha Markets under the heading 'Fooled by treasury companies.' At that time, bitcoin was still tracking the equal-weight version of the S&P 500, where each stock carries the same weight. Now, bitcoin is well below it.
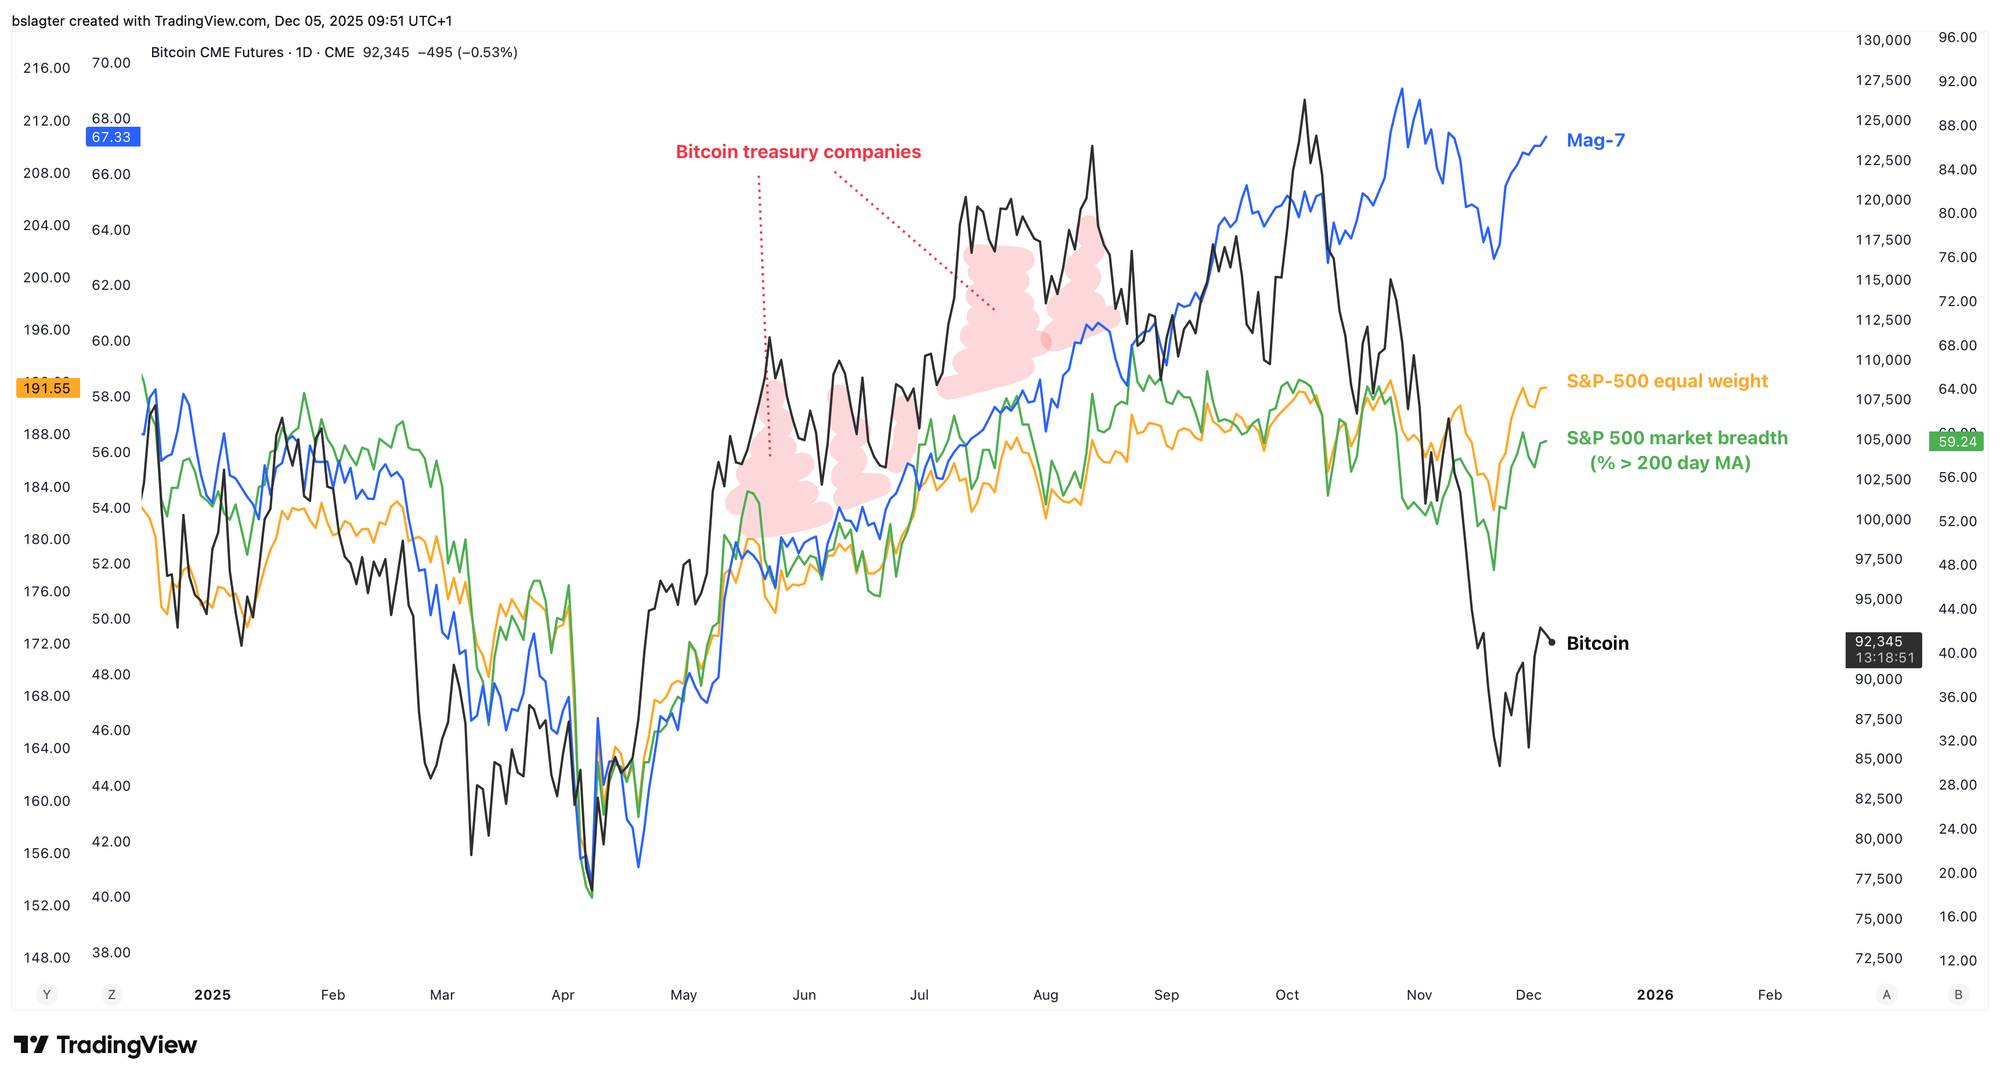
It's important to realize with these "overlay charts" that there's no inevitable or unbreakable connection between the two data series. They move in the same direction much of the time, but sometimes they don't.
They draw our attention to a notable discrepancy—in this case, that bitcoin is underperforming relative to expectations. But that doesn't mean bitcoin will "therefore" catch up soon.
Furthermore, I think we can now conclude that bitcoin's weakness is coming from within the bitcoin market itself, not from external factors. That's no surprise when we look at the "big narratives" of recent months:
- The great rotation from OGs to new investors;
- The exodus toward AI and gold;
- The halving cycle myth;
- Breaking through the dominant moving average.
This is largely specific to the crypto market. For once, it's not about war, recession, or monetary policy—just local weakness.
2️⃣ 2025 Predictions Revisited
Bert
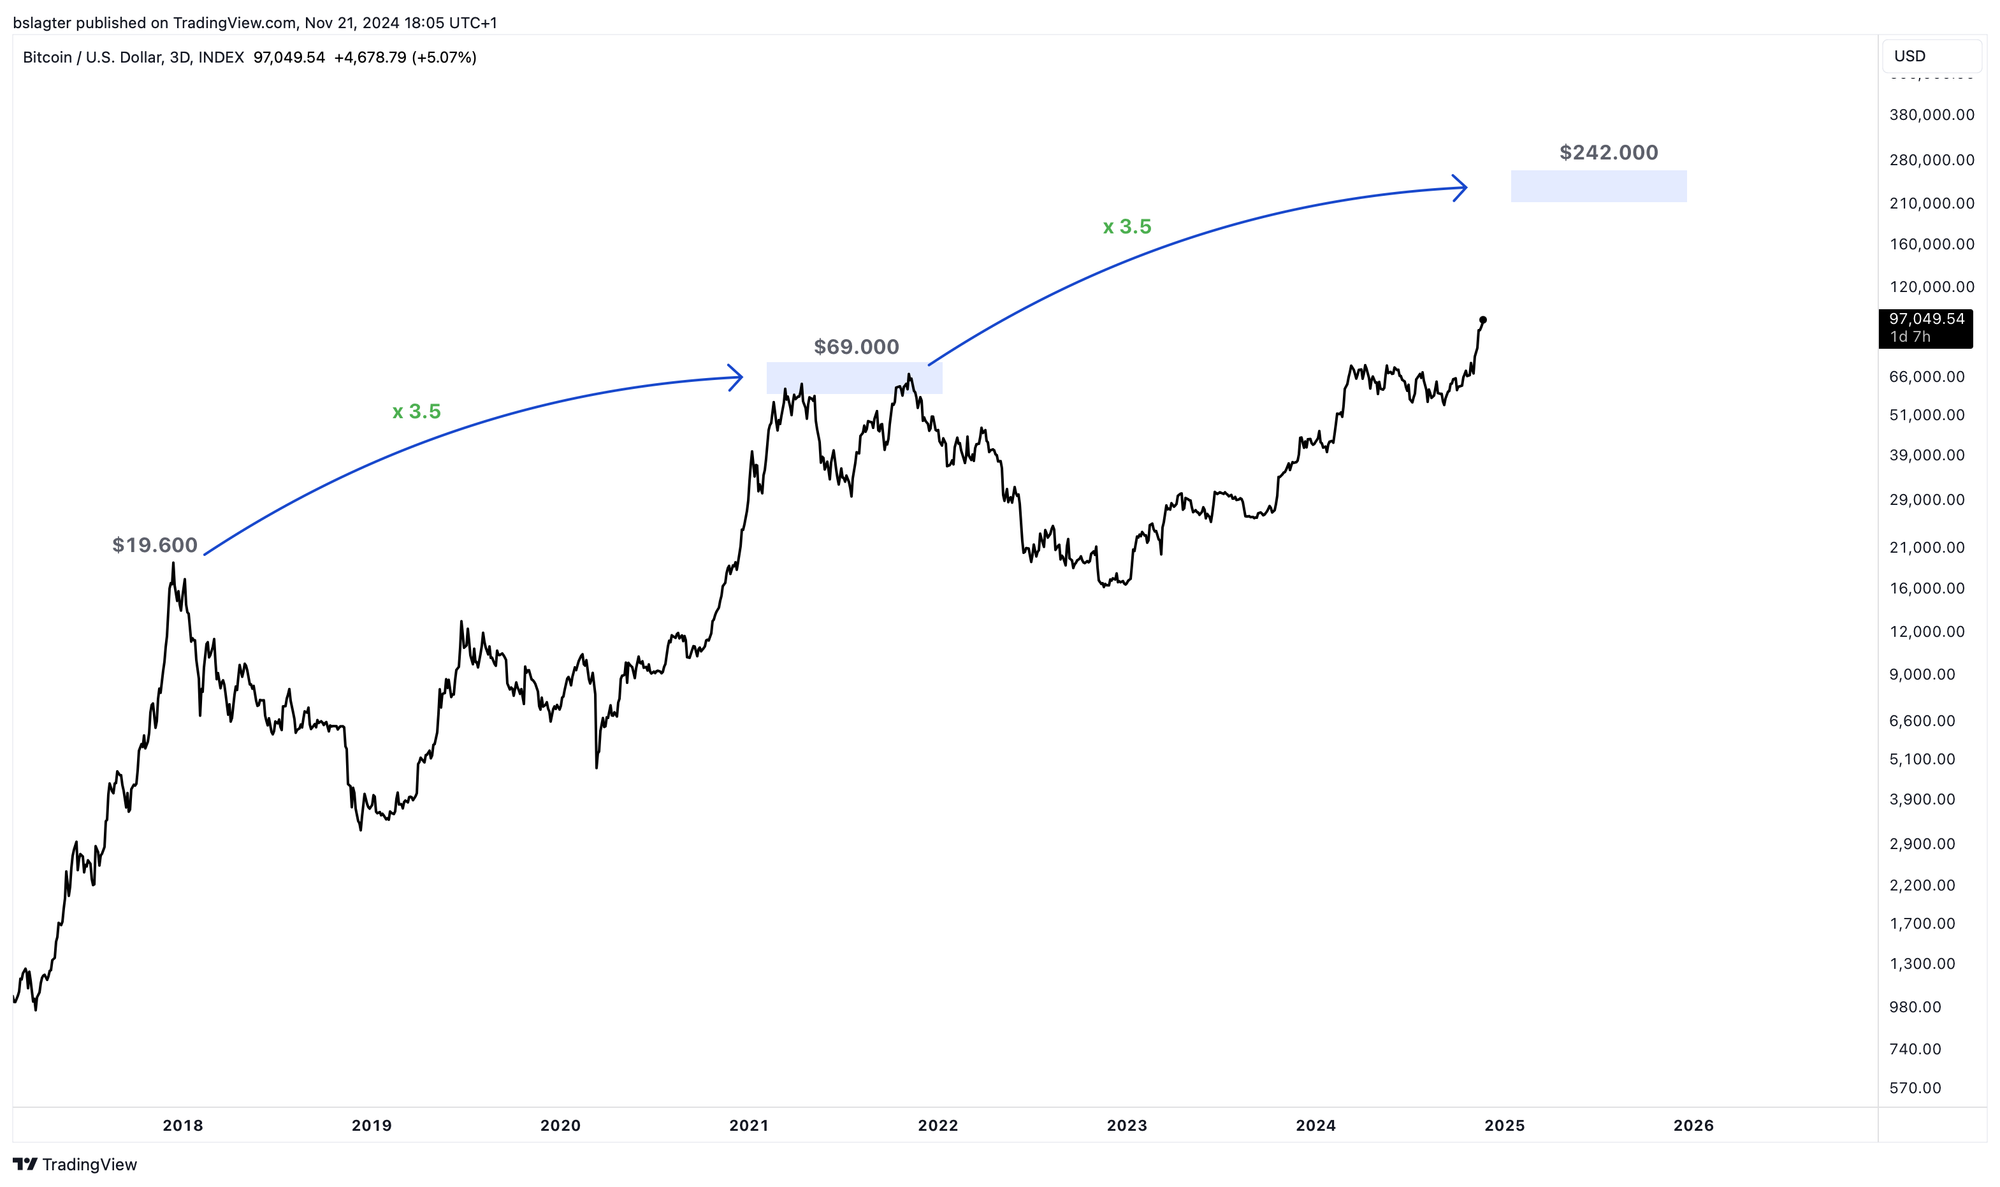
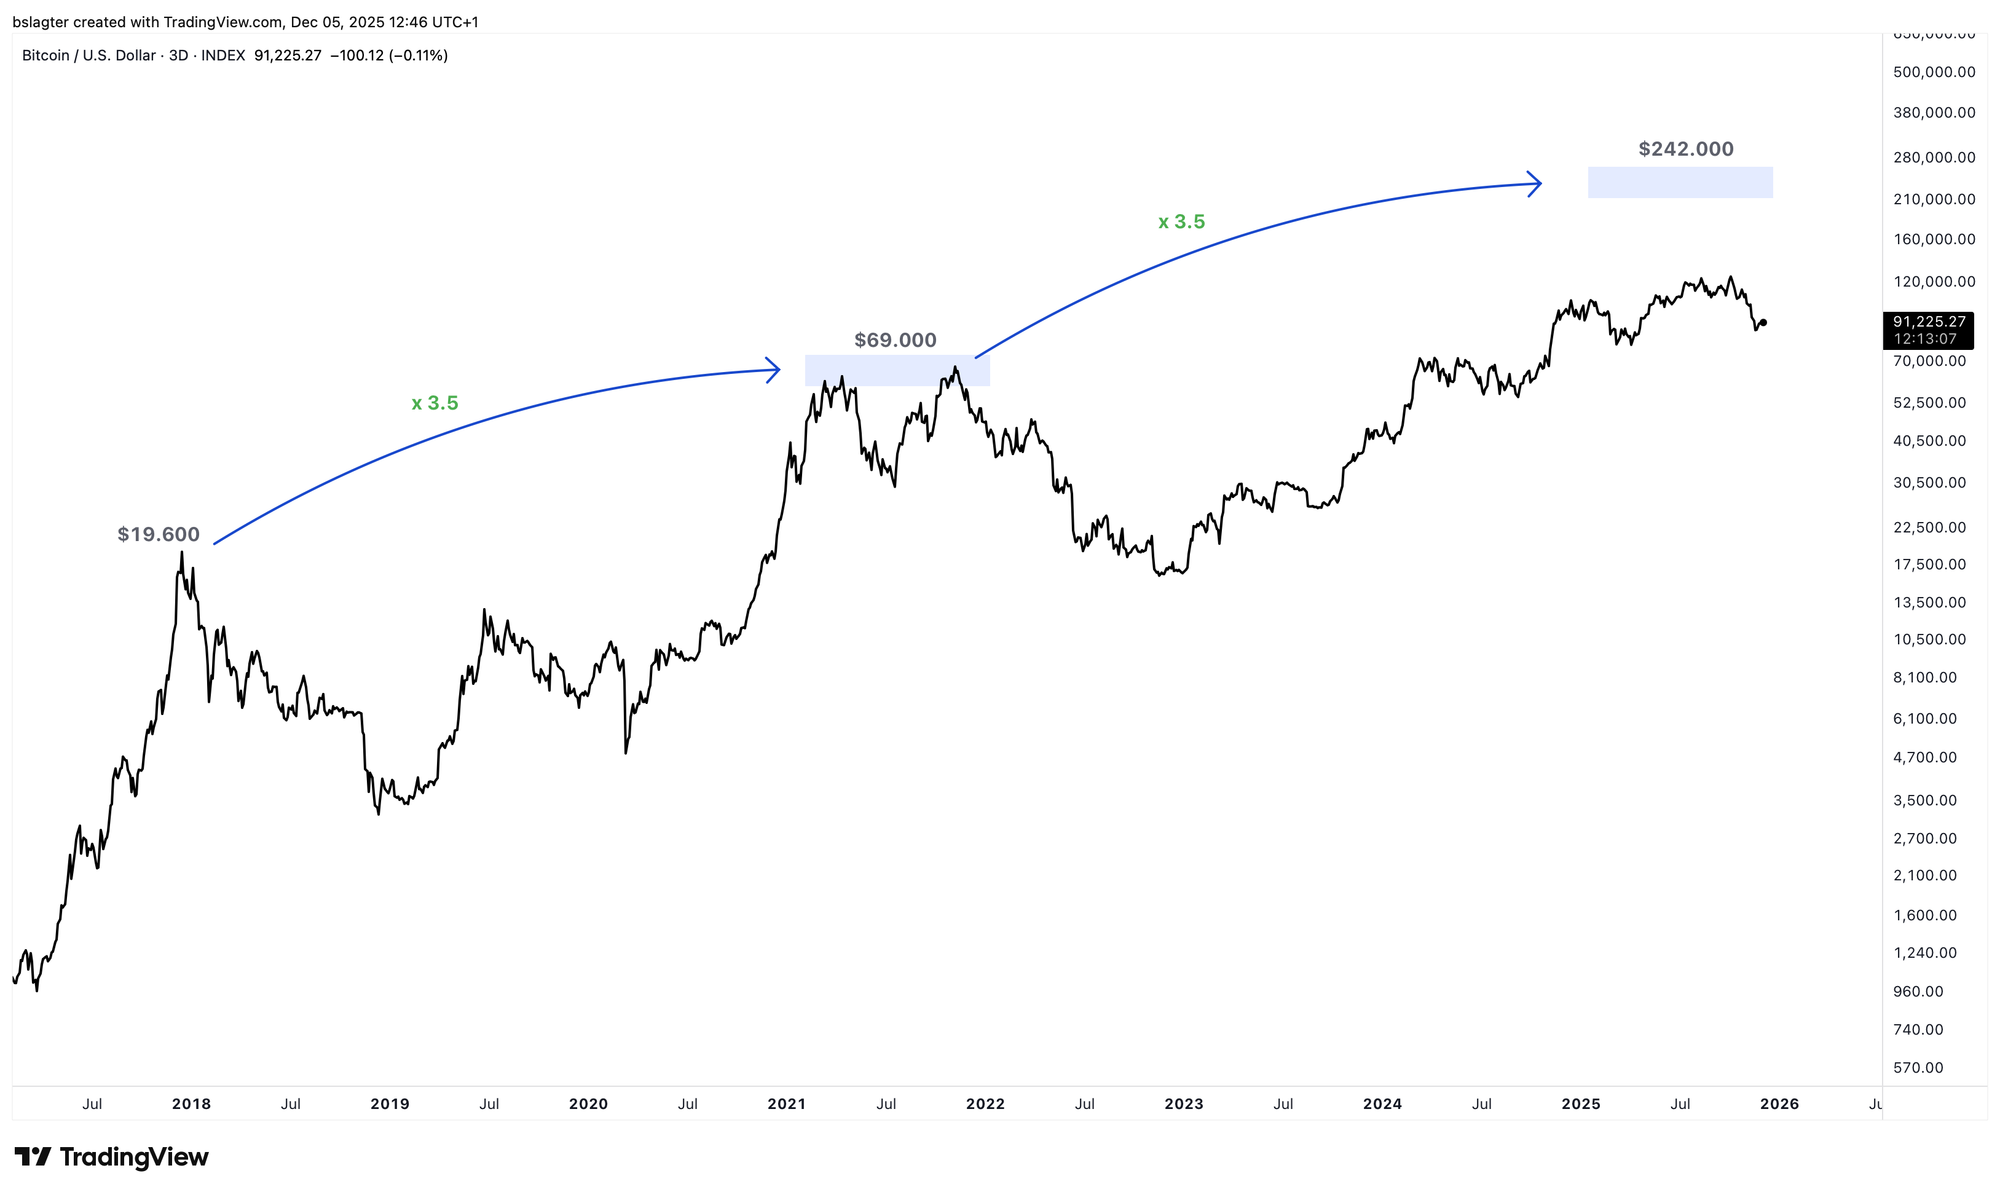
Just over a year ago, on November 22, 2024, we wrote an Alpha Markets piece about the bull market top. We had compiled 77 predictions from analysts and influencers into four dominant narratives, each with an associated price target:
- Diminishing Returns: $150k
- Power Law: $250k
- Adoption Curve: $350k
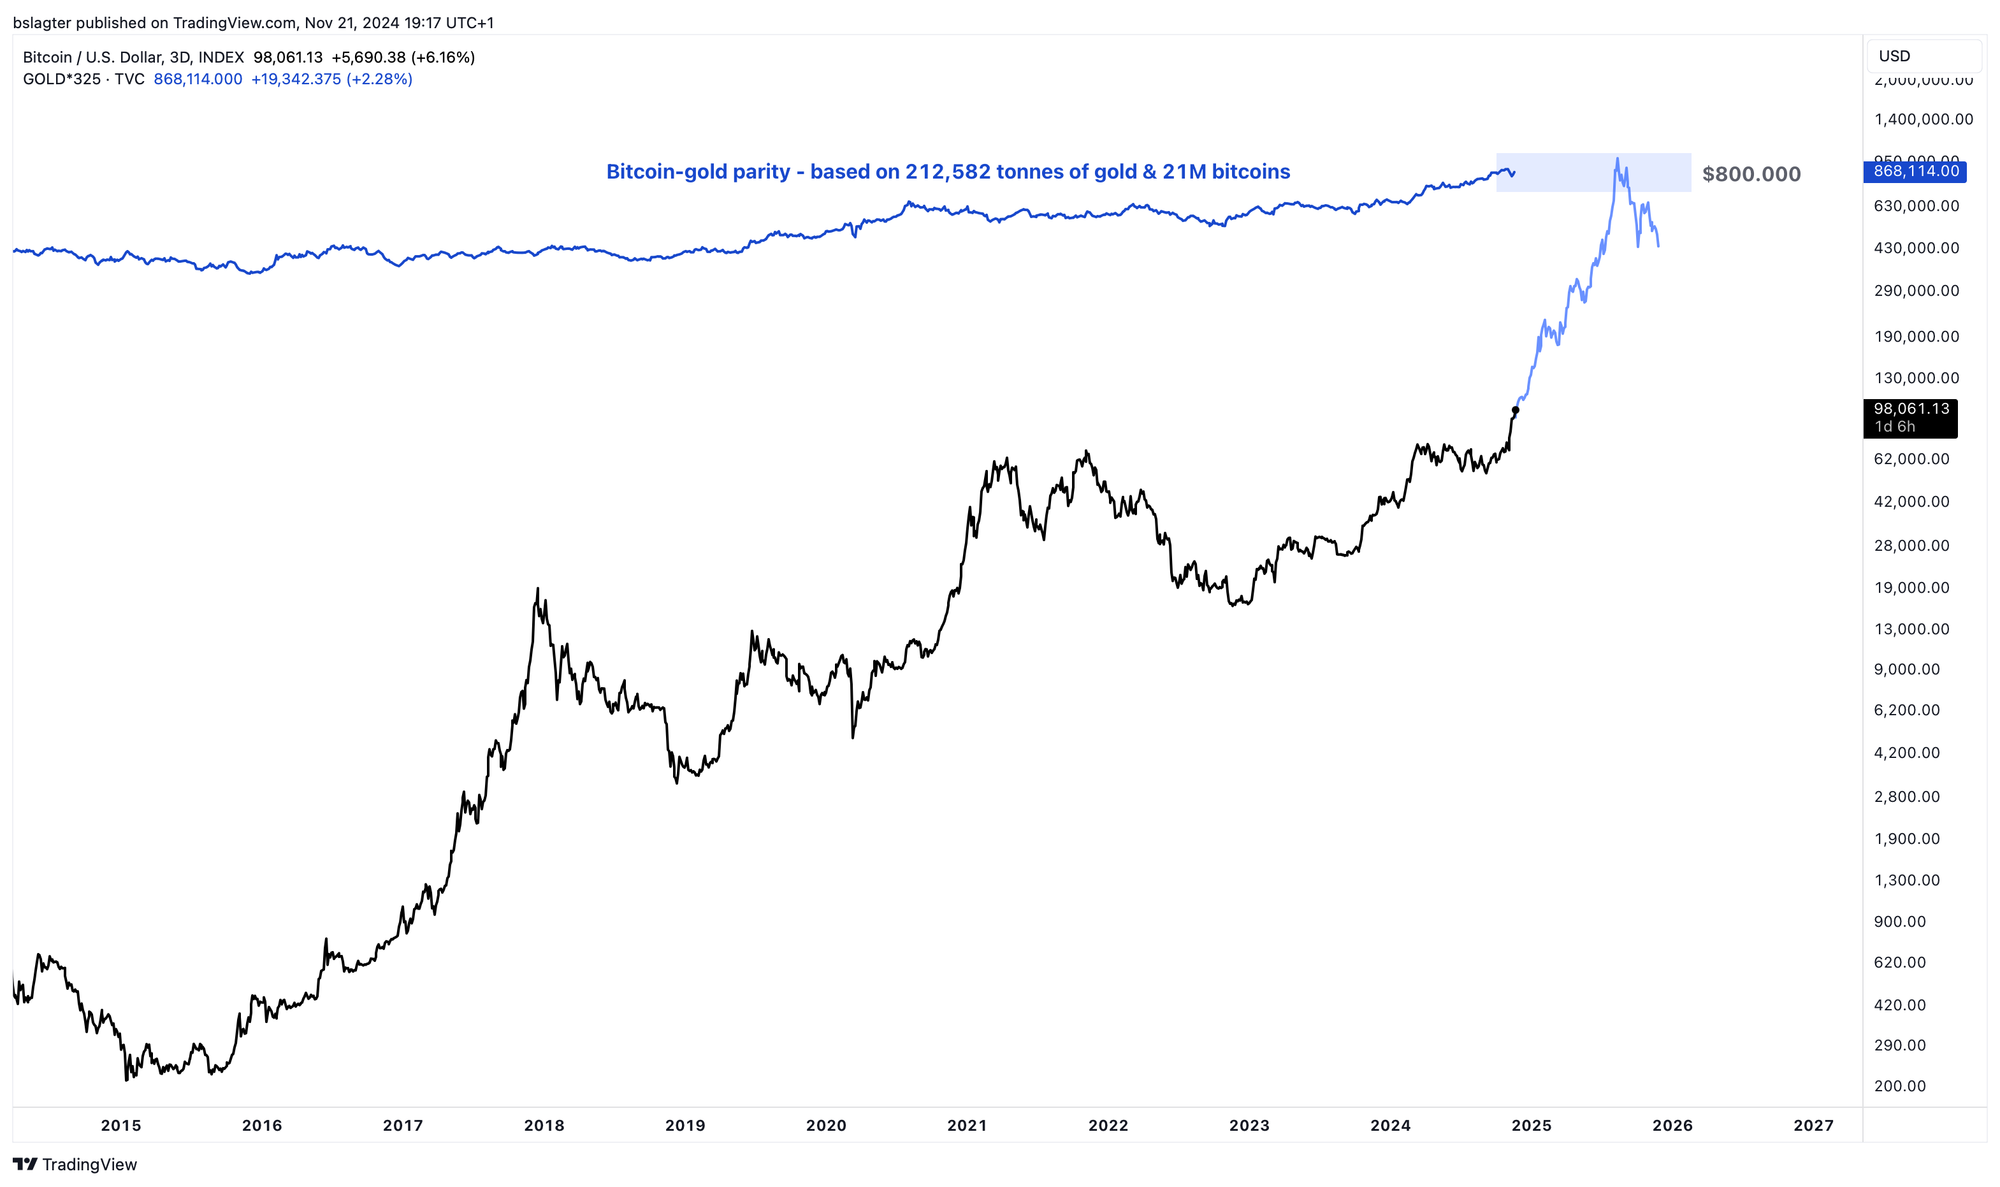
- Gold Parity: $800k
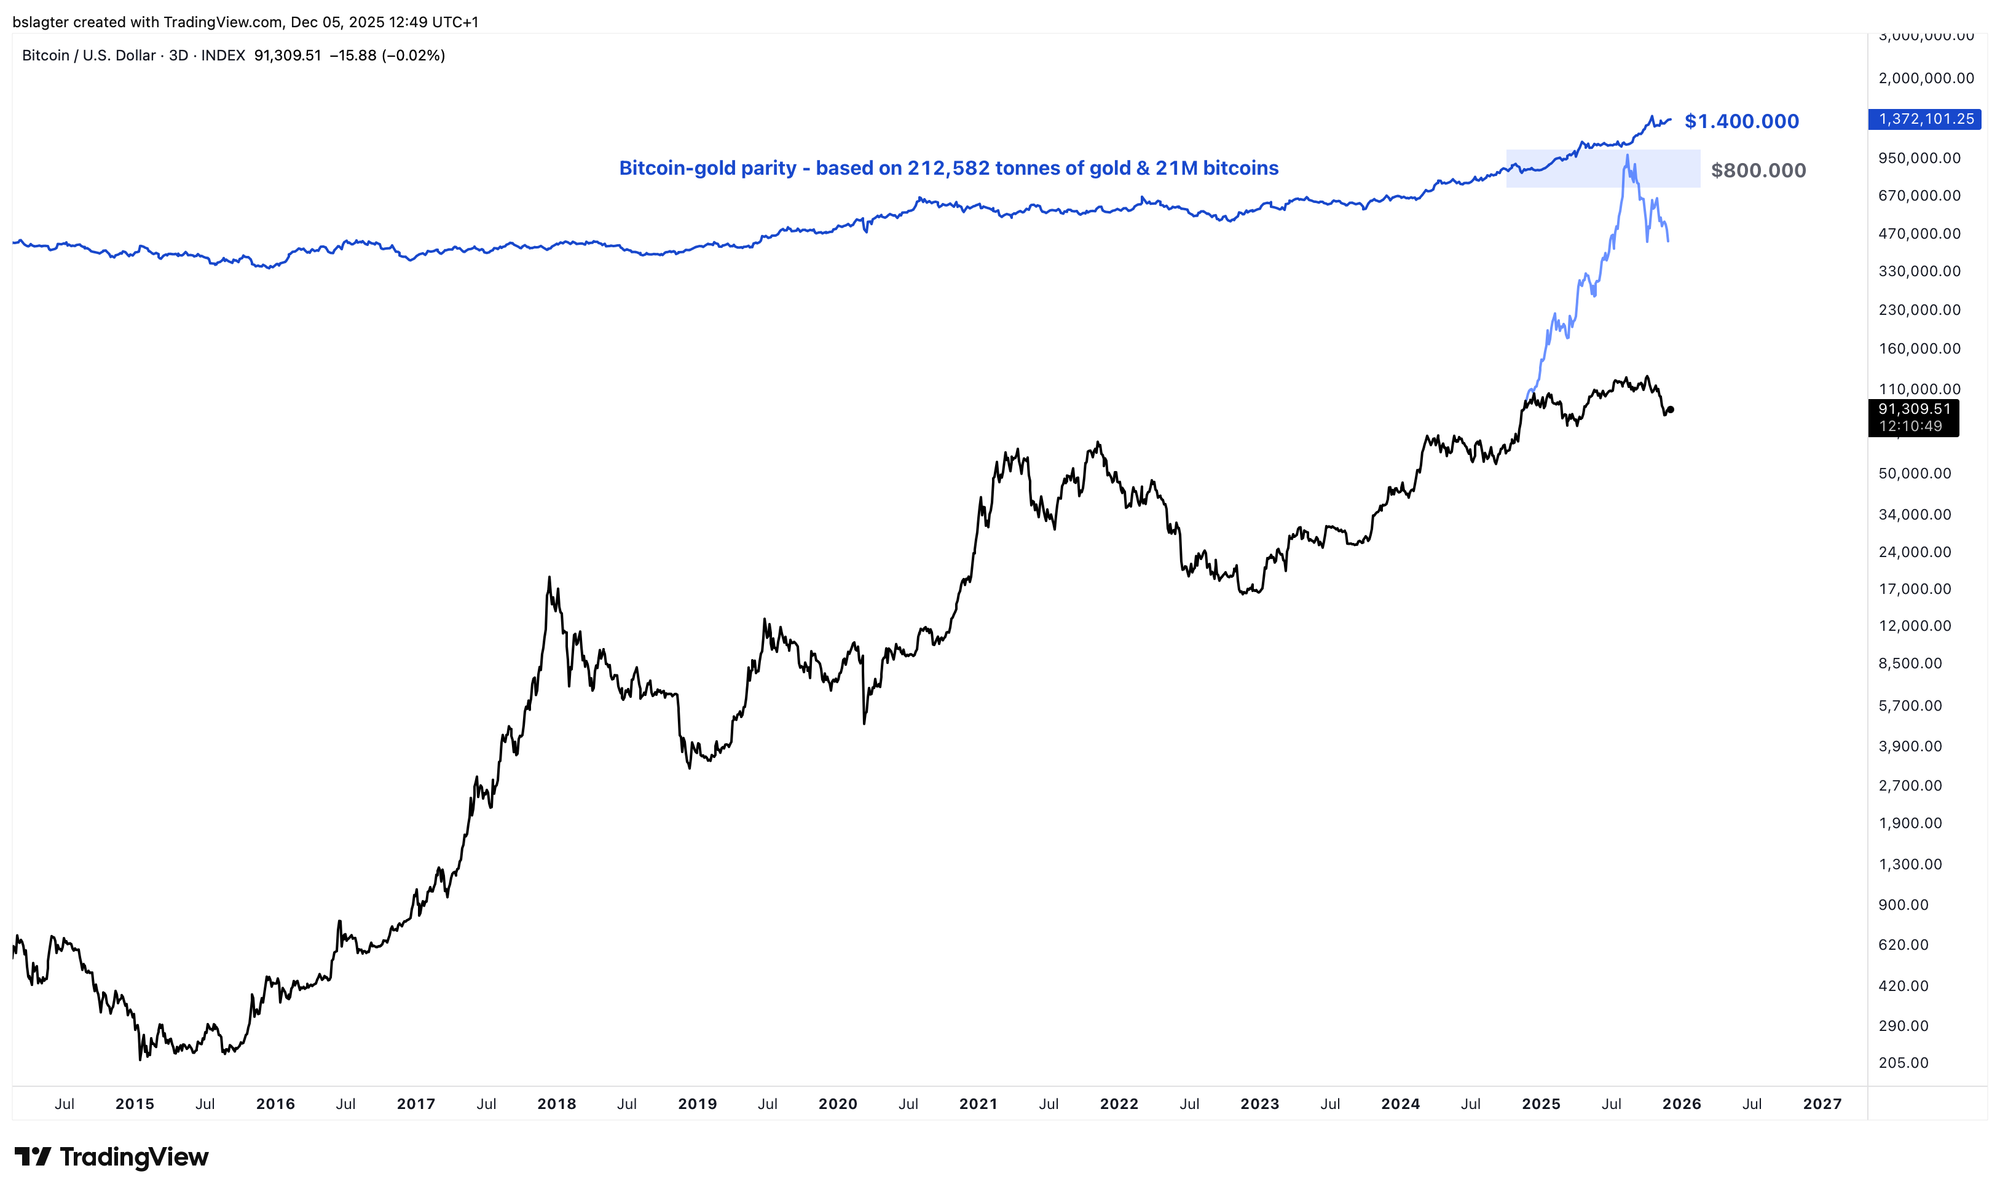
We thought it would be interesting to show the charts we created back then, with the updated versions directly below.
The conclusion is painful: even the most conservative scenario wasn't reached. The charts beautifully illustrate just how much worse 2025 turned out compared to what was generally expected.
Of course, that's no surprise—we've extensively discussed the discrepancy over the past months between the inflow of new capital in 2025 (enormous) and the price increase in 2025 (very limited). How will we look back on this in a few years? No idea. For now, we'll stick with the hard reality of missed predictions.
(1) Diminishing Returns: $150k
The assumption was that market temperature and therefore overvaluation during bull runs would peak a bit lower each cycle. But even this more modest top wasn't reached.
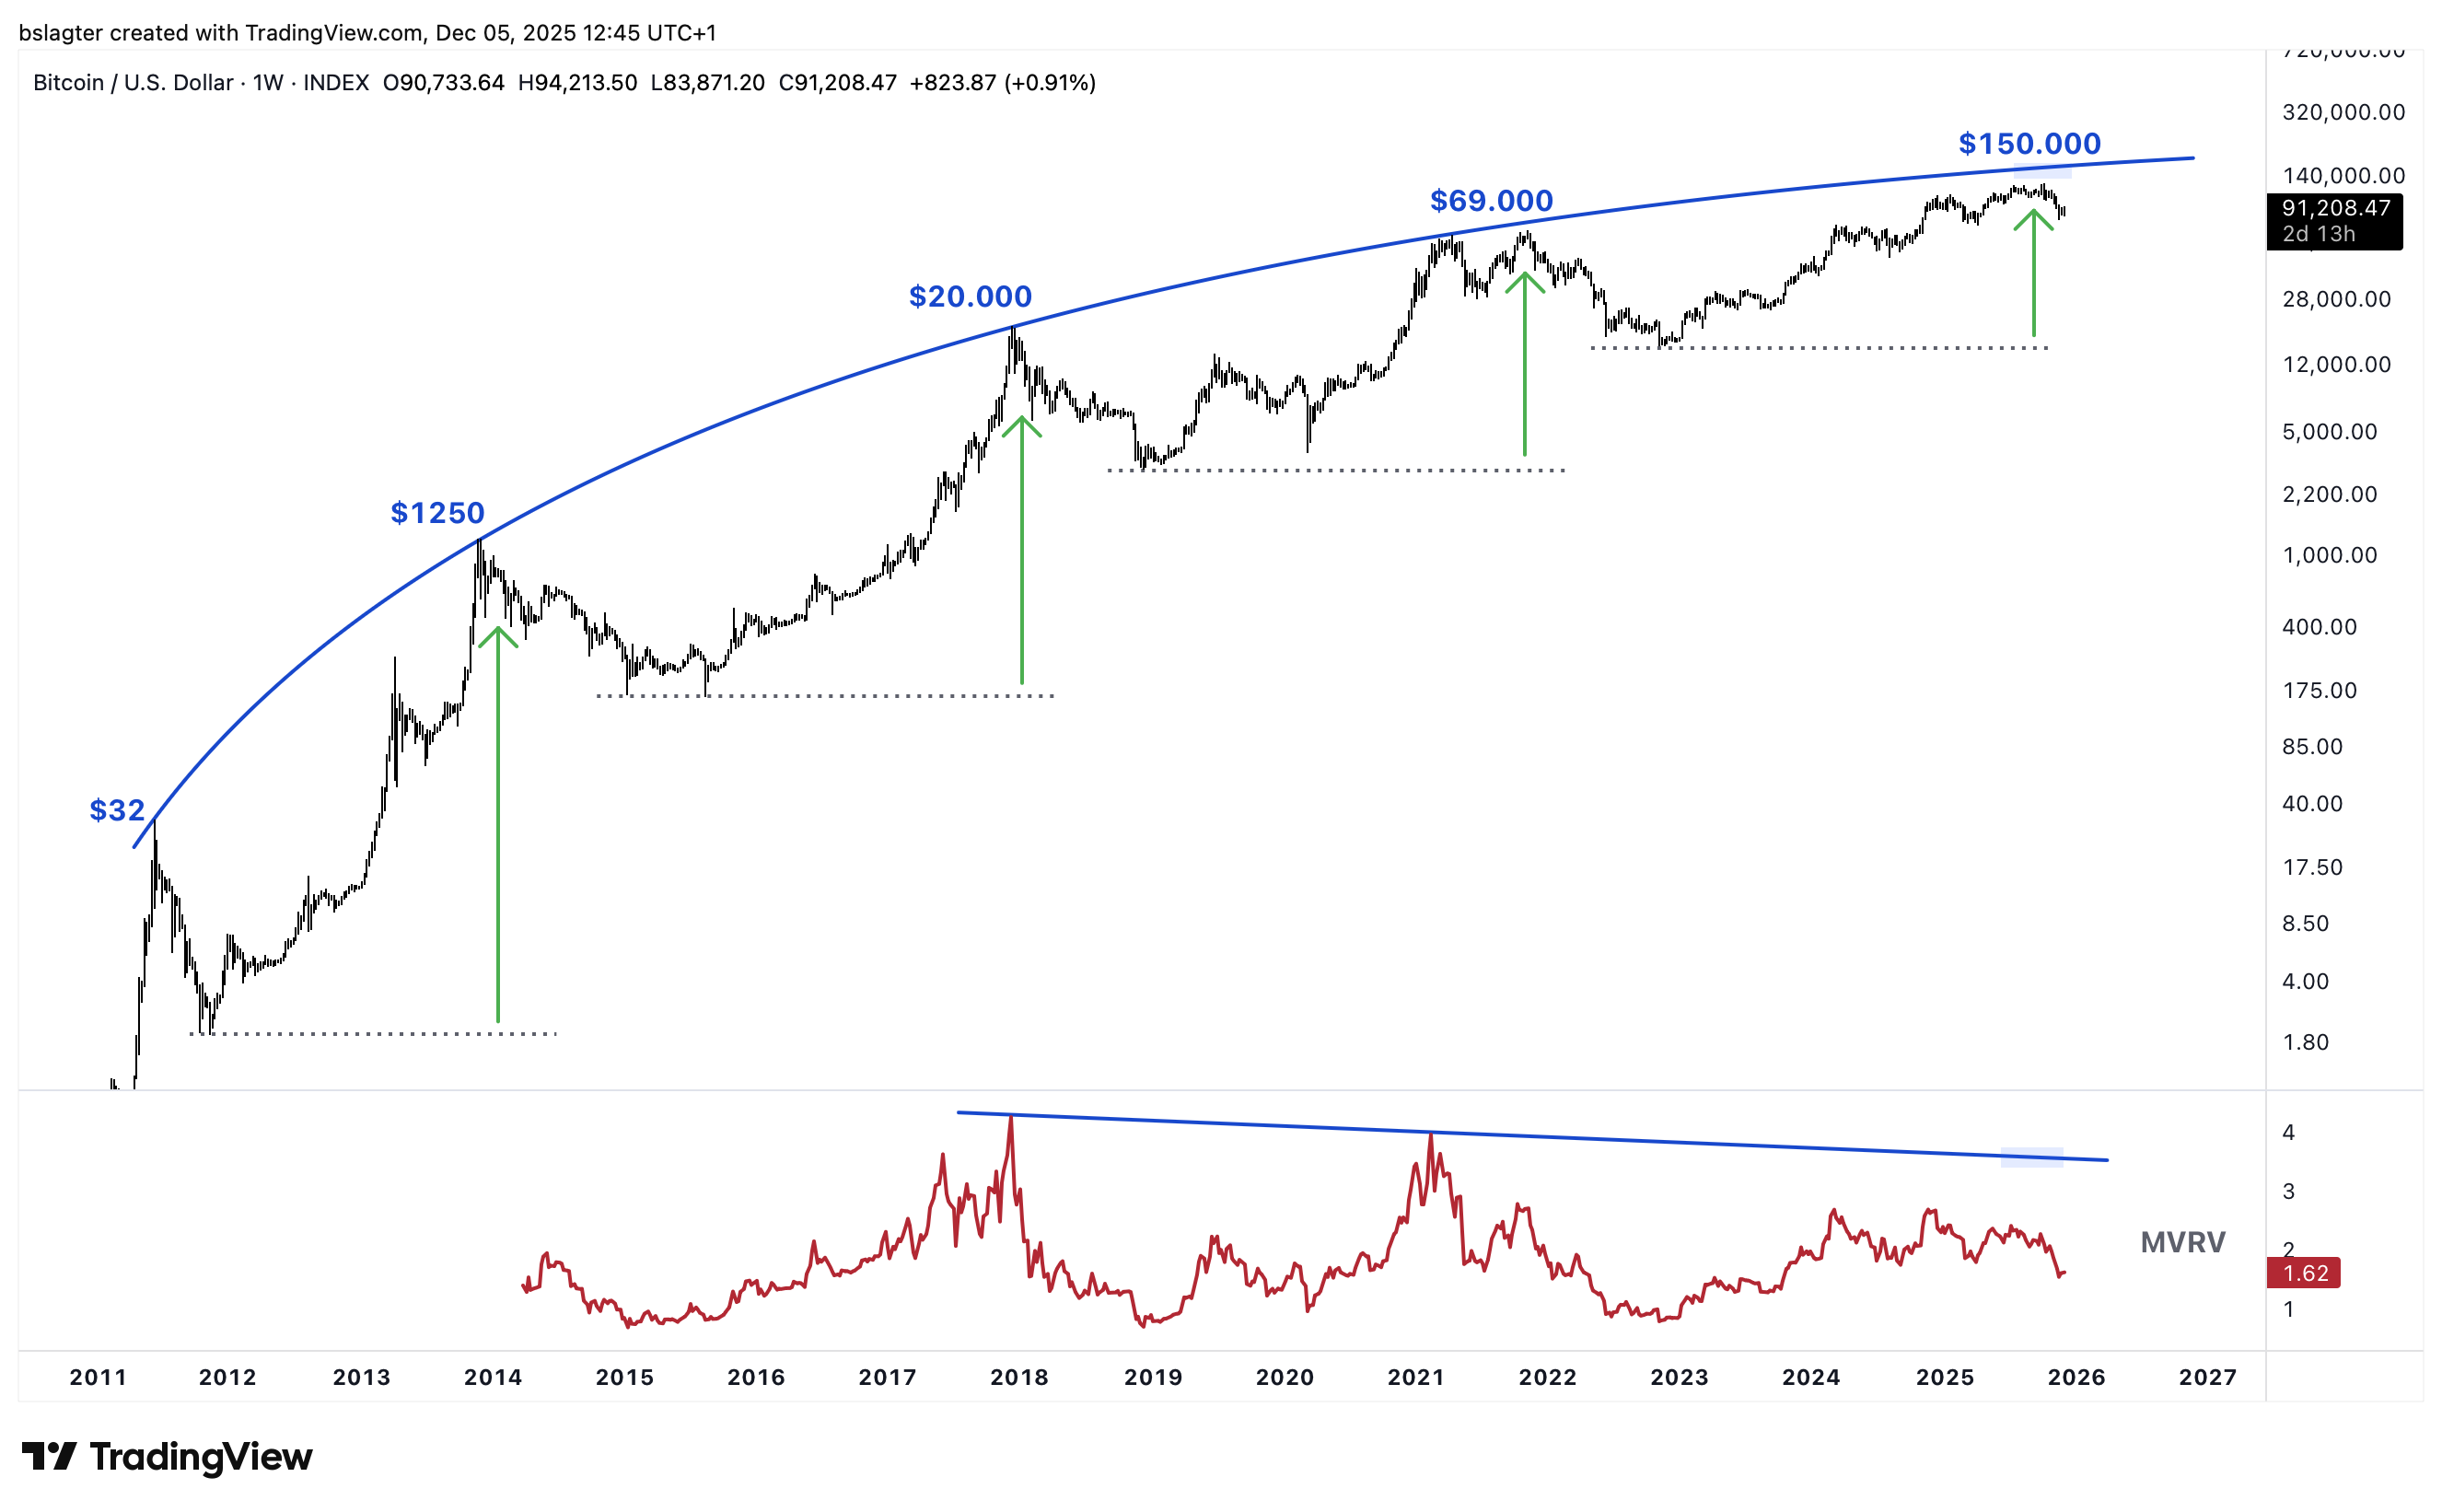
(2) Power Law: $250k
Based on the Power Law—a popular model at the time—the top was projected at around $250,000. Using the ratio between bull markets also gets you to roughly this price.
(3) Adoption Curve: $350k
Analysts who look at the relationship between adoption and price (using Metcalfe's Law) often arrive at figures between $350,000 and $500,000. We didn't have a good chart for that, but we did have one showing a repeat of the 2021 bull market. That also gets you to this price level.
(4) Gold Parity: $800k
A sizeable group of influencers expected bitcoin to match gold's market cap this bull market—or at least reach half of it. At the time, that worked out to roughly $800,000 per bitcoin. With the rise in gold prices since then, that would now be $1.4 million per bitcoin.
3️⃣ No strong arguments for a deep bear market
Thom
Bitcoin's price took quite a beating in November, and the sky-high expectations for year-end have completely evaporated. Still, I don't yet see a clear reason for a sustained sell-off in bitcoin and other risk assets. At the same time, there's a lack of conviction and solid arguments for a swift resumption of the bull market.
However, when we look at the commodities markets, things are starting to look a bit rosier. Copper appears to be breaking out. This likely has everything to do with the enormous demand for energy and metals to build out AI infrastructure.
There will come a point when this buildout exceeds actual demand, but I'd be surprised if we've already reached it. Many people are drawing comparisons to the dot-com bubble, but in my view, that comparison doesn't (yet) hold up. This time around, it's largely companies investing their own money, whereas back then, much more was happening with borrowed funds and venture capital.
It seems unlikely to me that infrastructure buildout won't continue through the first half of 2026.
For now, the cooling of the US labor market is a concern, but the question remains whether this isn't a supply-side problem caused by the Trump administration's strict immigration policy. It's clear that AI investments are currently the dominant driver of strong economic growth, but in my opinion, that's no reason to be bearish.
After all, there's little chance those investments will stop in the near term. At both the government level and on Wall Street, everyone is terrified of falling behind in the AI race. The K-shaped economy remains an issue, and that won't change in the short term.
Another positive for bitcoin is the upcoming US midterm elections. In the polls, the Republicans (Trump's party) are performing poorly, partly due to consumer confidence hitting rock bottom. The only advantage they have is that the economy remains solid and the stock market is performing strongly.
For that reason, I expect Trump will do everything in his power to keep that going. My expectation is that they'll want to prop up financial markets at all costs next year. So I remain bullish, and my base case is that bitcoin still has at least one period of sharp gains ahead.
4️⃣ US economic data paints a mixed picture
Thom
Fresh data from the United States shows a mixed picture of the economy. Private payroll processor ADP reported a net loss of 32,000 jobs in November, while economists had actually expected a slight increase of 10,000 jobs. A month earlier, ADP reported 42,000 jobs added.
At the same time, the purchasing managers' indices (PMIs) for the services sector from S&P and ISM remained above the threshold separating growth from contraction. That's important because roughly three-quarters of the US economy consists of services.
The signal function of industrial capacity utilization
One notable figure in this batch of data is the so-called Capacity Utilization—the utilization rate of US industry. It came in at 75.9 percent, below the 77.2 percent economists had expected.
This indicator measures what portion of industrial production capacity—factories, machinery, mines, and utilities—is actually being used. Economists have long watched it as an early indicator of economic strength or weakness.
At the current level of 75.9 percent, capacity utilization sits just above the level that has historically been associated with recessions. If this persists or declines further, it could signal that companies are investing less, scaling back production, and becoming more cautious about hiring.
Labor market cooling off
The weaker ADP figures fit that picture. Lower capacity utilization typically means less production and, over time, fewer jobs. Official unemployment figures from the US government haven't been fully updated in recent months, but many analysts believe unemployment is now higher than the last reported figure of 4.4 percent.
While ADP figures aren't directly comparable to the official jobs report (non-farm payrolls), the combination of declining industrial capacity utilization and a weaker payroll report is seen as a signal that the labor market is cooling.
The new data has at least renewed speculation about the Federal Reserve's interest rate policy. Financial markets are now pricing in a relatively high probability that the Fed will cut rates further in the first half of next year.
In the futures market, there's currently seen a limited chance of a cut in January and a somewhat higher chance of a first move in March. Fed Chair Jerome Powell's commentary at the upcoming rate decision meeting will therefore be particularly important: it should reveal whether the central bank sees the recent data mainly as temporary noise, or as confirmation of a broader cooldown.
For the Fed, industrial capacity utilization is one of the ways to gauge how "hot" or "cold" the economy is. A structurally lower utilization rate can reduce inflationary pressure over time, but often comes with lower growth and rising unemployment.
Bitcoin, for its part, reacted well to developments this week and appears to be tentatively finding a floor around current price levels.
In closing
New to Bitcoin Alpha? In 2023, we wrote several foundational pieces about our perspective on the crypto market. These can be useful background for understanding our approach, assumptions, and scenarios.
All previous editions of Alpha Markets can be found in the archive. Questions, comments, and suggestions are always welcome in the community.
Thank you for reading!
To stay informed about the latest market developments and insights, follow our team members on X:
- Bart Mol (@Bart_Mol)
- Peter Slagter (@pesla)
- Bert Slagter (@bslagter)
- Mike Lelieveld (@mlelieveld)
We appreciate your continued support and look forward to bringing you more comprehensive analysis in our next edition.
Until then!