Tug-of-War Contest for $105,000
Bitcoin is locked in a tight $100K–$112K range amid rising tensions, new stablecoin laws, and massive capital inflows. Could this prolonged standoff spark a dramatic breakout, or is stagnation here to stay? Stay tuned as global events and market forces collide.

The calm in the cryptocurrency market feels surreal, perhaps even ominous. For six weeks, the price has remained tightly bound between $100,000 and $112,000. In recent weeks, the weekly closing prices have been very close:
Week 22: $105,697
Week 23: $105,784
Week 24: $105,599
It is now Friday of week 25, and the price still hovers around $105,500—even amid a flurry of activity both inside and outside the crypto world. In just the past week and a half, we’ve seen this:
- The outbreak of conflict between Israel and Iran, with the threat of further escalation in the coming days.
- A wealth of macroeconomic data, including figures on inflation, retail sales, and the labor market.
- Interest rate decisions and economic outlooks from the central banks of Japan, the United States, Switzerland, and England.
- The GENIUS stablecoin law was passed in the U.S. Senate. President Trump declared, “Digital Assets are the future, and our Nation is going to own it.” Coinbase shares soared 16%.
The weekly chart below highlights in yellow the narrow zone where the closing prices have settled for the past six weeks. This behavior can be attributed either to market indecision or to a tug-of-war between bears and bulls.
You often see this kind of standoff when a market nears its all-time high. Some expect the upward trend to continue, while others foresee stagnation and cash in their profits. Even the optimists know it’s better to wait for a breakout than to jump in just below a key resistance level.
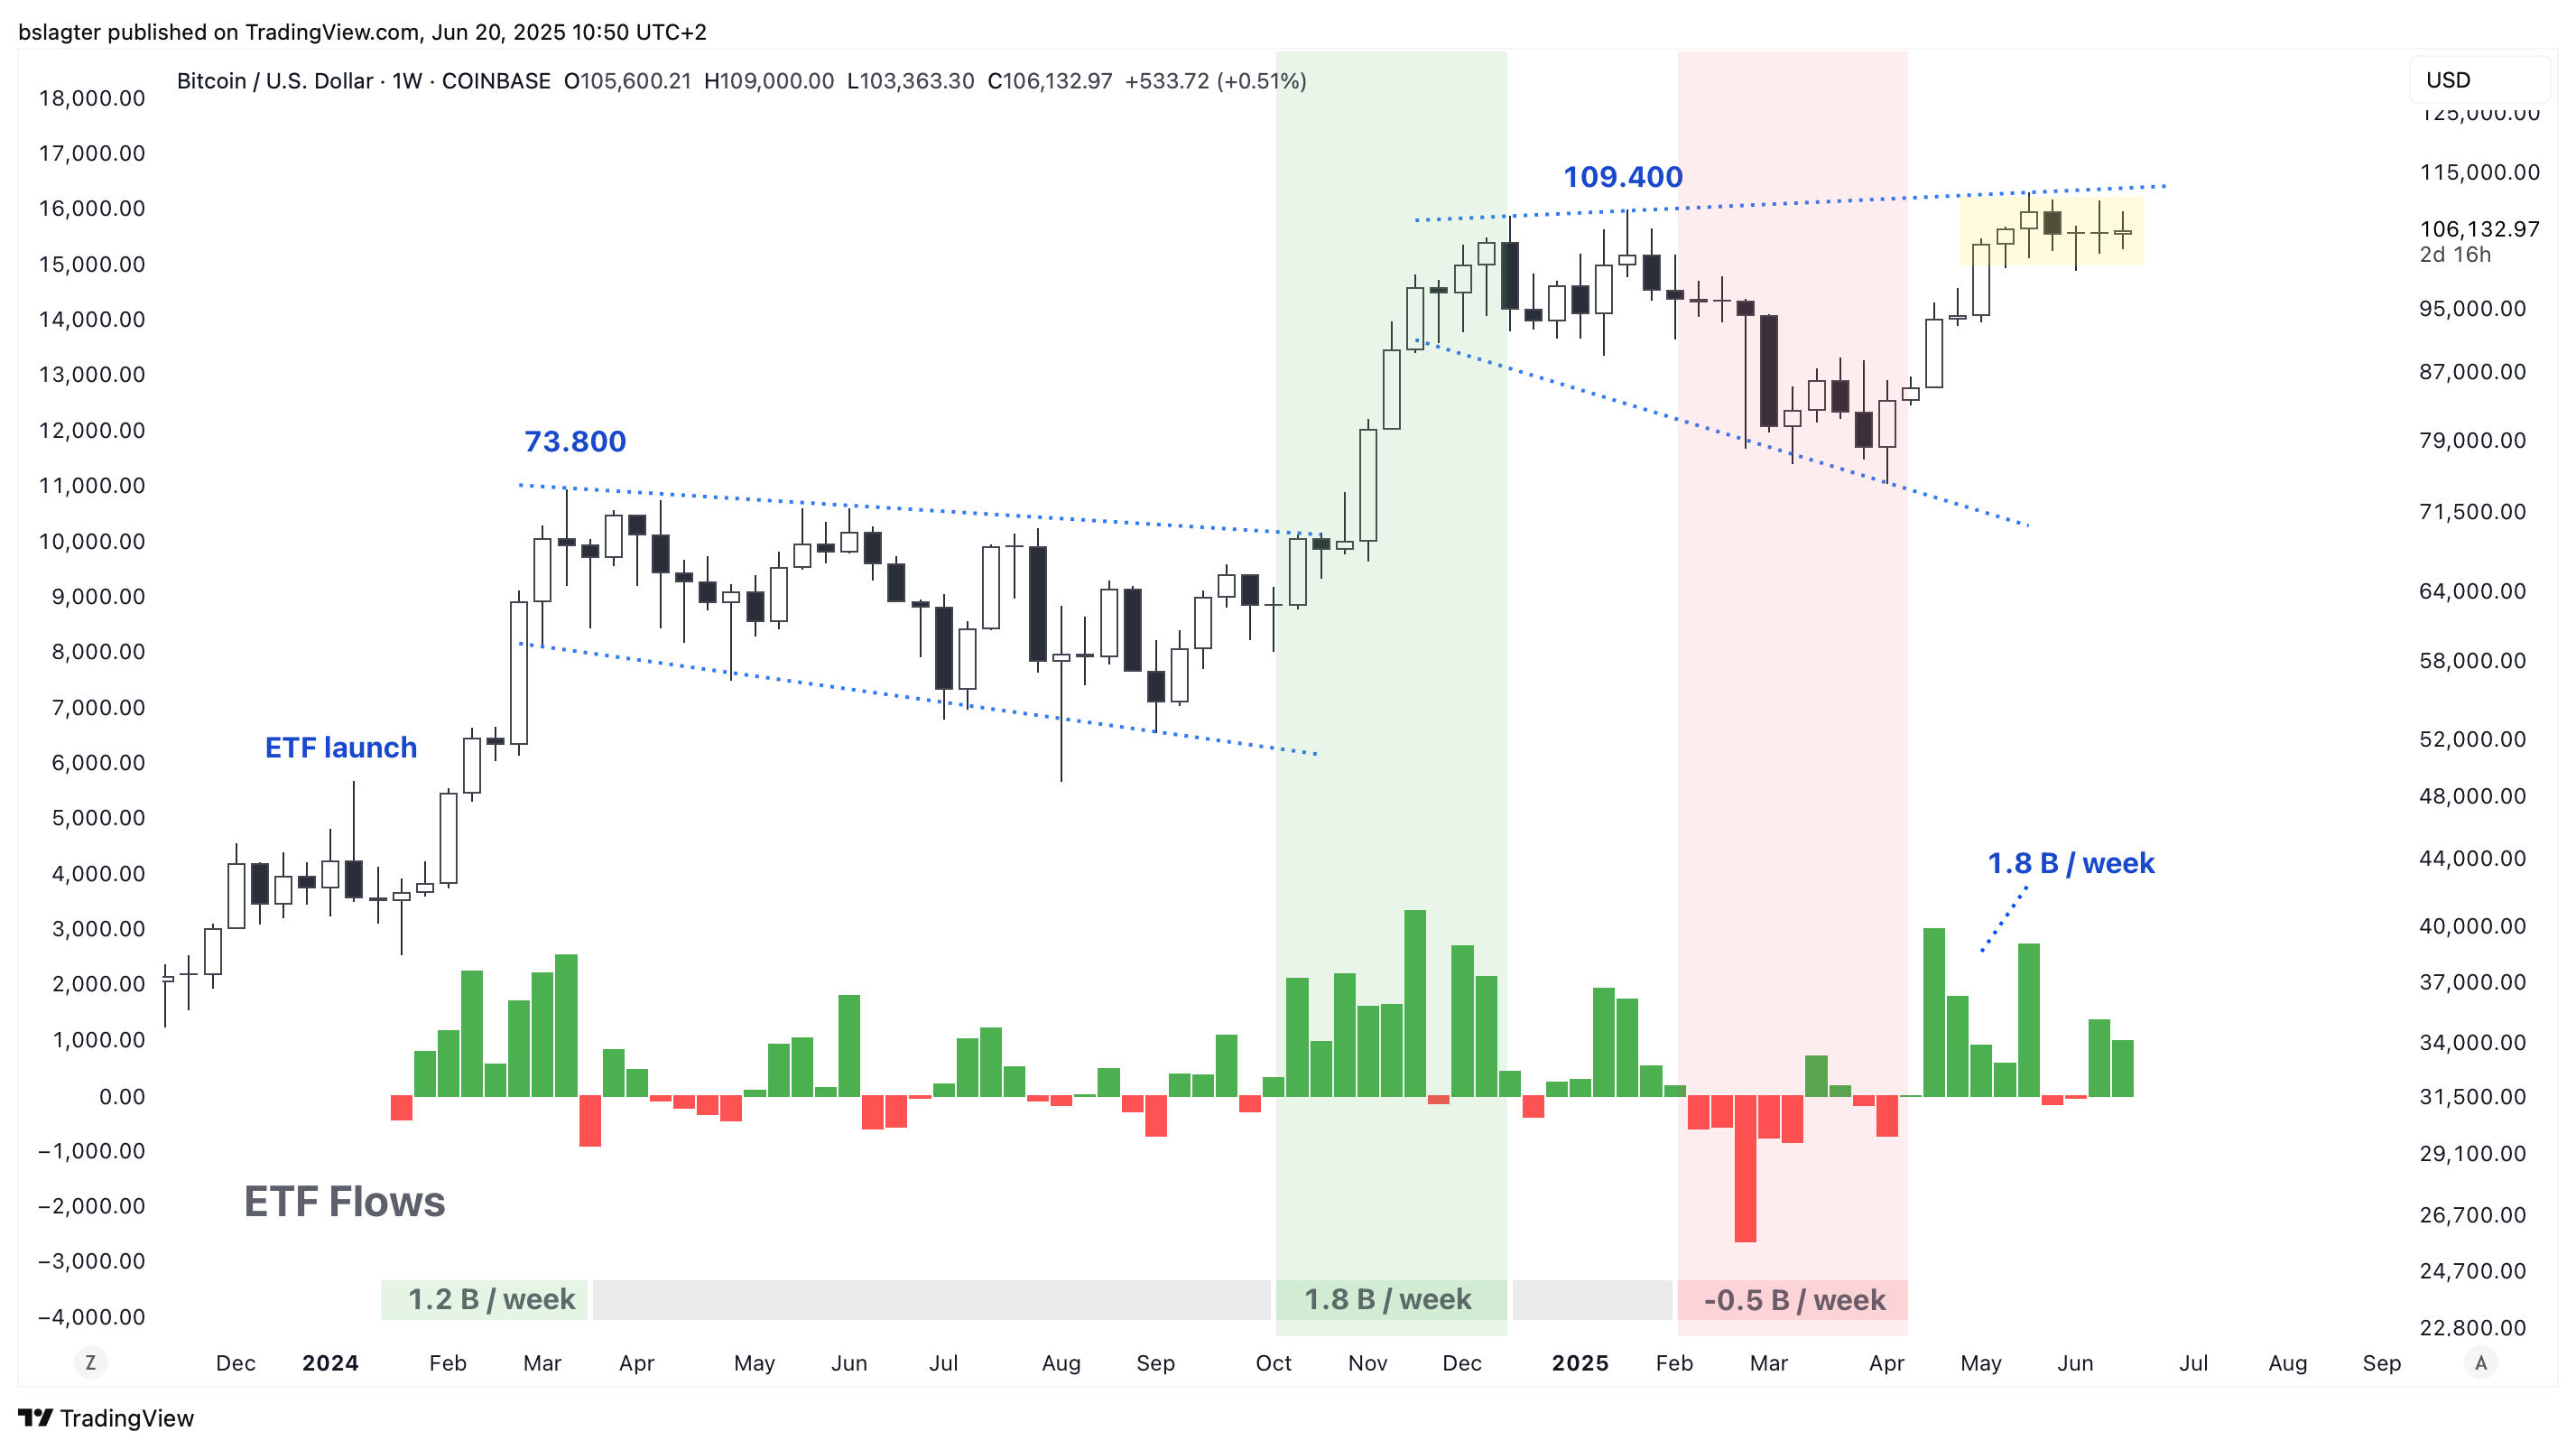
Bitcoin ETFs, however, remain unaffected. Since April 21, $11 billion of new capital has flowed in. On-chain data even shows a steady inflow of fresh dollars.
It seems likely that this inflow will continue, as many investors are not overly sensitive to price movements. Consider the numerous bitcoin treasury companies and individual investors who steadily add to their positions on a weekly or monthly basis.
On the other hand, the available supply at any given price point eventually diminishes. At some point, practically everyone who finds prices below $112,000 attractive will have sold.
Then, things could move quickly, precisely because the price has been confined to an ever-narrowing range for so long. Speculators have placed their orders just outside this zone, which could fuel a breakout.
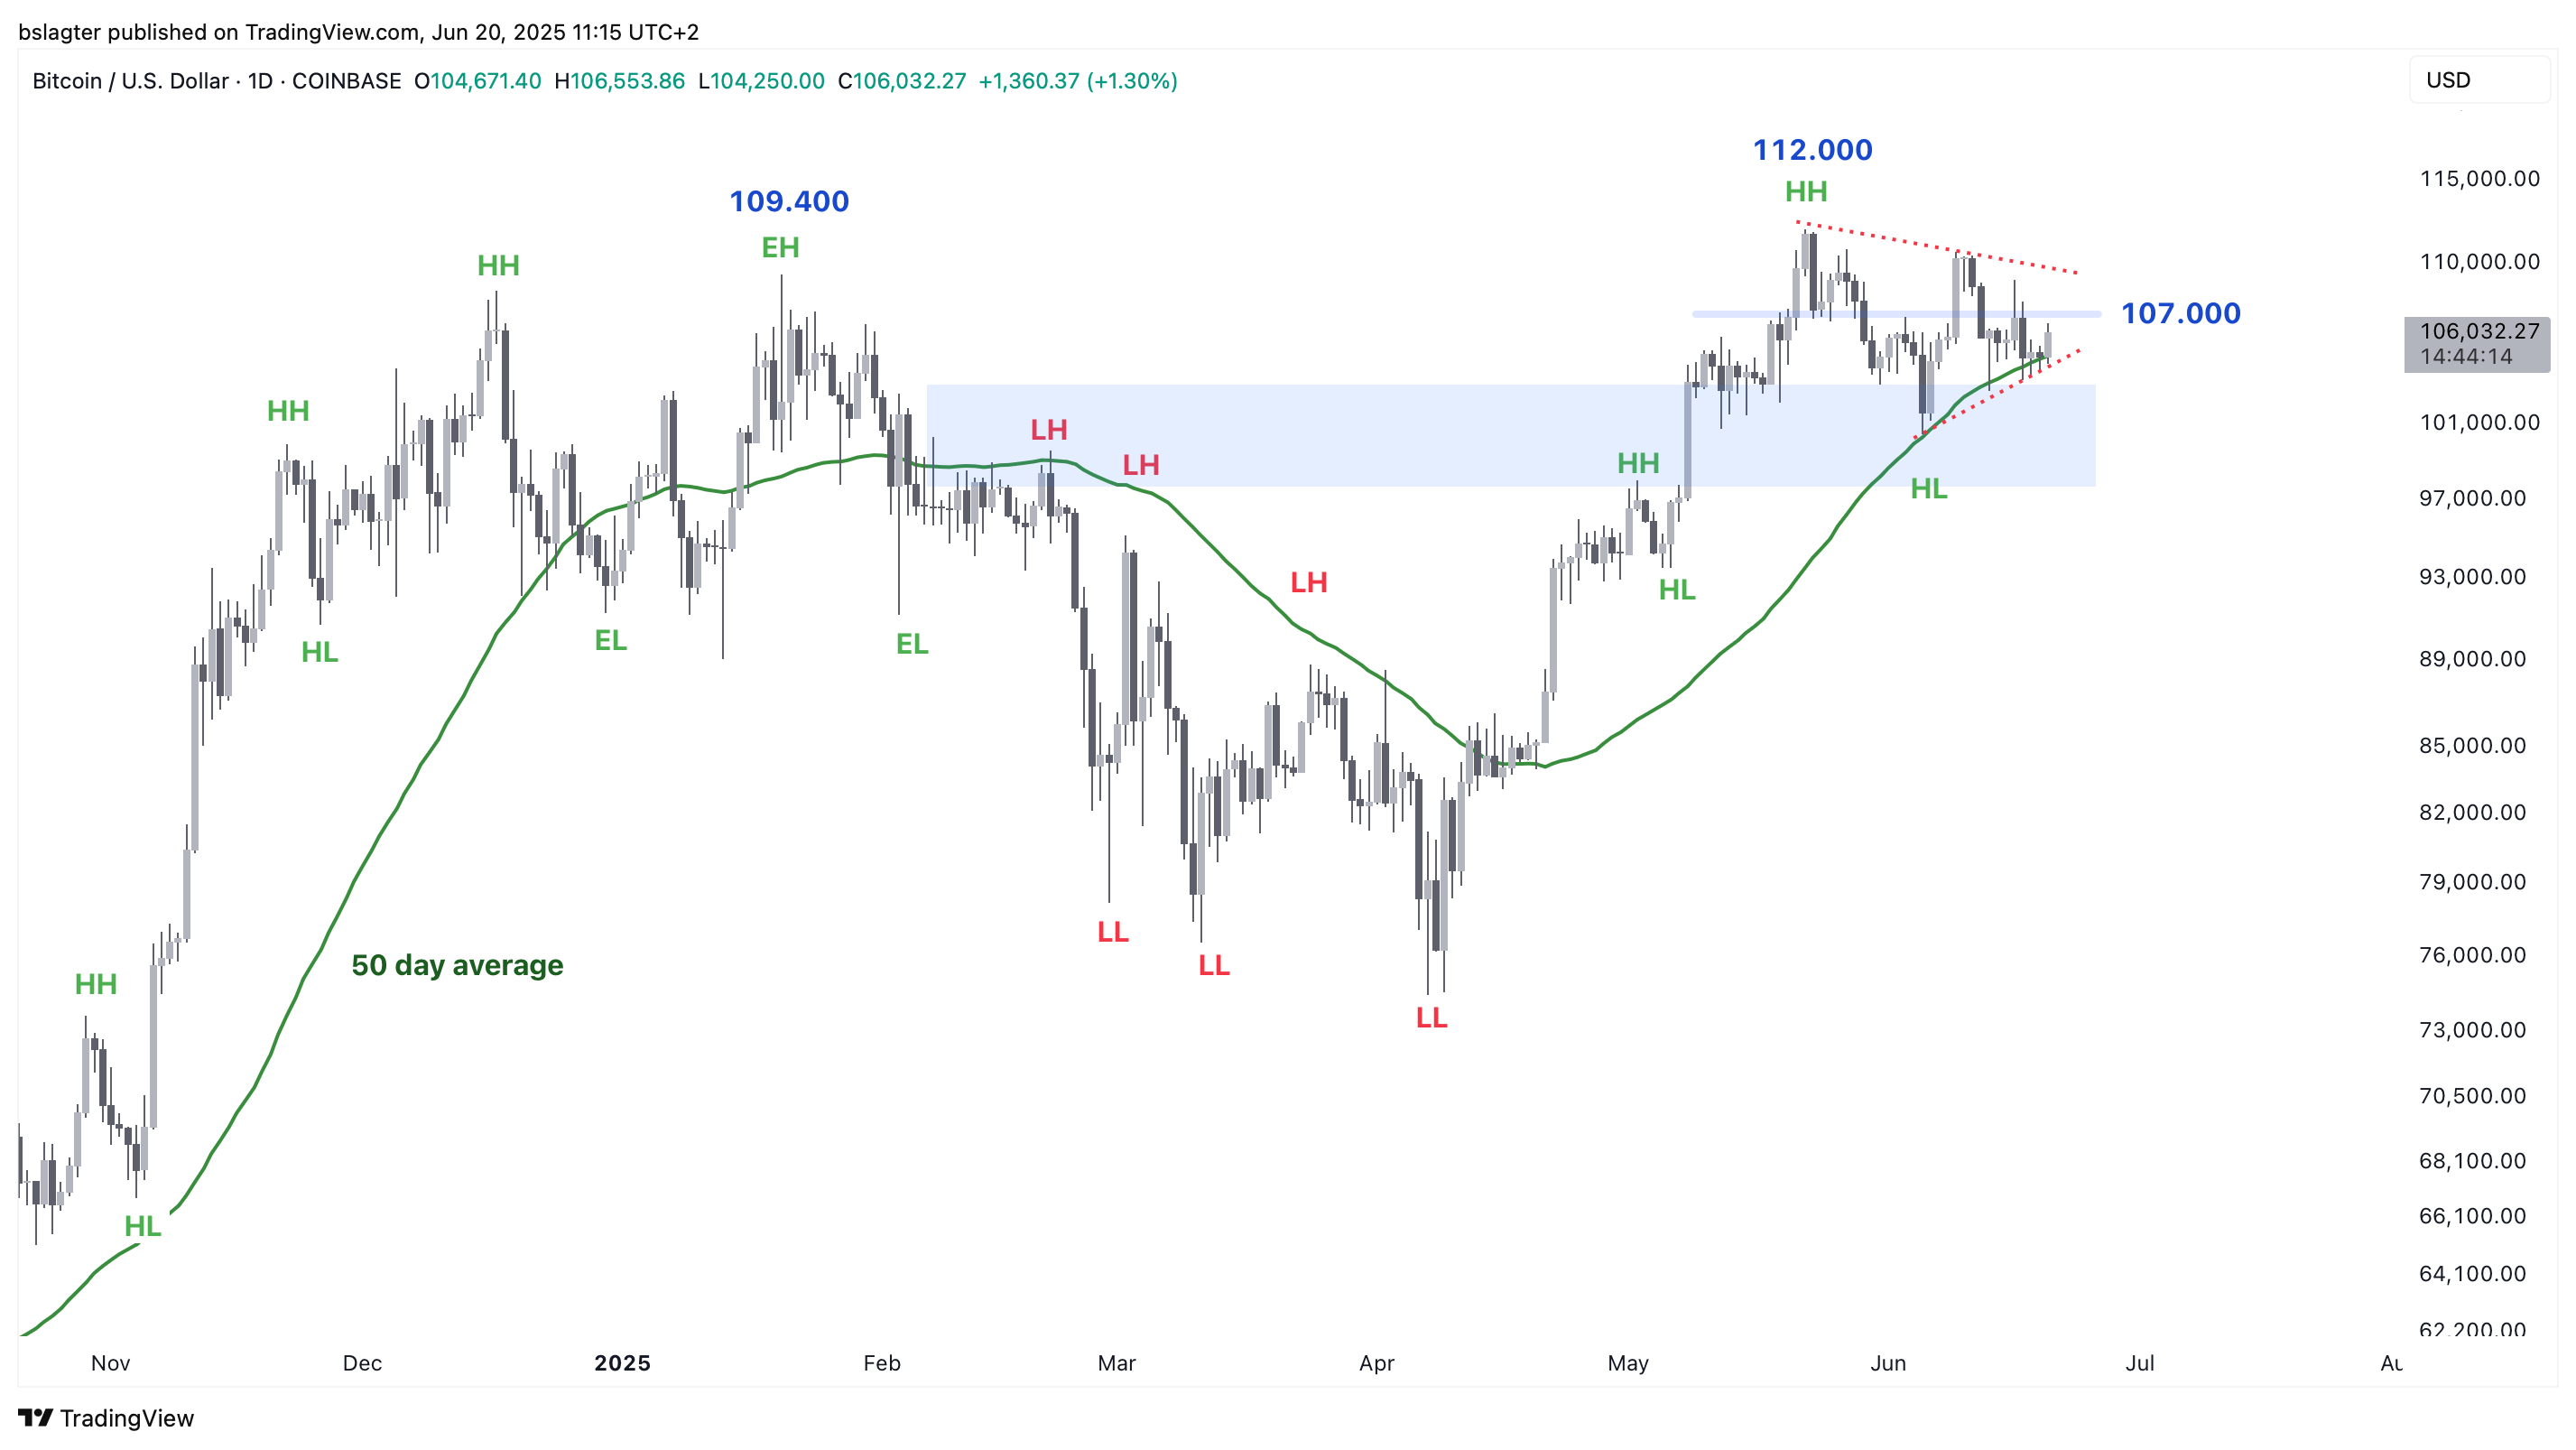
Since early April, the trend has been upward, marked by higher highs (HH) and higher lows (HL). Our base scenario is that this trend will continue and that we will soon see a breakout to the upside.
Bitcoin, like other commodities, sometimes makes a slight downward move before ultimately breaking out upward with a “move around the apex.” It might be wise to remain cautious and only take action if the price moves above $112,000 or drops below $100,000.
It remains speculative, but it’s worth considering the potential for an inverse head & shoulders pattern. In the 3-day chart below, this pattern is clearly visible. Only once it breaks above the neckline does it become a valid pattern. Because it could attract considerable attention, we are sharing it now.
We have also overlaid the rhythm of the daily cycle. We are still in the early stages of the second daily cycle of this weekly cycle—day 15 out of an average of 60 days. From that perspective, there is still plenty of time for a significant upward move.
We remain well above the dominant average for the market cycle, represented by the blue line in the chart. The bull market is intact, which means we expect this weekly cycle to continue upward. A cycle characteristic of this bull market could take us this summer to between $150,000 and $165,000.
For now, let’s wait and see how the tug-of-war unfolds. With so much happening both inside and outside the crypto world—new U.S. legislation, major global economic shifts, and conflict in the Middle East—there are plenty of potential shocks, yet the market seems increasingly unfazed. We’re curious to see what happens next!

We continue with the following topics for our Alpha Plus members:
- Bitcoin to $800,000 in 2027?
- U.S. economic turnaround is a tailwind for bitcoin
- Trump hurls chairs; Powell remains unmoved
- The rapid tail-to-tail surge
1️⃣ Bitcoin to $800,000 in 2027?
Bert
Bob Loukas on X calls this the “Saylor Super Cycle”—a scenario where a convergence of forces propels bitcoin above $800,000 over the course of two years:
But as we get favorable US regulations, ETF flows, IPOs, corporate treasury adoption, growing sovereign interest, and a dovish, administration-aligned Fed chair, layered on top of 16 years of boom/bust dynamics — then all the ingredients are there for a final, "All-In", Dot-Com style Bitcoin/crypto blowoff.
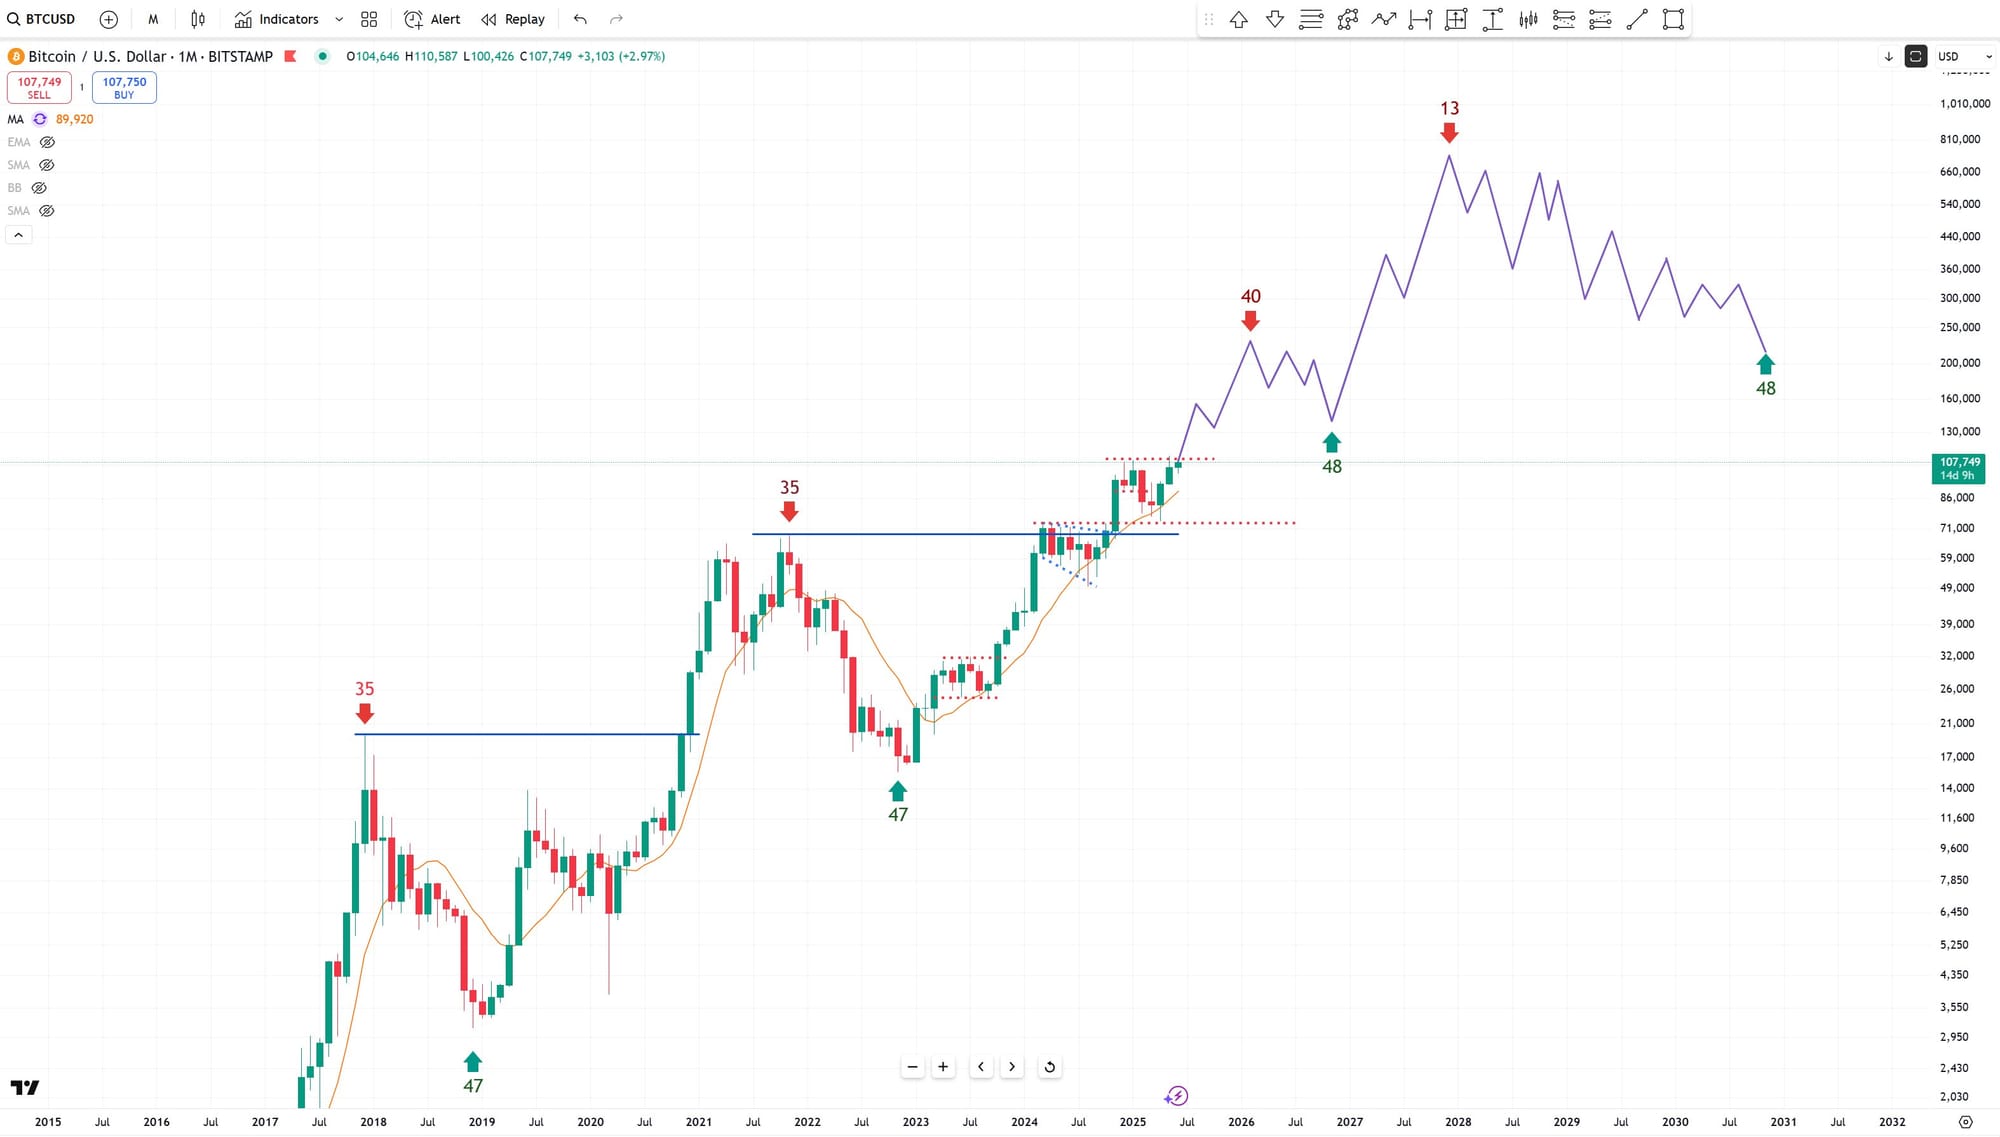
The chart below, provided by Loukas, illustrates how such a scenario might appear from a cycle analysis perspective. It shows the yearly cycle, which for bitcoin averages about four years.
He outlines the current yearly cycle with a peak that occurs rather late in the cycle. As a result, there is little time left for an extended, deep bear market. In as little as eight months, the next yearly cycle will begin—and that one promises to be unique.
This would then become bitcoin’s first left-translated yearly cycle—a cycle that starts off short and rises very quickly, followed by a long period of decline. That prolonged downturn would mark bitcoin’s first “secular bear,” a span of years during which the crypto market falls.
“It’s only a theory,” Loukas admits, though he stands firmly by it. It’s a theory that fits well with market behaviors and isn’t based on just a few arbitrary lines on a chart.
2️⃣ U.S. economic turnaround is a tailwind for bitcoin
Bert
In March, we discussed the economic plan of the newly inaugurated U.S. administration. You can read more in the sections titled “Donald Trump’s Popcorn” and “Are We Facing a Mini Bear Market?”
In short, they aimed to improve the U.S. economic position by reducing both the trade deficit and the budget deficit. DOGE was expected to help lower expenses, while import tariffs were intended to boost revenues.
An important focus for the Trump administration was the national debt. We always gauge government debt using the debt-to-GDP ratio, which allows for comparisons between countries.
The U.S. national debt stands at around 125% of GDP, which is relatively high. Combined with the forecast of a significant budget deficit in the coming years, this points to an “unsustainable debt trajectory.”
Trump’s plan was to tackle the national debt by increasing revenues and cutting expenditures. However, it didn’t gain much traction. Officials have attributed this to opposition from Democrats and bureaucrats, but the reality is more challenging.
Once the debt soars well above 100% of GDP, reducing it becomes extremely difficult. Measures that initially seem beneficial often end up producing unintended side effects—like increased spending from higher benefits or reduced revenues from tax cuts. In the words of Lyn Alden, “Nothing stops this train.”
Now, Trump appears to be shifting focus to the other side of the debt-to-GDP ratio. If reducing the debt isn’t feasible, then the only option is to grow the economy. They are betting on phenomenal economic growth—a productivity miracle. AI, robotics, self-driving cars, and crypto networks, all of the exponential technologies featured in ARK Invest’s Big Ideas reports, come into play.
You can also hear this vision in the explanation of the Big Beautiful Bill, Trump’s budget proposal. It’s all about investing, driving progress, and fostering growth.
Earlier this week, Trump commented on the Fed’s interest rate decision. In addition to grumbling about Fed Chair Jerome Powell, he also mentioned proposals from the Treasury Department:
We are going to issue short-term, 3-month, 6-month bonds and work to lower rates before issuing long-term ones.
David Grider remarked, “It’s just YCC and monetary easing by another name!” and referred to the chart below by Michael Howell, titled “Not-YCC, YCC.”
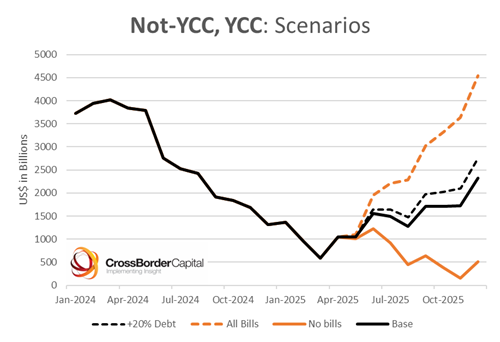
YCC stands for Yield Curve Control—a term that encompasses all government and central bank actions aimed at influencing long-term bond yields. By issuing predominantly short-term debt, the supply of long-term bonds diminishes, leading to lower yields.
This shift from long-term to short-term debt adds liquidity to the system. Short-term bonds are less risky than their long-term counterparts, thus occupying less risk capacity on investors’ balance sheets. With this spare capacity, investors can take on more risk—such as buying stocks.
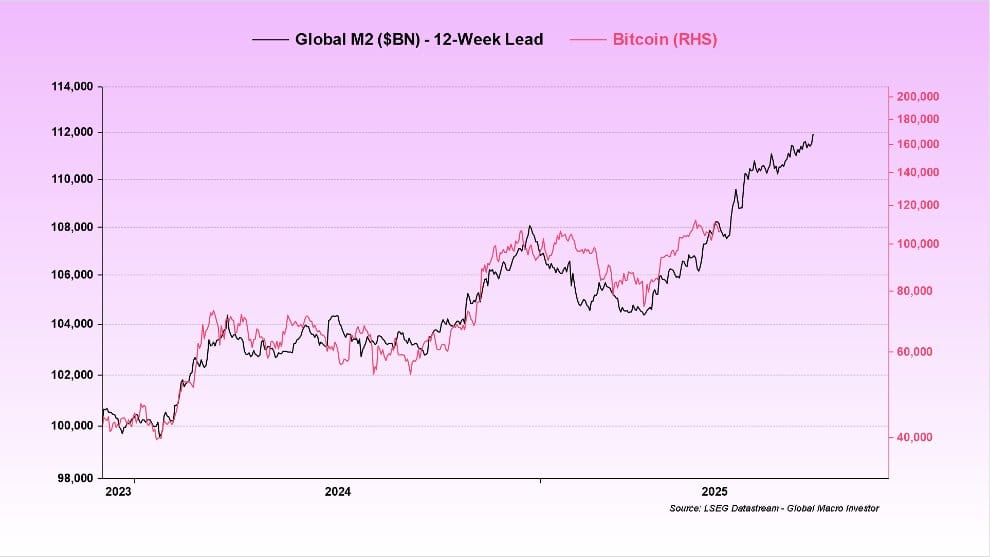
This explains the widely discussed correlation between global liquidity and the price of bitcoin (and other risk assets). For the team at Real Vision, this is the most compelling argument for bitcoin’s price appreciation. The chart below, from Raoul Pal, illustrates this point.
The black line in the chart represents the liquidity that has been added to the global financial system over the past few months. Trump’s proposals would contribute even more. If these plans are implemented, it would provide a sustained tailwind for bitcoin.
3️⃣ Trump hurls chairs; Powell remains unmoved
Thom
Trump’s frustration must be immense. While he publicly demanded an interest rate cut of at least 1 percentage point, the U.S. central bank (Fed) completely ignored his wishes on Wednesday.
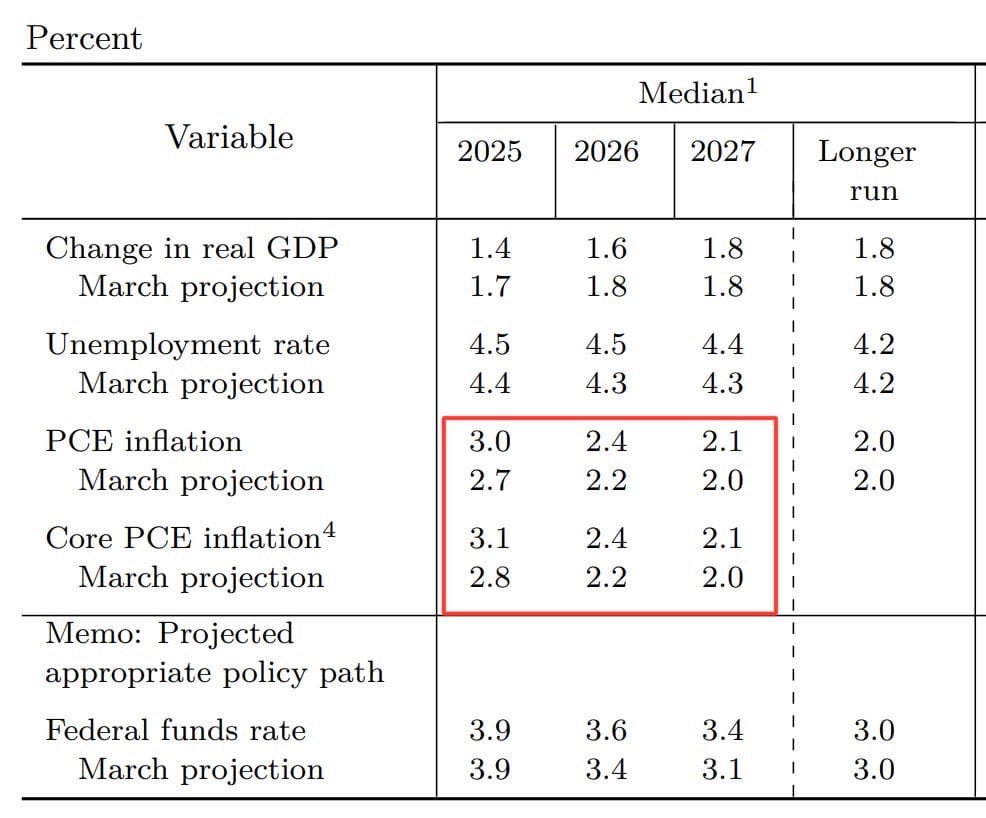
Moreover, the dot plot now indicates that the Fed expects even fewer rate cuts by 2027 than previously forecast. The message is clear: for now, the market should not count on stimulus from the U.S. central bank.
The central bankers prefer to wait until the labor market clearly signals the need for intervention, especially given the current slightly elevated inflation figures.
The key takeaways are:
- The Fed expects only 1 percentage point in rate cuts by the end of 2027.
- For 2025, the base scenario remains two cuts of 0.25 percentage points each, although more officials now lean toward just one cut compared to the previous meeting.
- The central bank prefers to wait until either the labor market weakens or inflation comes firmly under control.
- Inflation expectations have risen to 3% in 2025, while growth expectations have dropped to 1.4%.
- Uncertainty is “lower than before, but still higher than desired.”
During the press conference, Fed Chair Jerome Powell noted that none of the central bank officials felt entirely certain about their projections—they were simply required to provide some forecasts.
This is not the interest rate decision the market had hoped for. At the same time, we are beginning to see cracks in the U.S. economy, as incoming economic data has consistently fallen short of expectations.
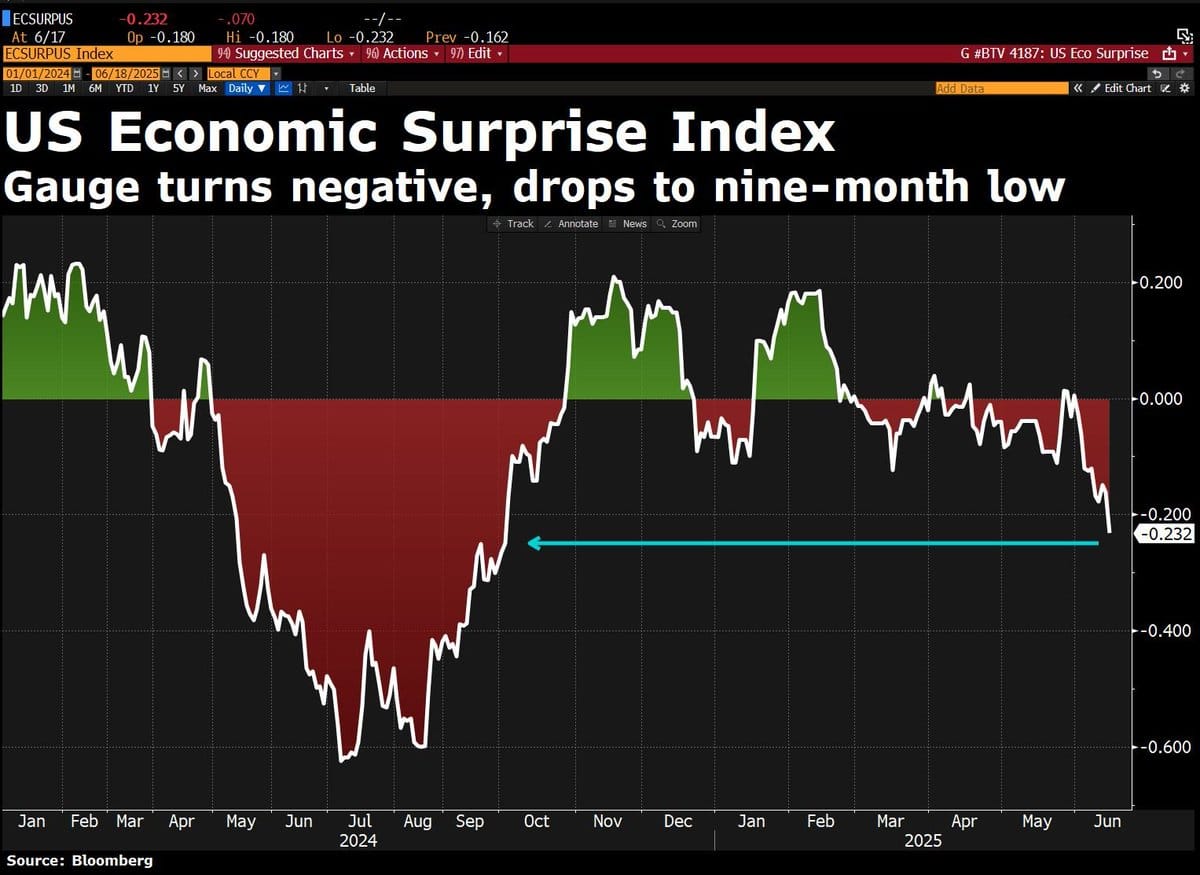
This week brought several disappointments:
- Retail sales: U.S. retail revenue came in lower than expected.
- The housing market reported disappointing data with fewer building permits and new construction projects than anticipated.
- Industrial production fell short of expectations.
Additionally, the U.S. labor market continues to cool significantly. Guy Berger, a U.S. job market expert, remarked, “The labor market isn’t crying out for rate cuts; it’s just a little downcast.”
My primary scenario for 2025 still envisages a continuation of the bull market, though I increasingly believe that returns will be more moderate—certainly not a bull run like those seen in 2021 and 2017.
4️⃣ The rapid tail-to-tail surge
Thom
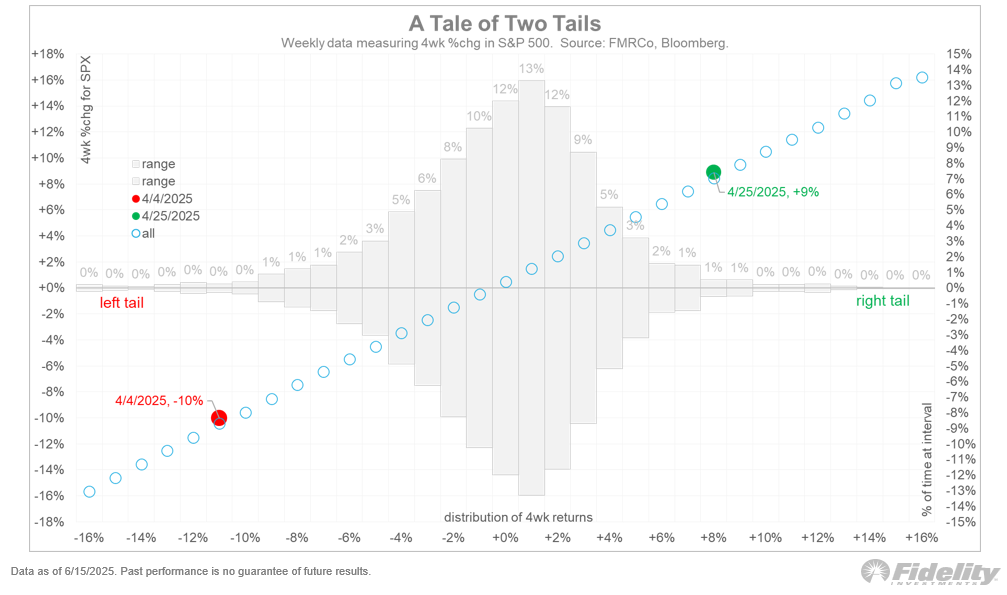
Much like bitcoin, the S&P 500 experienced a rare crash in early April, losing 10% over four weeks. It then rebounded—similar to bitcoin—with a record-breaking increase of 9% in the following four weeks.
This Fidelity chart clearly shows that this was an extraordinary event in statistical terms. The red dot represents a 10% decline over the four weeks ending on April 4, an occurrence that happens in less than 1% of cases. Likewise, the 9% increase over the four weeks ending on April 25 occurs in roughly 1% of cases.
We moved swiftly from the negative tail of the distribution (on the left) to its positive tail.
Given the rapid turnaround in sentiment and the swift gains following the April lows, it is hardly surprising that both the S&P 500 and bitcoin are now taking a breather.
This is especially true considering the numerous uncertainties still looming over the market:
- The conflict between Israel and Iran.
- Trump’s trade war, with no agreements yet in place with Europe and Japan.
- The U.S. central bank adopting a wait-and-see approach.
- Emerging weaknesses in the overall U.S. economy.
Under these circumstances, it’s no surprise that both bitcoin and the S&P 500 are struggling to break out to new highs. After the rapid gains of recent weeks, investors have ample reason to lock in profits, potentially extending the consolidation period a bit longer.
Thank you for reading!
To stay informed about the latest market developments and insights, you can follow our team members on X:
- Bart Mol (@Bart_Mol)
- Peter Slagter (@pesla)
- Bert Slagter (@bslagter)
- Mike Lelieveld (@mlelieveld)
We appreciate your continued support and look forward to bringing you more comprehensive analysis in our next edition.
Until then!