Time to Show Your True Colors
Bitcoin Hits All-Time High in Dollars and Euros—Could a Brief Correction Spark a Breakout Past 123k, 124k, and 126k?

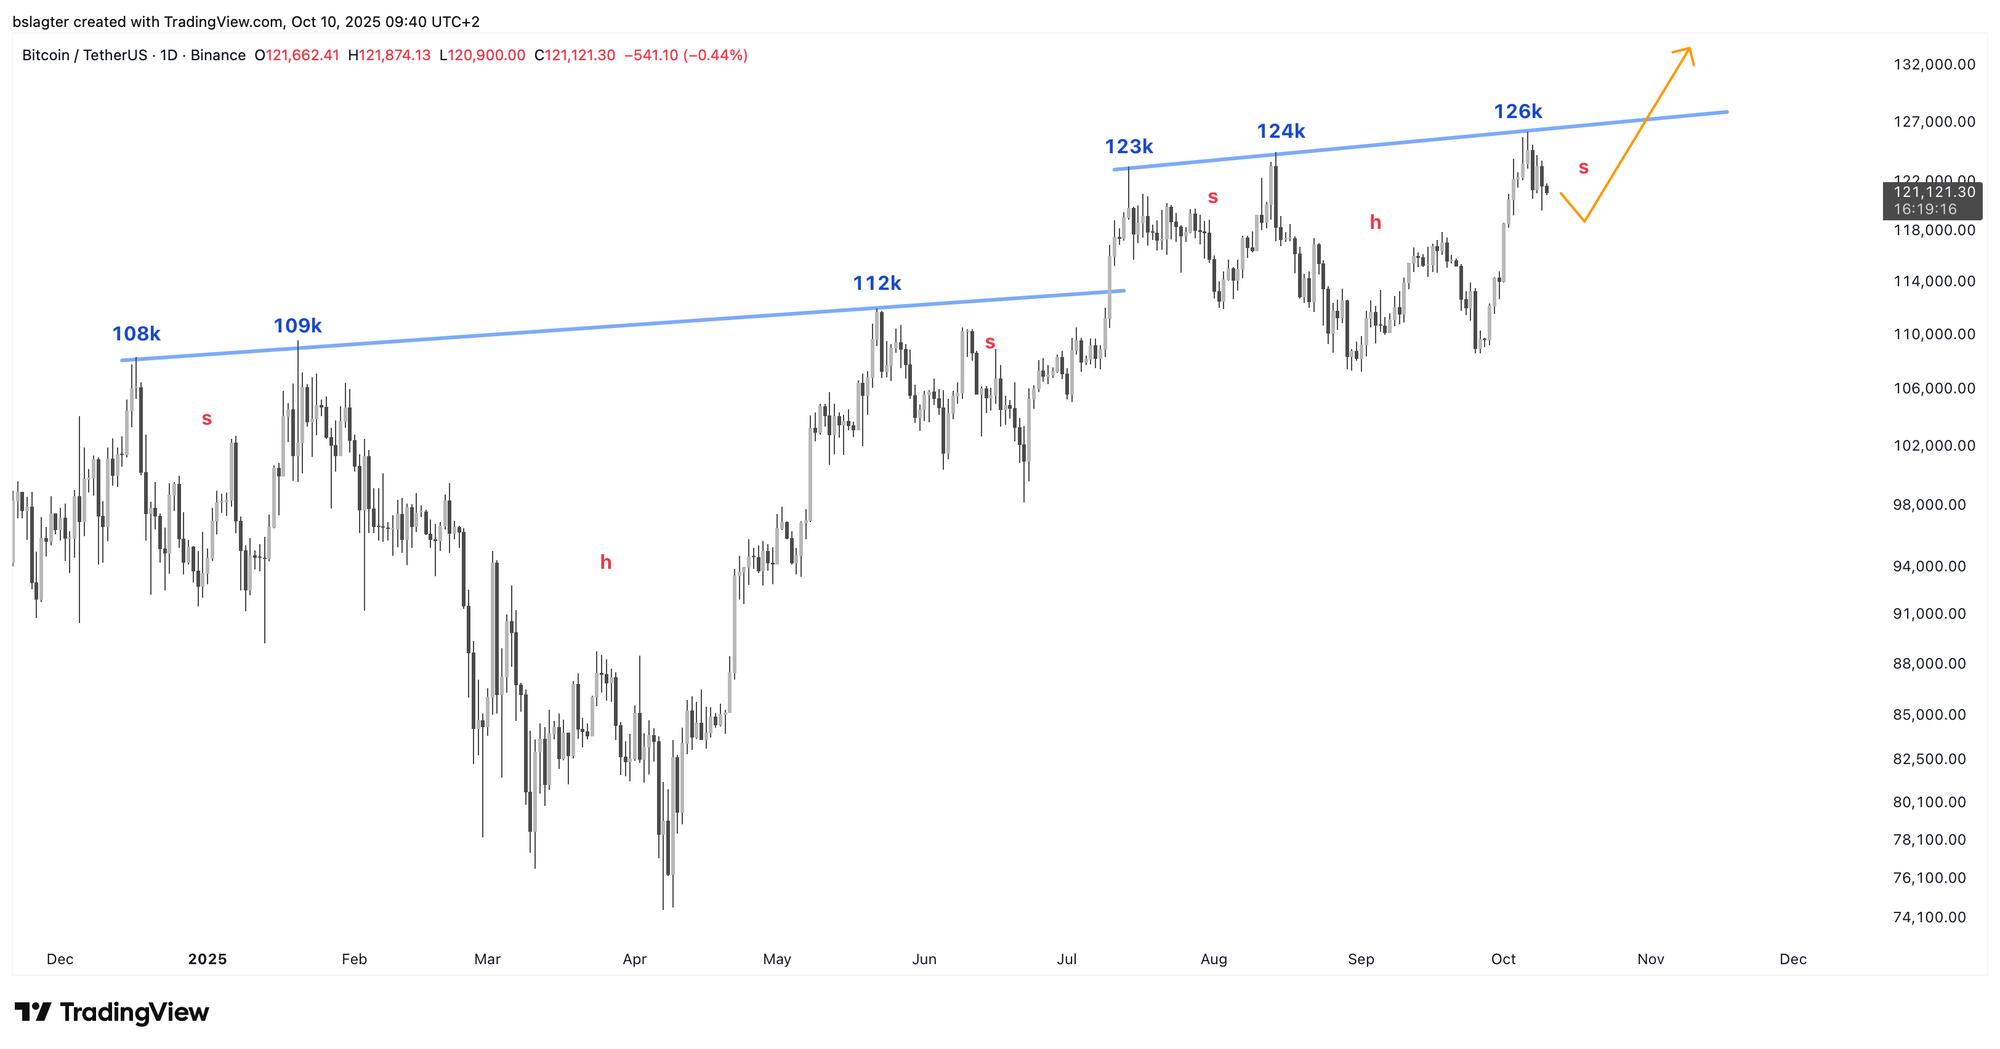
A new all-time high for bitcoin! Last Monday, the price surged above $126,000 and €106,000, setting records in both currencies. This capped an impressive rally from the low on September 26. In just ten days, the price climbed by 16% from 108k to 126k. The final six days all showed positive gains.
This puts us right at the threshold—from 123k in July to 124k in August, and now 126k in October.
This pattern is somewhat reminiscent of what we saw in May this year. Back then, we hit 108k in December, 109k in January, and then 112k in May. Those hoping for a leap to much higher prices were disappointed; it took another two months before we truly broke above 120k.
You could interpret that section of the chart as an inverted head-and-shoulders pattern. The price target for that pattern was around $150,000—a level we didn’t reach. But that’s how probabilities work.
Now, a similar pattern might be forming again, albeit a slightly smaller one—a sort of echo or shadow. Only once the neckline is breached can we confirm the pattern; until then, it remains merely potential.