
The Signals That Confirm a Bottom
Learn how to recognize a bitcoin bottom. Three technical signals to tell the difference between an ongoing decline and a genuine bottom. The first costs money, the second makes it.

Bottoming is not a moment, but a process. The exact lowest point, the absolute bottom, is often only visible in hindsight. In a broader sense, the bottom describes a period of a slowing decline, sideways movement, and the first tentative signs of growth. You can only truly speak of a bottom once a series of signals has been ticked off that maps out this process. Acting on these signals inevitably costs you part of the first rally, but it also mitigates the risk of stepping into a downward trend.
A first signal is the break of the dominant EMA; Exponential Moving Average. In virtually every trend, one moving average (or combination of them) does most of the work. In a downward trend, that is the EMA the price keeps bouncing off of. As long as that EMA stops every rally in its tracks, there is no reason to assume the bottom is behind us.
For bitcoin, at this moment those are the 100- and 200-day EMAs. The 100-day sits around 66,500 dollars and the 200-day around 72,000 dollars. The bitcoin price has been trading below both averages for months. So far, they have also acted as a ceiling for so-called bear market rallies, periods in which the price tries to work its way up. Even the two strongest rallies, from November 2025 to January 2026 and from February 2026 to May 2026, ran into that ceiling.
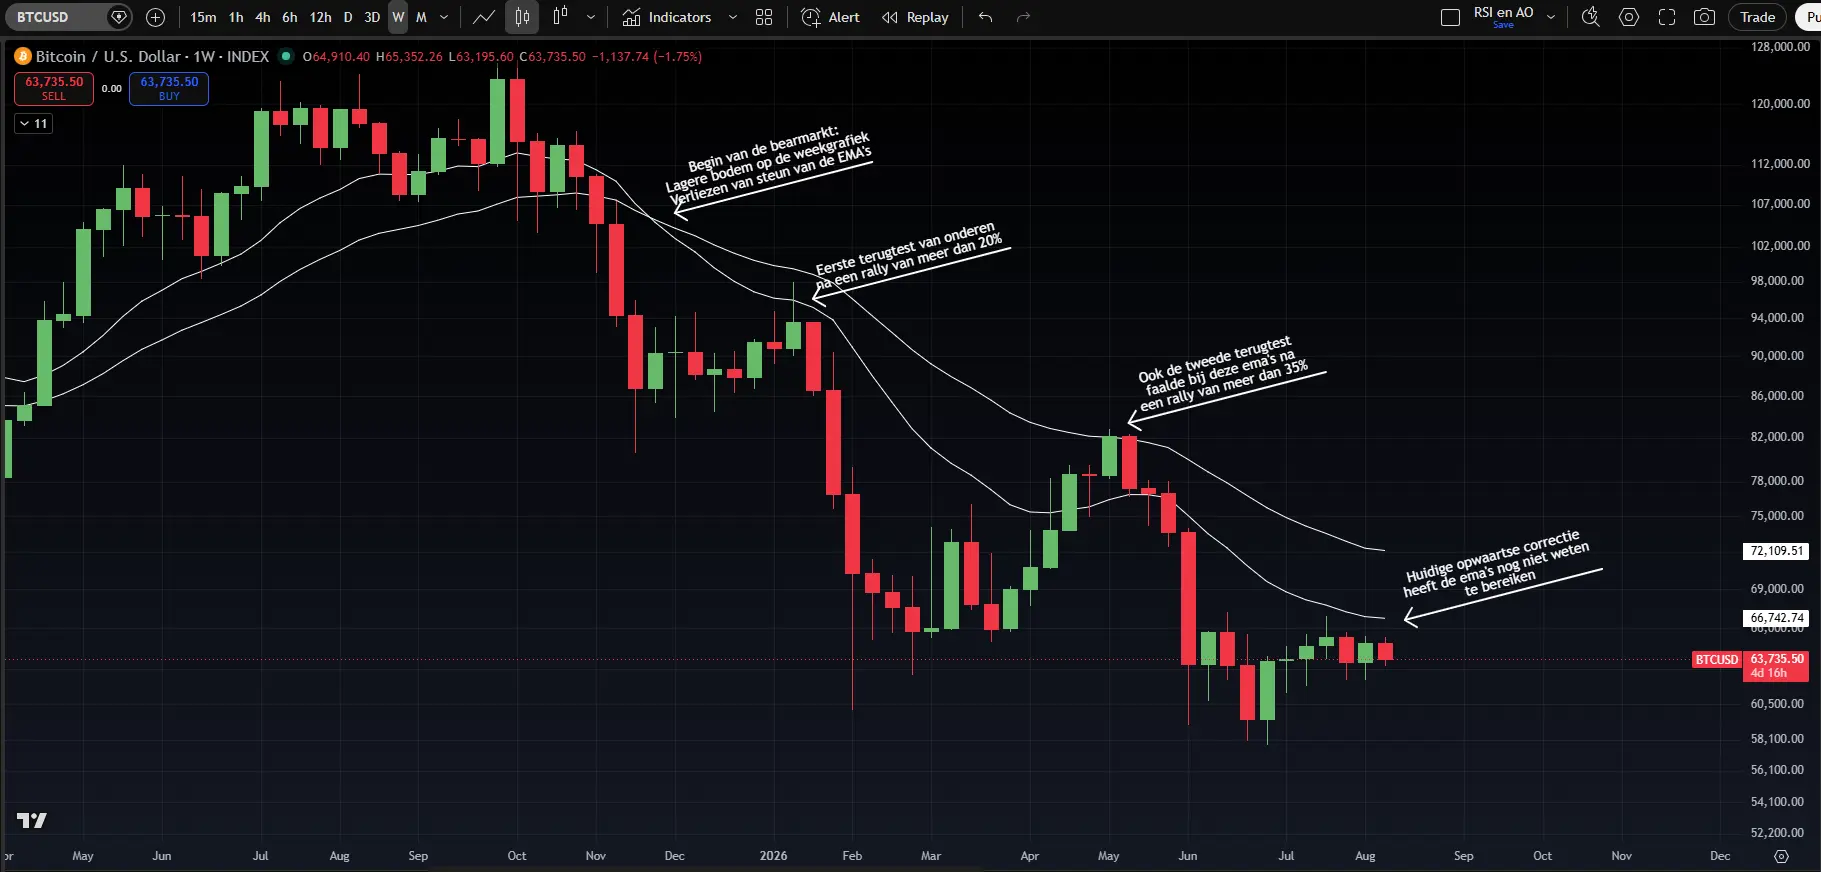
What we'd like to see is the white lines converging and flattening out. After that, the price needs to break through them.
Let's move on to the second signal.
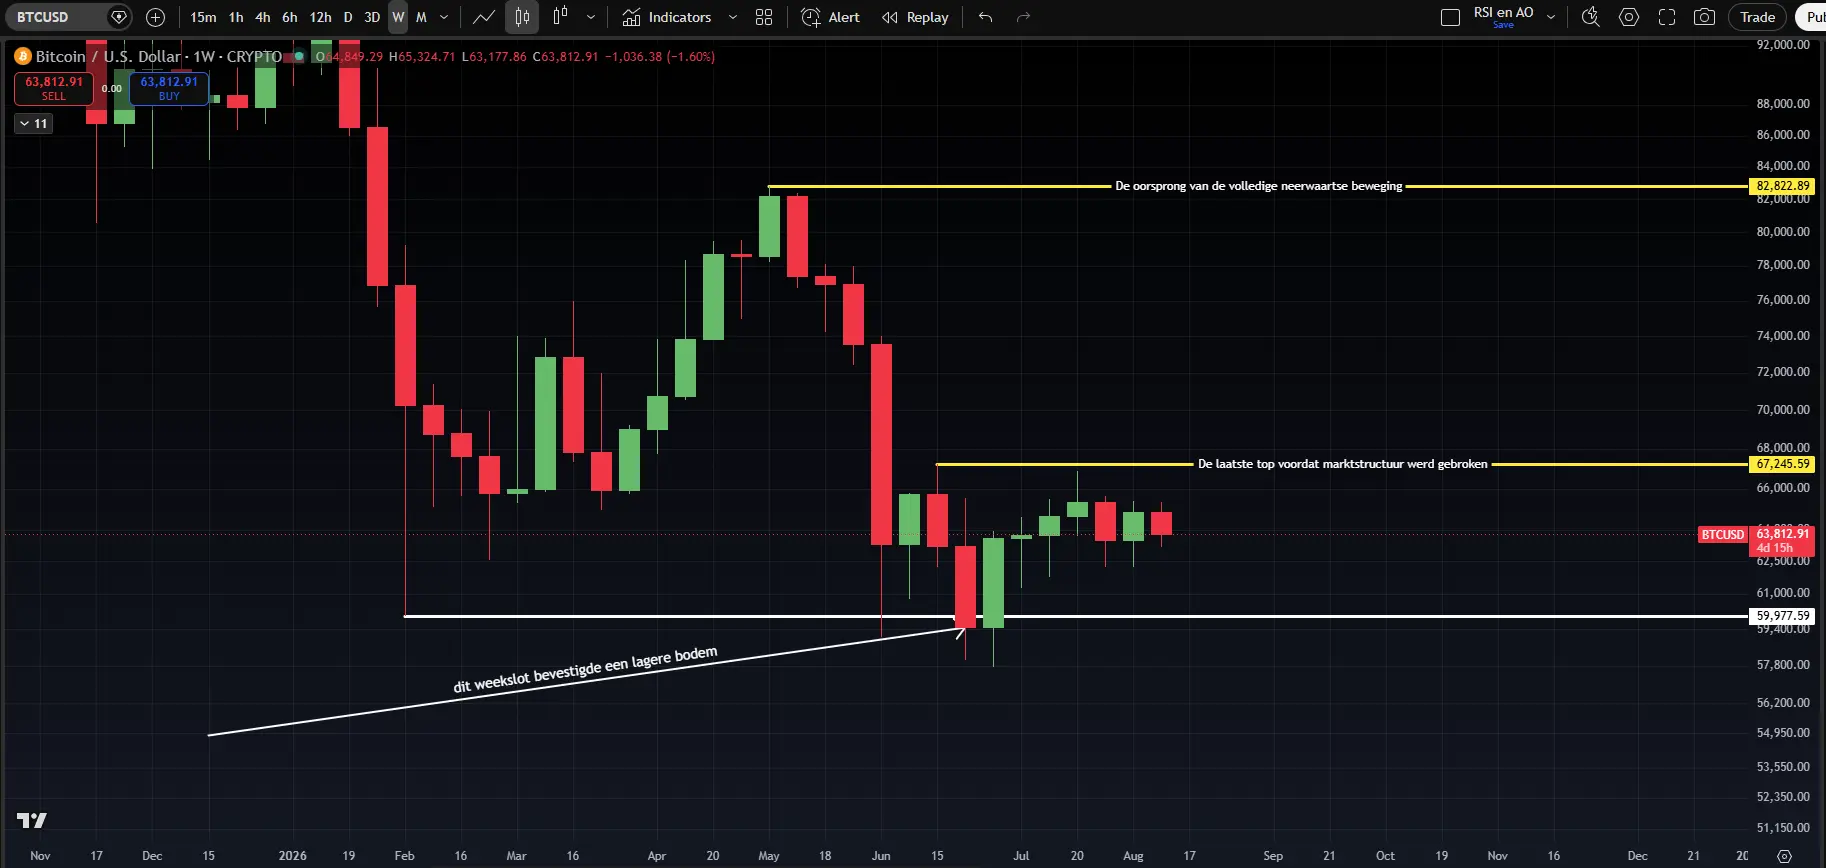
For that, we look at the higher highs on the weekly chart. A downward trend consists of lower highs and lower lows. A higher low on its own therefore says little, because that could simply be a decline unfolding a bit more slowly. It only becomes interesting once the price sets a higher high. After that, we want to see a higher low emerge from the pullback that follows; that is a nice buying opportunity.
What exactly counts as a higher high in this context is somewhat arbitrary. There are valid arguments for the idea that a weekly close above 67,300 dollars marks a higher high. There are also plenty of analysts who want to see a weekly close above 83,000 dollars as confirmation. The first is a bit riskier, but probably a better entry price. The second gives more certainty that the bottom is in, with a bit of extra missed return as the cost.
This is a similar dilemma to the one that played out in reverse at the top. Was the upward trend broken by a weekly close below 107,000 dollars, or did the weekly close below 98,000 dollars usher in the bear market?
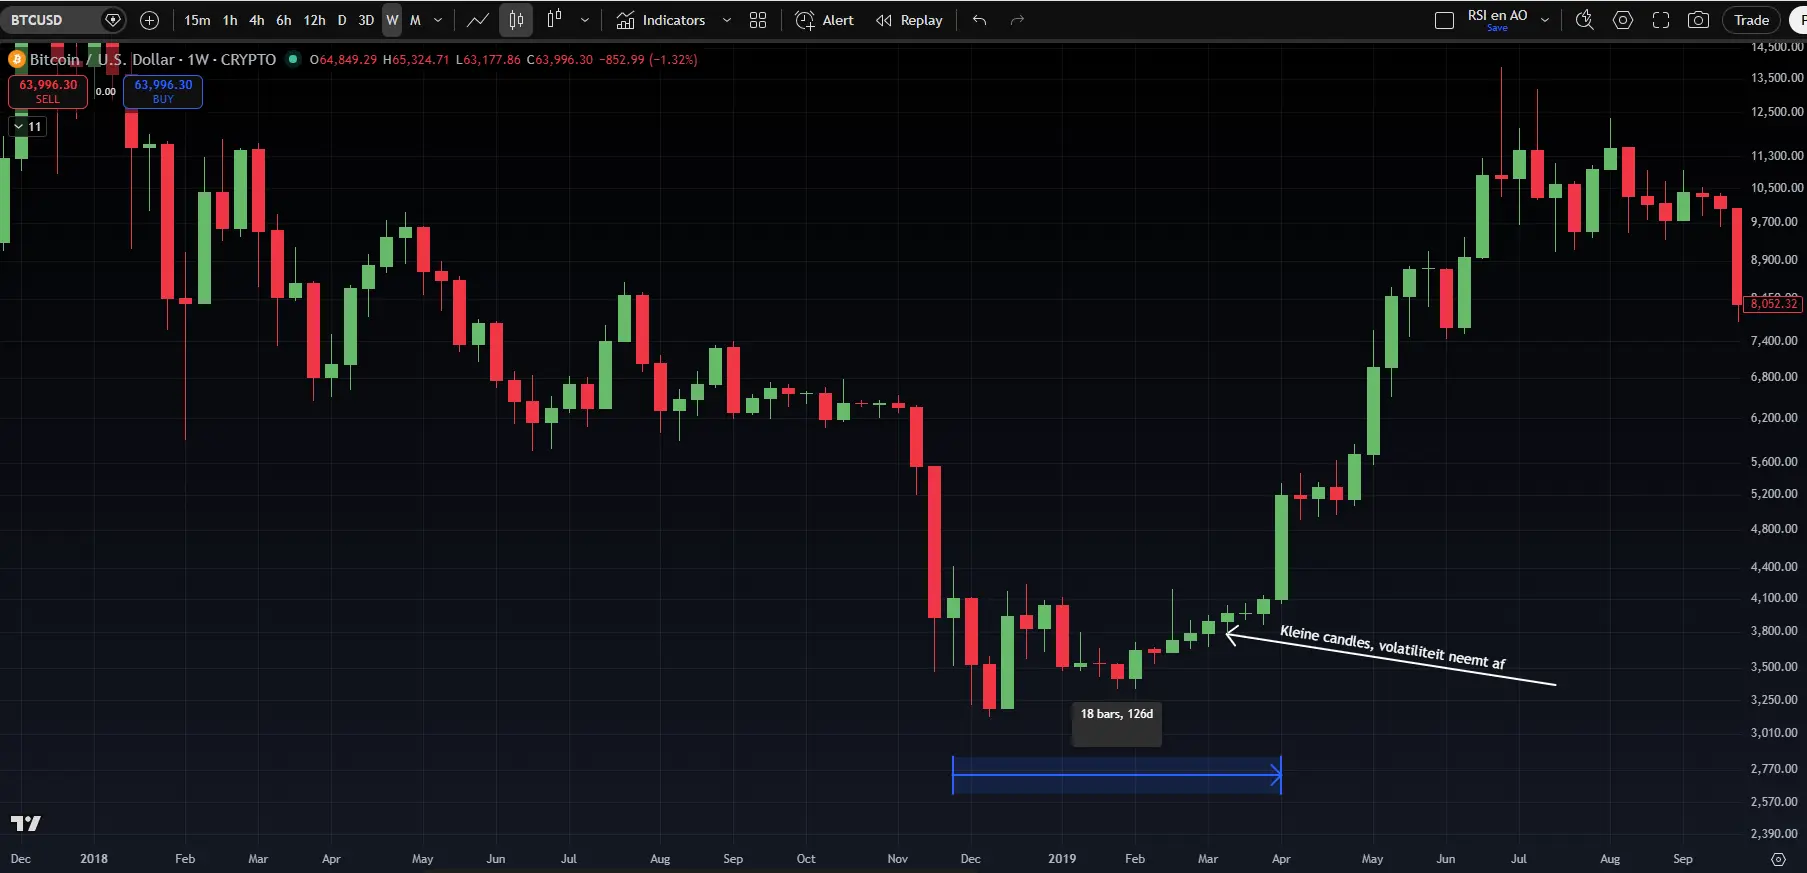
The third signal is perhaps the least exciting one. A few weeks of sideways price movement with little volatility around the bottom. After a long decline, the market is exhausted. The forced sellers are out, the speculators have left, and what remains is a narrow price range with relatively small candles; those are the price swings you see on the chart in the form of green or red candlesticks. That boring picture is actually a good sign. As long as there is still panic and sharp price drops, the selling pressure is simply too strong to even think about a bottom.
As an example, let's look at the end of 2018. Bitcoin broke through the 6,000 dollar support zone in early November 2018. Within a few weeks, the price stood 50 percent lower, after having already fallen from 20,000 dollars to 6,000 dollars in the preceding months. What followed was not a V-shaped recovery, but nearly four months of almost flat trading between roughly 3,400 and 4,200 dollars. Volatility dried up in February and March 2019 to one of the lowest levels in bitcoin's history. Only in early April did the price break out to the upside from the range, capped off by a day on which the price rose more than 20 percent.
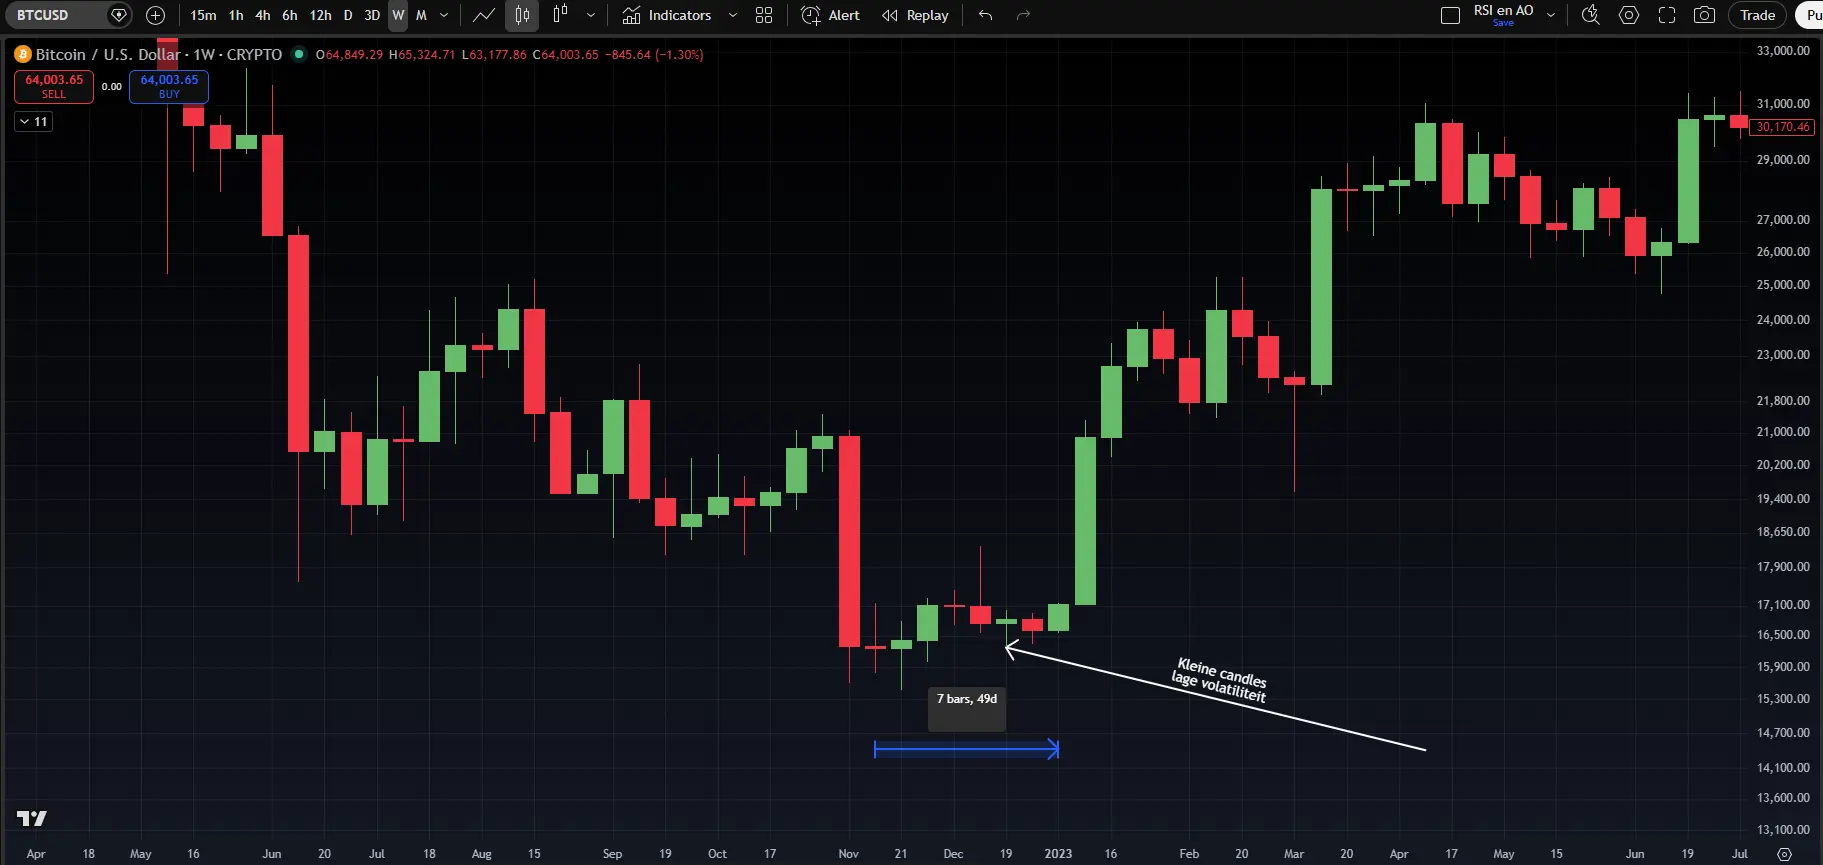
In 2022, remarkably, it looked almost identical. The bottom sat around 15,500 dollars, right after the collapse of FTX. Afterwards, bitcoin went on to trade in a range for nearly two months between roughly 16,300 dollars and 17,300 dollars, with volatility sinking to multi-year lows in early January 2023. Halfway through January 2023, the price broke out to the upside and, within a week, bitcoin stood about 25 percent higher.
This period seems considerably shorter, but it needs the caveat that before the FTX collapse the price was also low in volatility and had already been drifting between 18,000 dollars and 20,000 dollars for weeks.
In both cases, then, the sequence was the same. First capitulation, then weeks to months of dull sideways trading, and only afterwards a breakout that both overcame the dominant EMA and broke the pattern of lower highs on the weekly chart. Whoever waited for that confirmation missed the absolute bottom by about 20 to 30 percent. But whoever bought without confirmation in the spring of 2018 or the summer of 2022 subsequently sat deep underwater for months on end.
Where do we stand now? The lowest point in this bear market so far sits around the 58,000 dollars of early July. Up to now there is still no higher high on the weekly chart, and the price is trading below the dominant 100- and 200-day EMAs. Volatility has, however, already begun to decline in recent weeks.
To become more convinced that the bottom is behind us, a few more weeks of sideways action between 60,000 dollars and 67,000 dollars would be welcome. In the meantime, the EMAs will also converge and settle below/near 67,000 dollars. The moment a strong higher high above 67,300 dollars follows, my signals will turn green that the bottom is behind us.
Be aware that with none of these signals can you time the exact bottom, let alone buy it. That's not the goal either. The goal is to distinguish between a market that is still falling and a market that is done falling. The first costs money, the second makes money. The price you pay for that is missing a piece of the first move up.
We continue with the following topics:
- Price zones: early signal and new bull market
- Bitcoin supported by renewed focus on national debt?
- Odds of a rate hike drop sharply, but bitcoin doesn't benefit
1️⃣ Price zones: early signal and new bull market
 Contribution by
 Bert
From Norway, too, there's writing today about bottoming. Bert builds on the checklist he shared earlier in the Markets.
Sam's and Bert's perspectives largely line up with each other. Still: two different analysts, and therefore two different checklists.
Sam's signals confirm the bottom on the early side. In doing so, he optimizes for the portion of the ride up that you capture. The risk is that the market then turns against the signals anyway and slides back.
You can also wait for more confirmation. You then give up some return and buy certainty with it. Bert's checklist is more geared toward that.
Either way: in both cases you're acting rationally. What remains is a matter of taste and risk appetite.
Over to Bert! 👇
In early July, we noted in this Markets that bitcoin's character was different than in the first quarter:
[We are seeing] in recent weeks, for the first time in this bear market, serious early signs of a possible turning point from a declining trend on the weekly chart to a new rising trend. [..]
We are seeing a different character.
That hasn't changed over the past month. The price is still hovering around 64,000 dollars. Investor behavior in the on-chain data is more or less the same. We still see that bitcoin pays little attention to macroeconomic and geopolitical events.
We're in the time window and the price window in which it's realistic to expect the bottom of the bear market. But that's a very coarse lens. It could easily take a few more months, and drop a few thousand dollars more.
In this phase of the market cycle, patience is needed. Only once we see proof of a new rising trend do we change the base scenario to "a new bull market." For that, we use the following checklist:
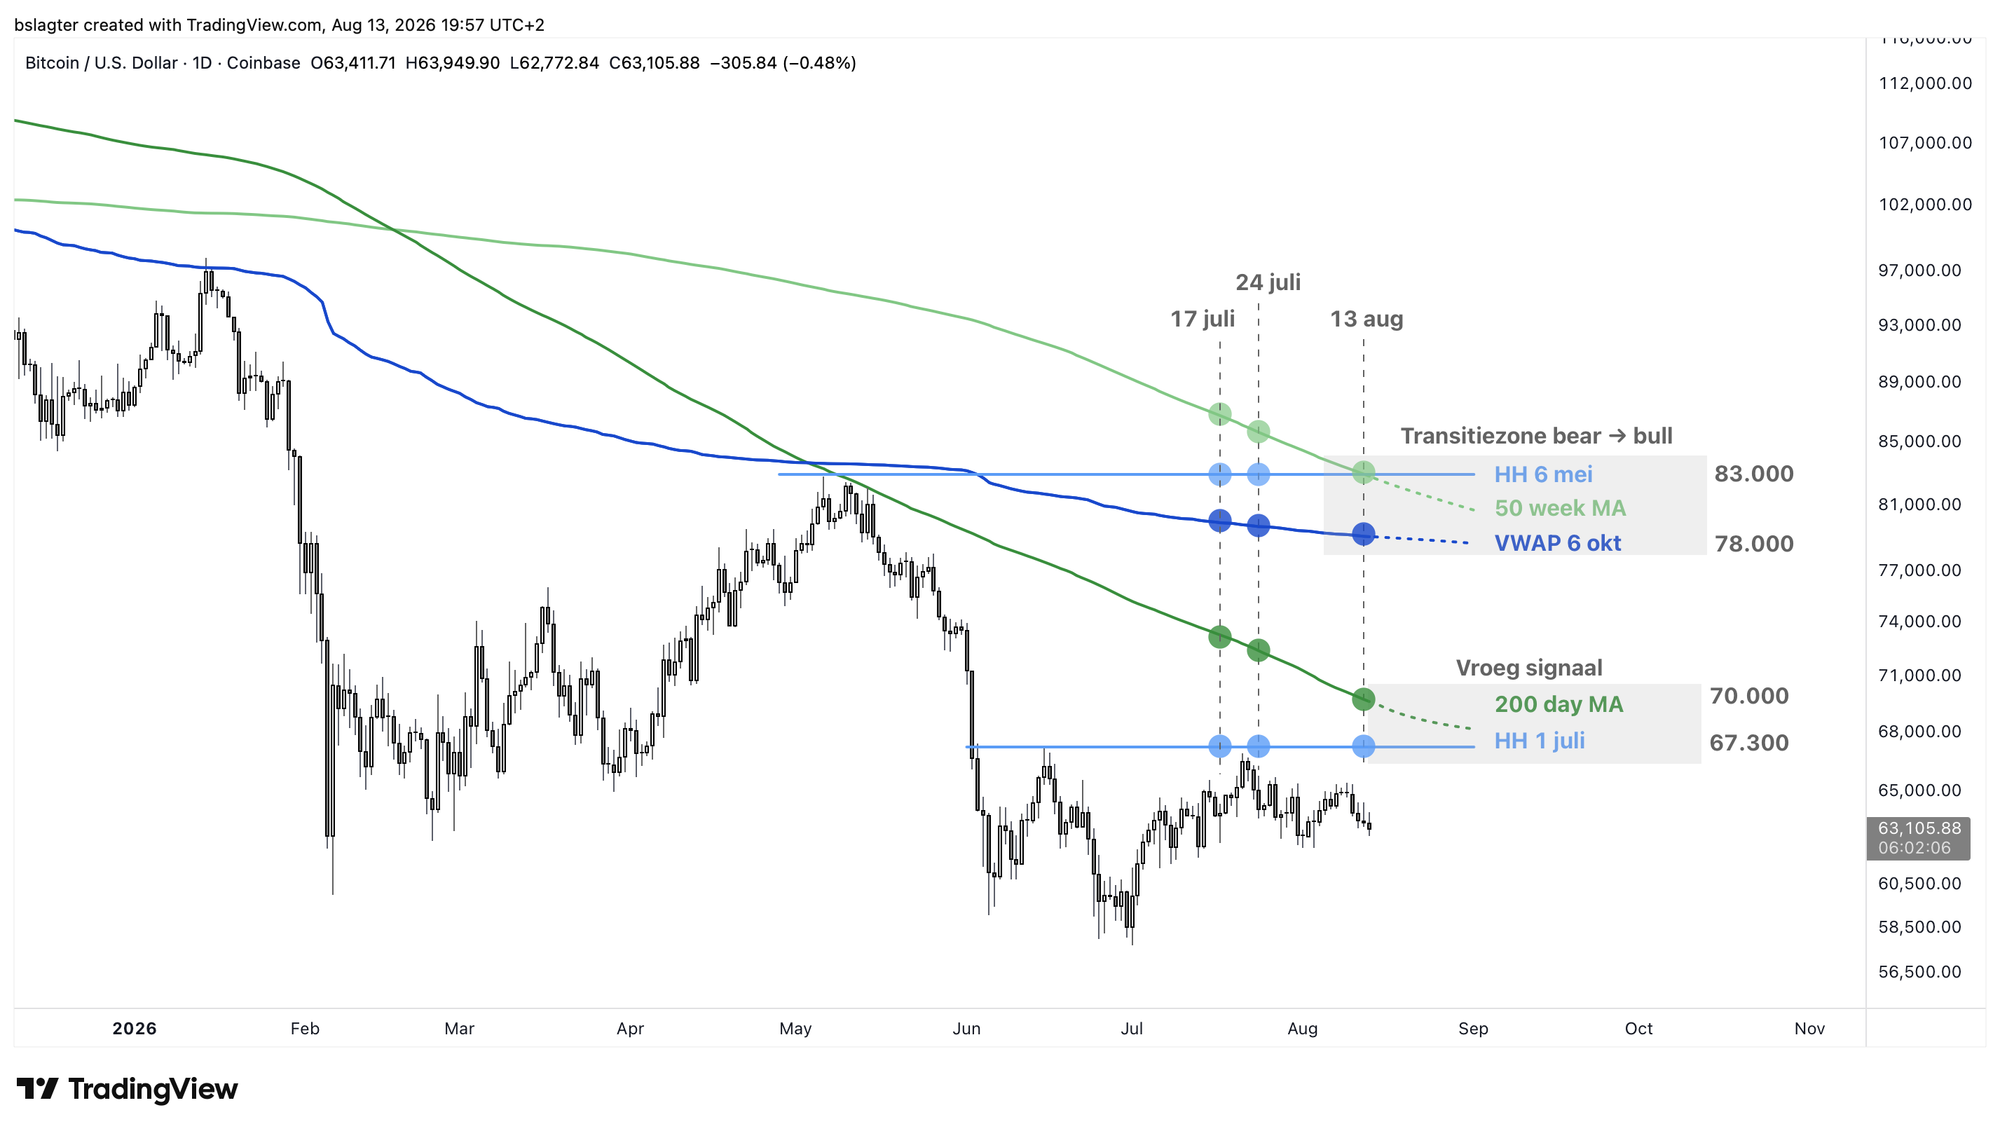
⏹️ A higher high (HH) above the 83,000 dollars of 6 May
⏹️ A higher low (HL) above the 57,700 dollars of 1 July
⏹️ A weekly close above the 50-week average at 82,500 dollars
⏹️ A shift in direction of that average from declining to rising
We can't tick a box yet. It is interesting, though, that the higher high and the 50-week average now sit at roughly the same price. In a bear market, the entry signal comes to you all by itself.
We hear that many investors who follow the market cycle have already stepped in with part of their portfolio. That's quite defensible.
As a next step, you can think of the zone between 67,300 dollars and 70,000 dollars. That's where the 200-day average runs, and where you'd set the highest price since early June. We've labeled that "early signal" in the chart below.
As a final step, we look at the zone between 78,000 dollars and 83,000 dollars, where we make the transition from bear to bull. On acceptance above this zone, we'll also start ticking boxes in the checklist above.
In short: patience. On Satoshi Radio, Bart and Peter discussed the sentiment that belongs to this phase of the bear market this week. Indifference, disengagement and boredom. On our emotion chart, we're making the transition from capitulation to despondency.
That doesn't make for a festive mood. So why invest in bitcoin now anyway?
Well, if (!) you expect bitcoin to keep functioning in a technical sense over the coming years, and to remain relevant in an economic sense as digital gold, then this phase of the market cycle is precisely the ideal one to build up a position. You make the biggest gains when you buy while no one is talking about it.
It comes down to conviction. Is it strong? Then you buy early. Is it moderate? Then you wait for more confirmation. There's something to be said for both; the choice is yours!
2️⃣ Bitcoin supported by renewed focus on national debt?
 Contribution by
 Thom
The bitcoin price is holding up quite strongly above 60,000 dollars, despite the fact that plenty of fundamental headwinds appear to be blowing. There are major doubts about Strategy, and the ETF flows aren't what they used to be either. At the same time, long-term bond yields in particular are climbing, partly due to the war in Iran, but probably also due to the AI investment cycle.
In principle, it's already a good sign that bitcoin manages to stay standing under the current conditions. Those are signals that suggest bitcoin has by now entered a different phase within the bear market. Bad news no longer seems to trigger the price drops you would expect in the middle of a bear market.
At the same time, something else is probably at play, namely the return of the debate over national debt. That of the United States in particular tends to come up.
This week, for instance, a piece on that appeared in The Telegraph. "A dangerous conviction is creeping into markets that the United States is now so deep in a self-reinforcing debt trap that they no longer dare raise interest rates to get inflation under control," is how the article begins.
 Ambrose Evans-Pritchard
The US central bank supposedly no longer dares to raise interest rates, because an ever-larger share of the debt consists of short-term government bonds. A rate hike therefore almost immediately hits the financing costs of nearly 25 percent of the US national debt.
Another problem is that the US Treasury has become increasingly dependent on short-term financing from hedge funds; which sometimes operate with leverage of up to 100 times their own capital. Steven Blitz, chief US economist at TS Lombard, argues that the central bank therefore cannot raise rates aggressively without risking a chain reaction.
According to him, financing costs could then explode. At the same time, at the current pace the US already has to issue around 2 trillion dollars in new debt to finance the largest structural peacetime budget deficit.
For bitcoin, a renewed focus on this theme could turn out well. At the moment, the digital currency clearly lacks a catalyst for price increases. There is not yet a narrative to underpin a possible next bull market. The national debt theme could, in that respect, lend a helping hand.
3️⃣ Odds of a rate hike drop sharply, but bitcoin doesn't benefit
Contribution by Thom
Here we build further on the idea that it's becoming (more) difficult for the Americans to raise the policy rate. Although a runaway national debt as a theme can serve as a catalyst for bitcoin over the medium term, in the short term there are forces at play that prevent bitcoin from benefiting from it already.
The market seems to support the idea that the central bank can hardly raise again. The odds of that at the 16 September meeting have dropped over the past week from 44.4 to the current 32.9 percent. Last Friday's relatively weak jobs report, combined with this week's soft inflation figures, reduces the need for a quick rate hike.
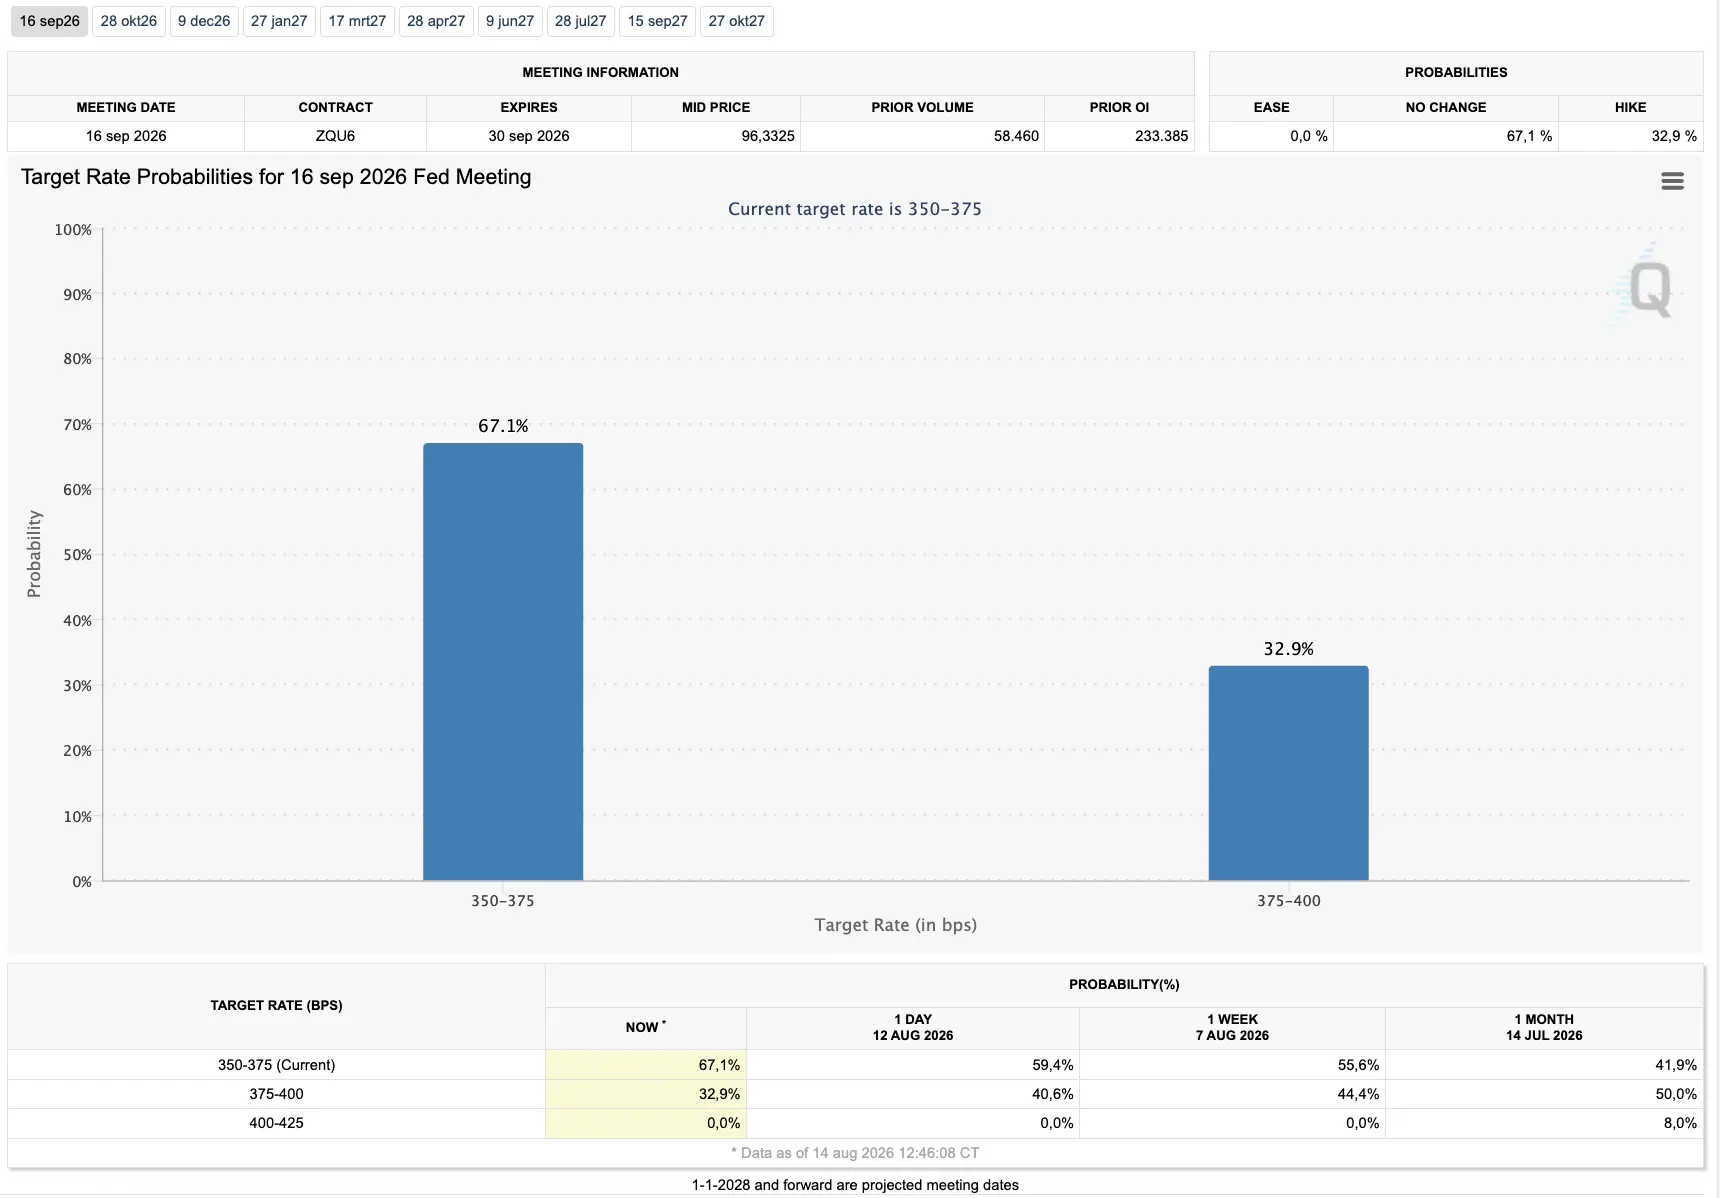
At least, that's what the market expects for the September meeting based on these US central bank figures. For now, compared to last Friday, this resulted in a slightly lower 2-year yield. The longer-term yields, however, have barely fallen since then, if at all.
The market thus appears to be signaling that it expects little from the US central bank when it comes to fighting inflation. Meanwhile, investors in the government bond market do very much want to be compensated for the elevated inflation risk, which is partly the result of the Iran war and the AI investment cycle.
The long-term bond yields, such as the 10-year and the 30-year yields, are still at their highest level since roughly 2007. So while inflation came in better than feared, we saw little improvement in the financial conditions for bitcoin.
In addition, the relatively high yields pose stiff competition for the digital currency, which of course pays no interest. My suspicion is that the market didn't react strongly to the inflation prints because the Iran war is still ongoing and the Brent oil price is once again camped between 85 and 90 dollars.
As a result, the market probably attaches little value to the inflation prints over the past month, because the risen oil price has not yet fully worked its way through. This week's figures look back on a situation that is no longer the same, which is why they couldn't give bitcoin the tailwind it had hoped for.
In closing
All previous editions of Alpha Markets can be read back in the archive. Questions, comments and suggestions are more than welcome in the community.
Thank you for reading!
To stay informed about the latest market developments and insights, follow our team members on X:
- Bart Mol (@Bart_Mol)
- Peter Slagter (@pesla)
- Bert Slagter (@bslagter)
- Mike Lelieveld (@mlelieveld)
We appreciate your continued support and look forward to bringing you more comprehensive analysis in our next edition.
Until then!