The Great Rotation
Bitcoin’s game is changing: $1.3B a day in cash flows, longtime holders sell while new players chase a million-dollar bitcoin. Is the $100k milestone history as fresh liquidity reshapes the market?

A major rotation is underway. Longtime investors are gradually selling off their bitcoin and handing it over to a new group. This process has been occurring for a year at a rate of $1.3 billion per day.
In December, January, and likely also in May and June, the focus was on the legendary $100,000 milestone. For years, that was the distant goal—the rallying cry of “100k by conference day” among the so-called ‘laser eyes’ in 2021.
In July, the price broke above $120,000, only to stall afterwards. We expected the typical bull run behavior, where sellers let their paper profits accumulate by postponing sales in anticipation of even higher prices tomorrow. That didn’t materialize.
Existing investors kept selling. The rationale shifted from the excitement of reaching 100k to disappointment and frustration over bitcoin’s underwhelming performance. While stocks and gold were reaching new highs, bitcoin lagged behind. The fastest horse in the race turned out to be lame.
In October, a third narrative emerged. According to this view, the peak of the four-year cycle would occur in October 2025. “The top is in” and the bear market has begun, proclaimed members of the crypto community, voices influenced by figures like Ansem: “There’s no way for me to be bullish on this market.”
Let’s be clear: taking profits is perfectly acceptable. Especially if your portfolio is heavily weighted in crypto and you’ve already seen life-changing gains on paper. In that case, it makes sense to reduce risk—buy a house, pay off a loan, or treat yourself to that dream vacation.
However, if $1.3 billion per day is being cashed in while the price remains relatively steady over the past year, then it follows that $1.3 billion per day of new capital is entering the market.
Among these new investors, you see large institutional players such as investment funds and sovereign wealth funds. Just two weeks ago, Luxembourg announced that their state fund had purchased nearly €10 million worth of bitcoin.
But a significant portion of the newcomers in 2025 consists of a new breed of private investor—the type that now sees bitcoin as “investable.” Thanks to regulation and oversight, praise from BlackRock’s Larry Fink, and the availability of ETFs, bitcoin has reached a new level of credibility.
This group’s allocation might grow from 0% to 1% or perhaps 5%—often automatically, according to their advisor’s formula. They aren’t swayed by the myth of a four-year cycle of exactly 47 months, nor are they envious of gold or stocks—assets that are already in their portfolios.
For them, the magical $100k milestone is just the starting point. The early adopters paved the way to that level, and now the newcomers hope to see their digital gold reach one million dollars per bitcoin within the coming decade.
They aren’t in crypto for a brief alt season or a short-lived bull run; they view bitcoin as a portfolio diversifier and a safe haven during geopolitical turmoil. This view isn’t entirely original—it’s the same one echoed by BlackRock and Deutsche Bank.
The Great Rotation.
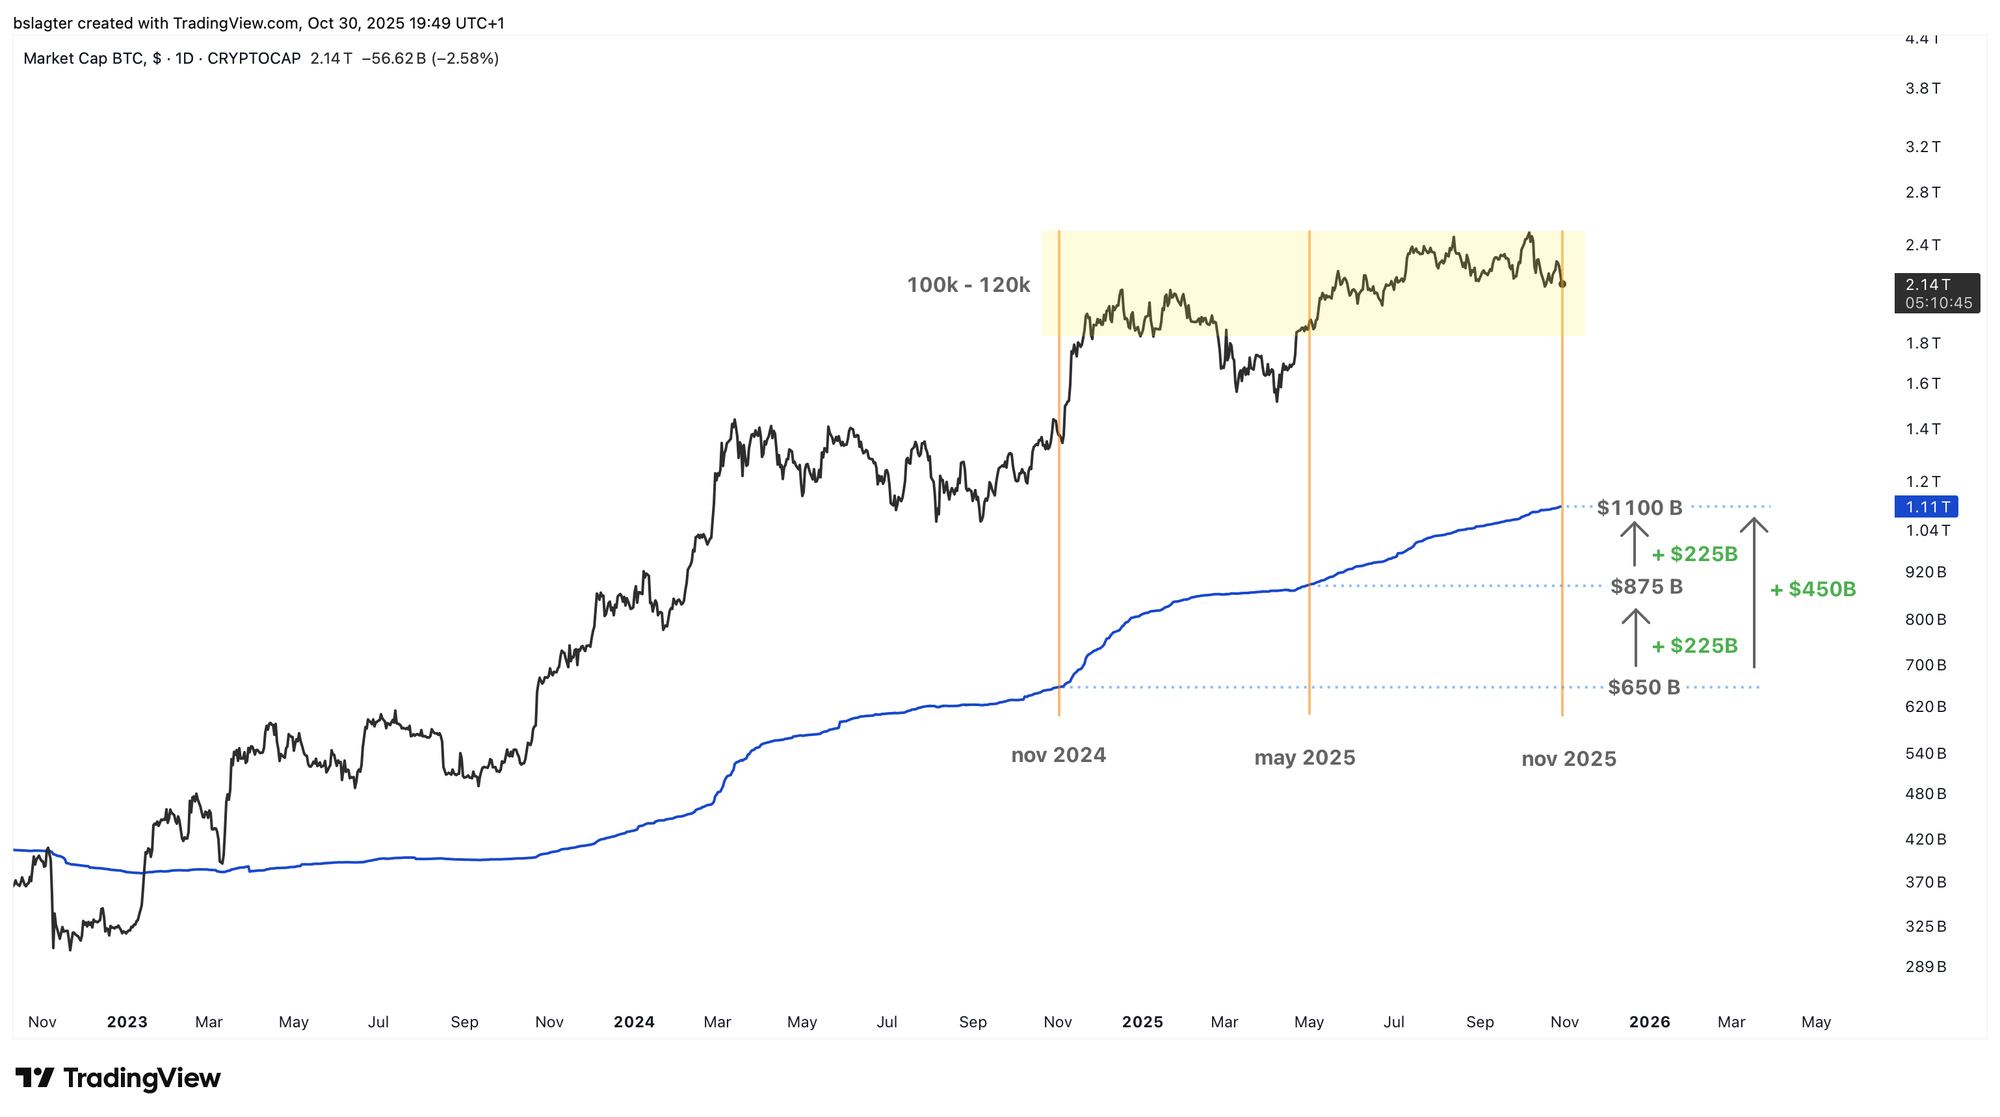
The chart below displays bitcoin’s total market value (market cap) in black alongside its realized value (realized cap) in blue. Think of the realized cap as the total amount that all investors have put into bitcoin. The difference between the market cap and the realized cap represents paper profits.
Over the last twelve months, $450 billion has flowed into bitcoin—roughly $1.3 billion every day. Although prices mostly fluctuated between $100,000 and $120,000 during that period, it indicated that supply and demand were largely in balance.
There is a noticeable asymmetry between buyers and sellers.
Let’s revisit the three narratives driving this great rotation: the 100k milestone, bitcoin’s underperformance compared to gold and stocks, and the precision-timed four-year cycle peak.
The asymmetry can be summarized as follows:
- The bitcoin held by investors selling based on these narratives is limited and diminishing. After all, you can only sell your bitcoin once.
- The dollar inflow from investors adding $1.3 billion a day is virtually unlimited. Even if just 1% of the $305,000 billion in global financial assets (BCG, 2024) flows into bitcoin, that amounts to $1.3 billion a day for six years.
If the macroeconomic environment remains favorable—which is our baseline scenario—eventually the market will be made up of new investors alongside the longtime holders who continue to HODL.
It wouldn’t be surprising if, in the coming months, we reach a point where sustained demand outweighs the finite supply, as those who wanted to sell have already done so and the prevailing narratives lose their power—perhaps because gold’s performance falters or the price is too high to trigger a bear market.
The crypto market might get a bit rough in the coming weeks—maybe even prompting The Economist to run a front-page story declaring “bitcoin has lost its mojo” before the tide shifts. Even columns by the ECB’s Jürgen Schaaf can serve as reliable bottom indicators.
However, our baseline scenario remains that a new period of rising prices will follow. We are not at the start of a bear market; bitcoin’s underperformance appears to be merely a temporary deviation—a bull run during which many former bitcoin holders may return with regret and FOMO.
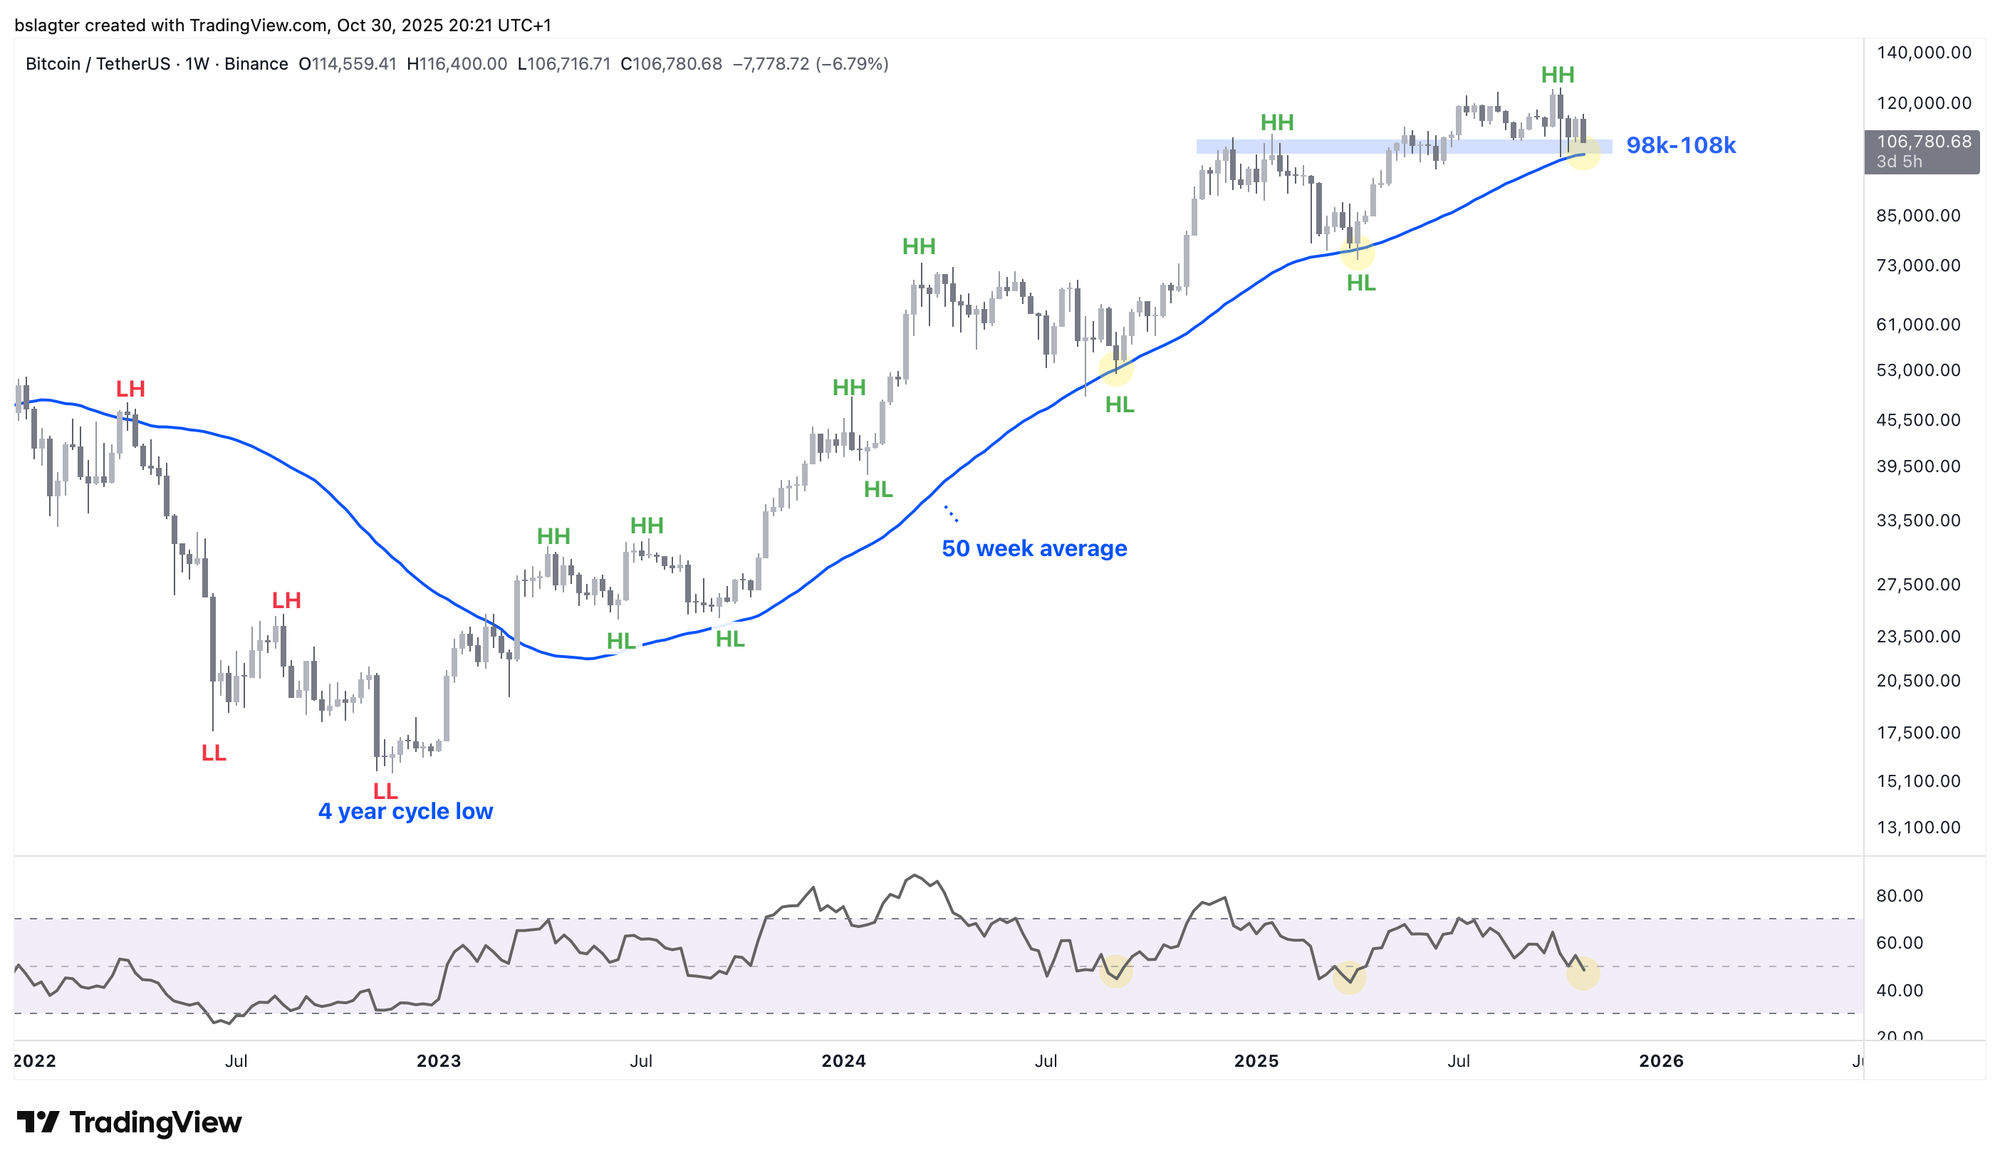
We hope that the market’s structure on the weekly chart holds steady during this period. Currently, we see an upward trend marked by higher highs (HH) and higher lows (HL), supported by the dominant moving average.
We’ve reached a point resembling August 2024 and April 2025, as illustrated in the chart below—near the 50-week moving average with an RSI around 50. Our baseline forecasts that the bull market isn’t over and that in the coming weeks we’ll establish a higher low (HL) around 100k.
We’ve just touched on the favorable macroeconomic context. Essentially, governments around the world are stimulating their economies, with central banks backing fiscal policy with increasingly loose monetary measures.
These (loose) conditions benefit riskier investments such as stocks and crypto, as well as scarce assets like gold, real estate, unique companies, and bitcoin.
Recently, concerns have surfaced regarding the US government shutdown, its impact on the Federal Reserve’s rate cuts, tensions in the US bond market, and the evolving relationship between China and the US.
Some of these concerns eased this week. For example, Trump and Xi have put their trade war on hold for a year. We’ll soon delve into the Federal Reserve’s interest rate decision and Jerome Powell’s briefing. However, the shutdown continues to disrupt economic data availability and capital flows at the Treasury.
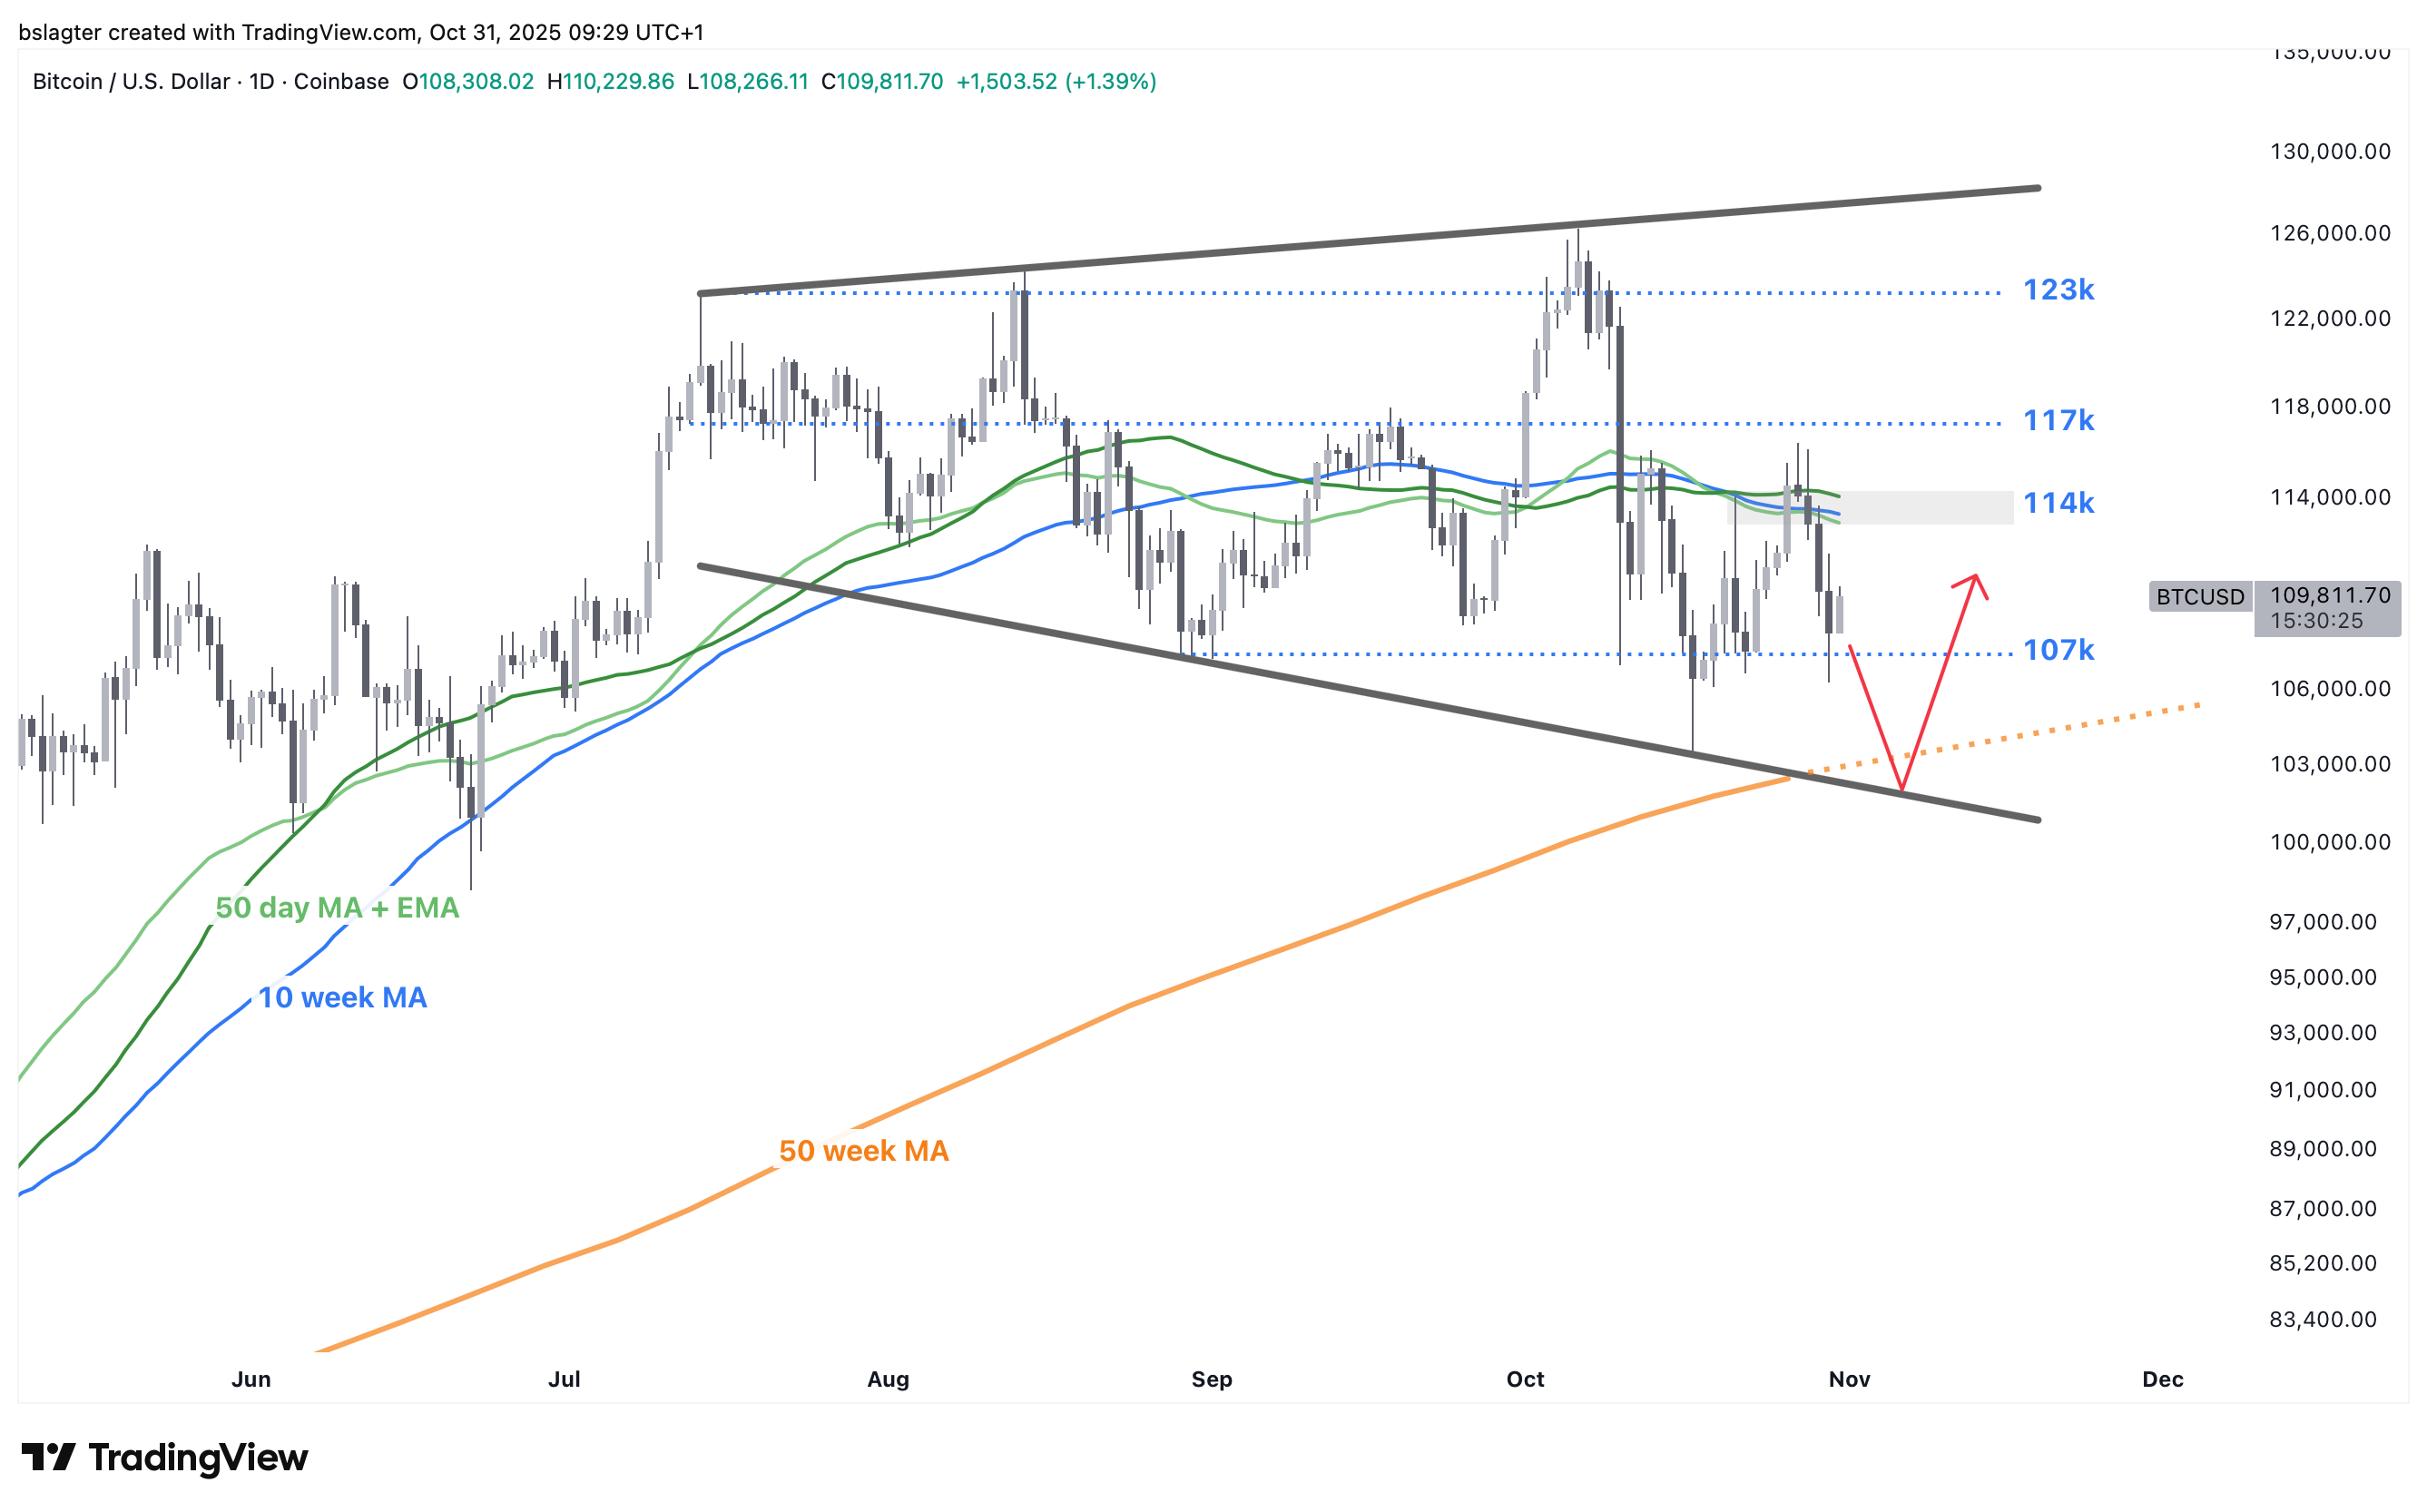
In the coming days, we expect some volatility and headwinds for risk assets—a drop toward the lower end of the megaphone pattern seems likely. Hopefully, that will be the weekly cycle low: the higher low (HL) we aim to mark on the weekly chart above!
We continue with these topics for our Alpha Plus members:
- Jerome Powell Doubts a Rate Cut in December
- The Federal Reserve Ends QT
- Targets for Bull & Bear Based on MVRV
- Is Bitcoin Underperforming? Or Not?
- It’s Hard to Be Bearish
1️⃣ Jerome Powell Doubts a Rate Cut in December
Bert
On Wednesday evening, the US central bank lowered rates by 25 basis points, bringing the range to 3.75%–4.00%.
In 2022 and 2023, the Fed raised rates in 11 steps totaling 525 basis points to ensure that high inflation didn’t become entrenched in the minds of households and businesses. Fed Chair Jerome Powell looks back on this as a soft landing—bringing inflation under control without plunging the economy into recession.
The Federal Reserve has two mandates: price stability and maximum employment, which can often be at odds. Stimulating the economy to reduce unemployment can push up inflation, while restraining the economy to fight inflation can increase unemployment.
For over a year, rates were set at 5.25%–5.50%—a level that significantly slowed the economy. That was necessary at the time because inflation was the primary concern, and the economy coped well despite the slowdown.
Now, the situation has evolved. The risks of inflation and unemployment have more or less balanced, calling for a neutral rate—a level that neither stimulates nor restrains the economy. Although no one can define ‘neutral’ with certainty—it's more art than science—it would likely be a bit lower than the current 2024 rates. That’s why Powell began easing the brakes in September 2024.
Since then, 150 basis points have been removed from the 5.25%–5.50% range, bringing rates down to 3.75%–4.00%. Some Fed commissioners believe this is roughly neutral, while others argue that neutral trends even lower. This disagreement was evident behind closed doors at the recent FOMC meeting.
During the press conference, Powell mentioned that this division was a reason to hold off on further rate cuts unless labor market issues necessitated it. This statement surprised the market, which had assumed just yesterday that a 25 basis point cut in December was on the agenda.
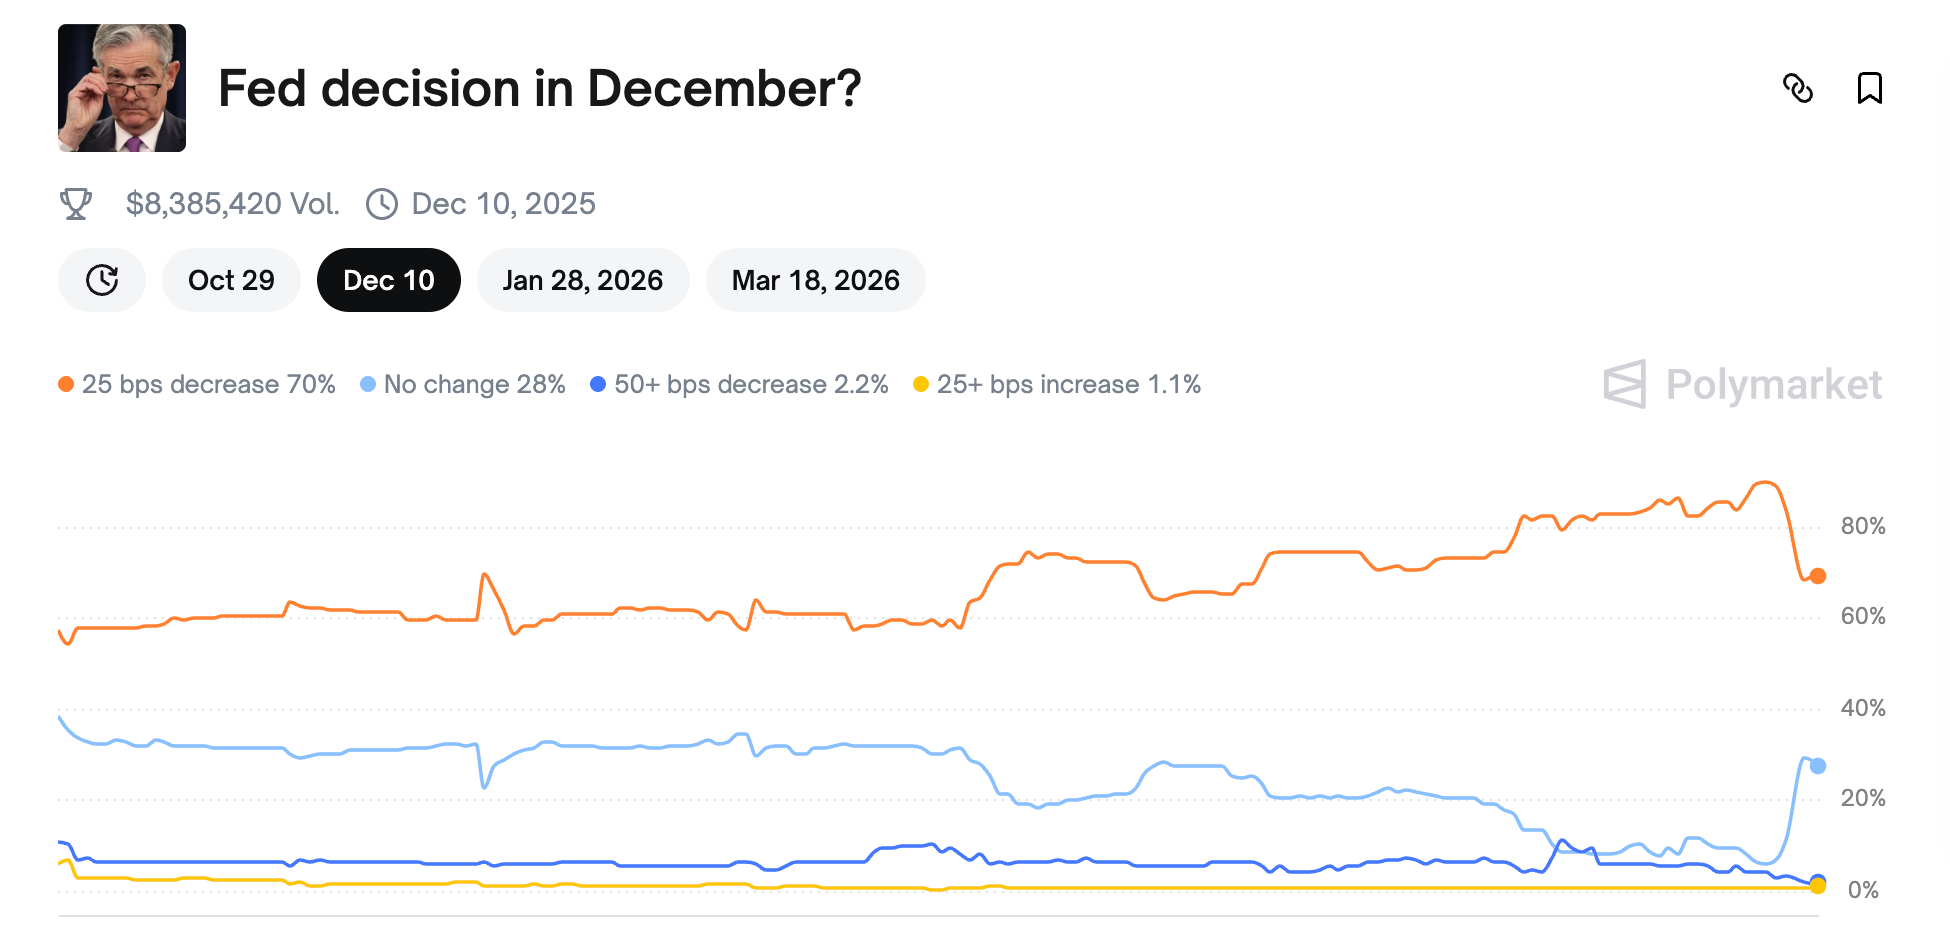
The dollar strengthened while stocks, gold, and bitcoin fell. On Polymarket, the probability of a rate cut dropped from 85% to 70%. Similarly, the futures market now predicts a 66% chance of a cut, down from 90% on Tuesday.
Reading between the lines, it seems Powell believes there is still room for adjustments on December 10. He mentioned three points:
- Going forward, we need to assess which of the two risks requires the most focus based on incoming economic data.
- It appears that inflation will remain well under control, and we expect any inflation caused by import tariffs to be a one-off event.
- It looks like the labor market will face additional pressure.
In other words, while a rate cut is no longer a given, it isn’t entirely off the table either.
For the financial markets, this likely means only a minor shift since the broader picture remains unchanged. Governments worldwide are stimulating their economies, and central banks continue to support fiscal policy through accommodative monetary measures.
Bitcoin might continue to experience the effects of the great rotation for a while, but macroeconomic conditions are expected to remain favorable in the months ahead.
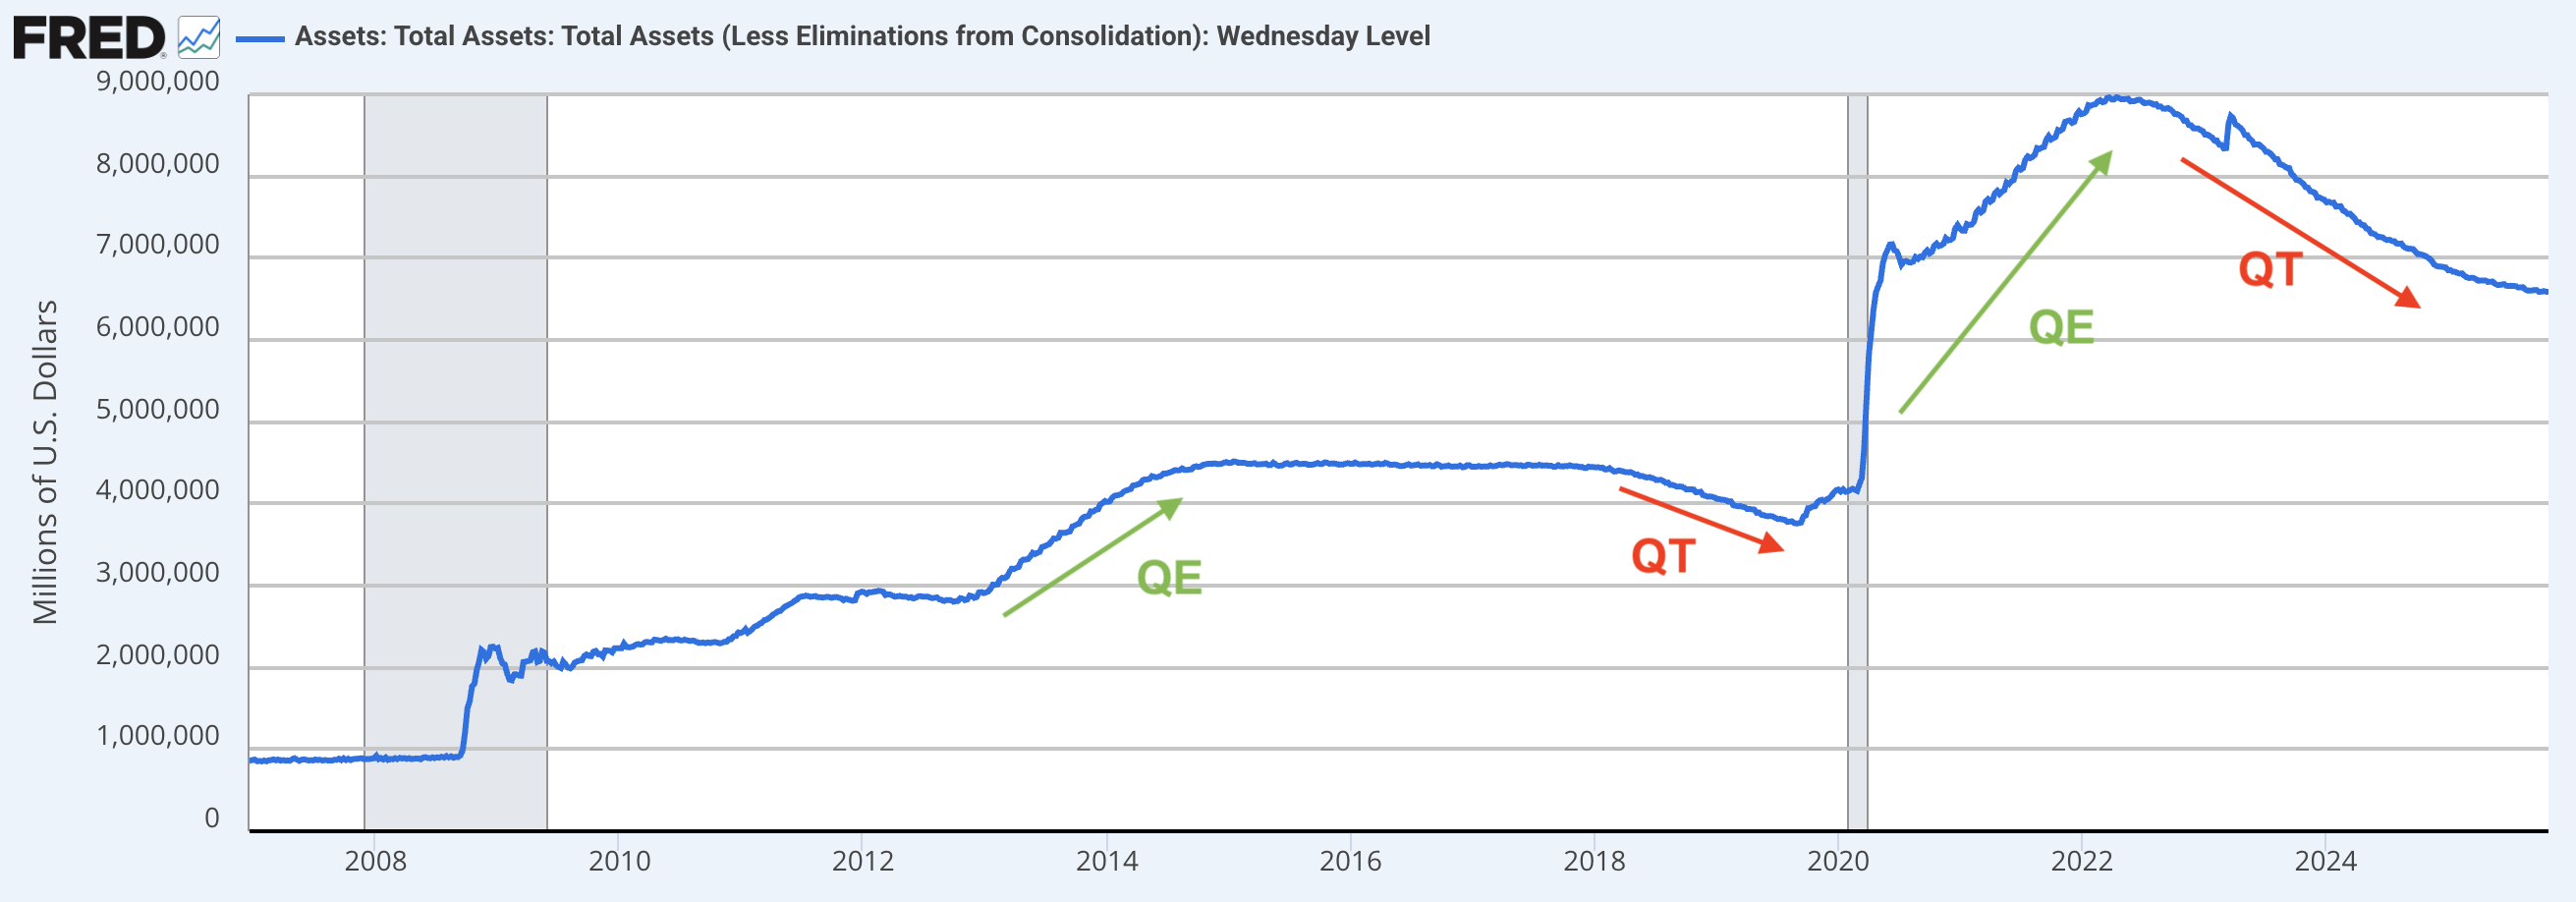
2️⃣ The Federal Reserve Ends QT
Thom
“Powell calls on markets to get their act together ahead of a December rate cut,” headlined the FD on Thursday morning. Powell’s warning garnered more attention from journalists and investors than any other news, and the wild market movements during the press conference were closely tied to it.
Almost as noteworthy as the rate decision was the announcement that the central bank will cease Quantitative Tightening (QT) as of December 1.
Over the next month, the US central bank will continue to shrink its balance sheet by letting maturing (mortgage) bonds roll off without replacement. That phase will soon come to an end. Starting December 1, the central bank will use the freed-up capital each month to purchase short-term Treasury bills on the open market.
The overall balance will remain roughly the same, meaning no new money is being created, although the composition of assets will change.
This decision is driven by recent stresses in short-term funding markets, where key rates spiked due to a lack of liquidity. By buying mainly short-term Treasuries now, the central bank injects liquidity exactly where it’s needed most.
This move helps alleviate some of that pressure, although it could mean that long-term rates may face upward pressure since support will shift entirely to the short end of the market.
You can best think of this step as clearing a few clogged pipelines in the financial system—it's not about opening the floodgates. It’s somewhat positive for liquidity because the balance sheet will stop shrinking. However, since the process had already slowed significantly in recent months, the effect is likely to be limited.
Some analysts contend that these measures, combined with a government issuing mostly short-term debt, have much the same effect as Quantitative Easing (QE)—the opposite of QT. With the government not issuing long-term bonds, the supply shrinks, which could exert downward pressure on long-term rates.
I remain a bit skeptical about that interpretation. Still, after this meeting I feel generally optimistic.
We now have a central bank that is likely to continue cutting rates, an economy growing above average, and inflation hovering around 3%. And QT ended sooner than expected.
This reinforces my belief that this bull market is far from over—especially with the prospect that in 2026 Trump may be in a position to appoint a new central bank chair, and with midterm elections approaching. Against that backdrop, it seems unlikely that the liquidity cycle has truly run its course.
3️⃣ Targets for Bull & Bear Based on MVRV
Bert
In the first section of these Alpha Markets, we looked at bitcoin’s rising realized value. Over the past twelve months, $450 billion has flowed into the bitcoin market—in total, reaching $750 billion since the start of this bull market in November 2022.
The chart below contrasts this with the 2021 bull market. So far, this bull market has seen nearly twice as much new capital flow compared to the previous one.

The MVRV ratio—the relation between market value (MV) and realized value (RV)—is depicted below. An MVRV of 1 indicates that there are, on average, no paper profits; unrealized gains and losses roughly cancel each other out, as investors always hold positions with some profit.
Take Satoshi Nakamoto, for example—his unrealized profit will likely never be cashed in.
Glassnode estimates that 1.45 million BTC fall into this category—bitcoins mined by Satoshi and other early players before July 2010 that will probably never be spent. At current prices, that accounts for $160 billion of market value that is unlikely ever to be realized.
This partly explains why the MVRV in bull markets rarely dips below 1.8, as there simply isn’t enough unrealized profit to motivate investors to sell their bitcoin.
In the chart above, the orange line connects instances when the MVRV reached 1.8. It’s evident that the market value (and thus the price) is always higher for the same MVRV. From a profit-taking perspective, the supply is roughly where it was when prices were around 80k in April or 58k last summer.
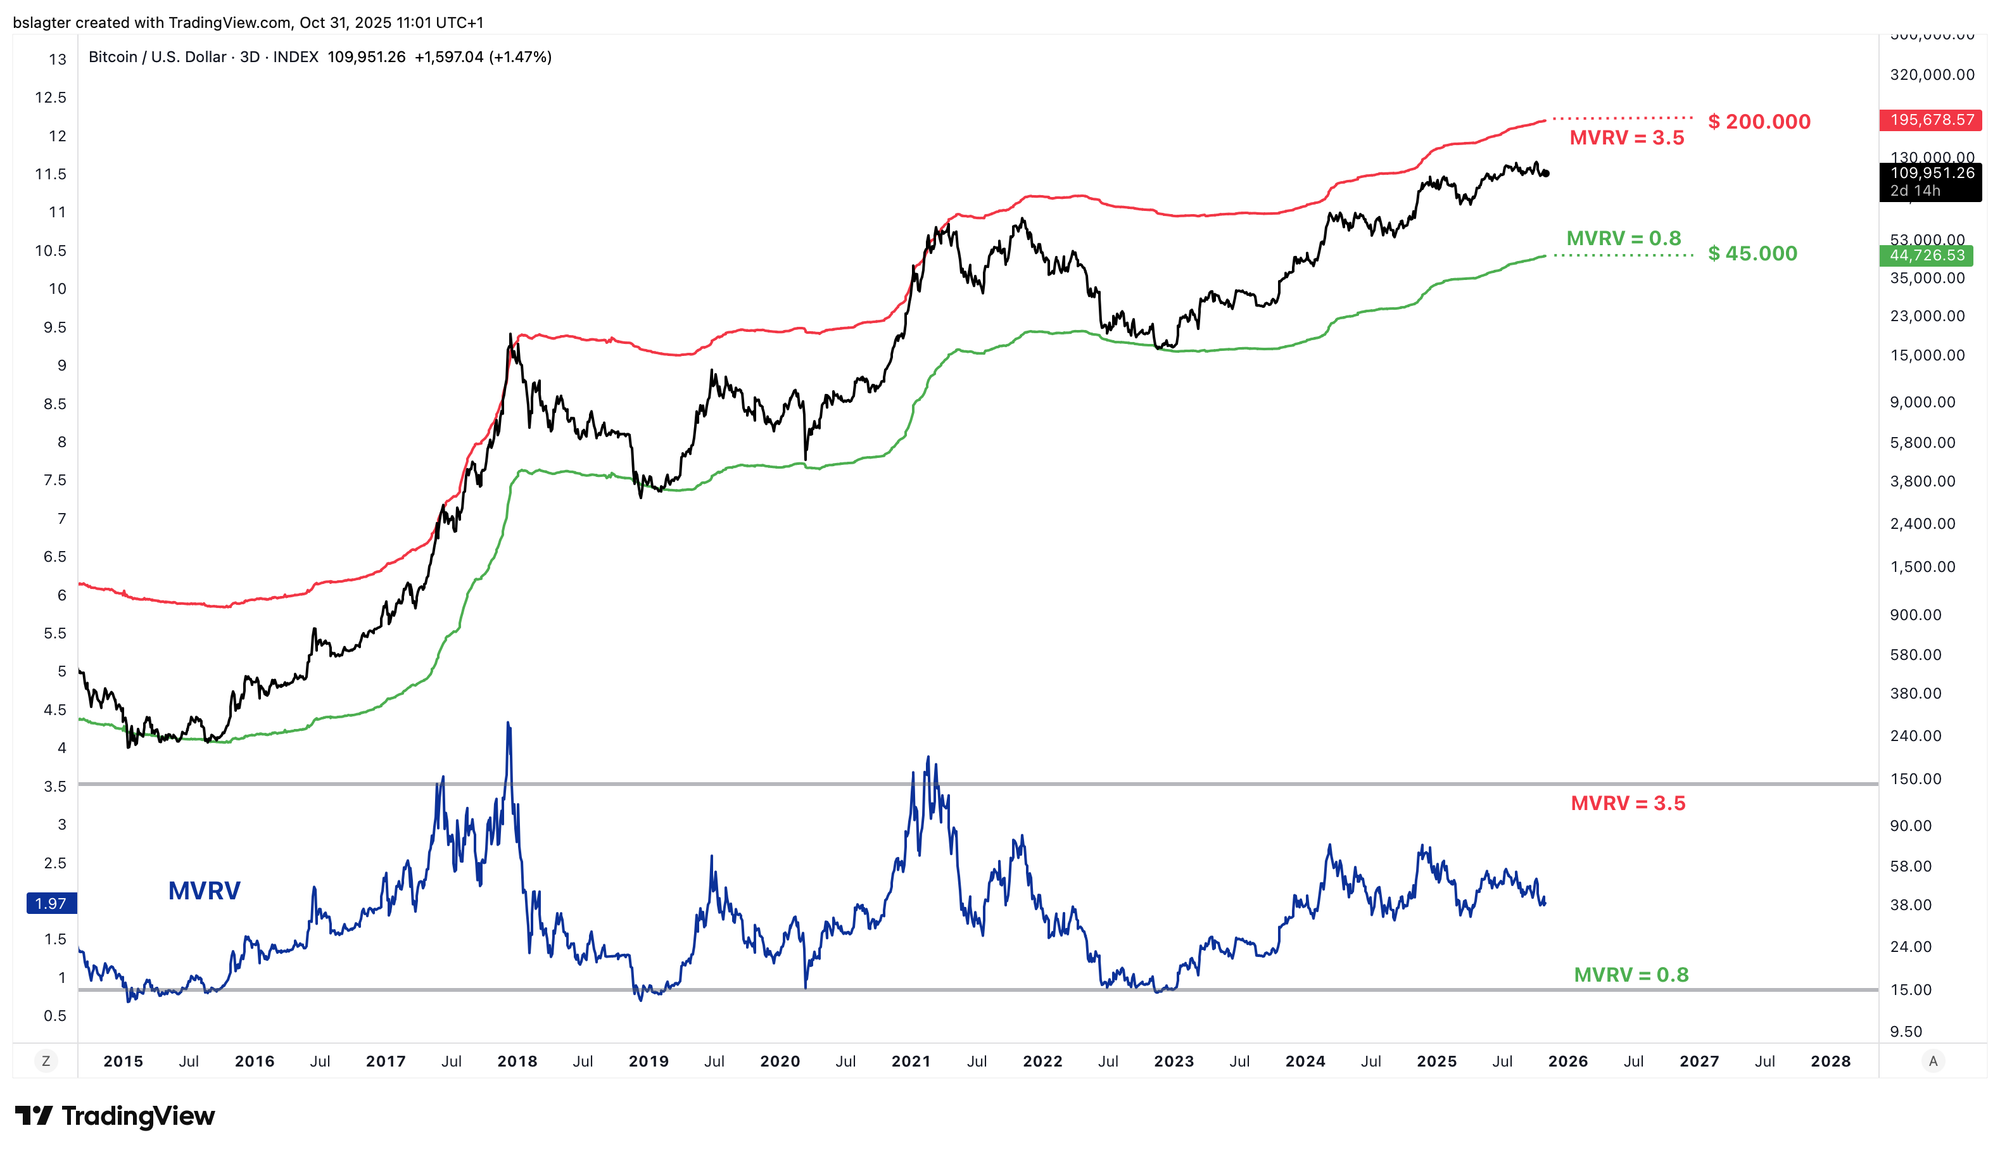
You can interpret this as defining a lower and upper price limit. An MVRV of 3.5 is typically encountered in overheated, hype-driven markets, while an MVRV of 0.8 appears near the bottom of a pronounced cyclical bear market.
The chart below illustrates where we currently stand. Note that during price ascents, the upper limit tends to shift upward as many profits are realized along the way.
Based on this analysis, we can outline four scenarios:
- A euphoric bull run follows, pushing the MVRV to 3.5; the price easily surpasses $200,000—and likely goes much higher.
- A subsequent upward step occurs, as seen multiple times during this bull market, reaching an MVRV of 2.5, which corresponds to a price of $150,000.
- A mild bear market unfolds, with the MVRV dropping to 1.2. This would suggest a bottom of around $66,000—a 48% decline from the peak.
- A typical bear market ensues, with the MVRV falling to 0.8. This would translate to a bottom of about $45,000—a 65% drop from the peak.
Note that a 65% drop is considerably less severe than the 77% seen in the previous bear market. Such a decline would only occur if, in addition to a cyclical bear market, we entered a secular bear market—a scenario that may eventually happen but doesn’t seem imminent.
4️⃣ Is Bitcoin Underperforming? Or Not?
Bert
Gold is surging, stocks are breaking record after record, yet bitcoin appears to be lagging behind—a situation that frustrates some investors and prompts them to exit the crypto market.
In fact, that's accurate. Since the beginning of August, bitcoin has taken a different trajectory than gold and stocks. The Nasdaq-100 has steadily climbed, buoyed by a growing appetite for risk. Had bitcoin mirrored this trend, its price would now be around $140,000.

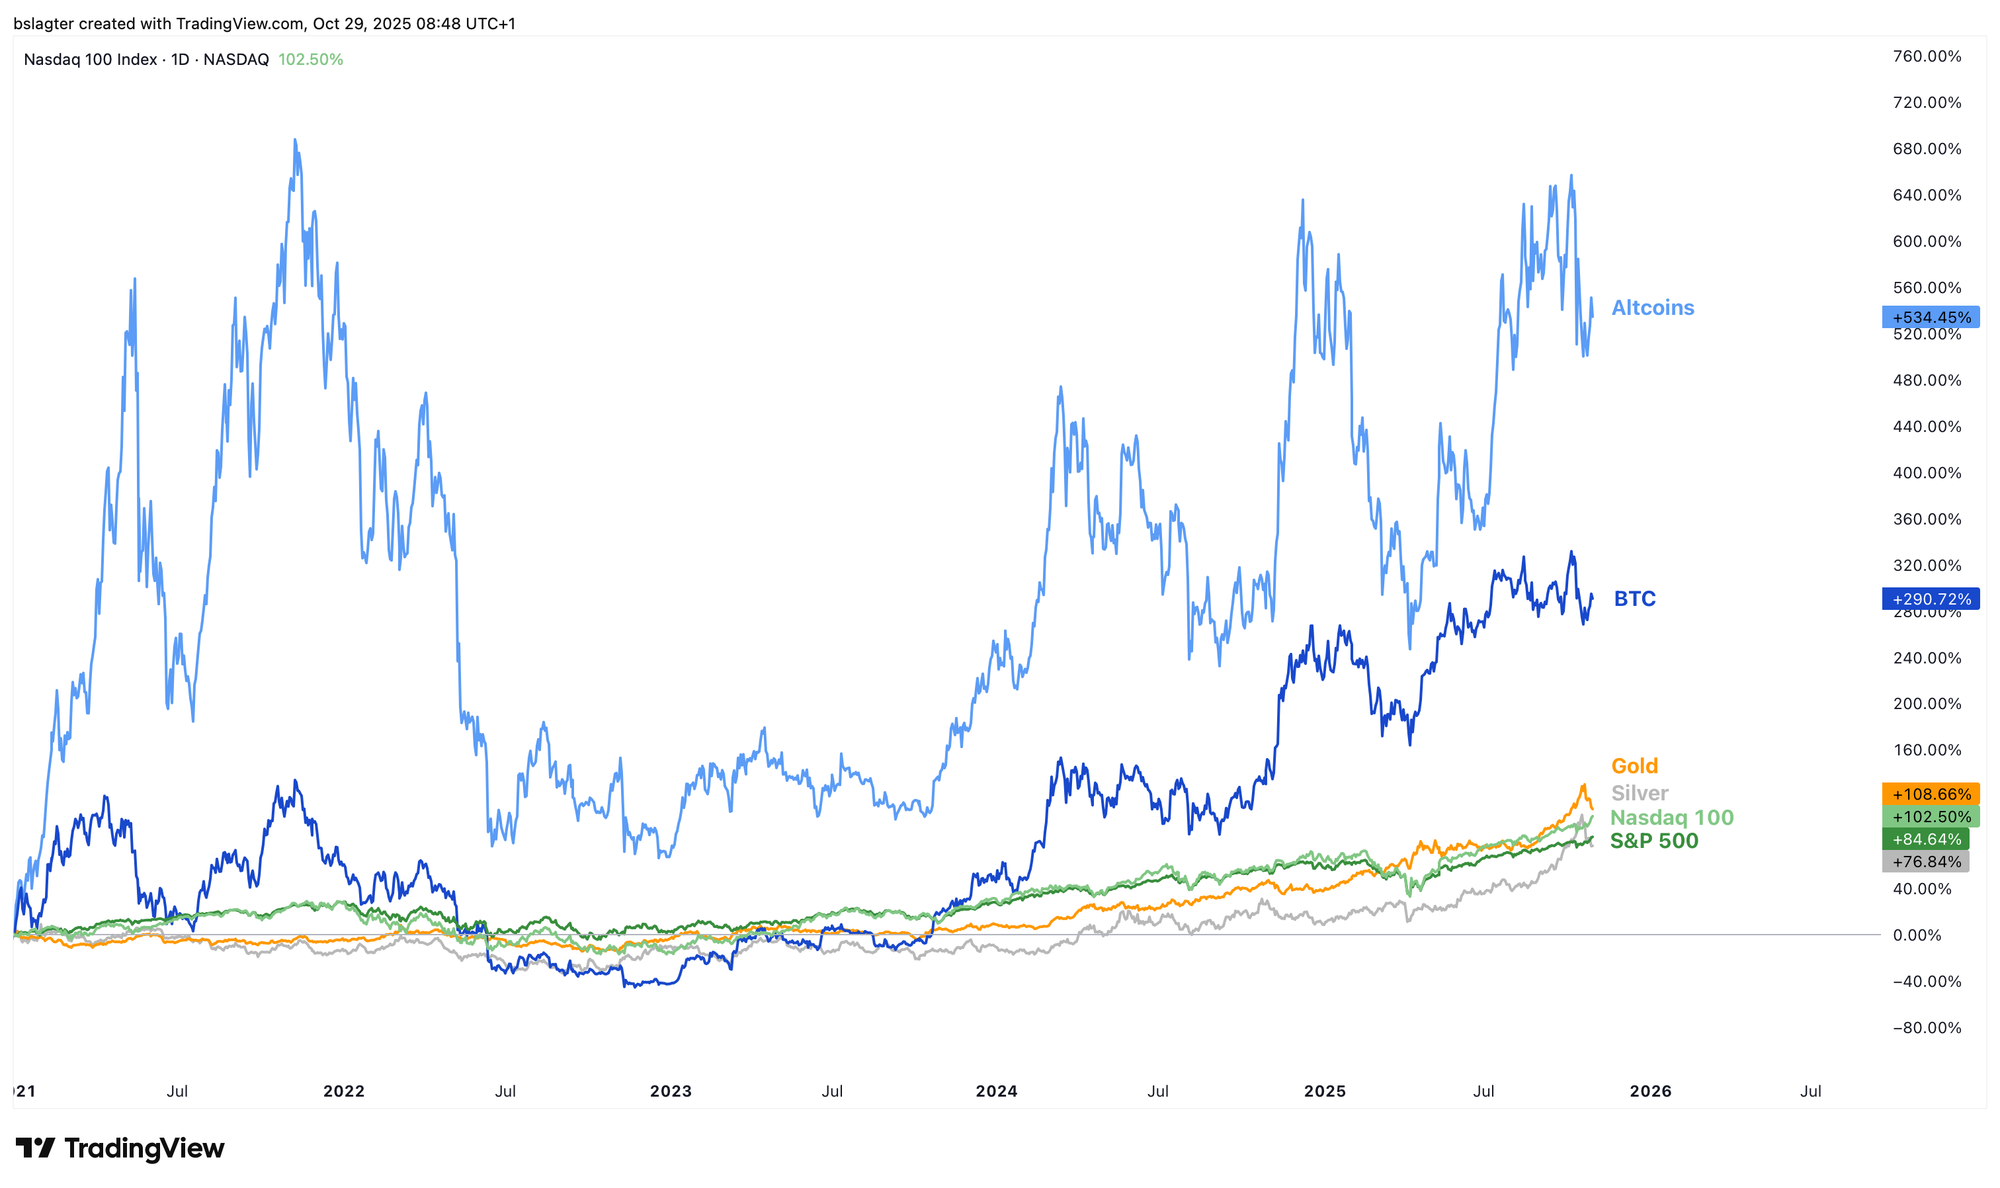
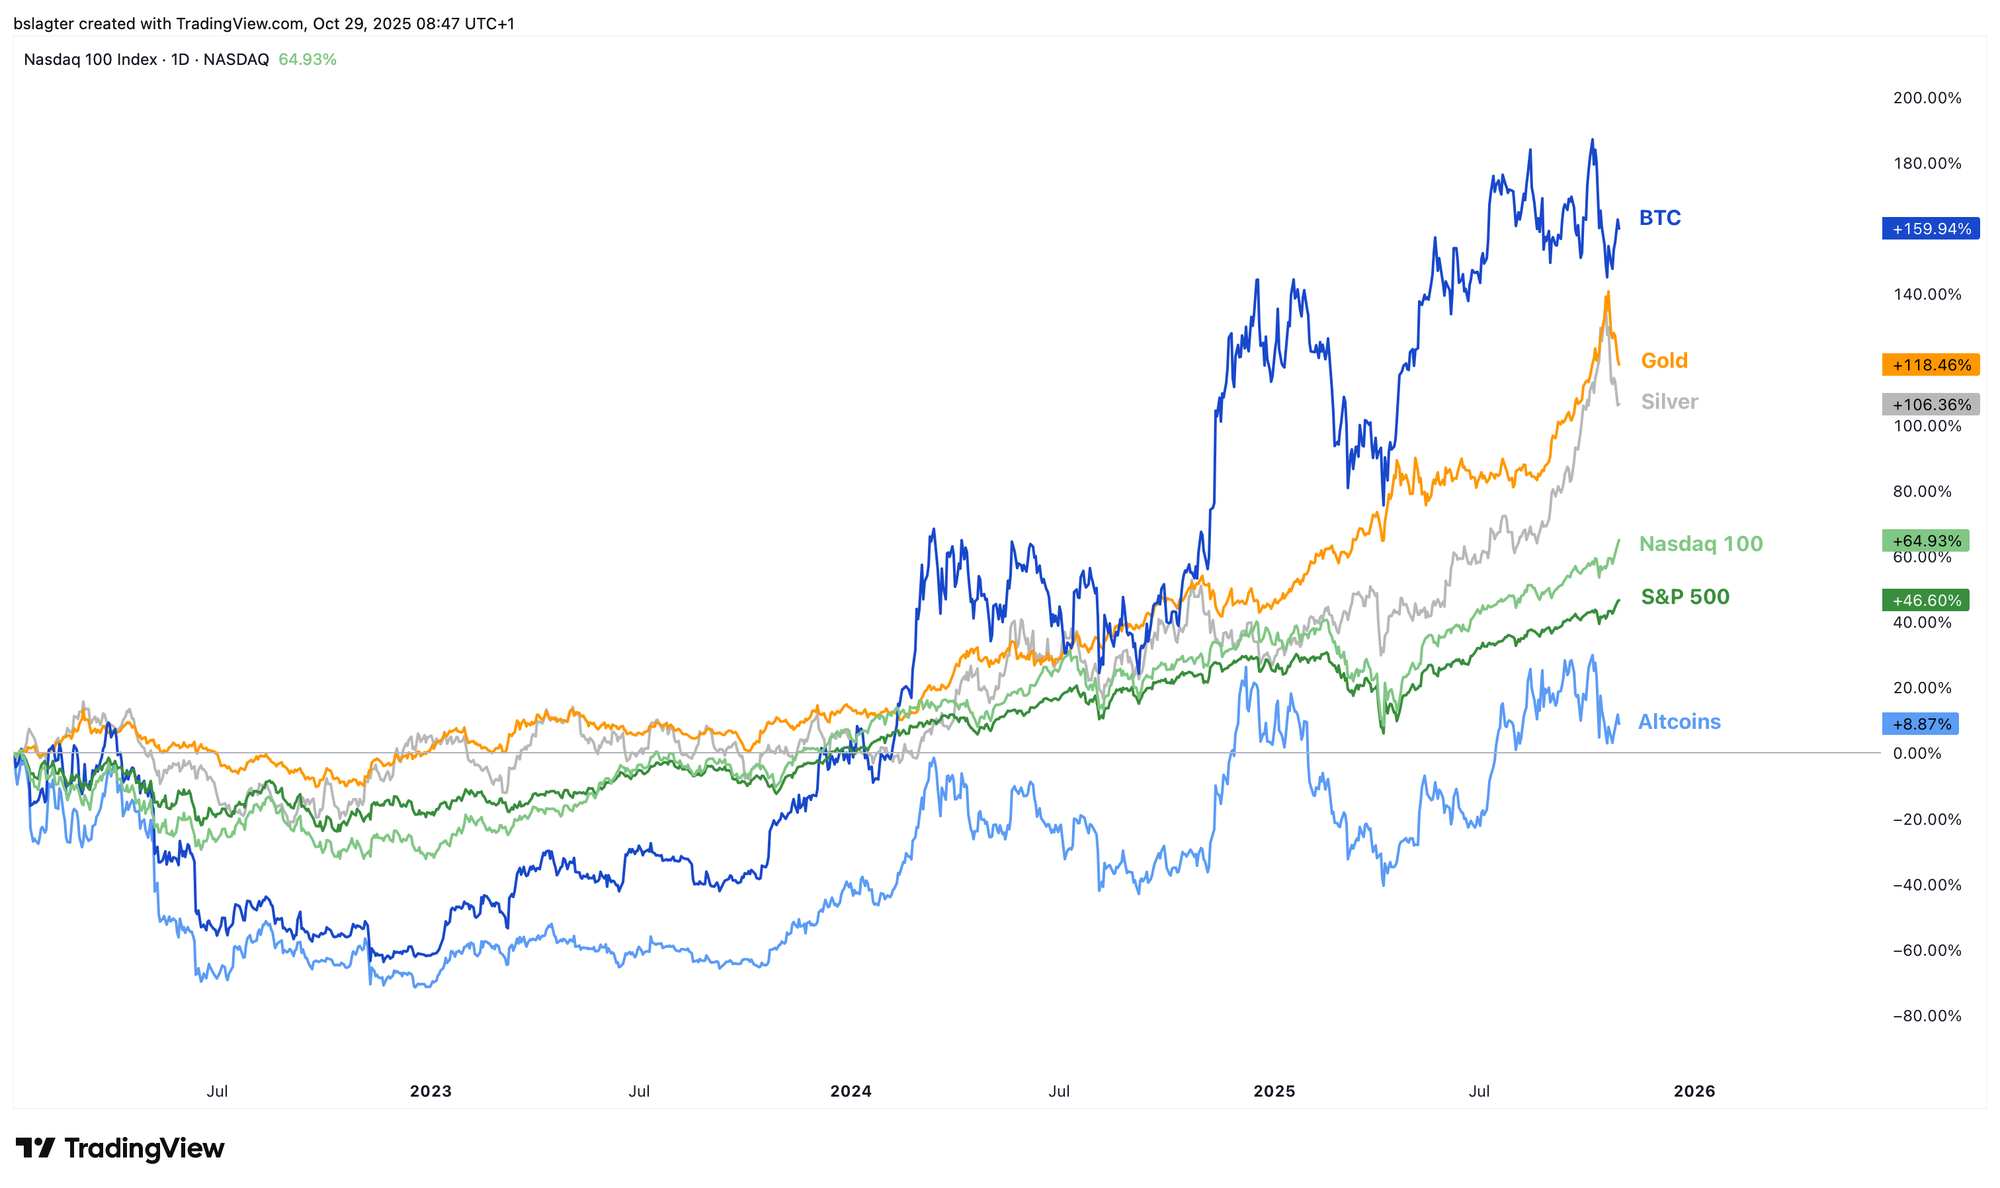
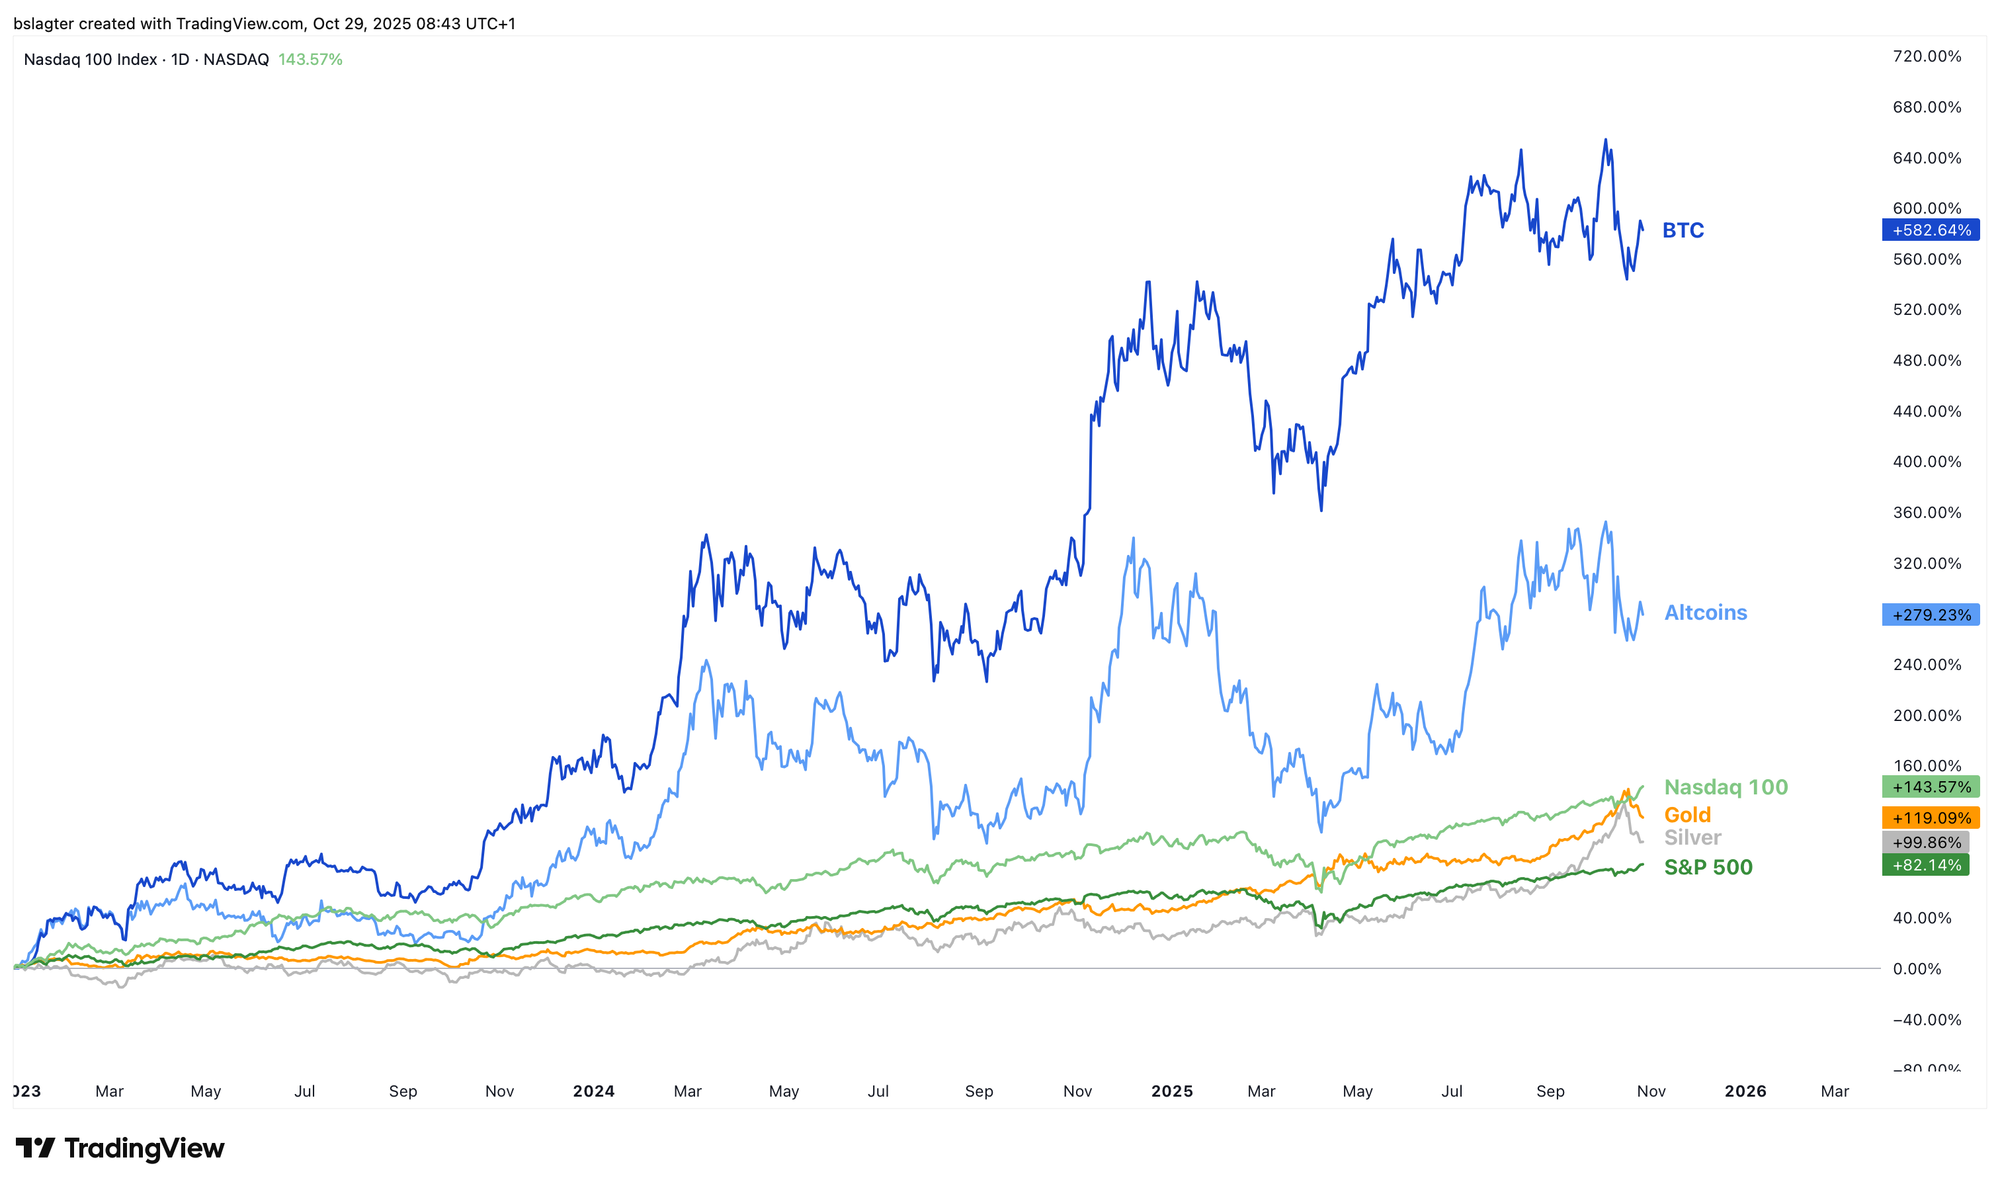
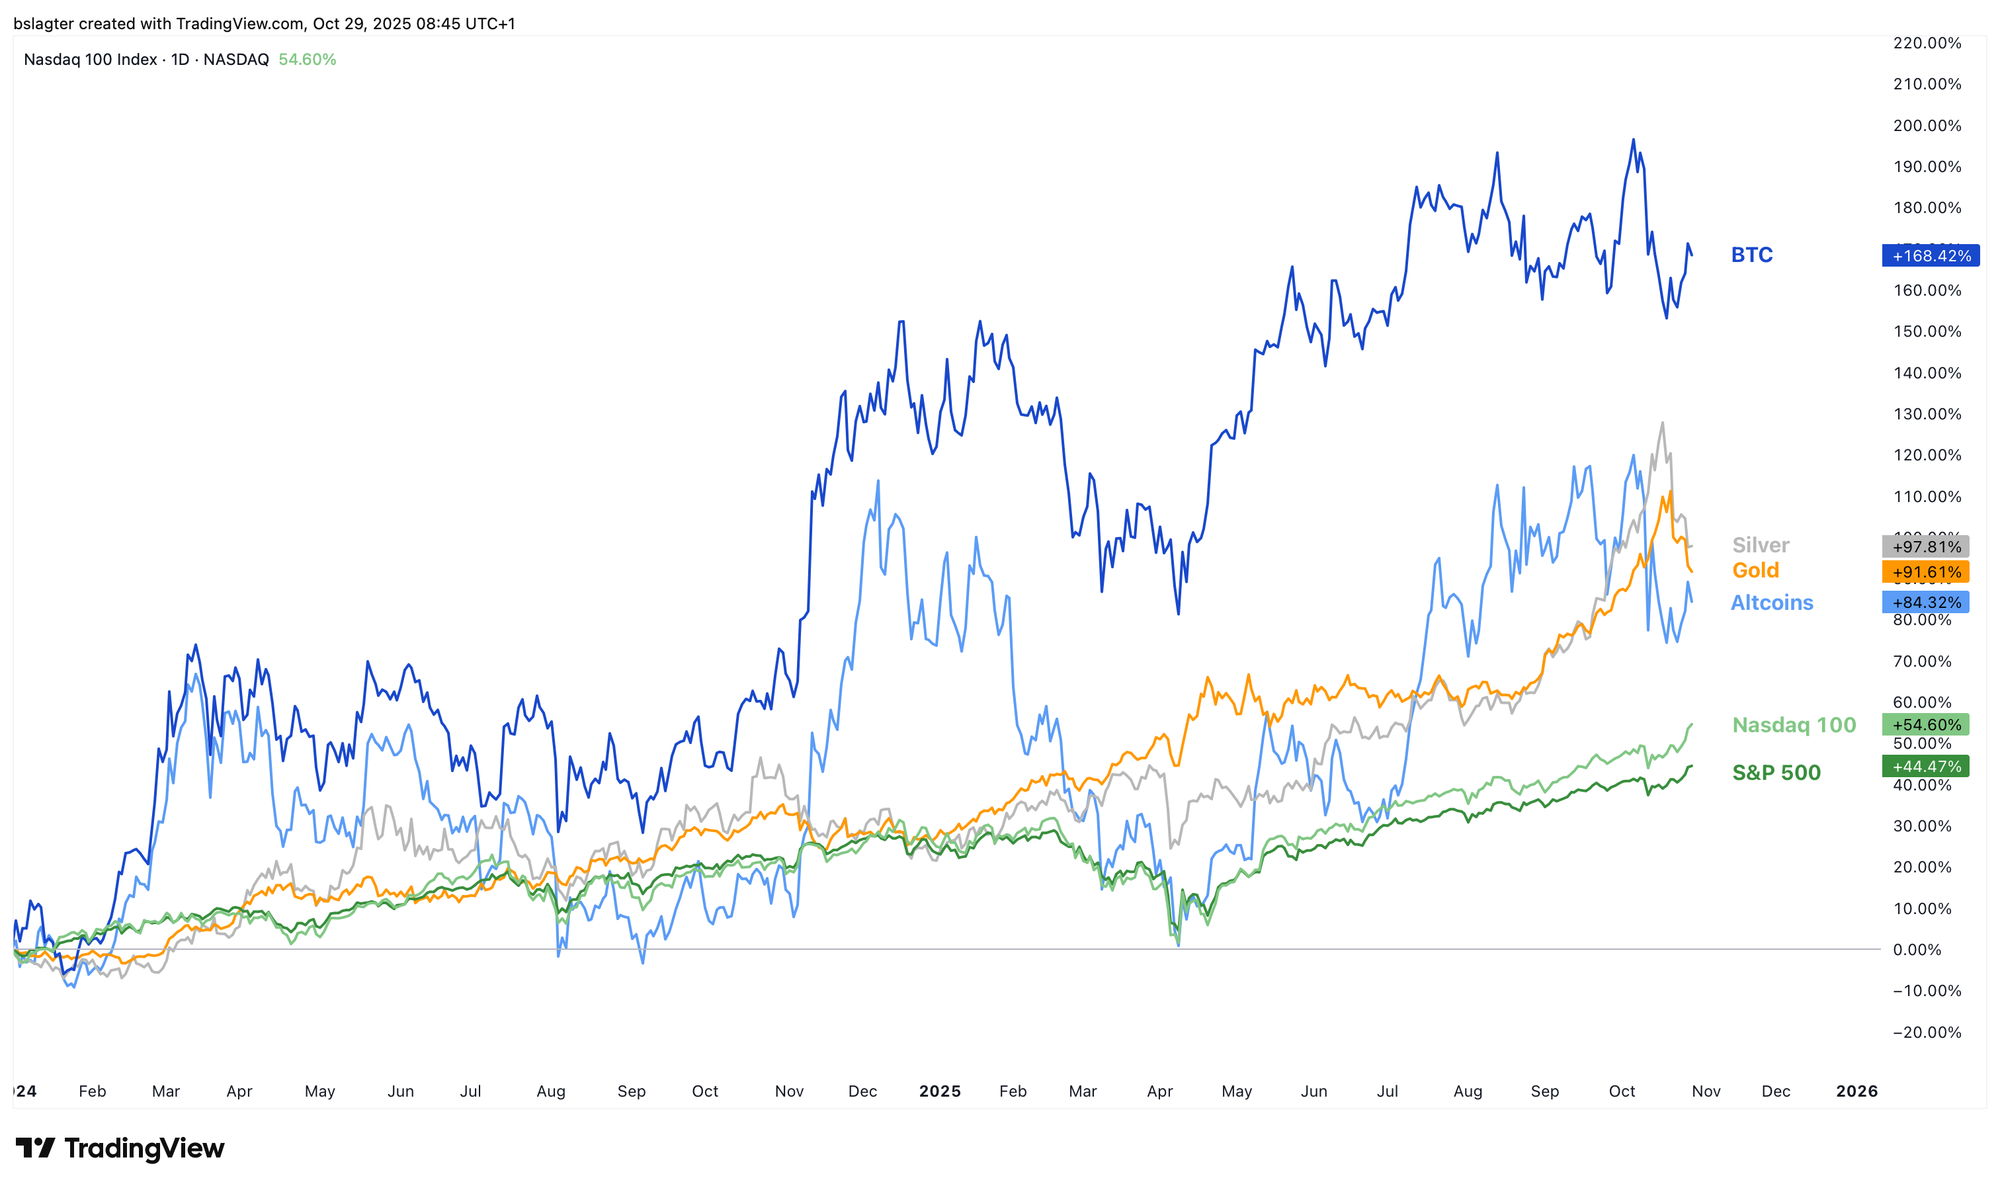
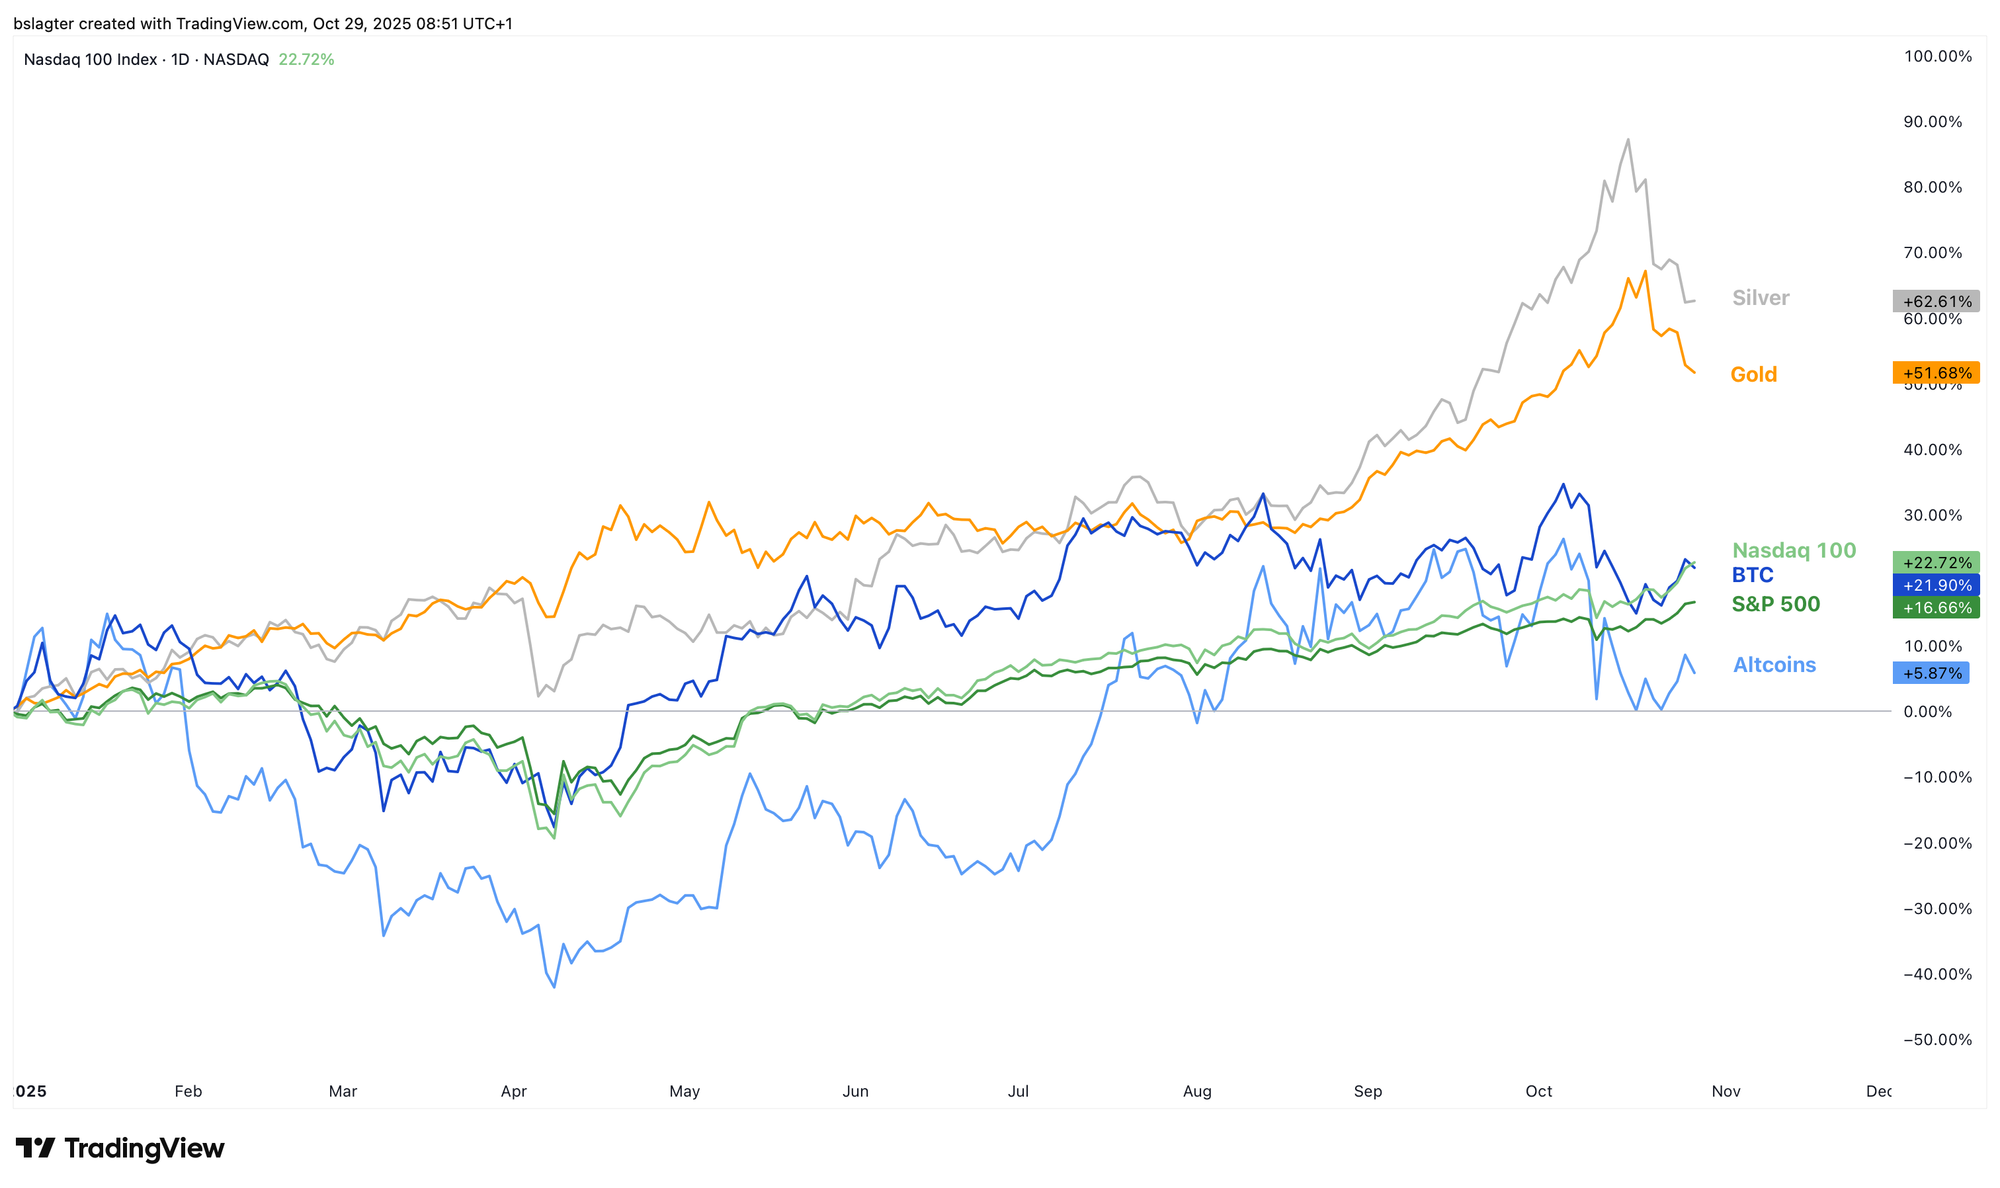
While such an analysis might seem narrow, stepping back to consider the broader picture unveils a different narrative. The charts below compare gold, silver, the Nasdaq-100, the S&P 500, bitcoin, and altcoins. They all start on January 1 of the years 2021, 2022, 2023, 2024, and 2025.
In fact, it is only since January 1, 2025, that bitcoin (or crypto) hasn’t been the top-performing asset—at least up until now.
A valid counterargument is that bitcoin carries higher volatility, thereby consuming a larger portion of your portfolio’s risk budget. For investors who believe this, a smaller allocation makes more sense.
5️⃣ It’s Hard to Be Bearish
Thom
This week was marked by the US central bank’s rate decision, a meeting between Trump and Xi, and quarterly reports from five US tech giants.
So far, all signs point to continued support for bitcoin’s bull market. Following Wednesday’s rate cut, the US central bank is expected to implement another cut in December. Meanwhile, its Quantitative Tightening (QT) policy—shrinking the balance sheet—has come to an end.
The meeting between Trump and Xi unfolded as expected. Trump praised the summit in his characteristic superlatives, calling it a “fantastic” negotiation and rating it a 12 out of 10. With a definitive deal now seeming inevitable, this issue no longer poses a threat to the market.
The quarterly results were mixed. While Google and Amazon posted strong numbers and saw significant gains, Microsoft, Apple, and Meta fell sharply due to disappointing reports. Overall, however, the outcomes exceeded expectations, and I don’t see why this should dampen the AI-driven narrative—a major engine behind the bull market. For example, Meta’s drop was largely due to a one-time tax charge that impacted its profits.
It is simply hard to make a robust case for a bear market when both the US government and the central bank are actively stimulating the economy. As early as 2026, the positive effects of the One Big Beautiful Bill Act (OBBA) should kick in, and with Trump still eyeing midterm electoral gains, the liquidity cycle seems far from exhausted.
Despite the stern tone of the press conference, the market continues to expect several rate cuts from the US central bank. At the same time, corporate borrowing rates are at their lowest in over three years, mortgage rates are dropping, and oil prices remain under significant pressure.
This might be the cycle in which bitcoin breaks free from the confines of the four-year cycle, proving itself as a macro asset driven by global liquidity rather than merely by the halving, as many still assume.
This dynamic might also explain why so many seasoned investors sold their bitcoin in recent weeks. Once the selling pressure from those who believe in the four-year cycle subsides, there is little reason for bitcoin to stumble into a bear market.
That said, risks have undeniably increased. More analysts are voicing mild concerns about the liquidity cycle. Although my main scenario still anticipates another period of strong gains, it wouldn’t be unwise to reduce risk exposure at these levels.
Since the absolute bottom of the last bear market, bitcoin has made significant progress, and to account for the increased risks, I have already taken profits on a small portion of my holdings.
Thank you for reading!
To stay informed about the latest market developments and insights, you can follow our team members on X:
- Bart Mol (@Bart_Mol)
- Peter Slagter (@pesla)
- Bert Slagter (@bslagter)
- Mike Lelieveld (@mlelieveld)
We appreciate your continued support and look forward to bringing you more comprehensive analysis in our next edition.
Until then!