The Emergency Brake
The emergency brake was triggered. Bitcoin closed below the 50-week moving average, signaling the bull market may be over. Yet with $750B in new capital, fundamentals look excellent. The signals are conflicting. So, what now?

This is a special edition of Alpha Markets. Later today, we will also send out the regular edition of Alpha News.
We promised to email you as soon as Bitcoin registered a weekly close below the 50-week moving average. This is a balanced signal to use as an emergency brake.
That happened last night.
On November 29, 2024, we wrote in A Parachute for This Bull Market:
Many of our readers and listeners intend to realize some of their investment gains this market cycle. Right now, it's just a number in an app, but soon it could be a major home renovation, working one less day a week, a dream vacation, or horseback riding lessons for your daughter.
To do that, you need to make a plan now, while the market still has both feet on the ground. That becomes difficult in the final phase of a parabolic bull run. The market gets overheated, and excitement and hype are in the air. Try making level-headed choices then. Experience shows that around the top, almost no one believes it's the top.
In your plan, you write down the conditions under which you will sell. We often see people use price targets, dates, or indicators for this. We will delve into this extensively next week.
But what if the price never reaches your targets? Or if your chosen indicators never rise to the set threshold? What if this bull market unfolds very differently than you expected? Suppose it comes to an abrupt end due to a war, a deep recession, a major hack or fraud, or a technical failure?
That's when you need a parachute. Some call it a panic button, an alarm signal, or an emergency brake. Whatever you call it – the goal is to prevent you from riding all the way down in the next bear market (again?). Think of it as a profit protector.
“What if this bull market unfolds very differently than you expected?” — well, in my opinion, that certainly applies. We haven't seen a 'parabolic bull run' (yet), and aside from a few brief moments, there has been no real 'excitement and hype.'
That’s not because there's no interest in Bitcoin. Quite the opposite.
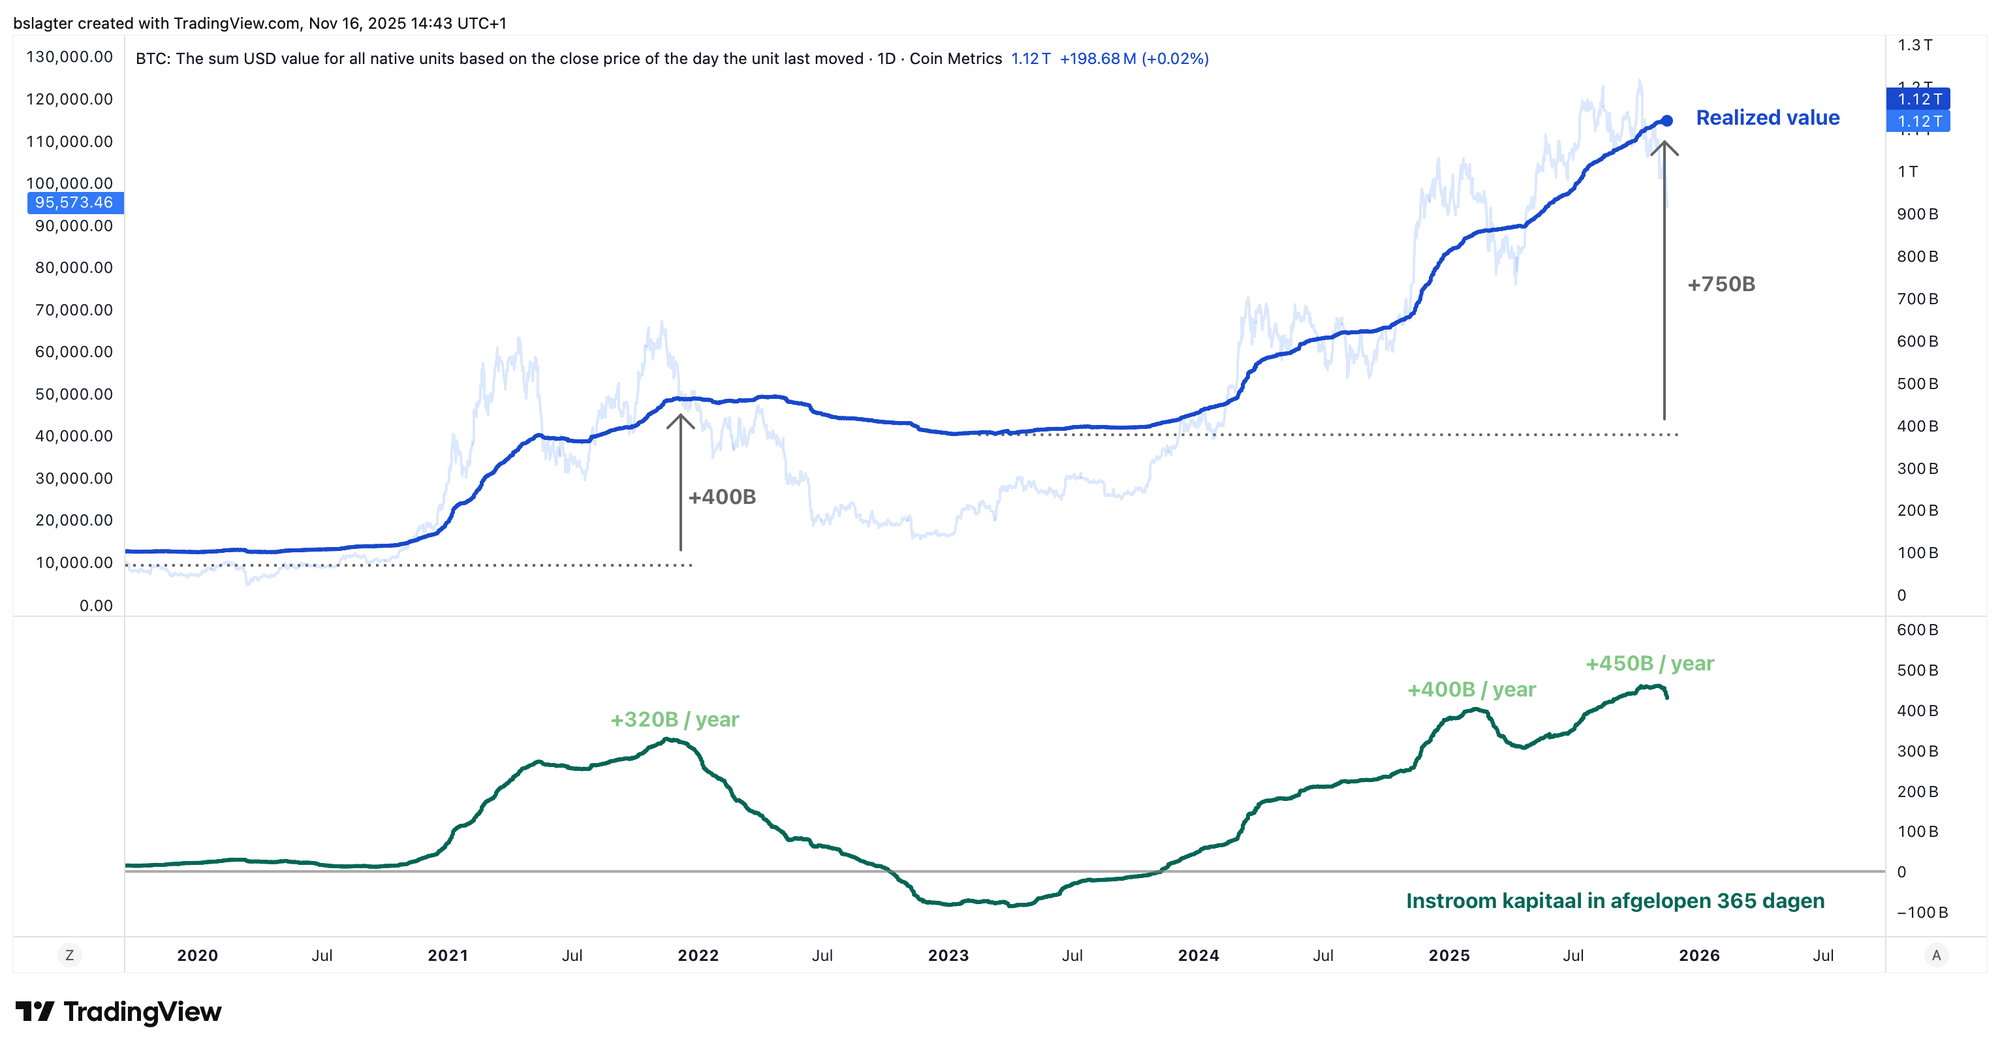
In this bull market, $750 billion of new capital has entered the Bitcoin market. That's almost twice as much as all previous bull markets combined. Based on the realized value, we get this list:
- Capital inflow into Bitcoin since its inception: $1,120 billion
- Capital inflow this bull market: $750 billion
- Capital inflow over the past 12 months: $450 billion
In chart form, it looks like this.
Paradoxically, this overwhelming interest from new investors is also why the price has been stuck in the $100k to $120k zone.
Jordi Visser compared it to an IPO in this article. After years of hodling, there is finally enough liquidity for early investors to cash in some of their stacked bitcoin. The great rotation, as we called it.
This presents us with a difficult combination:
- Fundamentally, things look excellent for Bitcoin.
- The emergency brake was triggered last night.
So, what now?
First, let's talk about that emergency brake. There's no such thing as "the emergency brake." There's only the idea or concept of one: a signal you use to sell (a portion of) your portfolio.
Last year, we suggested "a weekly close below the 50-week moving average." That average is the dominant average on the weekly chart and has historically been a reliable dividing line between bull and bear markets.
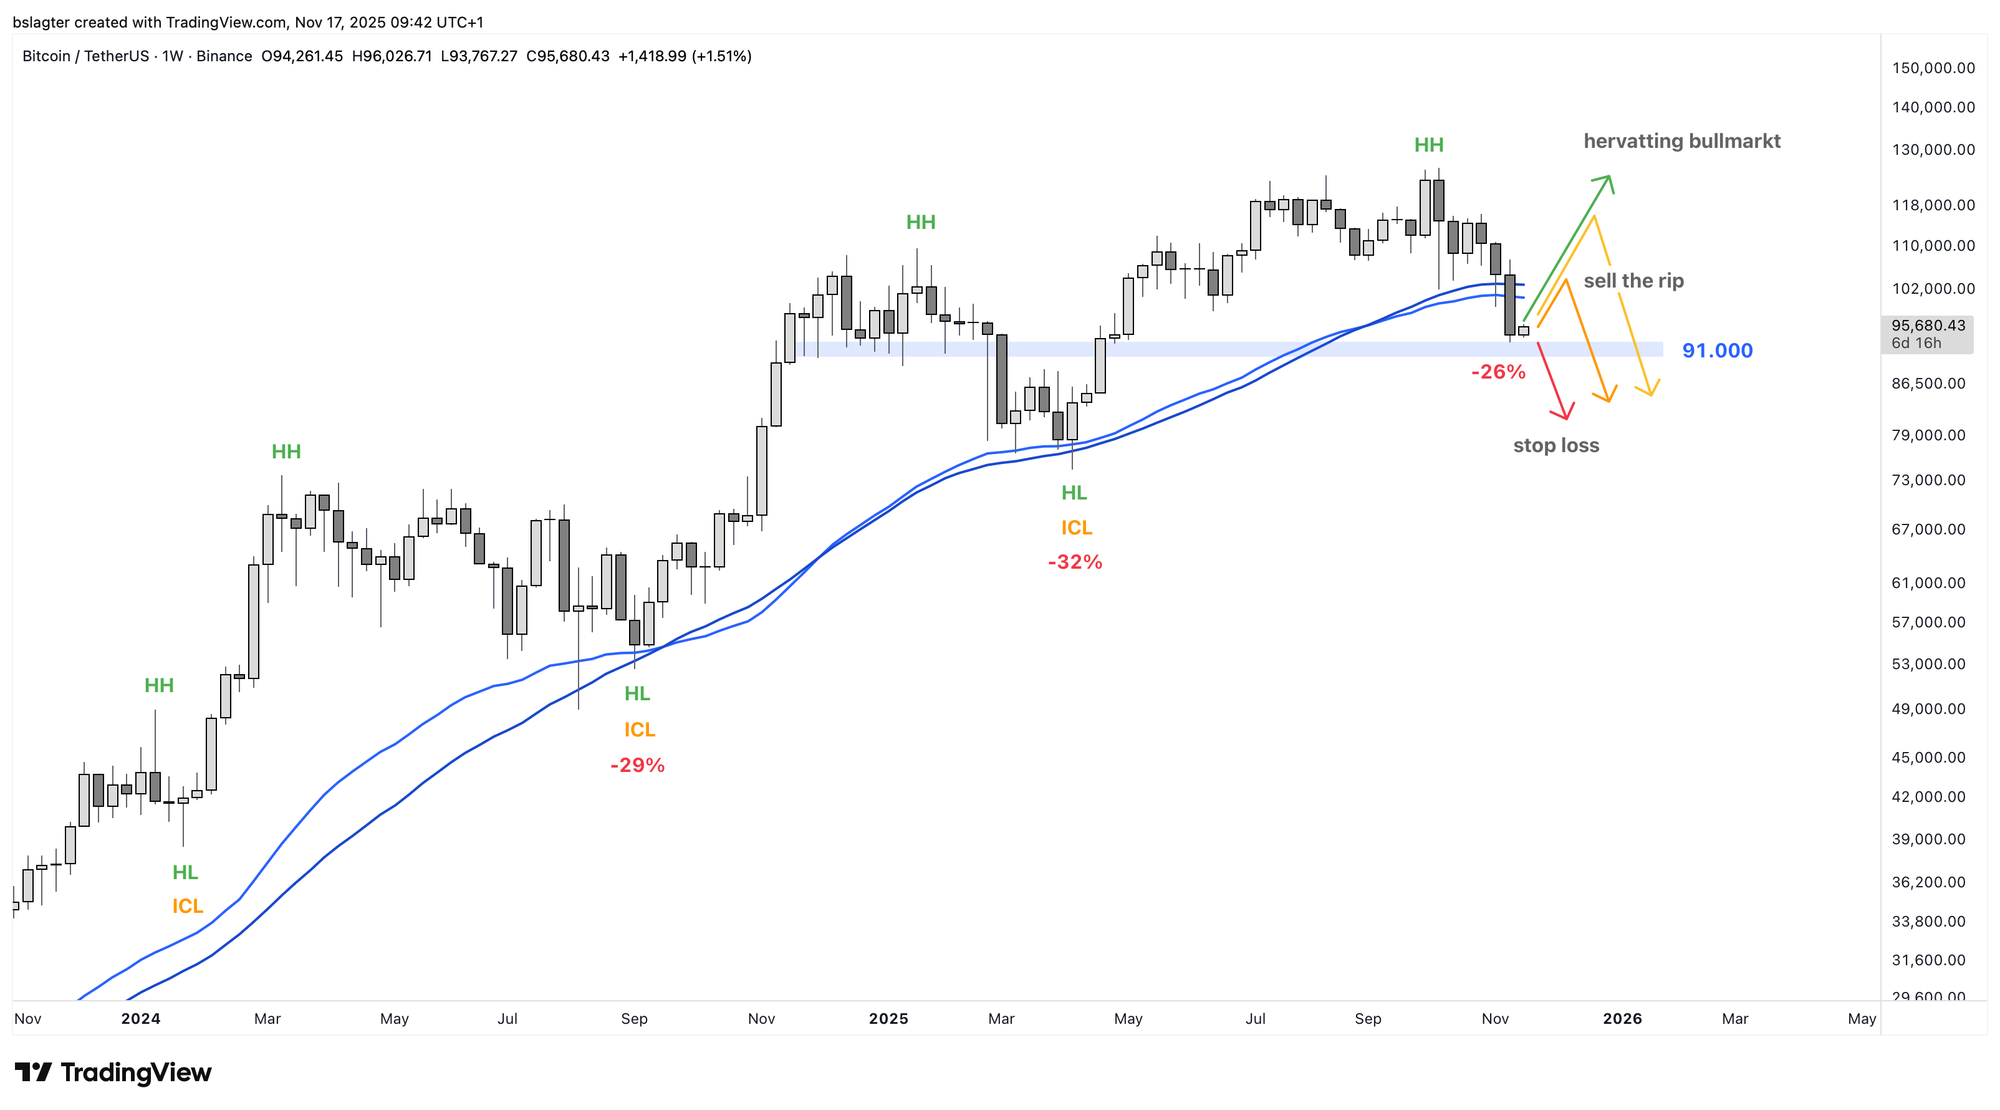
Last night, Bitcoin closed the week at $94,300, which is undoubtedly below the 50-week moving average (both SMA and EMA). On a chart, it looks like this.
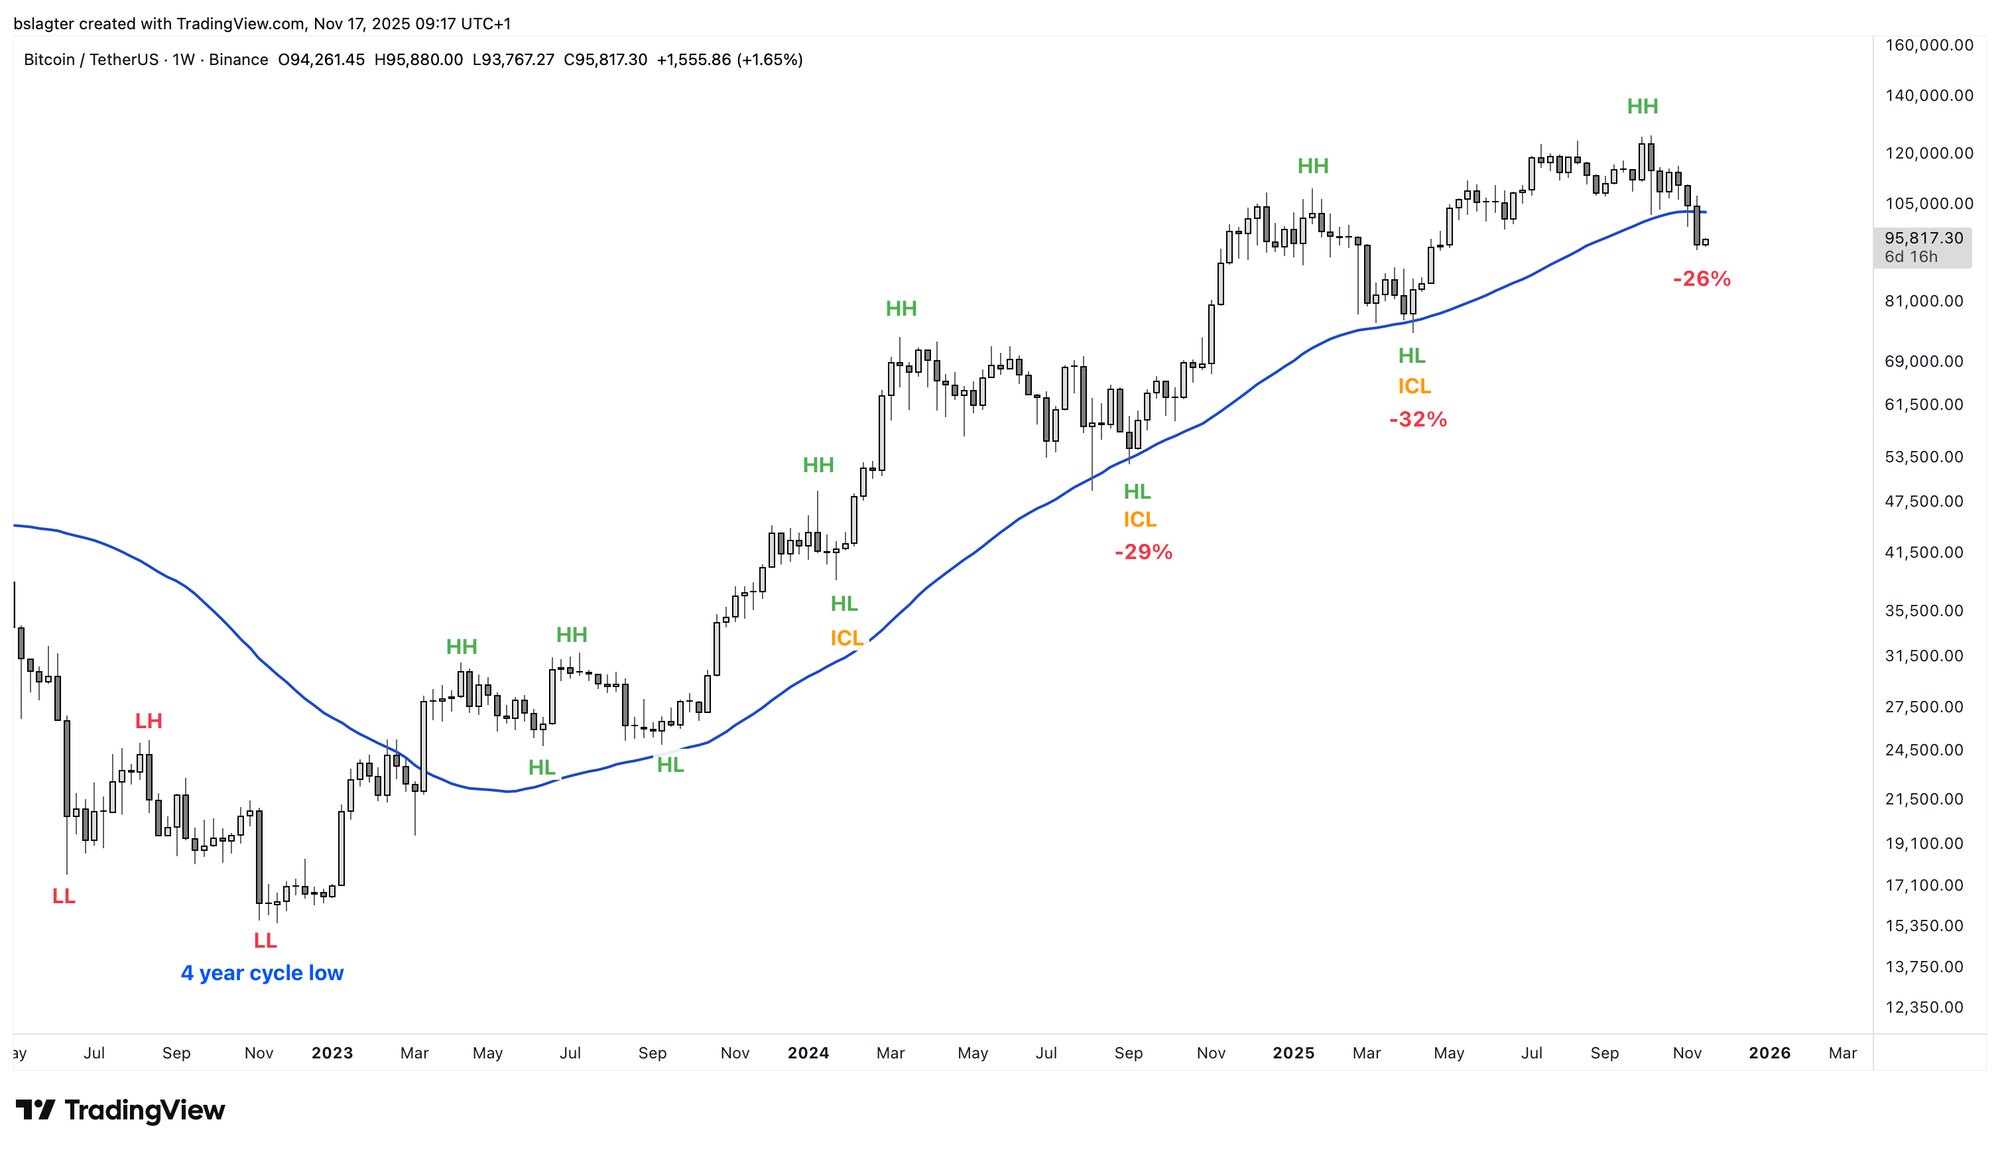
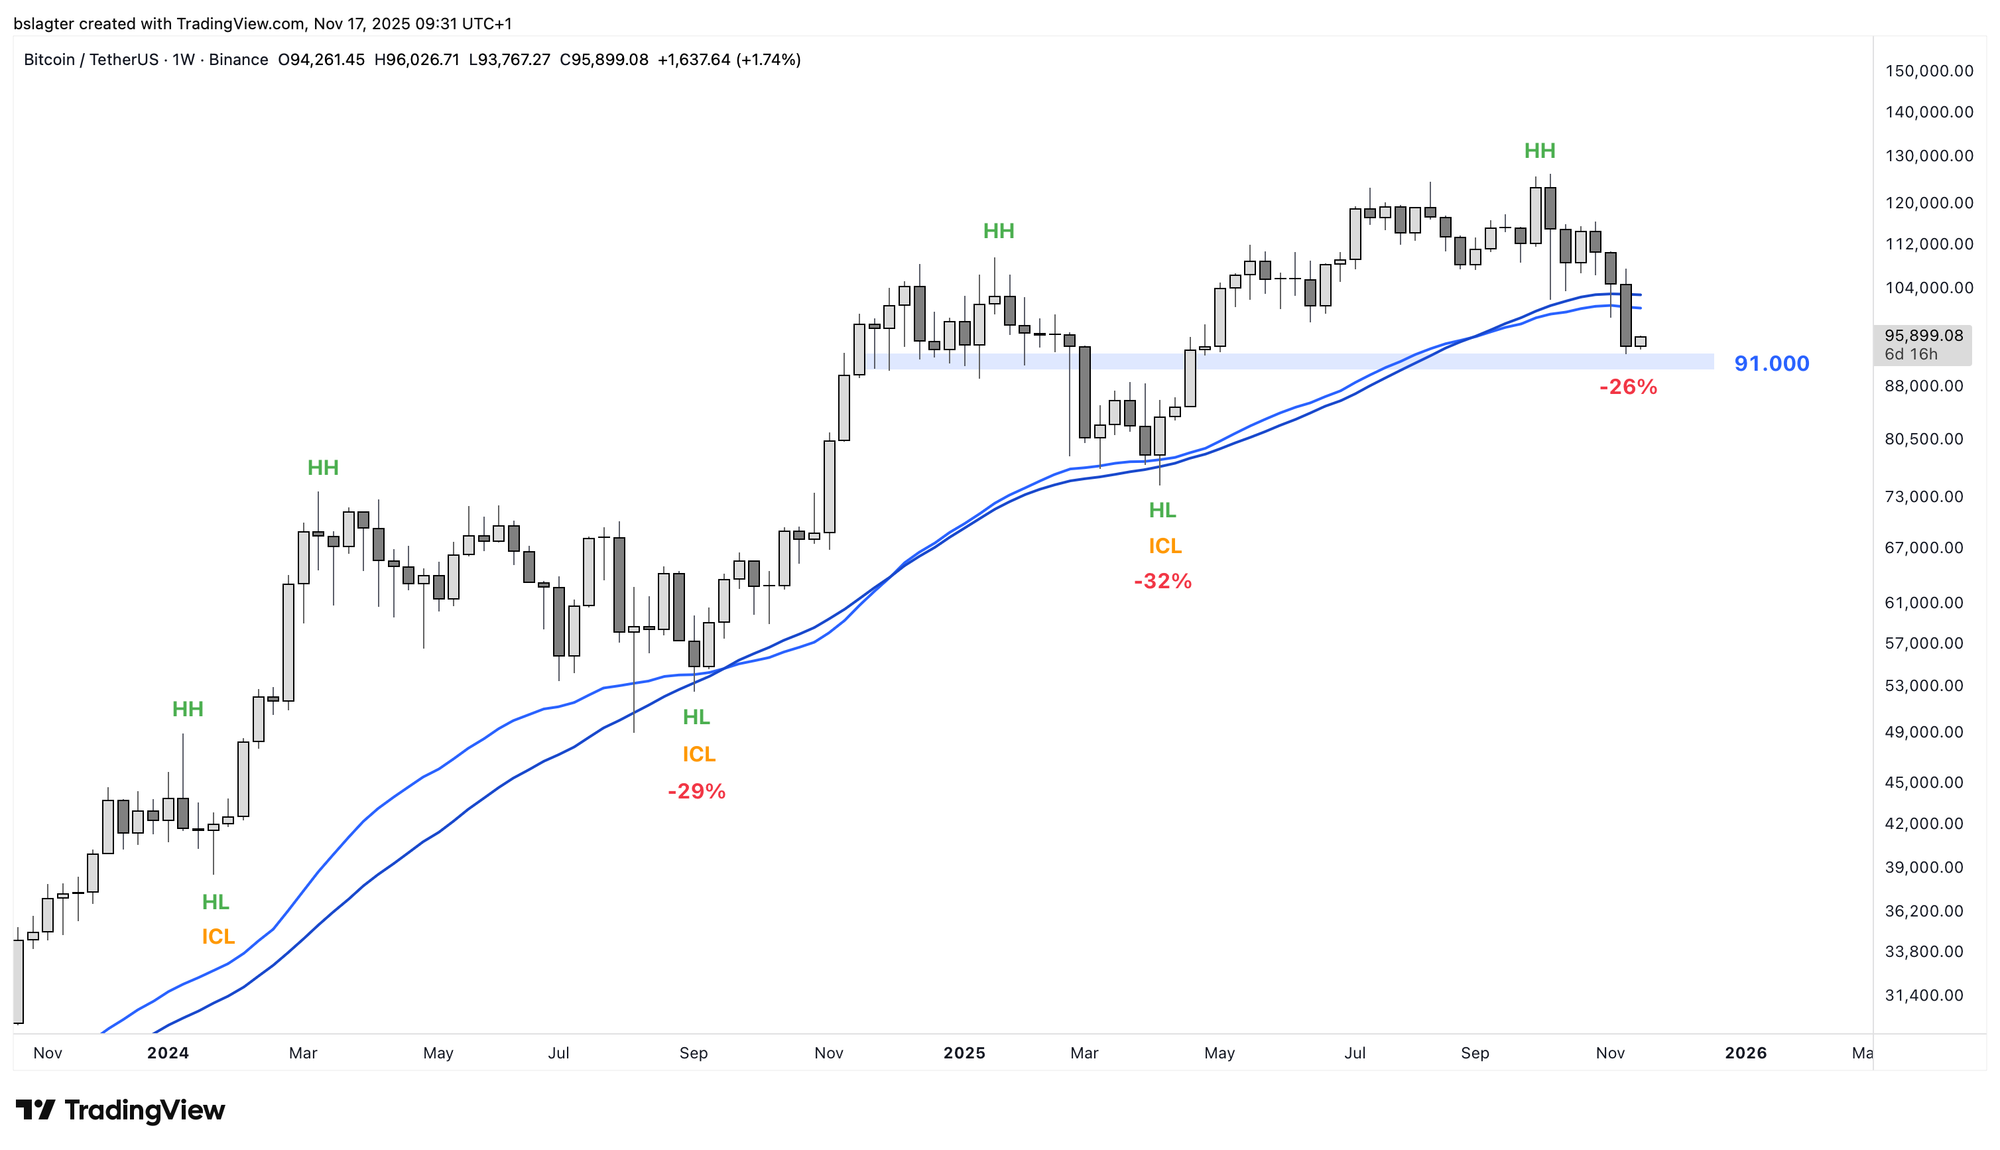
Looking closer, we see the zone around $91,000, which acted as support in November, December, January, and late April.
With a weekly close below the 50-week moving average, the probability that the uptrend on the weekly chart is over has increased. This probability isn't 100%, as no single average is infallible.
We are now using this distribution:
- 30% chance of a swift continuation of the bull market (meaning a false signal from the 50-week moving average)
- 70% chance of the end of the bull market
We assign a relatively heavy weighting of 30% to a false signal for two reasons. First, the macroeconomic conditions do not point to a deep bear market. Second, practically everyone is watching this moving average now, which increases the chance that it won't work as expected. In previous years, you never heard anyone talk about it; now, it's consensus.
From now on, our base case is that the bull market is over. We often say, "we are in a bull market until proven otherwise." This mindset helped us correctly remain bullish in September 2024 and April 2025. Now, the contrary has been proven.
The end of the bull market doesn't automatically and inevitably mean we'll plunge into a deep, long bear market. In last Friday's Alpha Markets, we described how the end of an uptrend on the weekly chart could play out:
- “A sideways period” — Six months without a clear trend on the weekly chart. Chopsolidation, a correction-through-time.
- “A mild bear market” — A slow downtrend on the weekly chart, down to -60% from the top.
- “A deep bear market” — A turbulent downtrend on the weekly chart, down to -80% from the top.
In mature markets, like stocks from major economies, you also regularly see that the decline to the yearly cycle low doesn't look like a bear market, but rather a longer correction or consolidation. It's more about rhythm than depth.
Here's a quick recap of the probability distribution, quoted from Friday's Alpha:
With a weekly close below the 50-week moving average, we increase [the probability of the start of a bear market] to 70%. That leaves a 30% chance for a resumption of the bull market.
We would then distribute 100 points as follows:
Resumption of the bull market: 30%
A sideways period: 40%
A mild bear market: 20%
A deep bear market: 10%
This is a very different picture than in the spring of 2022, the last time the price dropped below the 50-week moving average.
Back then, we had just come out of a period of euphoria and hype. Almost everyone expected higher prices. The MVRV had risen to nearly 4, meaning the average investor was sitting on a 300% profit. And macroeconomically, the brakes were just being applied, with a series of aggressive interest rate hikes to combat a massive wave of inflation.
In short:
- The 50/52/55-week moving average (SMA or EMA) is being watched by virtually everyone, which could undermine its effectiveness. A monthly close below the 20-month moving average could be an alternative (currently at $88k).
- The circumstances are completely different from 2022, the last time the price fell below the 50-week moving average. From a fundamental and macroeconomic perspective, there's less reason to expect a deep bear market now.
- However, it is a dominant moving average and has been a good dividing line between bull and bear markets in the past.
So what should you do with these conflicting signals?
- Option 1. You stick to your plan and sell a portion of your position now. You accept that you might have to buy back at a higher price if the bull market continues, and we later see a weekly close back above the 50-week moving average.
- Option 2. You require more confirmation, for example, a second weekly close below the 50-week moving average on November 24, or a monthly close below the 20-month moving average on December 1. This means you're sailing less close to the wind, but you risk the price falling further in the coming days and weeks.
- Option 3. You decide to hodl, no matter what. Arguments for this could be the macroeconomic conditions, interest from a new group of investors, the price not being high enough to be life-changing, or the expectation that any bear market from here won't be deep.
There is no right answer; there is only the trade-off that each investor must make for themselves.
Personally, this is how I'm approaching it:
With my core portfolio, I have (already) chosen option 3. I already took profits this spring to pay for my move and home renovation. The rest of this portfolio is intended for the long term. If I hadn't sold anything yet this year, I would have now chosen option 1 for a portion of it and pulled the emergency brake.
With my flexible portfolio, I am choosing option 2 and waiting for the monthly close on December 1. By doing this, I'm 'buying' two opportunities: the chance for more information and the chance for a better exit price.
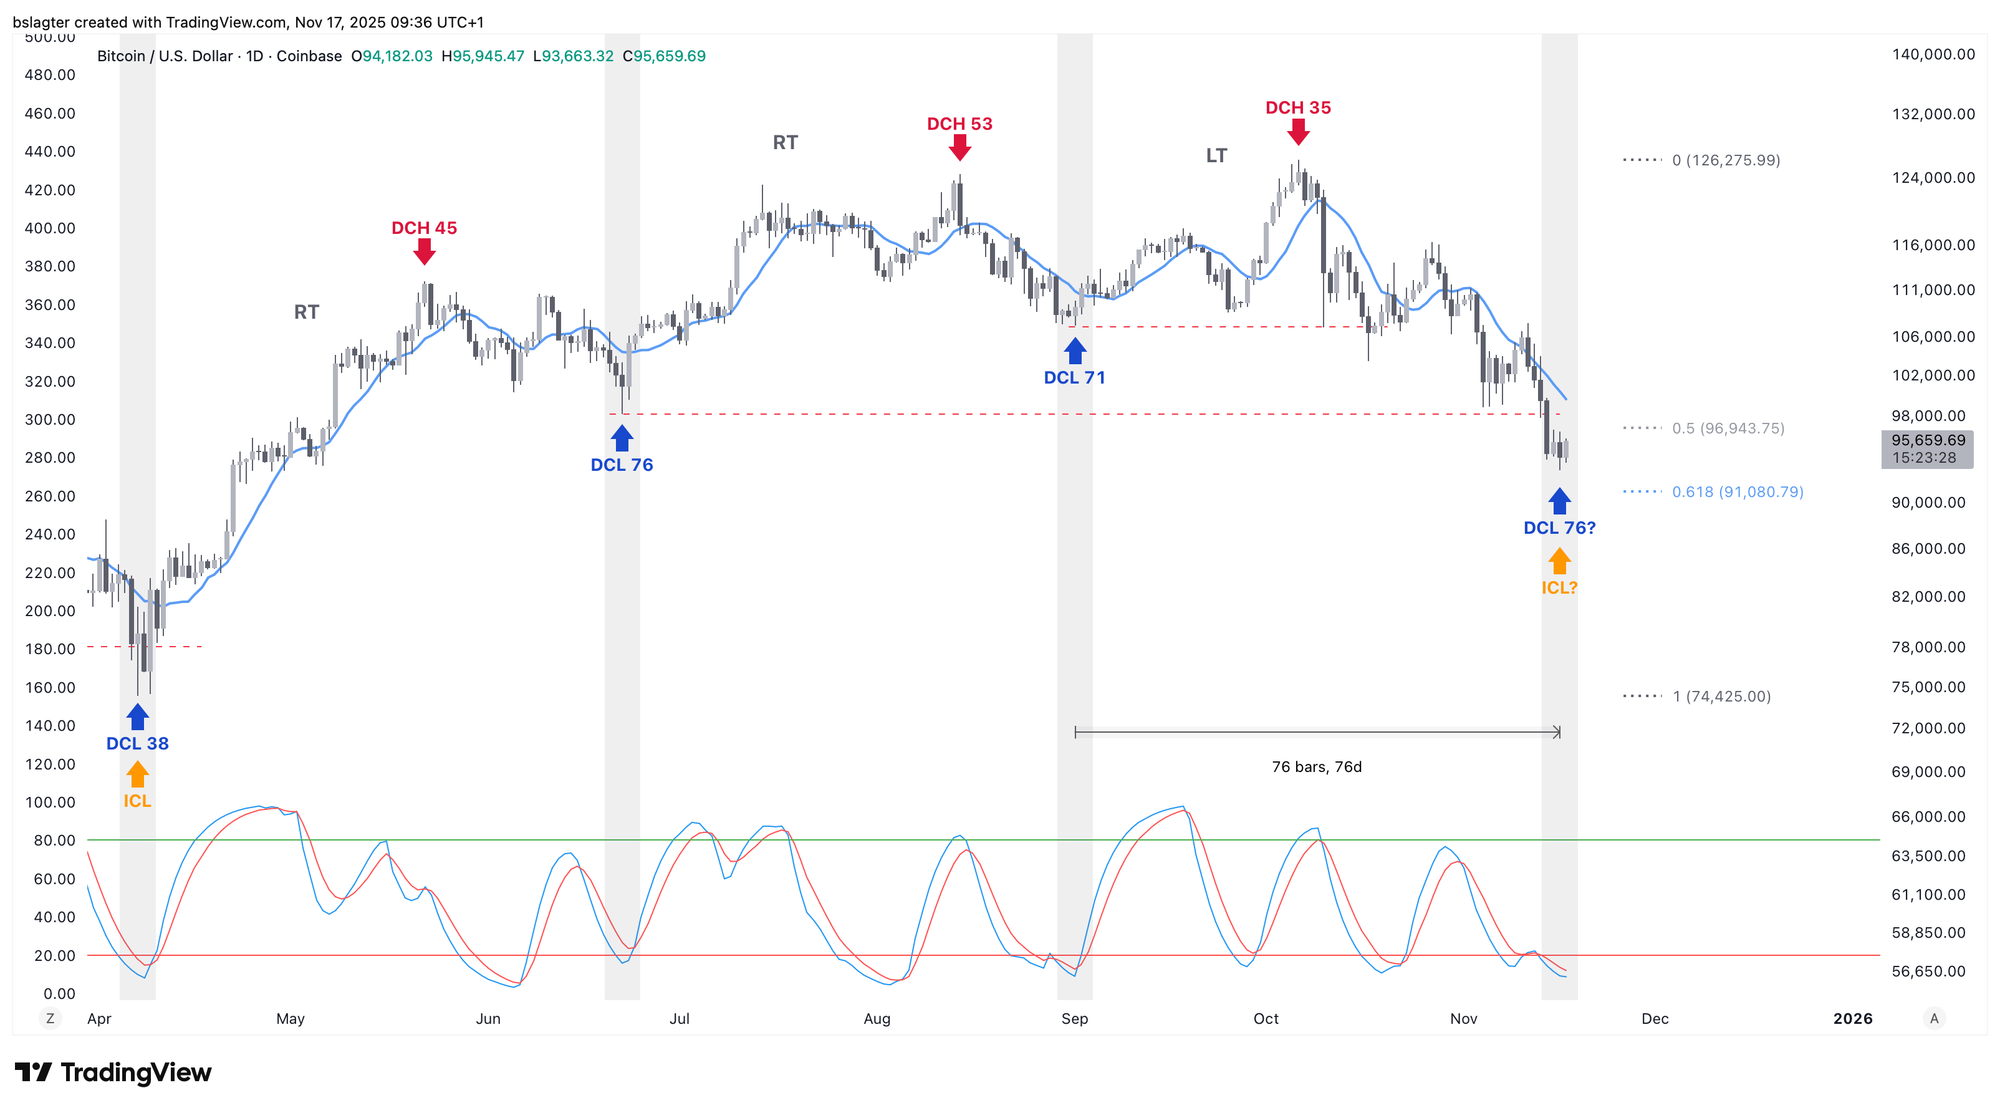
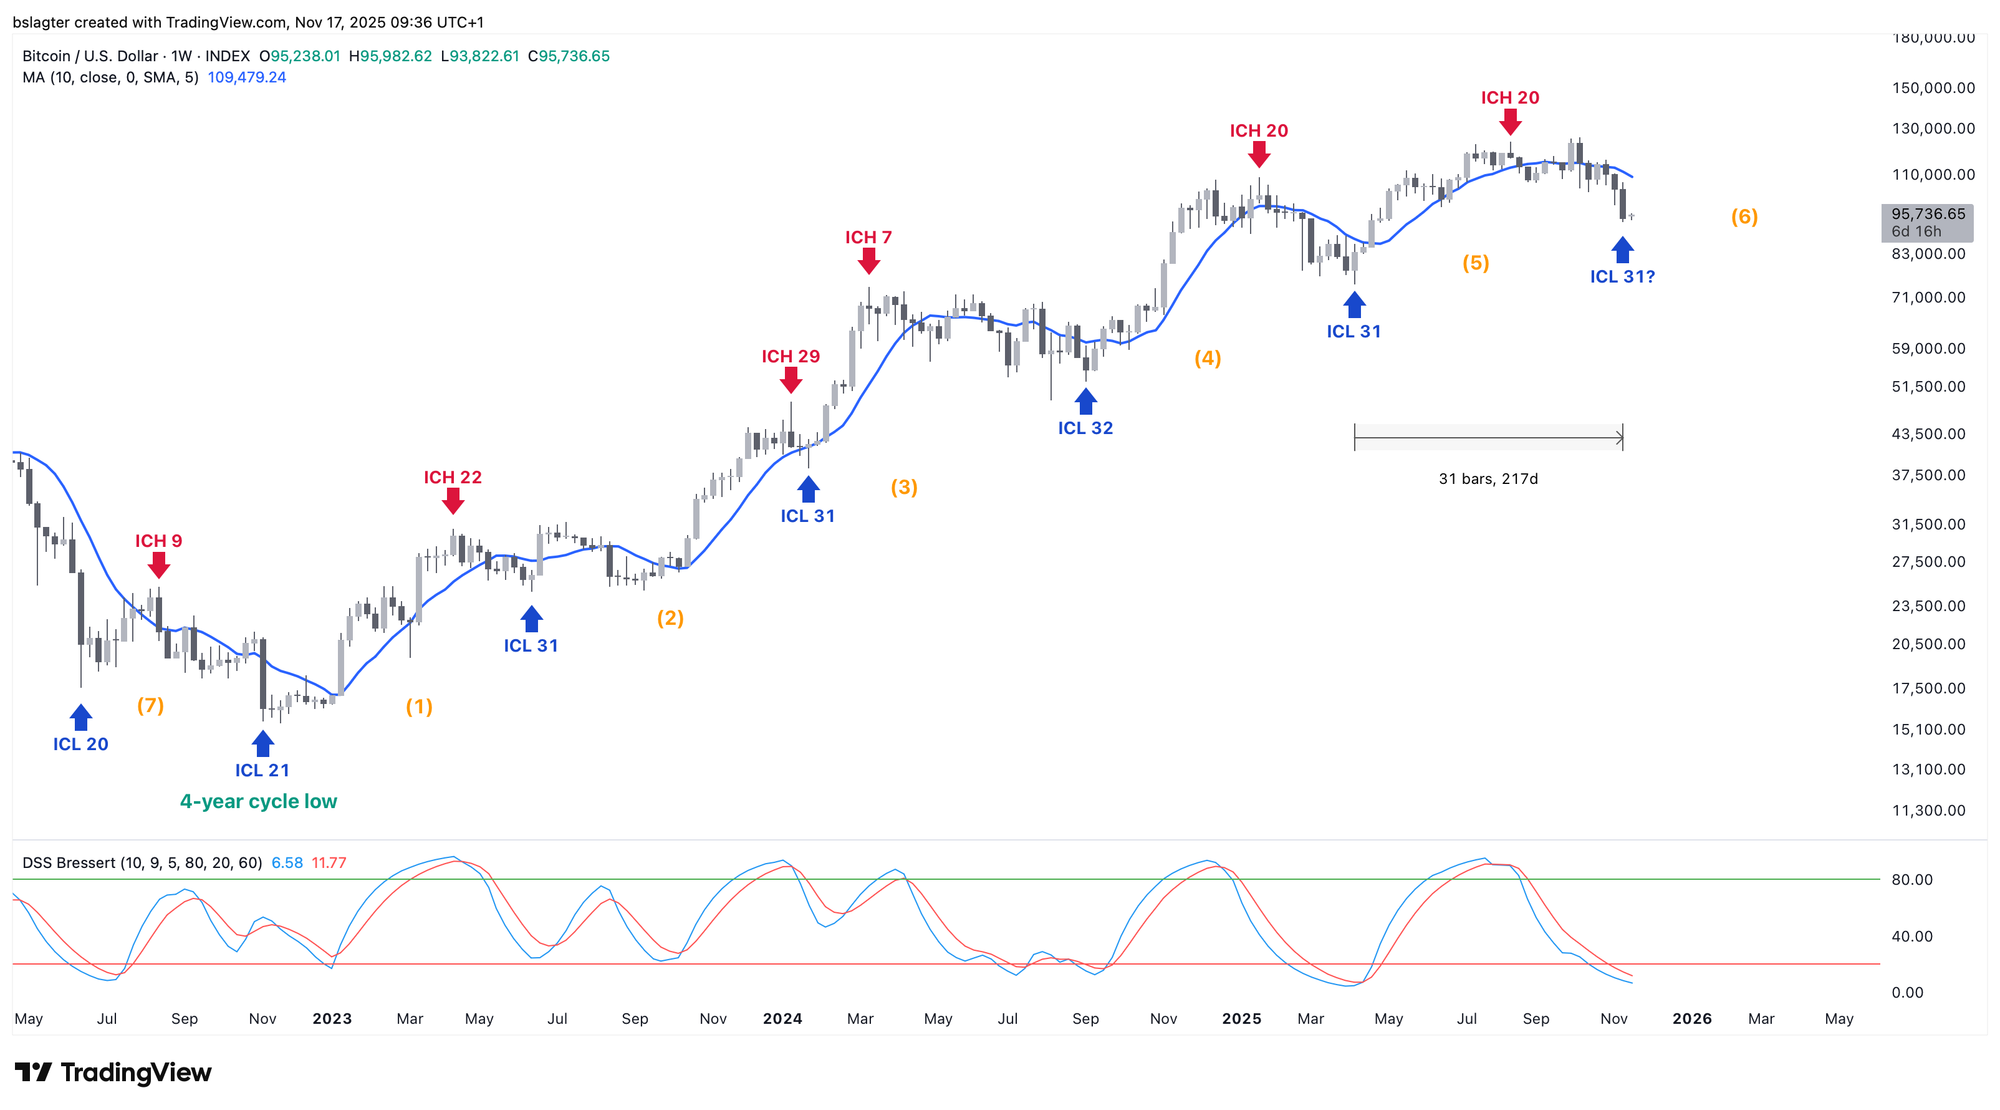
Let's first talk about the chance for more information. It's quite possible that we are around the daily cycle low (DCL) and weekly cycle low (ICL). In terms of timing and oscillators, this would fit the rhythm of the past year and a half.
Here is the daily cycle chart. A weekly cycle often ends with a left-translated (LT) final daily cycle. The correction has reached the intersection between the 50% and 61.8% retracement levels of this weekly cycle.
Here is the weekly cycle chart. It's now as long as the average for this yearly cycle. The oscillator at the bottom is more than low enough.
If that's correct, we'll see a rally from the DCL/ICL in the coming weeks. That rally would give us new information:
- If we rally to a new all-time high, the bull market is intact, and the weekly close below the dominant average was a false signal.
- If we rally to a peak lower than the all-time high, it would be the first lower high (LH) on the weekly chart since 2022. That would confirm the end of the uptrend on the weekly chart (= cyclical bull market).
That would also provide a better exit price. Even if we don't get a new all-time high and a lower top confirms the end of the bull market, it would likely be a better 'exit' than selling now at $94,000.
In a bull market, you 'buy the dip,' and in a bear market, you 'sell the rip':
- If (in a bull market) the price has risen quickly in a short period, don't buy out of FOMO; wait for a correction: buy the dip.
- If (in a bear market) the price has fallen quickly in a short period, don't sell in a panic; wait for a relief rally: sell the rip.
It could look something like this:
That's why I'm holding off with the flexible part of my portfolio and keeping my options open for now.
If the situation changes and a deep bear market becomes more probable, I can still exit. After all, getting out at $80,000 to avoid a drop to $25,000 (-80%) or $37,500 (-70%) is still an excellent deal.
In summary:
Resumption of the bull market: 30%
A sideways period: 40%
A mild bear market: 20%
A deep bear market: 10%
And so, the base case from now on is that the bull market is over. We no longer expect higher highs and higher lows on the weekly chart, but either a sideways period or lower highs and lower lows.
If it turns out we've been faked out by the weekly trend and the bull market does resume, we will revise our base case.
We wish you wisdom in navigating these markets. And if you have any questions, you're welcome to join us in the market channel on Discord.
Thank you for reading!
To stay informed about the latest market developments and insights, you can follow our team members on X:
- Bart Mol (@Bart_Mol)
- Peter Slagter (@pesla)
- Bert Slagter (@bslagter)
- Mike Lelieveld (@mlelieveld)
We appreciate your continued support and look forward to bringing you more comprehensive analysis in our next edition.
Until then!