One Big Beautiful Bull Market
Trump’s “One Big Beautiful Bill Act” marks a bold pivot—ditching strict cuts for explosive economic growth. With national debt at 125% of GDP, is the US betting on tech revolutions and a bull market to defy fiscal odds? Markets surge as policies shift.

Last Tuesday, the Senate approved the 940-page American budget act by a vote of 51 to 50, boasting the Trumpian title “One Big Beautiful Bill Act.” Yesterday, the House of Representatives gave it the green light. The act is now in effect, and Trump is eager to celebrate it on Fourth of July, the national holiday commemorating American independence.
This law showcases the new strategy of the Trump administration. It marks a dramatic turnaround—from a very strict fiscal policy in January to a very expansive approach in July—while still aiming to rein in the national debt.
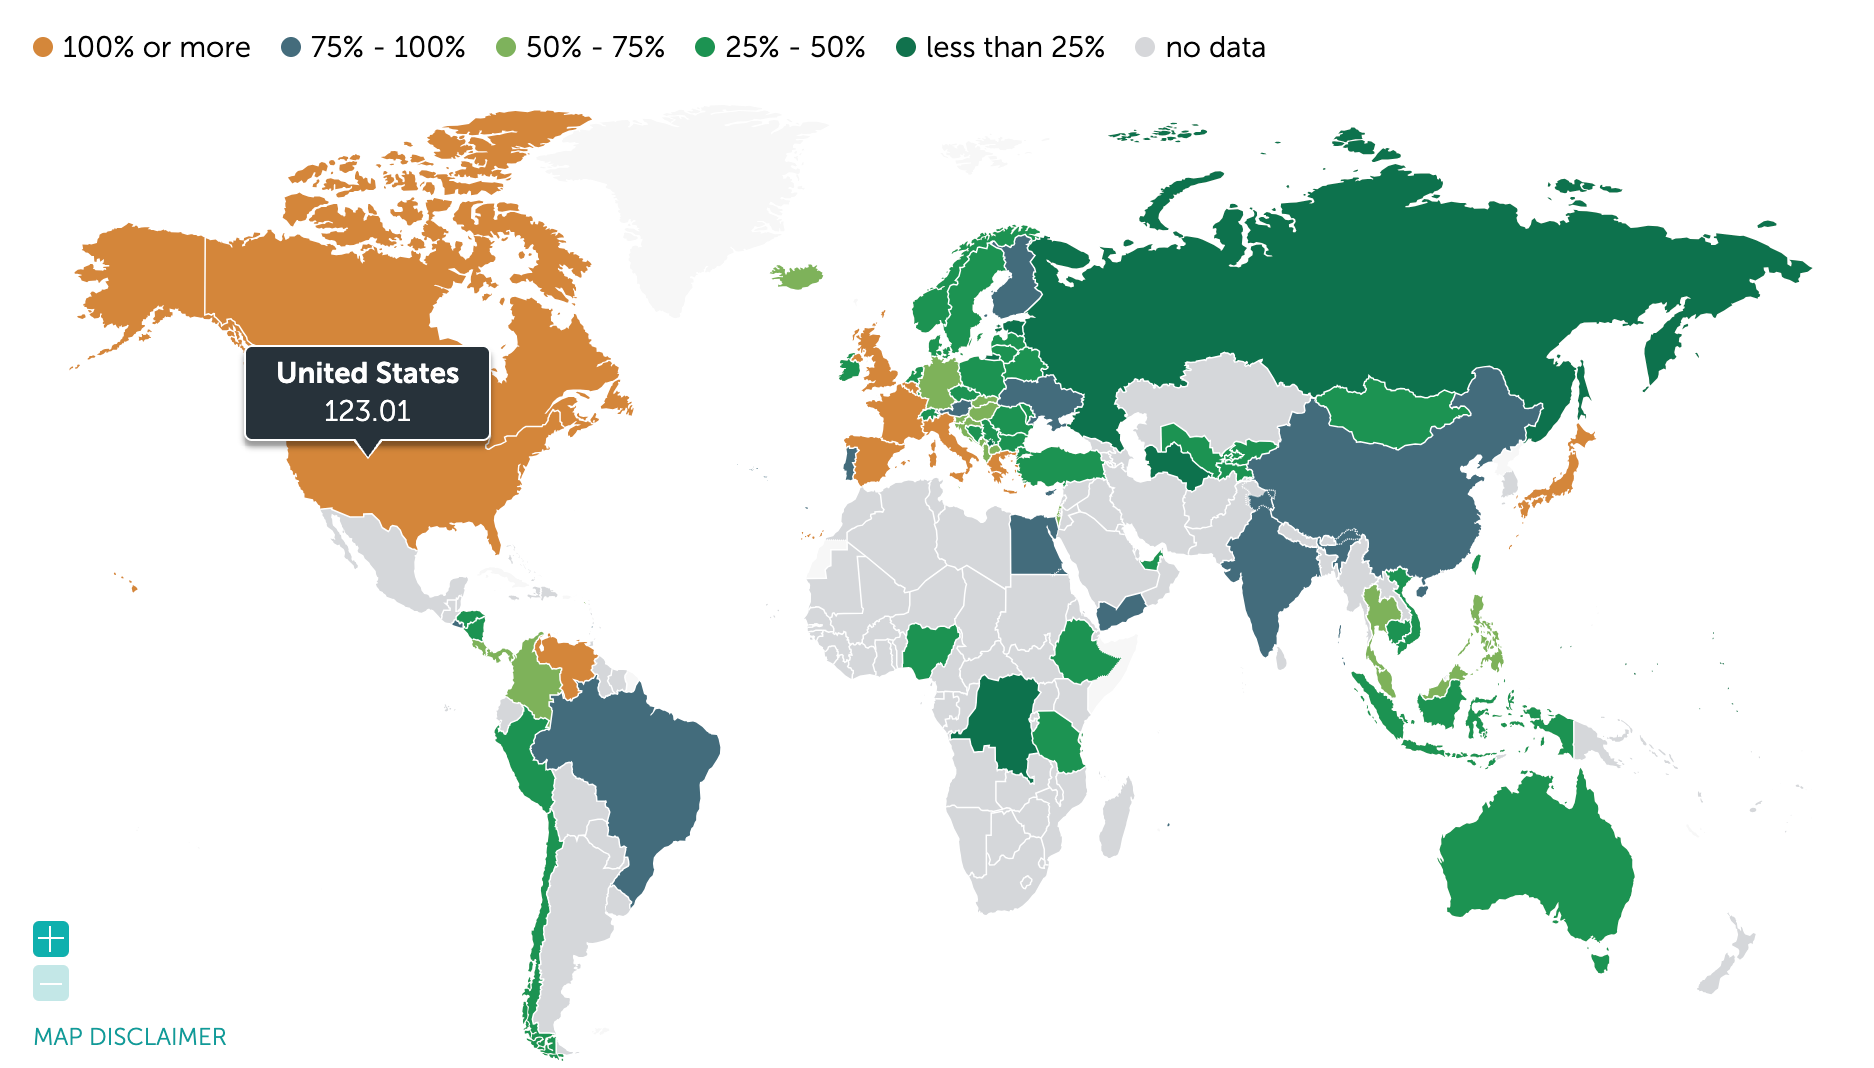
Governments typically express their national debt using the debt-to-GDP ratio, which makes it easier to compare the debts of different countries. After all, a larger economy can sustain or repay a larger debt.
In the United States, the national debt stands at around 125% of GDP, which is quite high. When you factor in the significant budget deficit projected for the coming years, you end up with an “unsustainable debt trajectory.” Both allies and opponents agree on that point, even if they differ greatly on how to steer clear of it.
Trump’s original strategy was to reduce the national debt by boosting revenue and cutting spending. However, that approach failed to gain traction—officials blamed resistance from Democrats and the bureaucracy, though the reality is less straightforward.
Once the debt reaches levels well over 100%, reducing it becomes extremely difficult. Almost every measure that seems beneficial at first glance ends up having an adverse effect through the back door, whether it’s extra spending on higher benefits or reduced revenue from lower taxes. “Nothing stops this train,” says Lyn Alden.
Trump has now shifted tactics regarding the debt-to-GDP ratio. If the debt cannot be lowered, then the size of the economy must increase. His plan banks on tremendous economic growth—a productivity revolution. AI, robots, self-driving cars, and crypto networks— all the exponential technologies mentioned in the Big Ideas reports by ARK Invest—are featured.
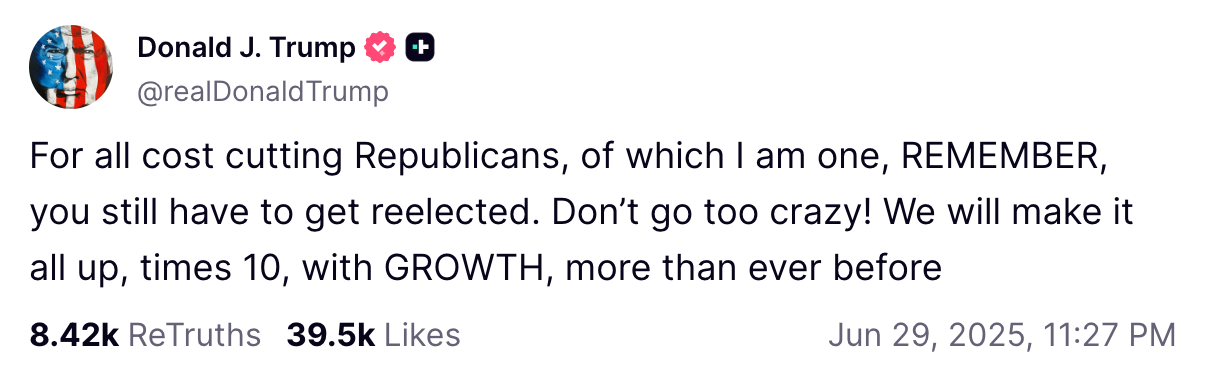
This week, Trump made that explicit on Truth Social:
At the height of the euro crisis in 2012 and 2013, Jean-Claude Juncker was both the Prime Minister of Luxembourg and the chairman of the Eurogroup. He reiterated a refrain he had expressed many times in his career: “We all know what to do, we just don’t know how to get re-elected after we’ve done it.”
A year later, Juncker became President of the European Commission.
Trump’s message begins with a similar observation. While cutting costs might be the prudent thing to do, it’s politically challenging because it can hurt re-election prospects. Instead, he argues that economic growth can make up for it by shifting the focus from ‘debt’ to ‘GDP’.
This is a tried-and-true method for reducing the national debt: stimulate economic growth while keeping interest rates low. For borrowers, a slight increase in inflation can even be beneficial—a concept known as financial repression.
The cost is ultimately borne by holders of government bonds, such as pension funds and savers. Although you do earn interest, it’s typically lower than the inflation rate—and certainly lower than the rate of economic growth. In real terms, the interest rate is negative, eroding the purchasing power of your savings.
In response, investors are on the hunt for higher returns. The Dutch central bank (DNB) described this phenomenon well in a 2021 report, which we then summarized as follows—a useful reminder:
- Due to persistently low interest rates and an expansive monetary policy, households, businesses, and institutions are in search of yield and are taking on increasing risks.
- As a result, stocks are overvalued, the housing market is overheated, and risky bonds are becoming increasingly difficult to distinguish from safe ones.
We are once again facing such a scenario.
The current situation differs somewhat from that in 2021. Back then, the bubble was fueled by years of expansive monetary policies—such as negative interest rates and aggressive bond-buying programs. That exact approach may not return, and that’s acceptable. Previously, the emphasis was on monetary policy; now, the focus has shifted to fiscal policy.
It’s not just in America that the government plans to stimulate the economy with large budget deficits. Europe has similar plans, with hundreds of billions earmarked for defense and the energy transition. China and Japan are likely to follow suit, though for very different reasons.
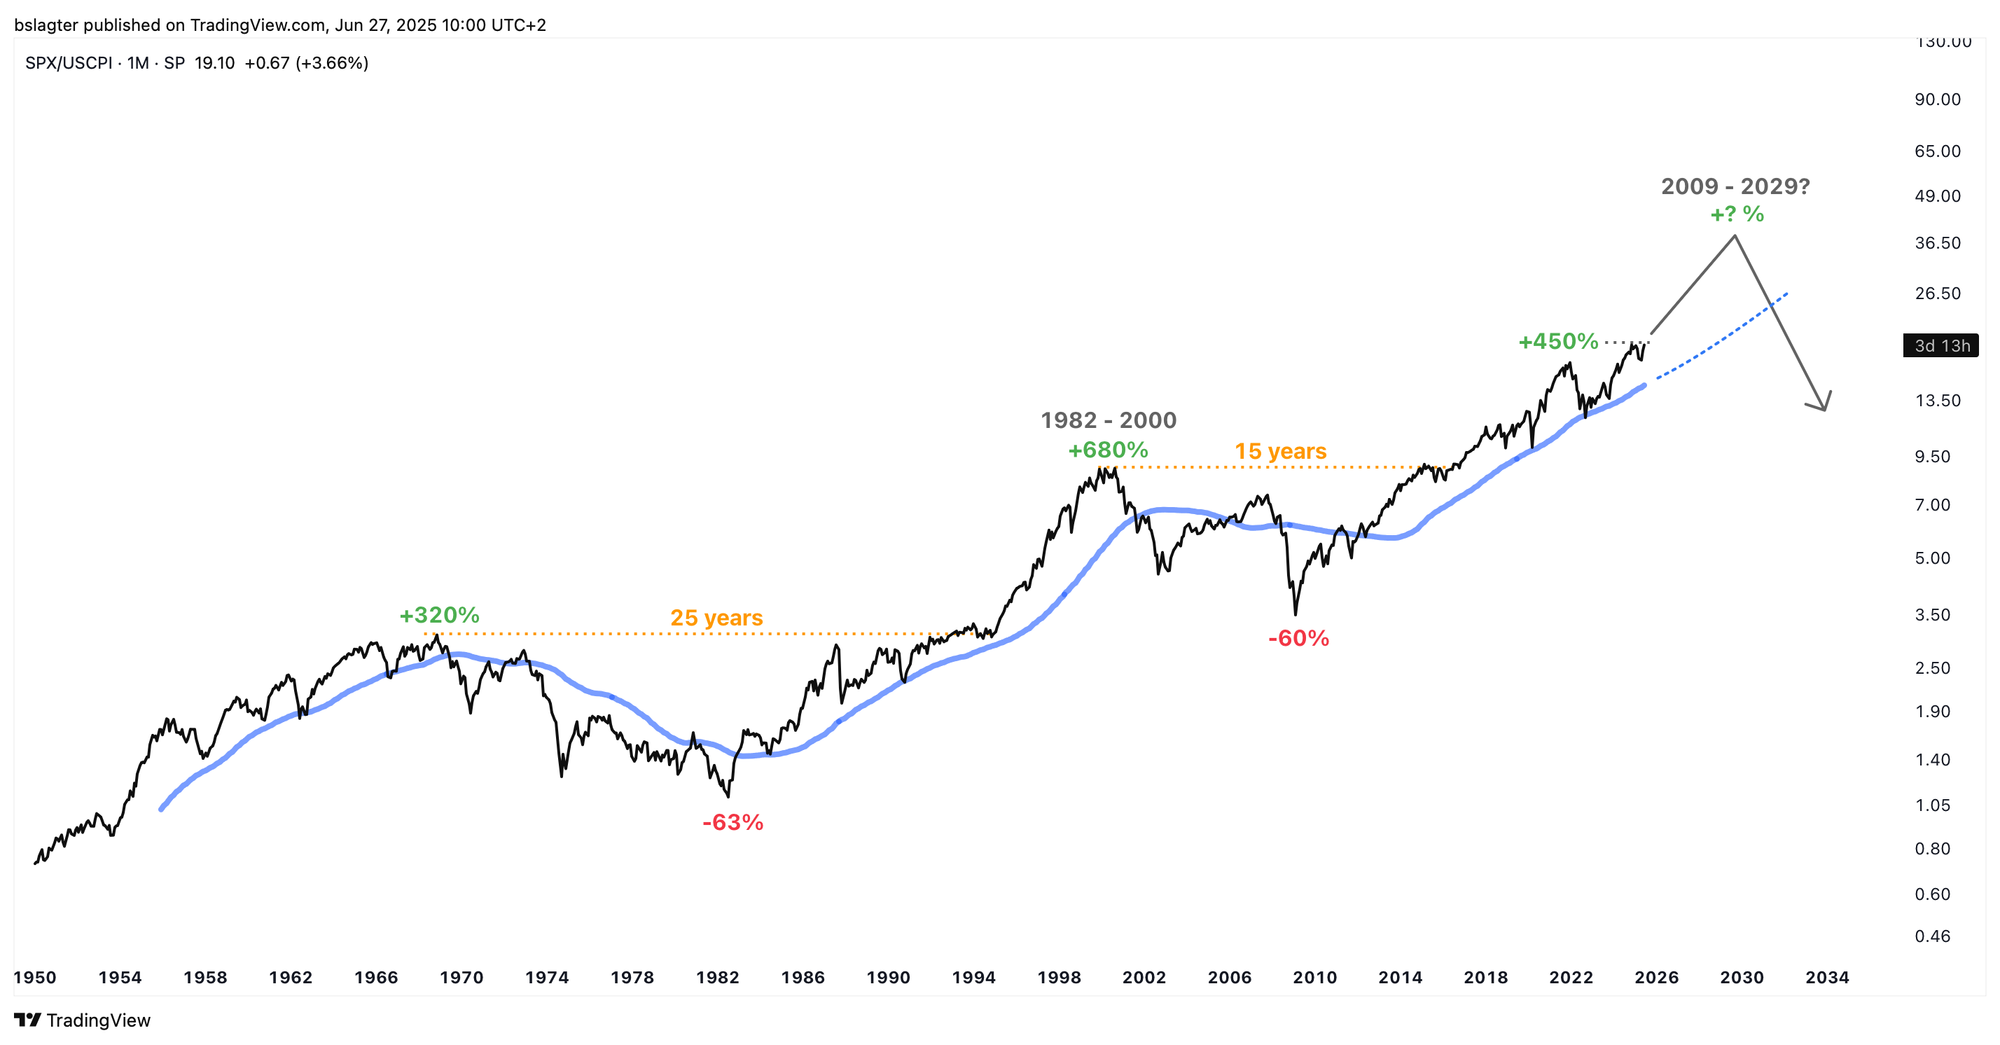
The scenario we’re now observing encompasses a period of economic growth, a new phase of the business cycle, and a further deepening of the secular bull market that began in 2009. Stocks, real estate, gold, and bitcoin are soaring to new heights—ushering in One Big Beautiful Bull Market.
In the coming months, we’ll have to watch closely to see how likely this scenario is to materialize and whether governments will indeed continue down this path.
Eventually, a deep bear market will arrive, as we illustrate once again below. However, in the short term, it’s more likely we’ll witness another chapter in the bull market first. In that case, it pays to be exposed to (tech) stocks, bitcoin, real estate, precious metals, and commodities—even if that comes at the expense of savers and bond investors.
The continuation of the secular bull market unfolds over quarters and years. In the short term—over days and weeks—financial markets can swing unpredictably due to daily concerns and excitement.
There are ongoing battles between Trump and Fed Chair Jerome Powell, feuds between Trump and Elon Musk over the budget deficit, and negotiations on import tariffs that could strain relations with Europe and China.
Nevertheless, financial markets appear to look right through these issues. Yesterday, both the Nasdaq 100 and the broad S&P 500 reached all-time highs. On Tuesday, bitcoin recorded its highest monthly close ever at $107,000, and this week the midcap index Russell 2000 made strong gains. These are classic signs of a bull market.
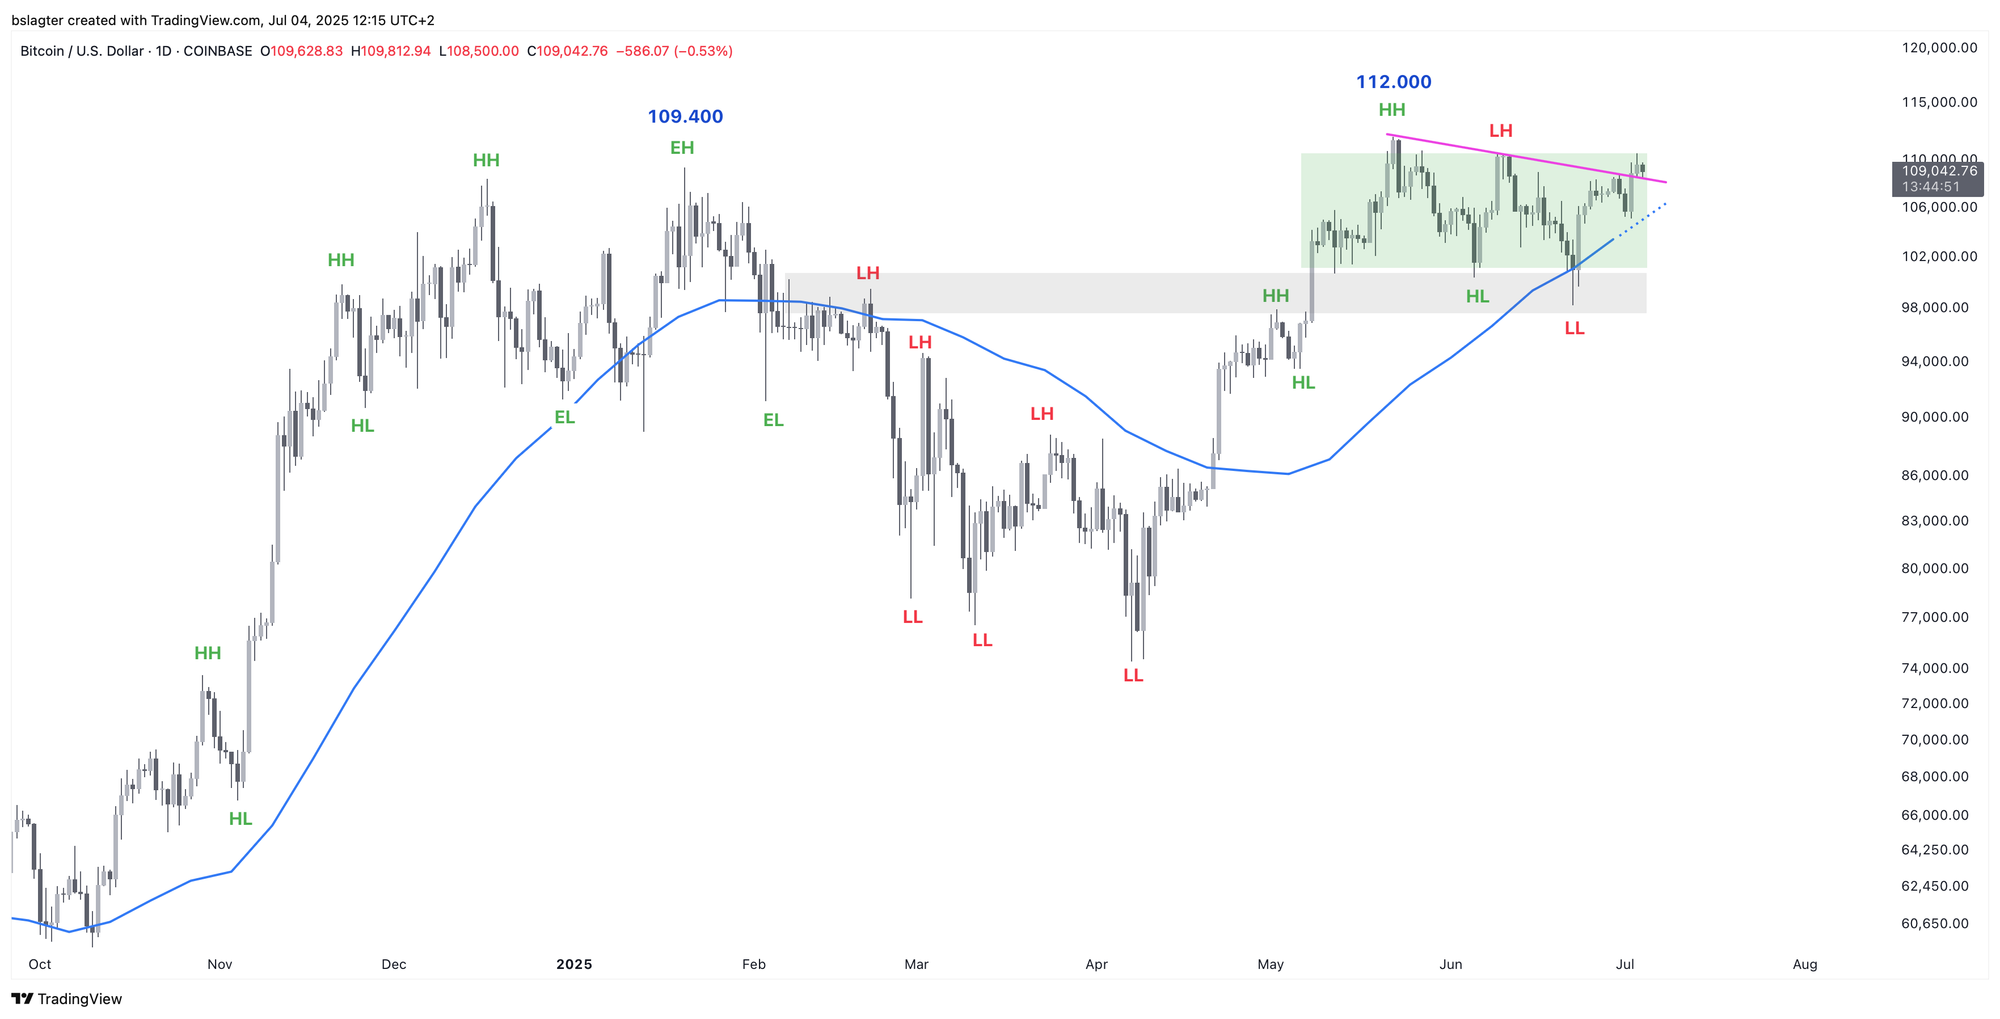
On the daily chart, bitcoin appears poised to break out from the two-month consolidation. Its price has been tightly squeezed between a descending trend line (pink) and the dominant 10-week moving average (blue) of the weekly cycle. Yesterday, the price stood at $110,600—less than 2% below the all-time high of $112,000.
If the price exceeds $112,000, a large, rapid surge seems likely, driven by a combination of two factors:
- Just above $112,000 lie many stop-loss levels and liquidation thresholds for traders and speculators. As the price approaches that mark, they will likely close their short positions by buying bitcoin.
- We’ve seen in this market cycle that after a period of sideways movement, a short, rapid surge often follows. Many won’t want to miss that opportunity and will jump on board immediately after a breakout.
The decision between a breakout to new record highs or a prolonged period of sideways trading will be made in the coming week. We’ll know more next week!
We continue with the following topics for our Alpha Plus members:
- Chance of a rate cut in July evaporates due to a strong jobs report
- The path to new all-time highs
- Trump turns on the money faucet via a backdoor
1️⃣ Chance of a rate cut in July evaporates due to a strong jobs report
Thom
From a macroeconomic perspective, this week was dominated by the US jobs report. Weak figures would have increased the pressure on Jerome Powell and the US central bank to lower rates even further. When ADP job growth came in at -33,000 on Wednesday, instead of the expected +98,000, the “doomers” were all too pleased.
However, on Thursday, exceptionally strong non-farm payroll (NFP) job growth was reported, with the unemployment rate falling to 4.1% instead of rising to 4.3% as expected. Although the labor market might be showing slight signs of cooling, it clearly doesn’t yet require assistance from the US central bank.

The American economy is performing well for now, and with Trump’s new plans (the Big Beautiful Bill favoring spending over cuts), there’s no compelling argument for an alternative scenario—a recession currently seems very unlikely.
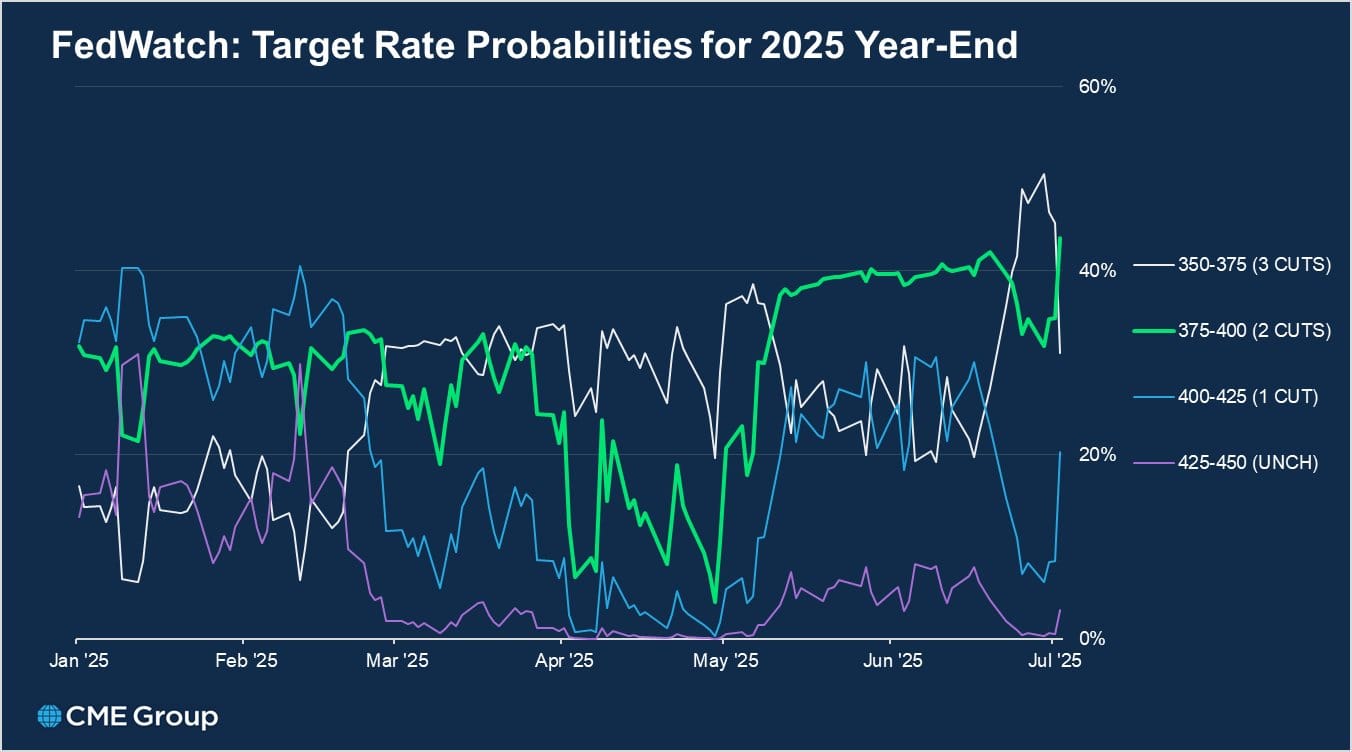
As a result of these figures, the probability of a rate cut on July 30 dropped from 21% to 7%, and the market now expects only two cuts by the end of 2025 instead of three.
The key takeaway for bitcoin is that the Trump administration’s policy is focused on stimulating the economy as much as possible. As long as that message prevails, it’s hard to be bearish over the long run.
The likelihood that the US central bank will delay the next rate cut is not significant. As long as the economy and the market trust that the US government will continue spending, risk appetite will remain high, global liquidity will increase, and bitcoin’s fundamentals will stay strong.
2️⃣ The path to new all-time highs
Bert
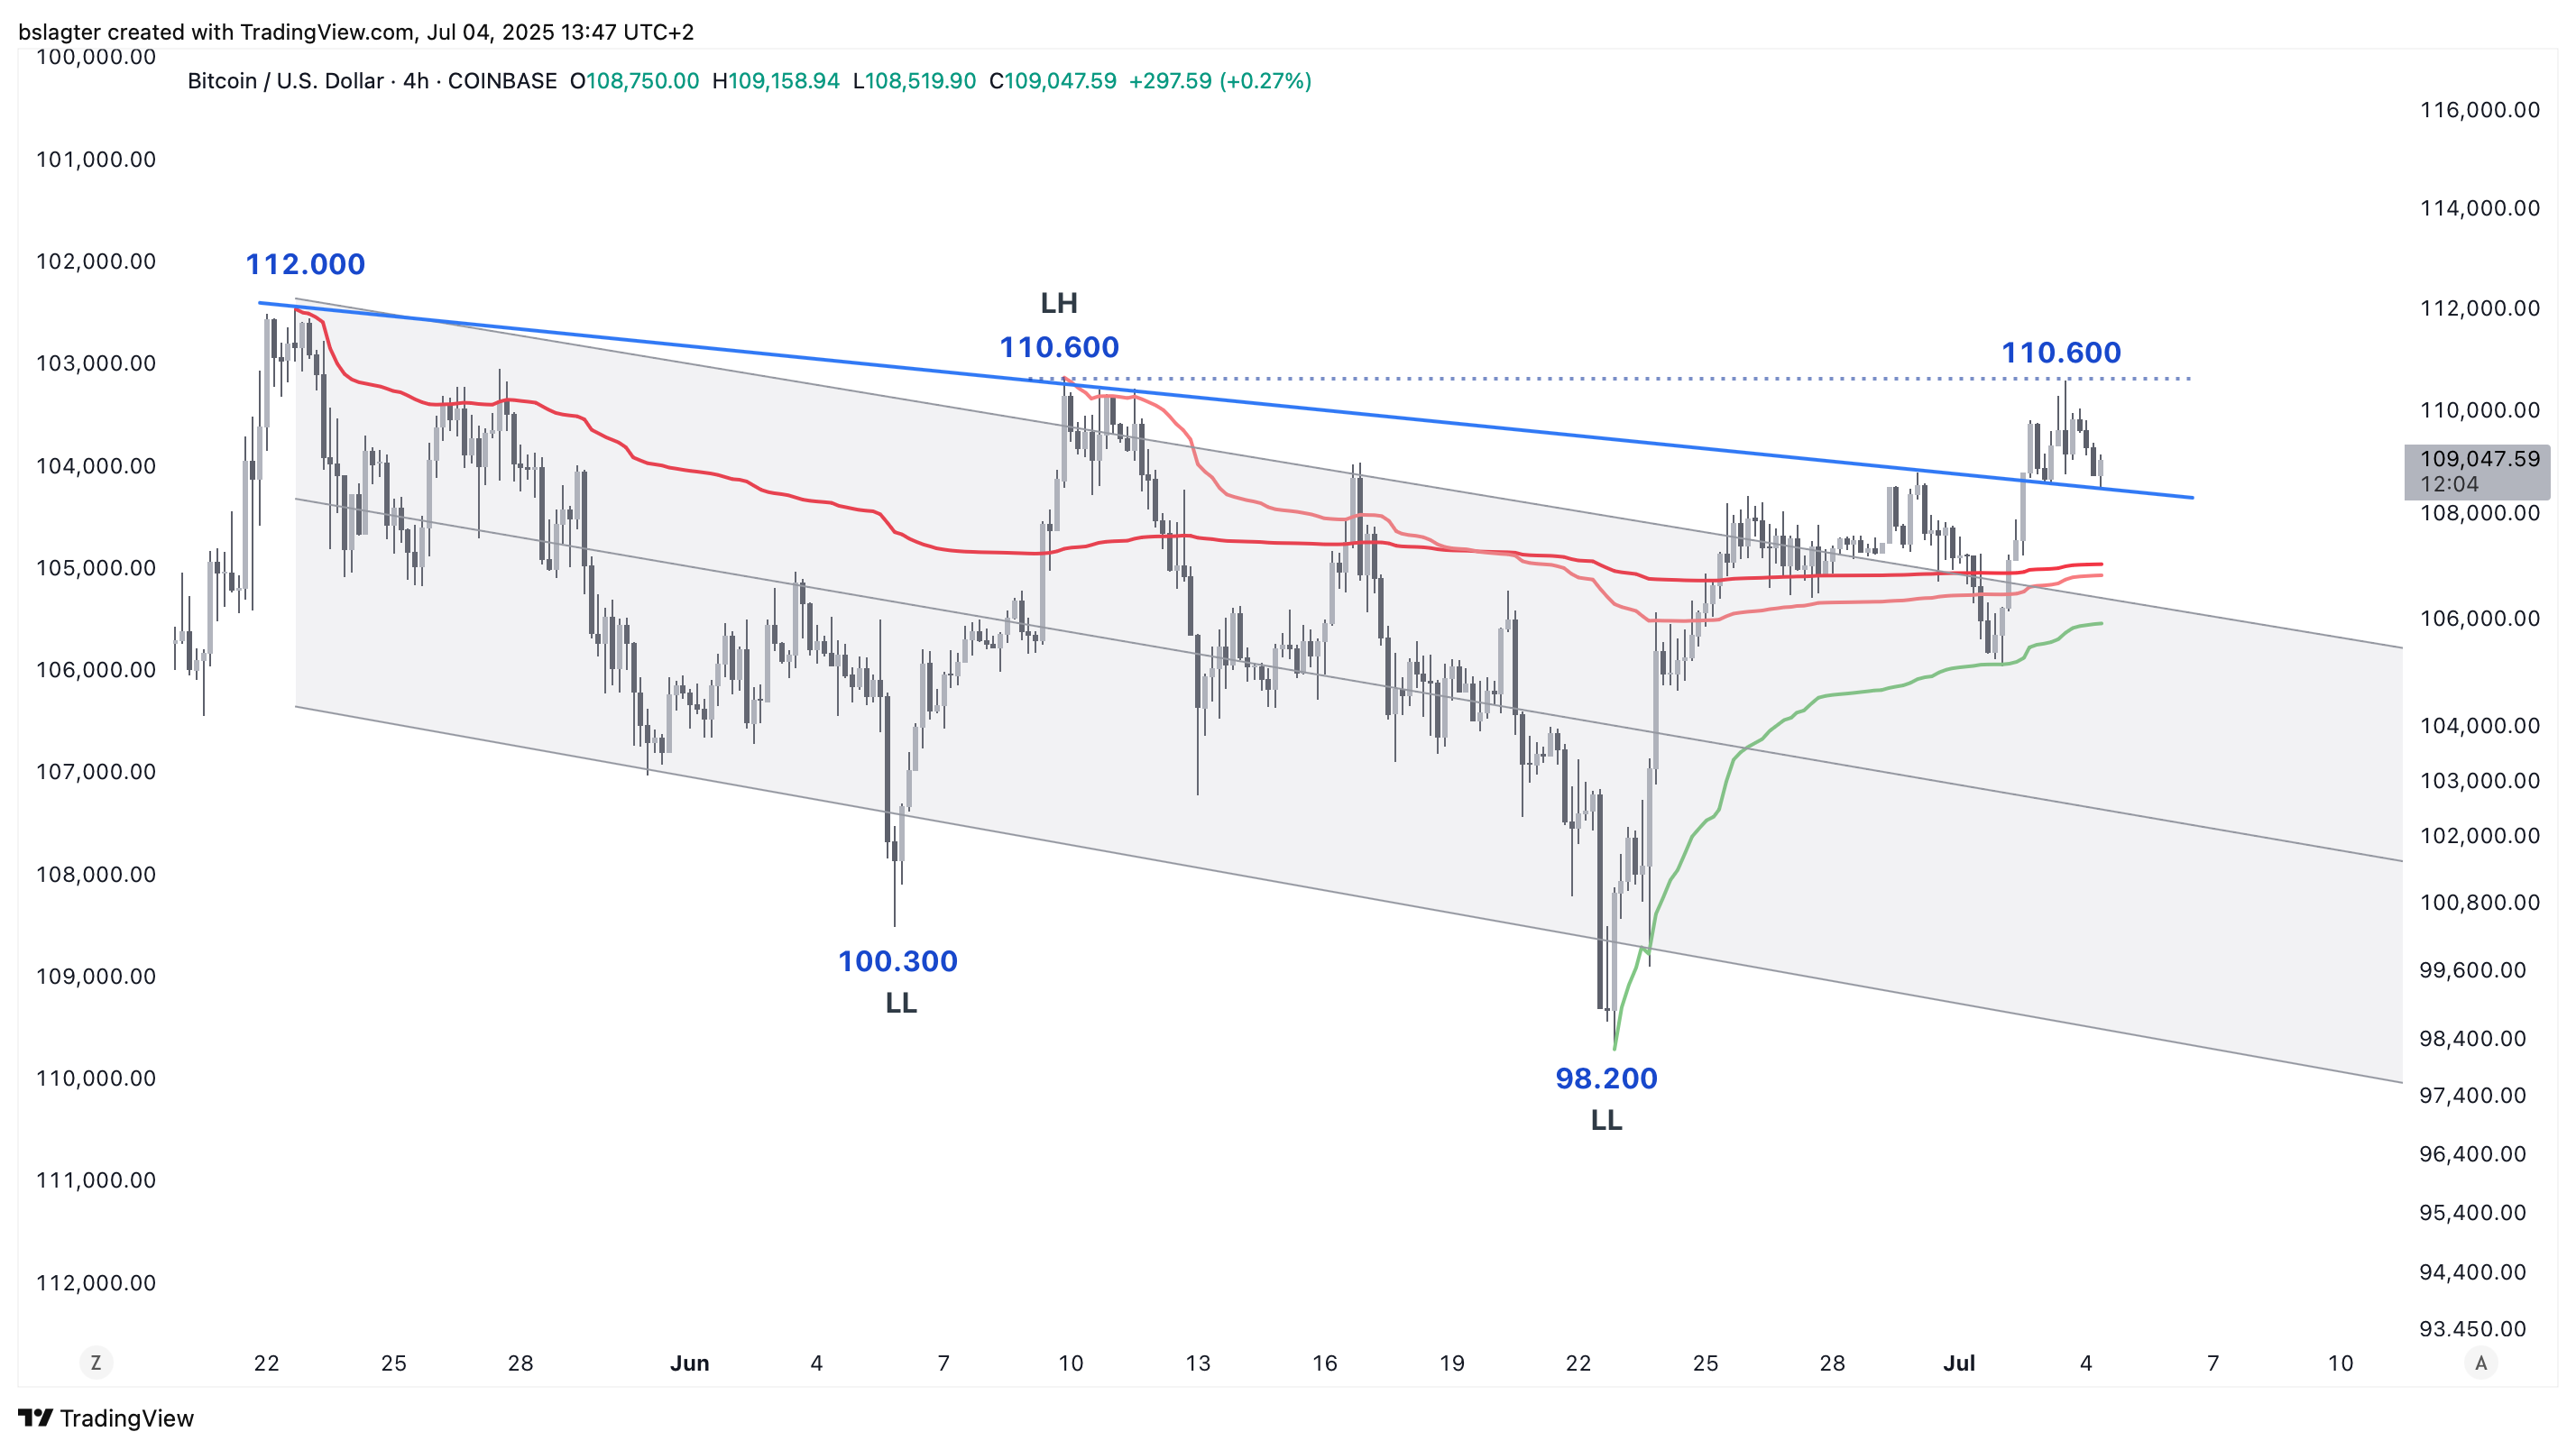
In the 4-hour chart below, we examine the consolidation that has taken place over the past two months. The gray channel represents a regression trend based on the price movement between the high of 112k and the low of 98k. The red lines are anchored VWAPs from the local highs.
Breaking out is often a process rather than a single event. Here, bitcoin is making gradual moves—first adjusting to the VWAPs and the regression channel, and now testing the descending trend line as support before potentially moving further upward.
This would be the ideal trajectory. From here, it could continue to the previous local high of $110,600, and then tackle the “final boss” – the all-time high of $112,000.
But it’s nearly the weekend. Today is a national holiday in the USA and the markets are closed. It wouldn’t be surprising, therefore, if we see some sideways movement over the next few days, with a clear trend emerging only on Monday.
Above $112,000, a substantial pile of kindling awaits a spark. Five peaks in a narrow price range have each added to short positions:
- December 17: $108,400
- January 20: $109,400
- May 22: $112,000
- June 9: $110,600
- July 3: $110,600
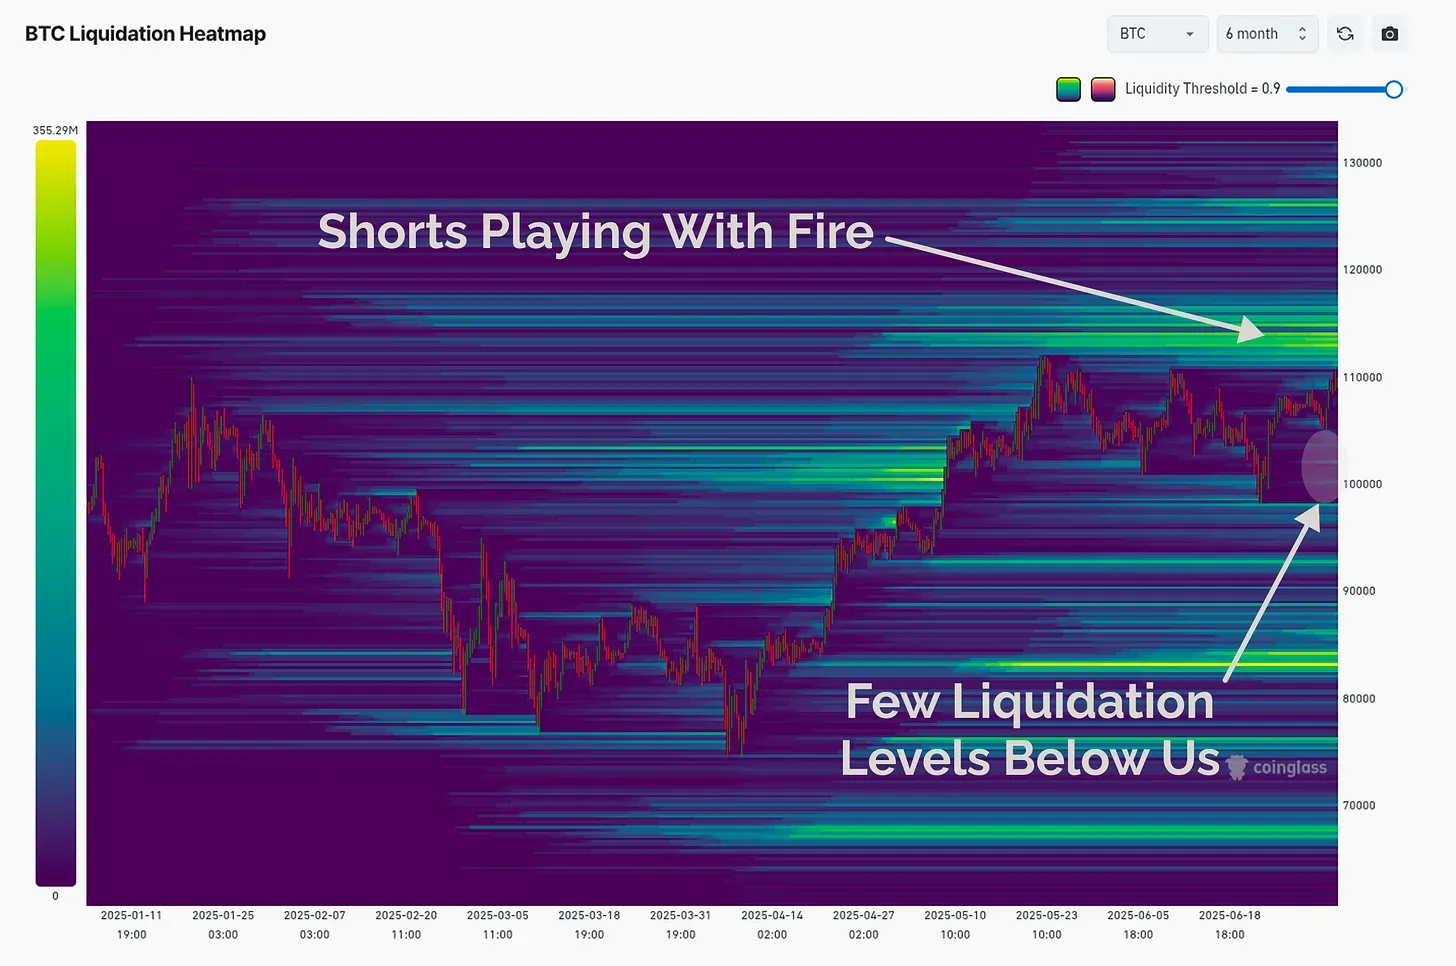
Between $112,000 and $120,000, numerous liquidation levels and stop-loss orders—as well as conditional buy orders to profit from a breakout—accumulate to a total amount that likely runs into the billions.
James Check described the situation in his newsletter as follows:
The speculators are back, and the most likely reality is that liquidations, and volatile squeezes are going to be a feature of the market ahead. [..]
Imagine being short when the price chart looks the way it does…I can’t understand it. [..]
I cannot see a huge risk of a cascading liquidation to the downside… But on the upside… good luck to the shorts, honestly.
3️⃣ Trump turns on the money faucet via a backdoor
Thom
The US government is changing its approach to debt policy. President Trump and Finance Minister Bessent have decided to temporarily stop issuing long-term government bonds. Instead, they plan to flood the market with short-term government securities.
What exactly was said?
- Last Friday, during a press briefing, Trump expressed his dissatisfaction with Jerome Powell’s interest rate policy, the head of the US central bank.
- He also stated that he had instructed his government to refrain from issuing any new debt with a maturity longer than nine months for the time being.
- A day later, Finance Minister Bessent reiterated that message on Bloomberg TV, openly questioning why the US should issue long-term debt “at such high interest rates.”
Why is this important?
After social spending, interest payments are the largest expense in the US budget. Lower interest rates can save hundreds of billions of dollars. Long-term rates—those with maturities of 10 to 30 years—are determined by the market. In principle, the US central bank can only influence short-term rates and has only limited influence on long-term rates.
Trump and Bessent aim to lower long-term rates by issuing only short-term bonds. Since the demand for long-term government bonds will likely remain largely unchanged, reducing the supply should lead to lower yields.
If successful, this would benefit the economy. Companies and homebuyers often borrow at long-term rates. If Trump eventually appoints a central bank chair who is also in favor of rate cuts, his administration will (in)directly determine the interest rate it pays on government debt.
This has several potential implications:
- The independence of the central bank comes into question;
- Monetary policy becomes further subordinate to the government’s wishes;
- The likelihood of persistently higher inflation increases;
- The likelihood of a further weakening of the dollar increases;
- The probability of a loss of confidence and political instability grows;
- Interest rate risk shifts entirely to the short end of the curve, making it more sensitive to future rate hikes.
We primarily see this type of policy in emerging economies, where governments abandon financial discipline and simply turn on the money printer to cover budget deficits—usually leading to inflation.
But that’s not all.
Flooding the market with short-term government bonds injects a great deal of liquidity into the financial system. With long-term rates suppressed (that’s the plan), investors will likely be compelled to sell the dollar.
A weaker dollar puts pressure on other currencies by making exports from Europe, China, and Japan more expensive for American buyers. This, in turn, could force other central banks to follow suit with rate cuts, triggering a race to the bottom. In theory, this creates an ideal scenario for bitcoin and gold.
Thank you for reading!
To stay informed about the latest market developments and insights, you can follow our team members on X:
- Bart Mol (@Bart_Mol)
- Peter Slagter (@pesla)
- Bert Slagter (@bslagter)
- Mike Lelieveld (@mlelieveld)
We appreciate your continued support and look forward to bringing you more comprehensive analysis in our next edition.
Until then!