Narrative Follows Price
Last week's gains have been wiped out. Bitcoin is back below $90,000. Meanwhile, gold keeps breaking records. When narratives shift with price, what's really driving markets?

Every time I see the gold chart next to the bitcoin chart, it makes my blood boil – Ansem
When prices shoot up, logical explanations are a dime a dozen. Interest rates are falling, the economy is booming, the halving just happened, and bitcoin is finally finding its way into the diversified portfolios of traditional investors.
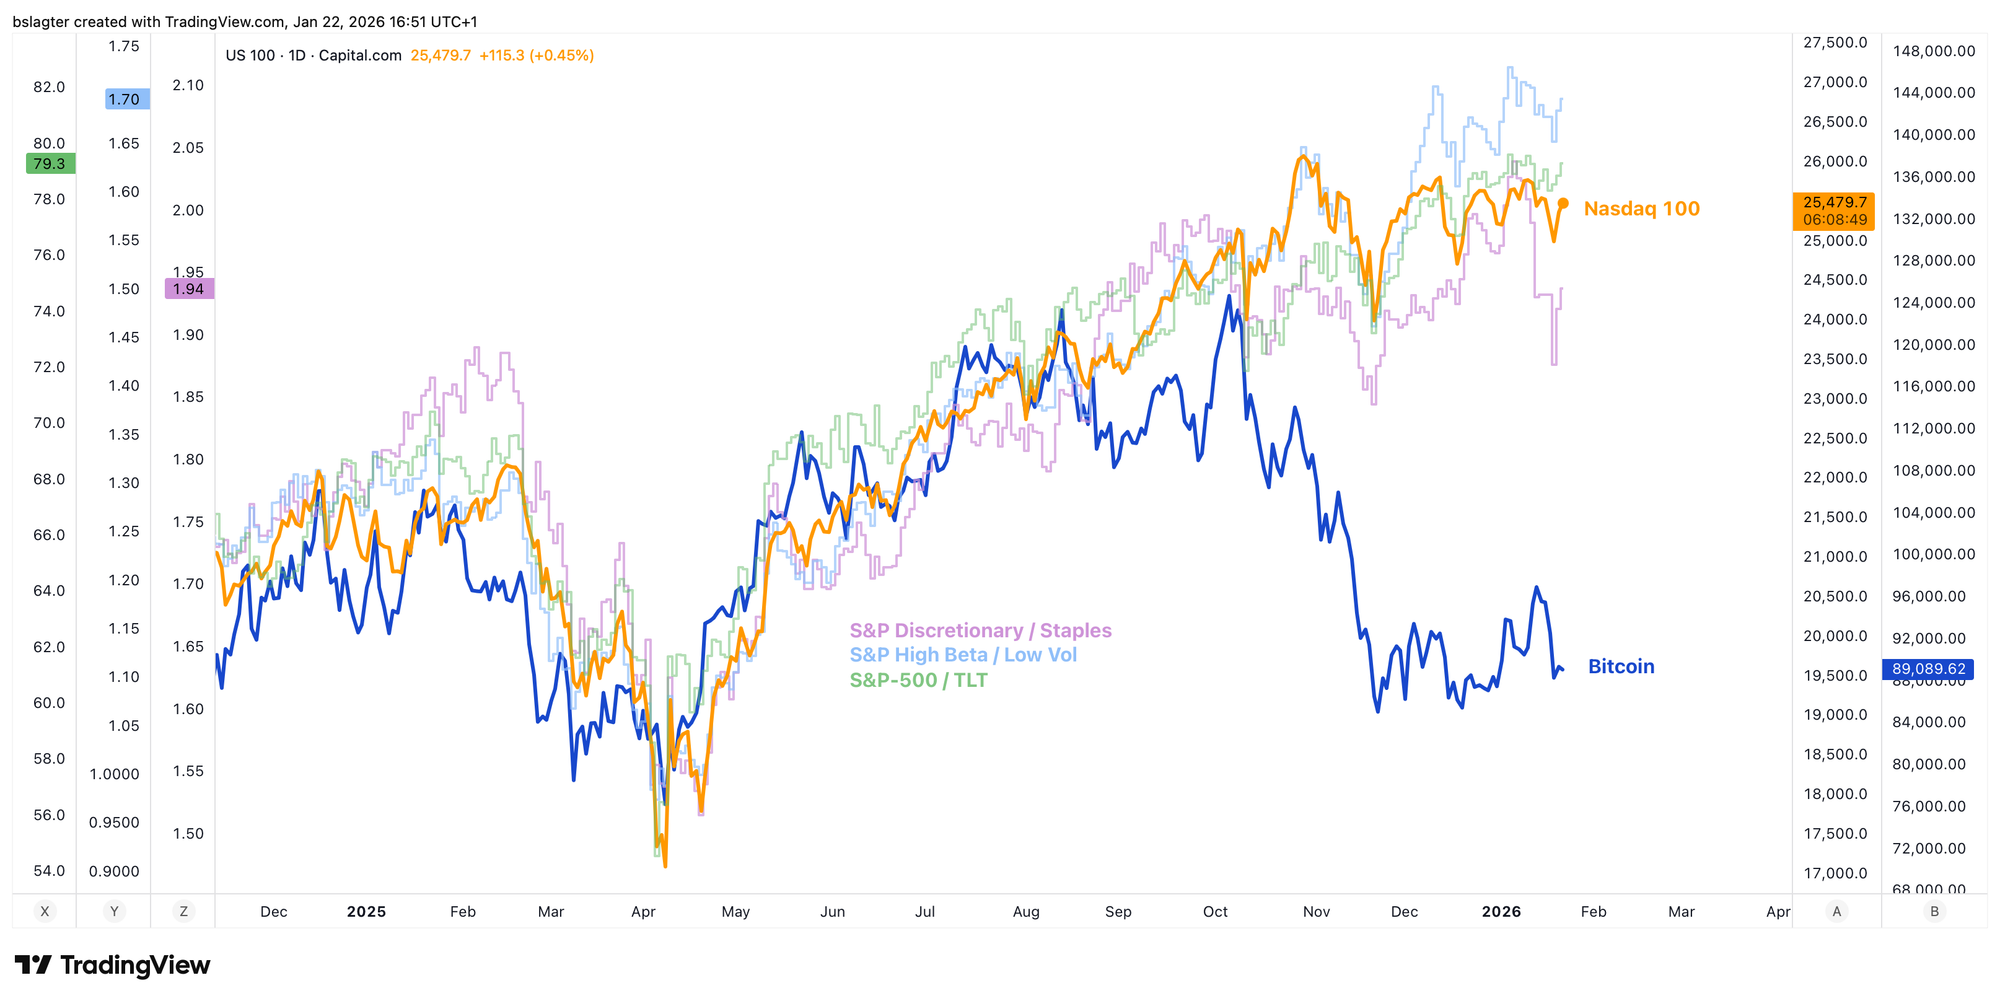
Since August, bitcoin has been underperforming. While tech index Nasdaq 100 dutifully follows risk appetite indicators, bitcoin keeps sliding. Gold, silver, and stocks are breaking records and capturing investors' attention. Bitcoin? Nobody's talking about it anymore.
When prices fall, fitting narratives are just as easy to find. Investors are removing bitcoin from their portfolios due to risks posed by quantum computers looming over the market. Gold benefits from the debasement trade, not bitcoin. And discussions about the Genius Act have stalled, reducing the chances of constructive crypto legislation in the US.
You get the point: narrative follows price.
In a bear market, prices fall and investors expect them to keep falling. In those circumstances, you mostly hear negative stories. Positive stories exist, but they don't get attention because they don't explain the performance of our investments.
A quick thought experiment. If bitcoin were trading at $250,000 right now, could you explain that incredible performance with stories and news? Probably without breaking a sweat.
Strip away all the after-the-fact explanations, and what remains is that every financial market simply has a rhythm where strength and weakness alternate. Greed and fear. Hype and disillusionment. Surpluses and shortages. Accumulation and distribution.
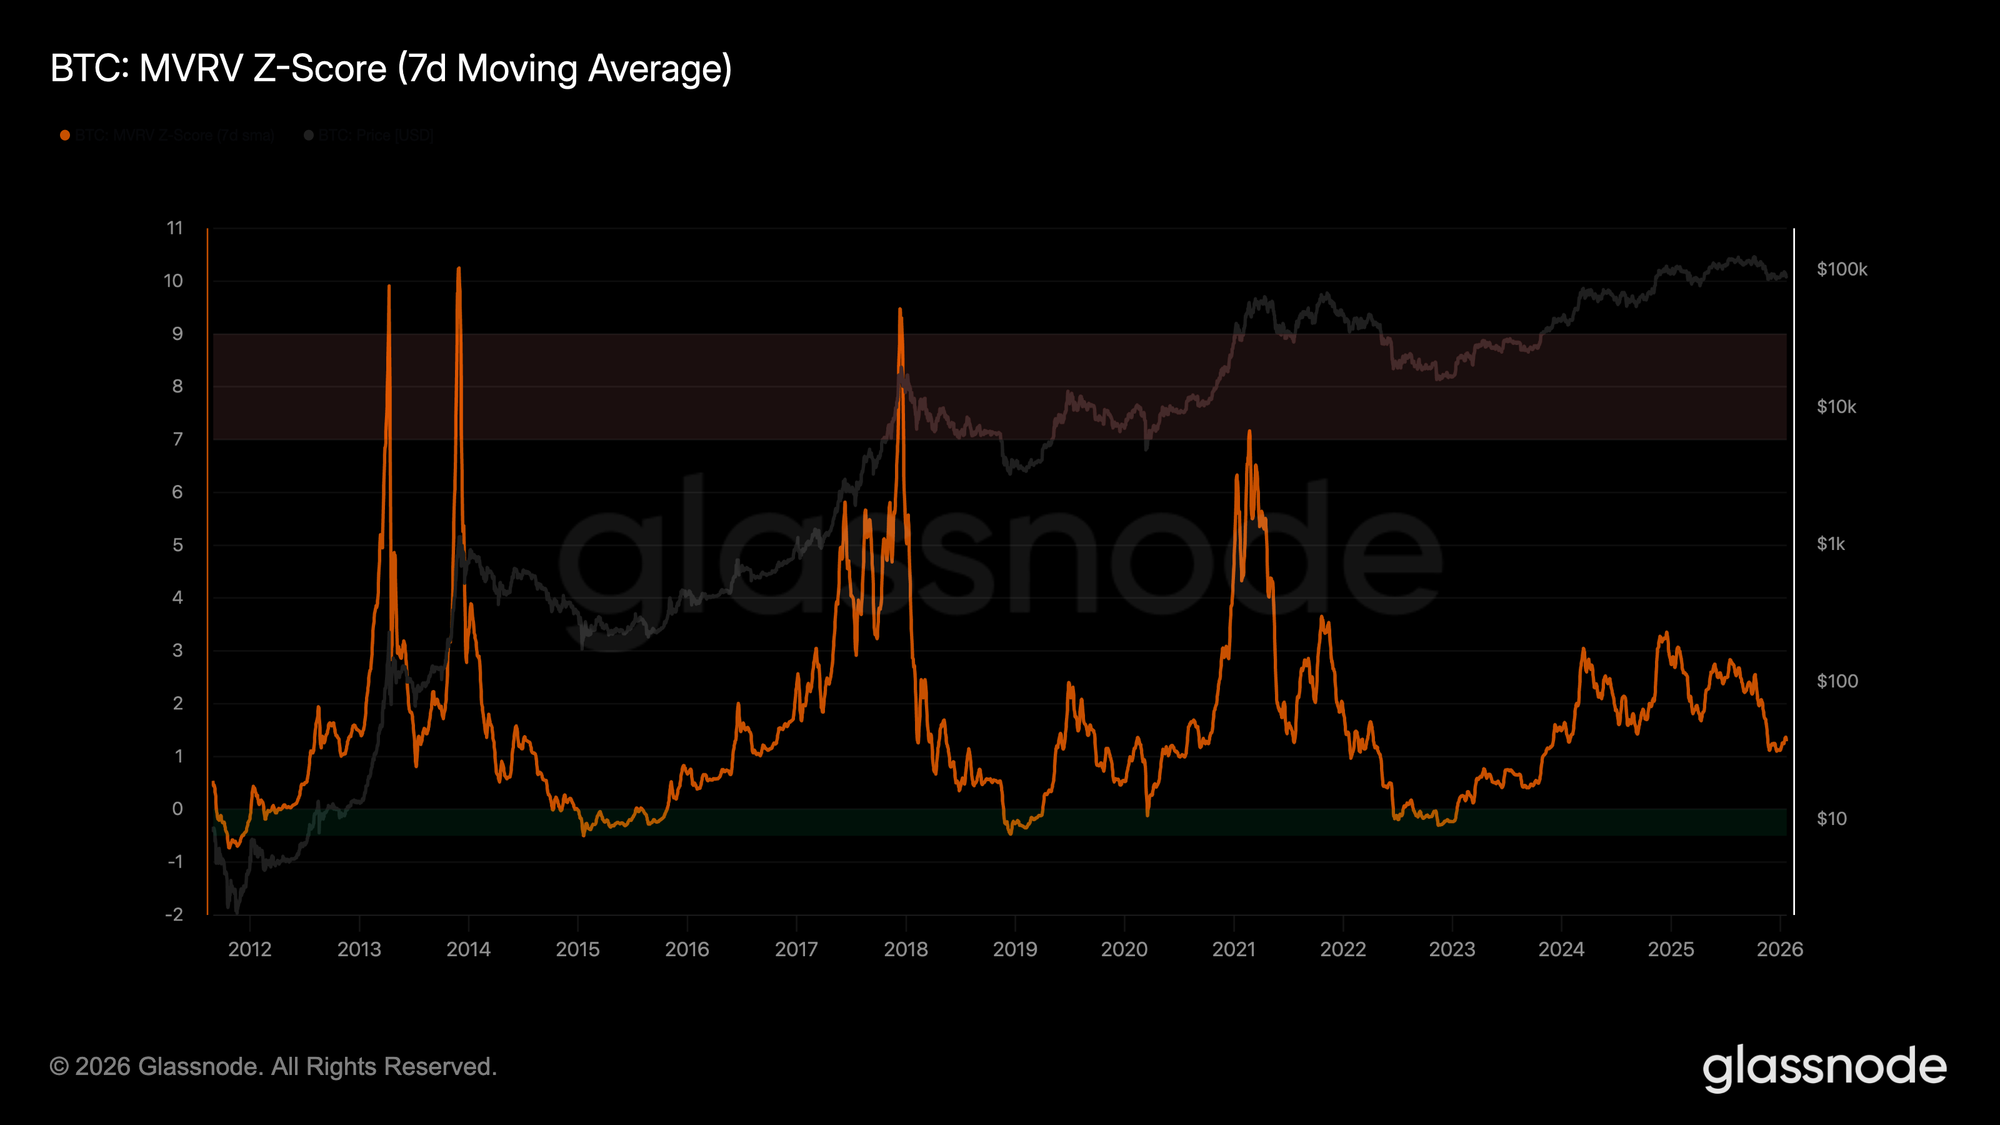
This cycle shows up in all kinds of data. Price, obviously, but also trading volume, realized profit and loss, mempool size, derivatives open interest, and the number of search queries or app downloads.
It strongly appears we're in the contracting phase of the pendulum swing. Heading toward the end of this market cycle, and the beginning of the next.
That doesn't mean a deep bear market is inevitably waiting for us. It simply means we'll face headwinds for a while. That worrying narratives will gain traction faster than hopeful ones, and the pessimists will hold the stage.
'Bear markets are for building' was the mantra in 2018-2019 and 2022-2023. Just tune out the price and the columnists for a while. Look at what's being built.
In two areas, we're seeing the transition from early adopters to the masses:
- Bitcoin as digital gold and part of a diversified portfolio.
- Crypto networks as infrastructure for tokenization.
Building continues on all fronts. Regulation, supervision, standardization, access, data and analytics, integration with existing systems. A lot is happening on the technical side too, though that remains a point of concern, especially for bitcoin.
It's only a matter of time before the pendulum swings the other way, for both bitcoin and gold. And then the narrative flips: "bitcoin catches up to gold" and "gold sellers rotate into bitcoin."
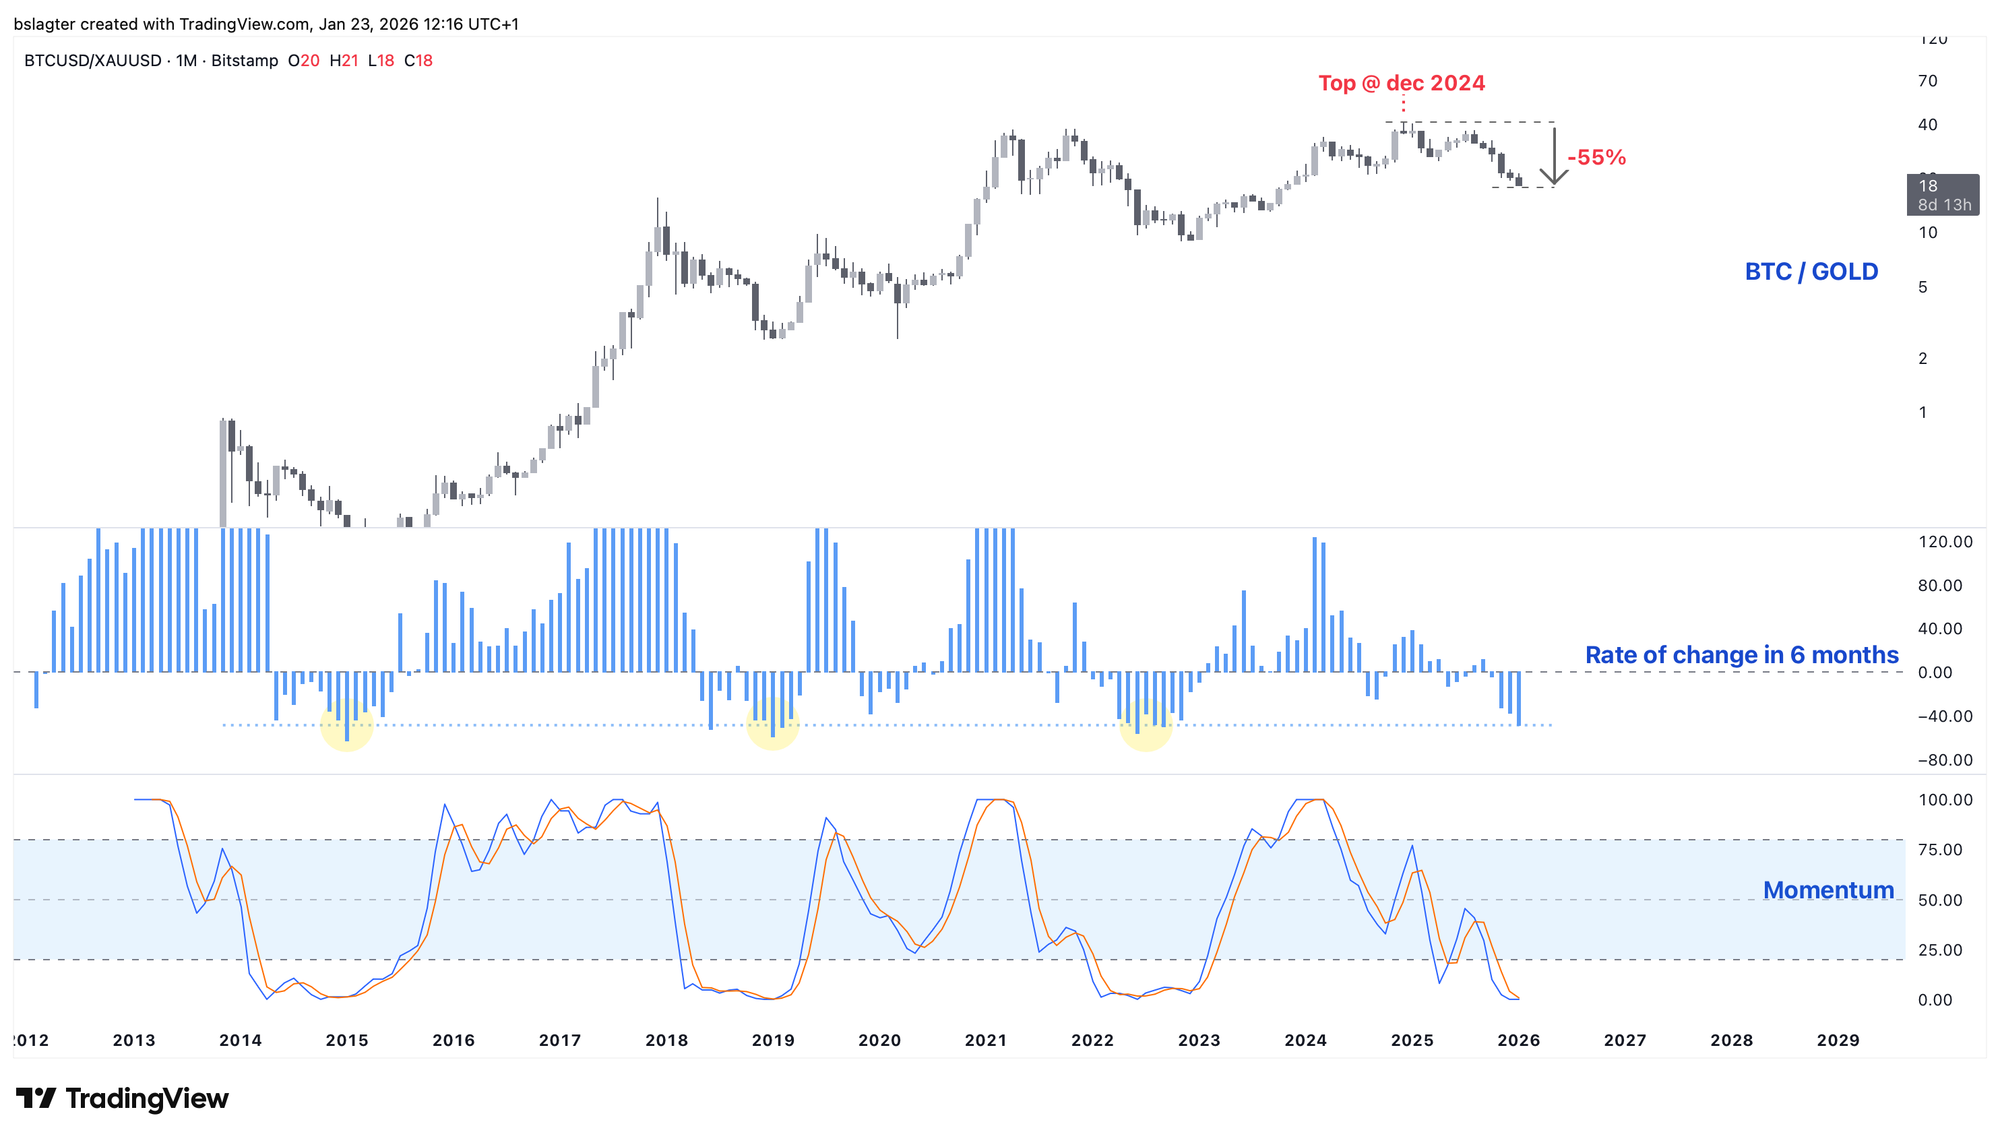
If we express bitcoin's price in gold instead of dollars, we get a picture of how the two move relative to each other. The peak of this market cycle was in December 2024, and we're now down 55%.
Both the momentum and the speed at which bitcoin is losing ground to gold are at levels we also saw in the middle of previous bear markets.
Gold's total market cap is now about 20 times that of bitcoin. If the pendulum swings the other way later this year, and some of that flows into bitcoin? Things could move fast. Just returning to the ratio of 40 troy ounces of gold per bitcoin would put the price at $200,000.
We continue with the following topics for our Alpha Plus members:
- This week's price action
- S&P 500 at crossroads between pain and gain
- One last rally for bitcoin?
- Greenland exposes Achilles' heel of the US economy
1️⃣ This week's price action
Bert
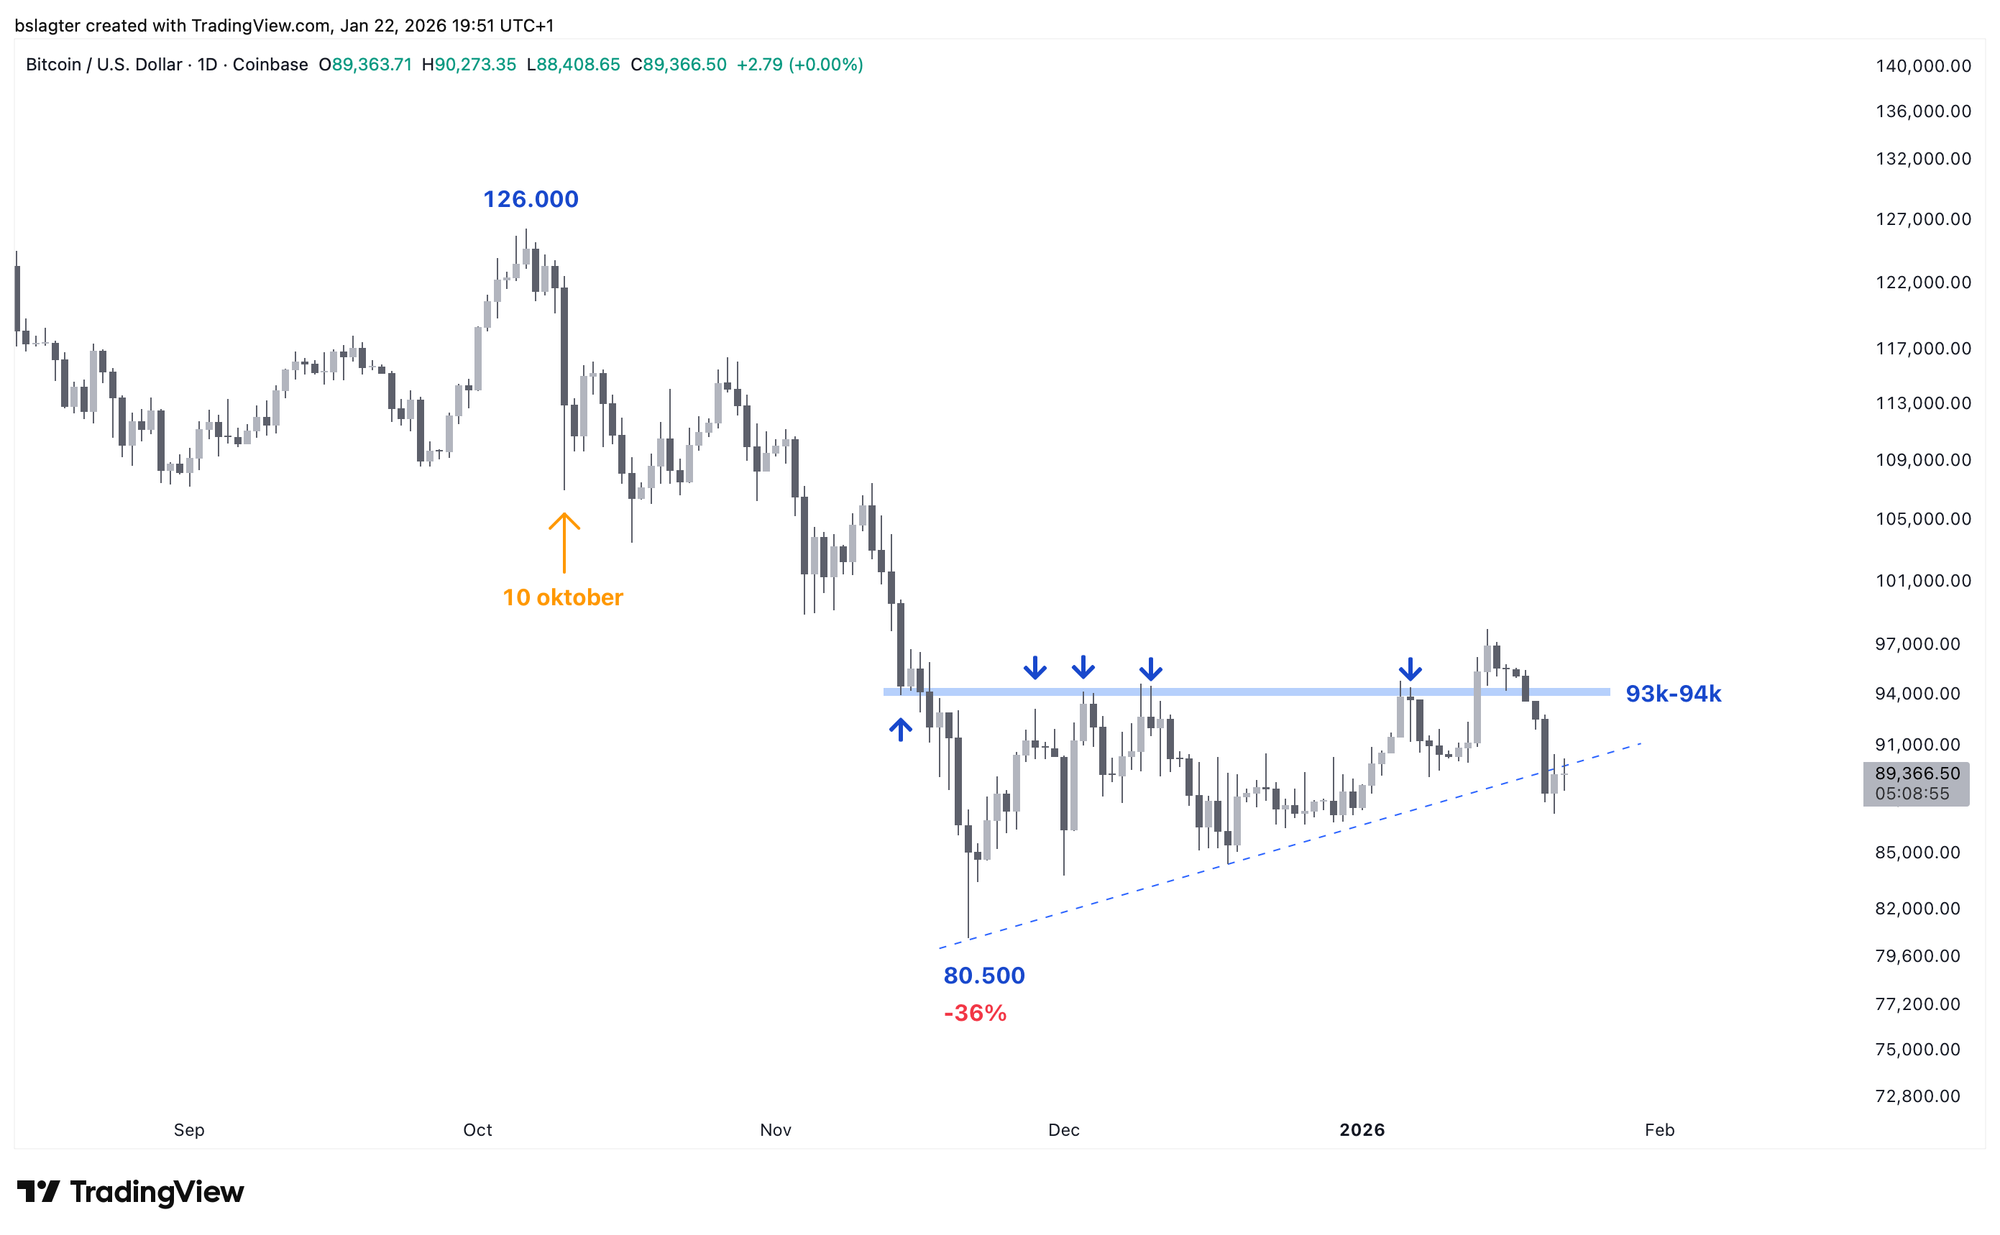
Since the bottom on November 21, $94,000 had been the ceiling for the bitcoin price. On six different days, the price touched that level without breaking through. Last week it finally happened, with a quick surge from $91,000 to (just shy of) $98,000 on January 14.
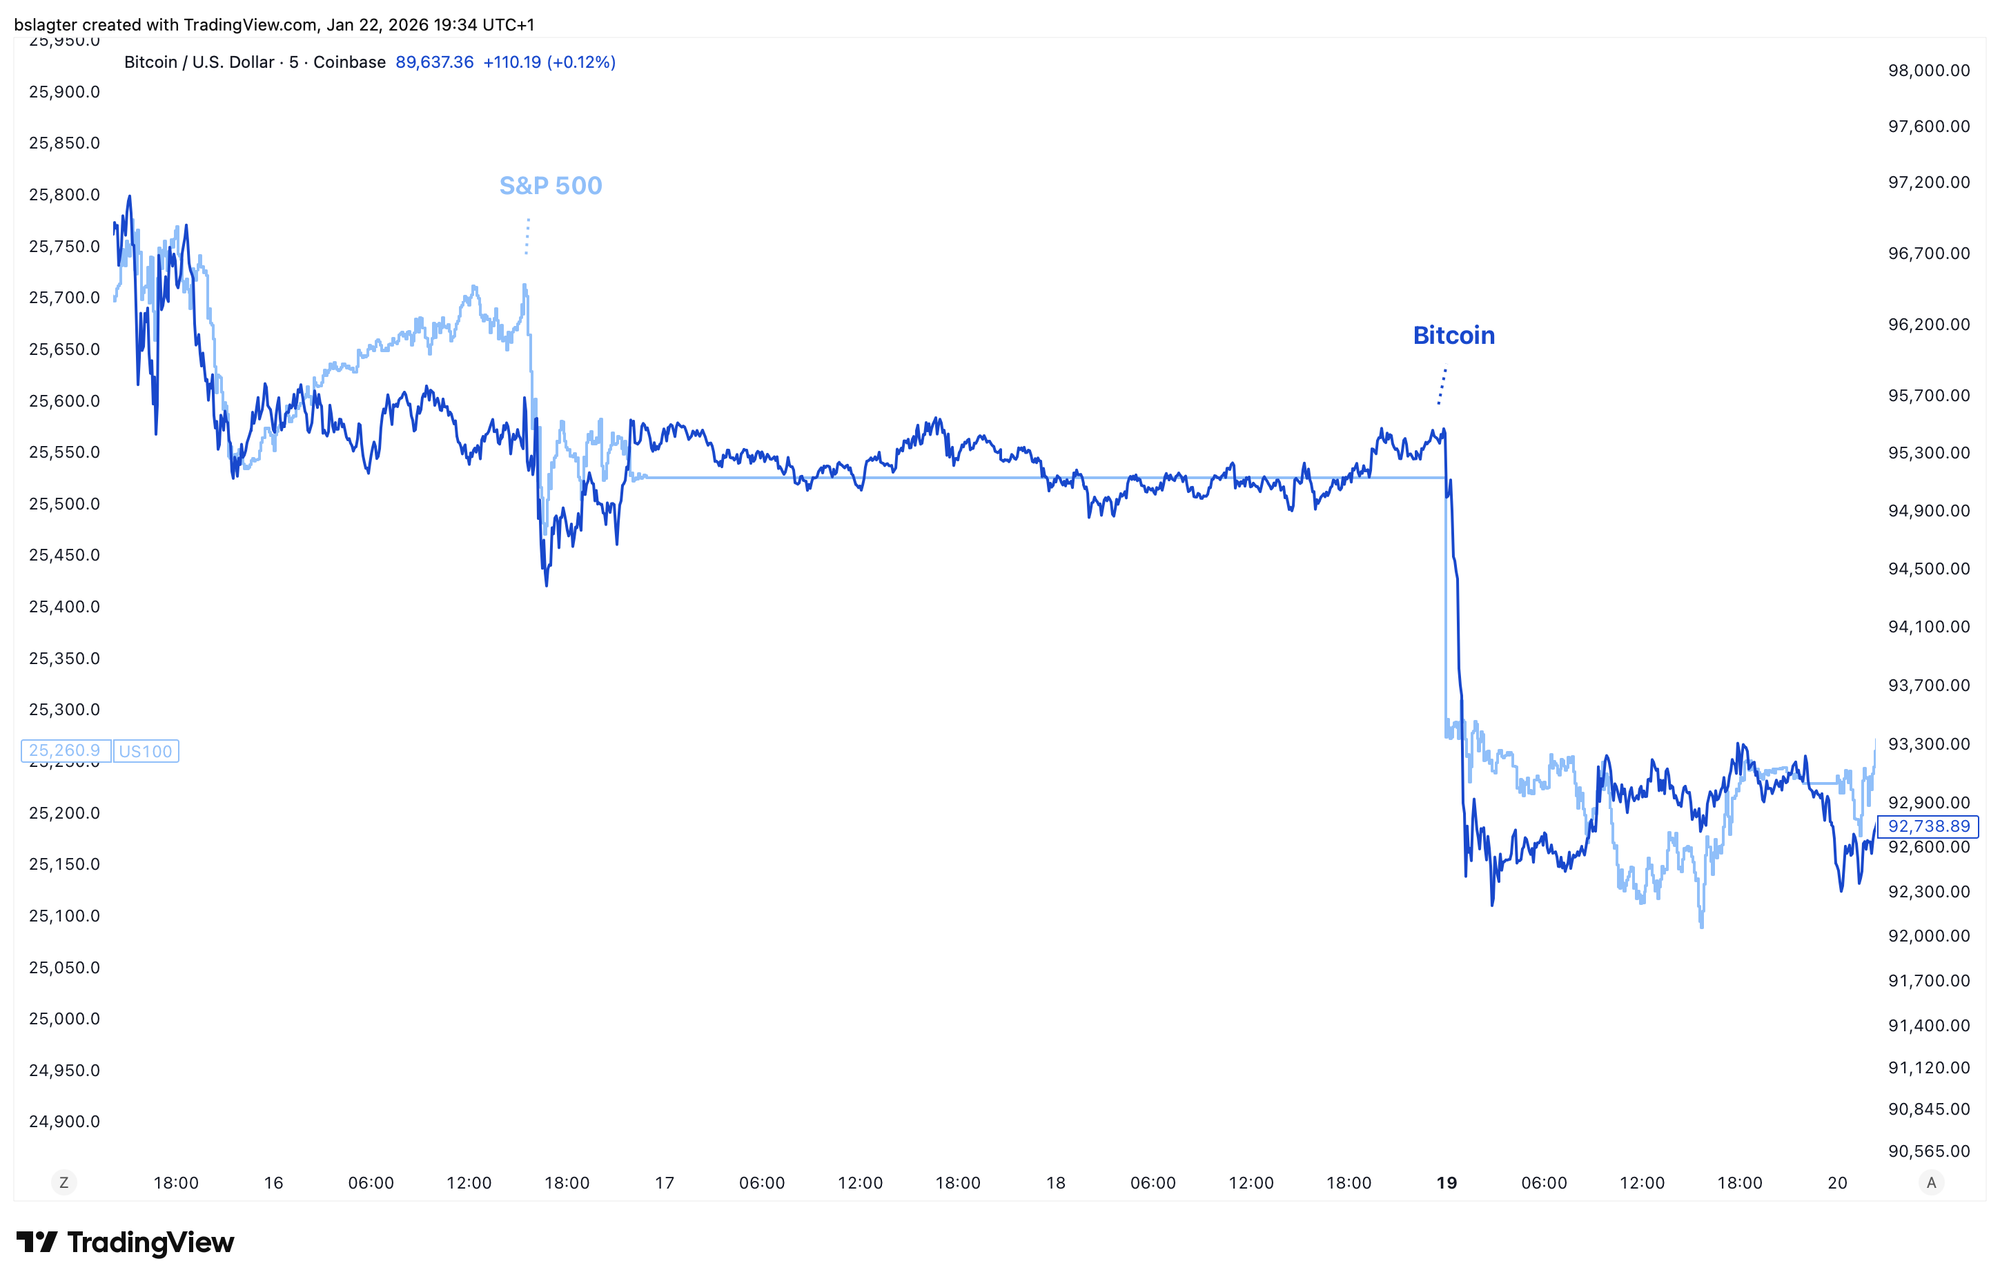
Optimism cautiously returned, and the boldest investors were already talking about a hundred thousand dollars and all-time highs again. It proved to be wishful thinking. Over the weekend, Trump imposed new import tariffs on European countries. Investors hoping America's trade war was buried were left disappointed.
It's notable that bitcoin's price only started falling after Asian stock markets and US futures opened Sunday night. In the past, bitcoin regularly served as the canary in the coal mine during weekends. The price would rise or fall while the rest of the markets were still closed.
The big hit came on Tuesday. The price crashed thousands of dollars down to $87,700. Back below $94,000. And a strike through the pattern in the chart below. No longer valid and therefore no longer useful. But at the same time, there's information in how the pattern fails.
An ascending triangle is a common pattern with reasonable reliability. In this case, it captures the consolidation after the decline from October 6 to November 21. That a breakout to the upside failed AND a breakout to the downside stalls tells me the market is directionless and listless. There's no conviction.
If I had to place this dynamic somewhere on the market cycle, I'd choose the final stretch of a bear market.
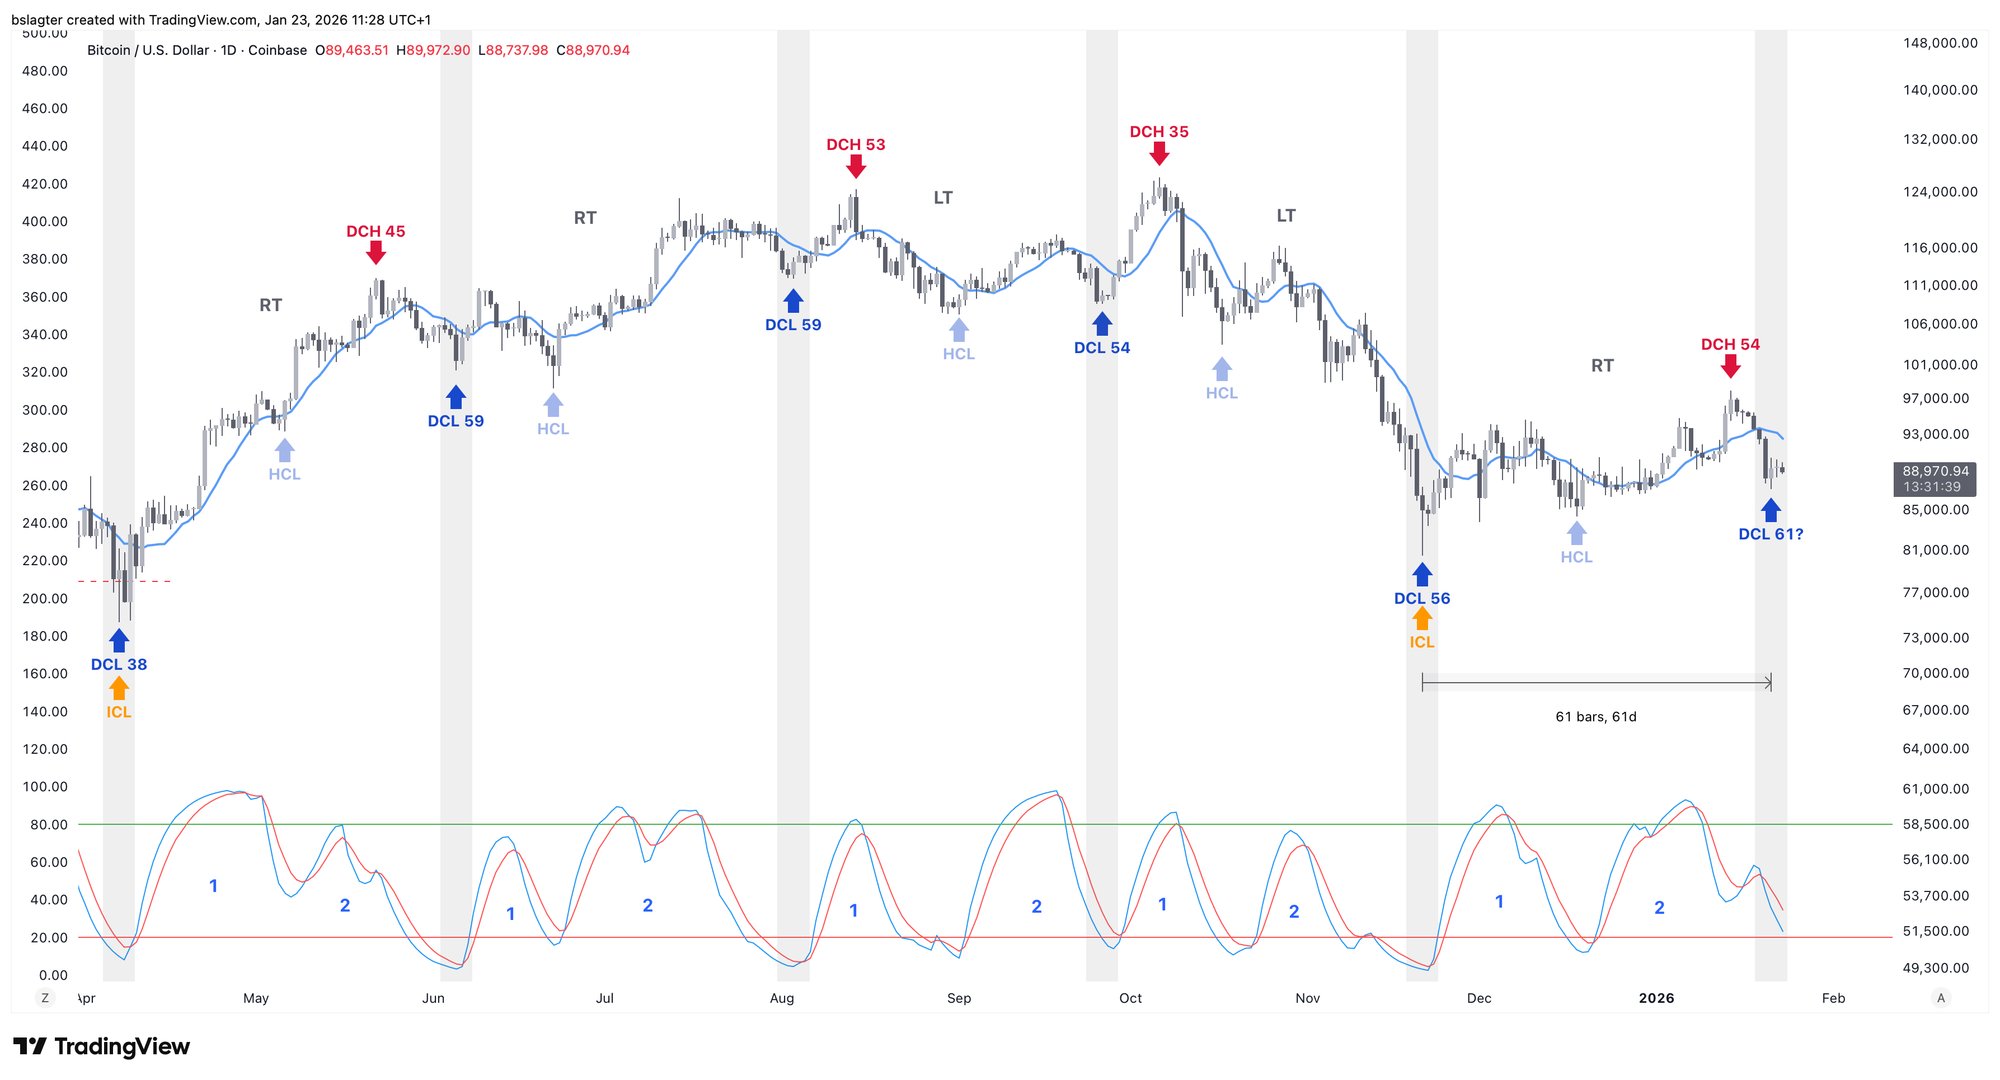
It's quite possible that with the sharp price drop on Tuesday and Wednesday, we've established a daily cycle low (DCL).
The daily cycle has been very messy over the past six months. The chart below contains a plausible breakdown. The price is somewhat chaotic, but the momentum does have a recognizable rhythm of two impulses each time. From DCL to HCL to DCL.
The abbreviation HCL stands for 'half cycle low'. We sometimes talk about the 'mid cycle pause' and dividing the oscillator into two parts, but leave it at that. Some analysts explicitly divide the daily cycle into two parts and call the bottom at the halfway point the HCL.
If we've had the daily cycle low, then we'd be starting the second daily cycle of this weekly cycle. Our ideal scenario is that the end of this weekly cycle also marks the end of this yearly cycle. Then we could potentially start a new market cycle and thus a new bull market somewhere in the second quarter.
2️⃣ S&P 500 at crossroads between pain and gain
Sam
Bitcoin has performed significantly weaker than US stock indices S&P 500 and Nasdaq 100 over the past months. Although the correlation hasn't been very high recently, the odds of bitcoin doing well are much greater when equity markets are in an uptrend.
And this potential tailwind for bitcoin is now under pressure. We've arrived at a point where both bulls and bears can make a solid case for the direction of the next major move.
The image of the S&P 500 below shows that after the tariff-related turmoil in April 2025, the price traded above the orange EMAs and found support there multiple times. This is shown at the blue arrows.
This trend carried the price for a good six months, until it dropped below for the first time in November 2025. The October 10 candle is disregarded here. That was a news-related shock that occurred just before market close on Friday and was immediately reversed the following Monday.
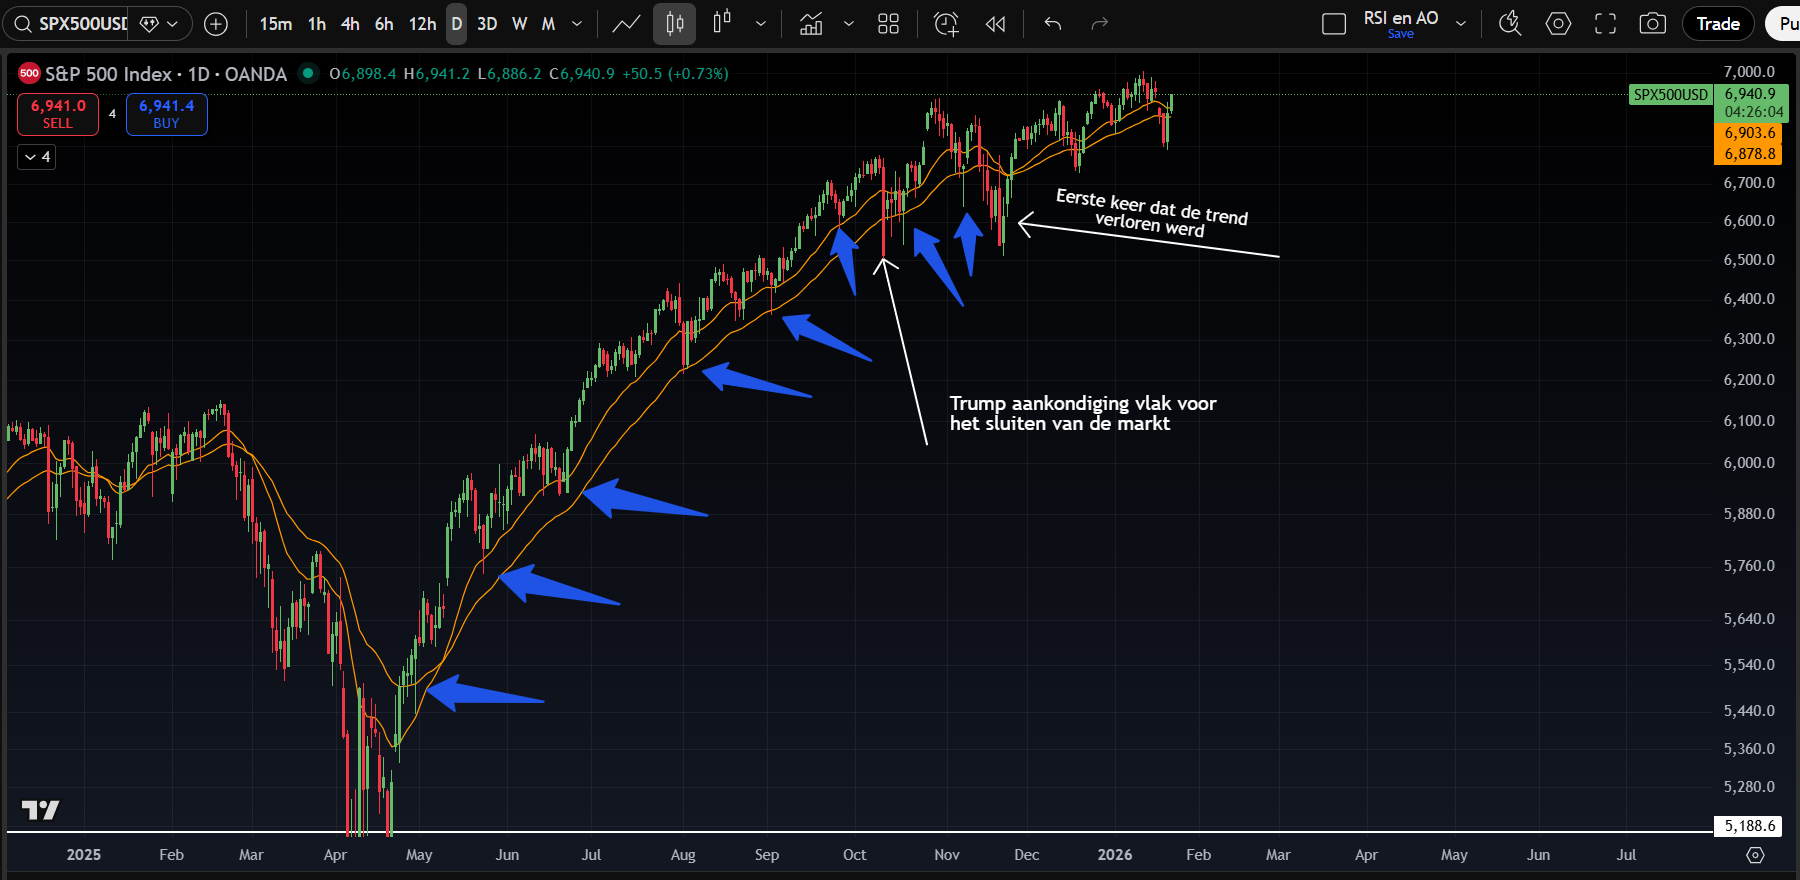
The bears rightfully point out that the trend since November has been much weaker and less respected as support. Additionally, market structure on the daily chart was also broken last Tuesday, which is why their expectation is that we'll form a lower high.
A scenario with a high probability of playing out is that the price moves sideways for a while between the green lines shown in the image below. A new all-time high would refute the bears' arguments above.
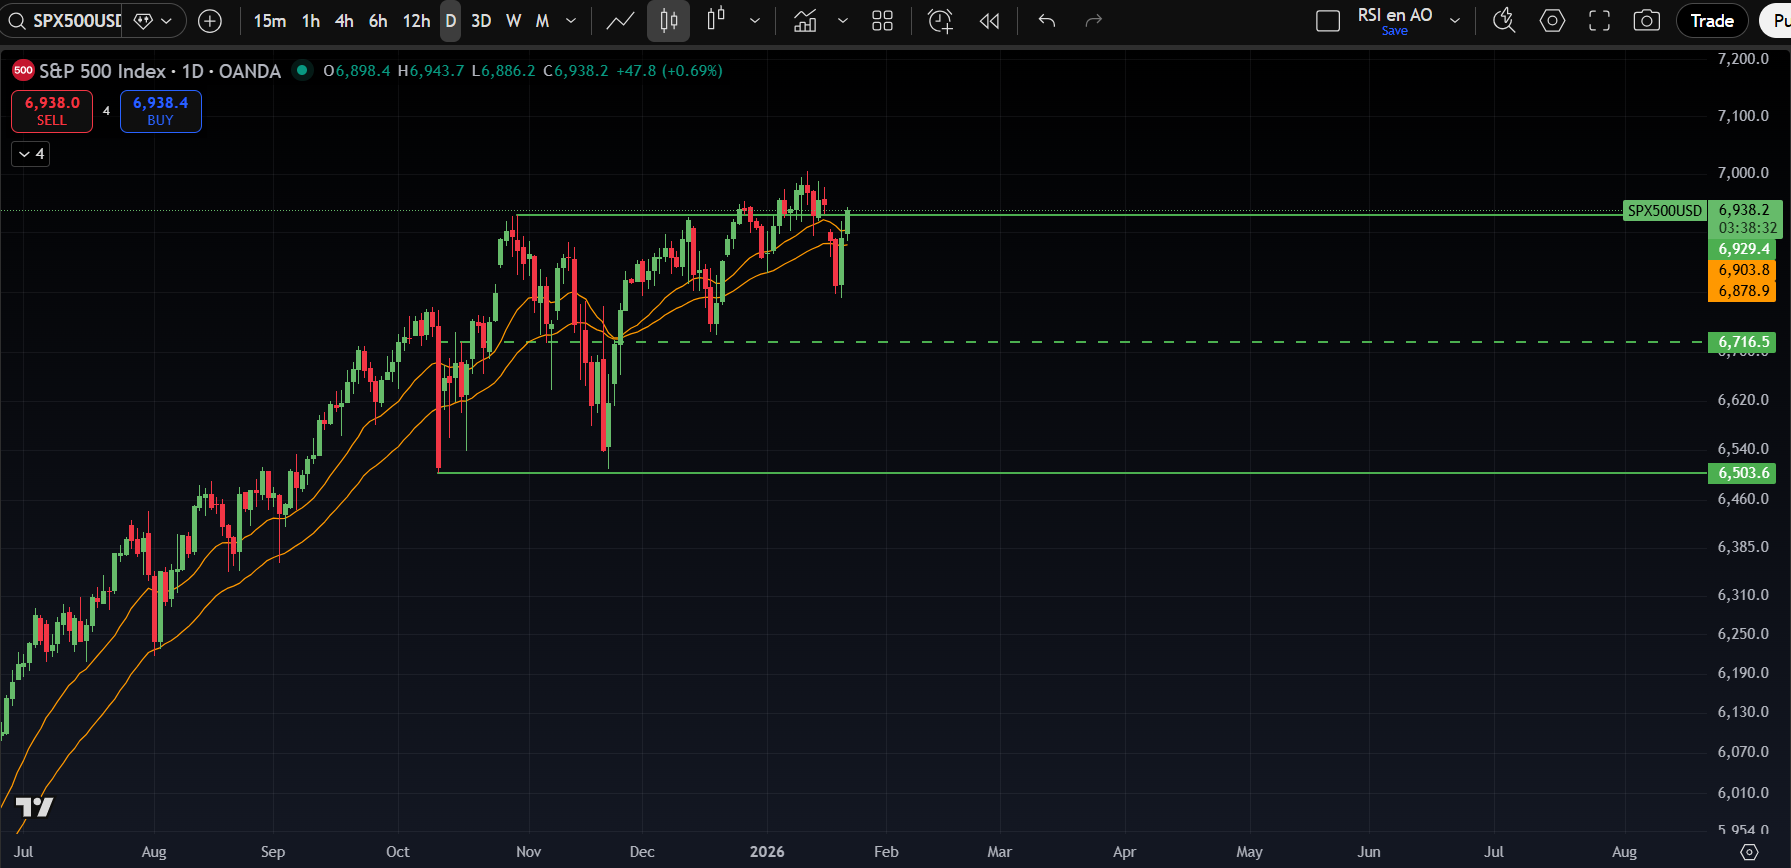
The bulls base their case on the fact that no lower high has been formed yet, and therefore the upward trend remains intact. Additionally, at the time of writing, the price is "simply" back above the orange EMAs.
The conclusion is that both camps have valid arguments and that we're at a crossroads. The wind direction for bitcoin is tied to the turn the stock market takes. A new all-time high keeps the tailwind intact. A rejection around these levels creates selling pressure and probably a headwind. Whichever scenario plays out, we'll probably get clarity soon.
3️⃣ One last rally for bitcoin?
Thom
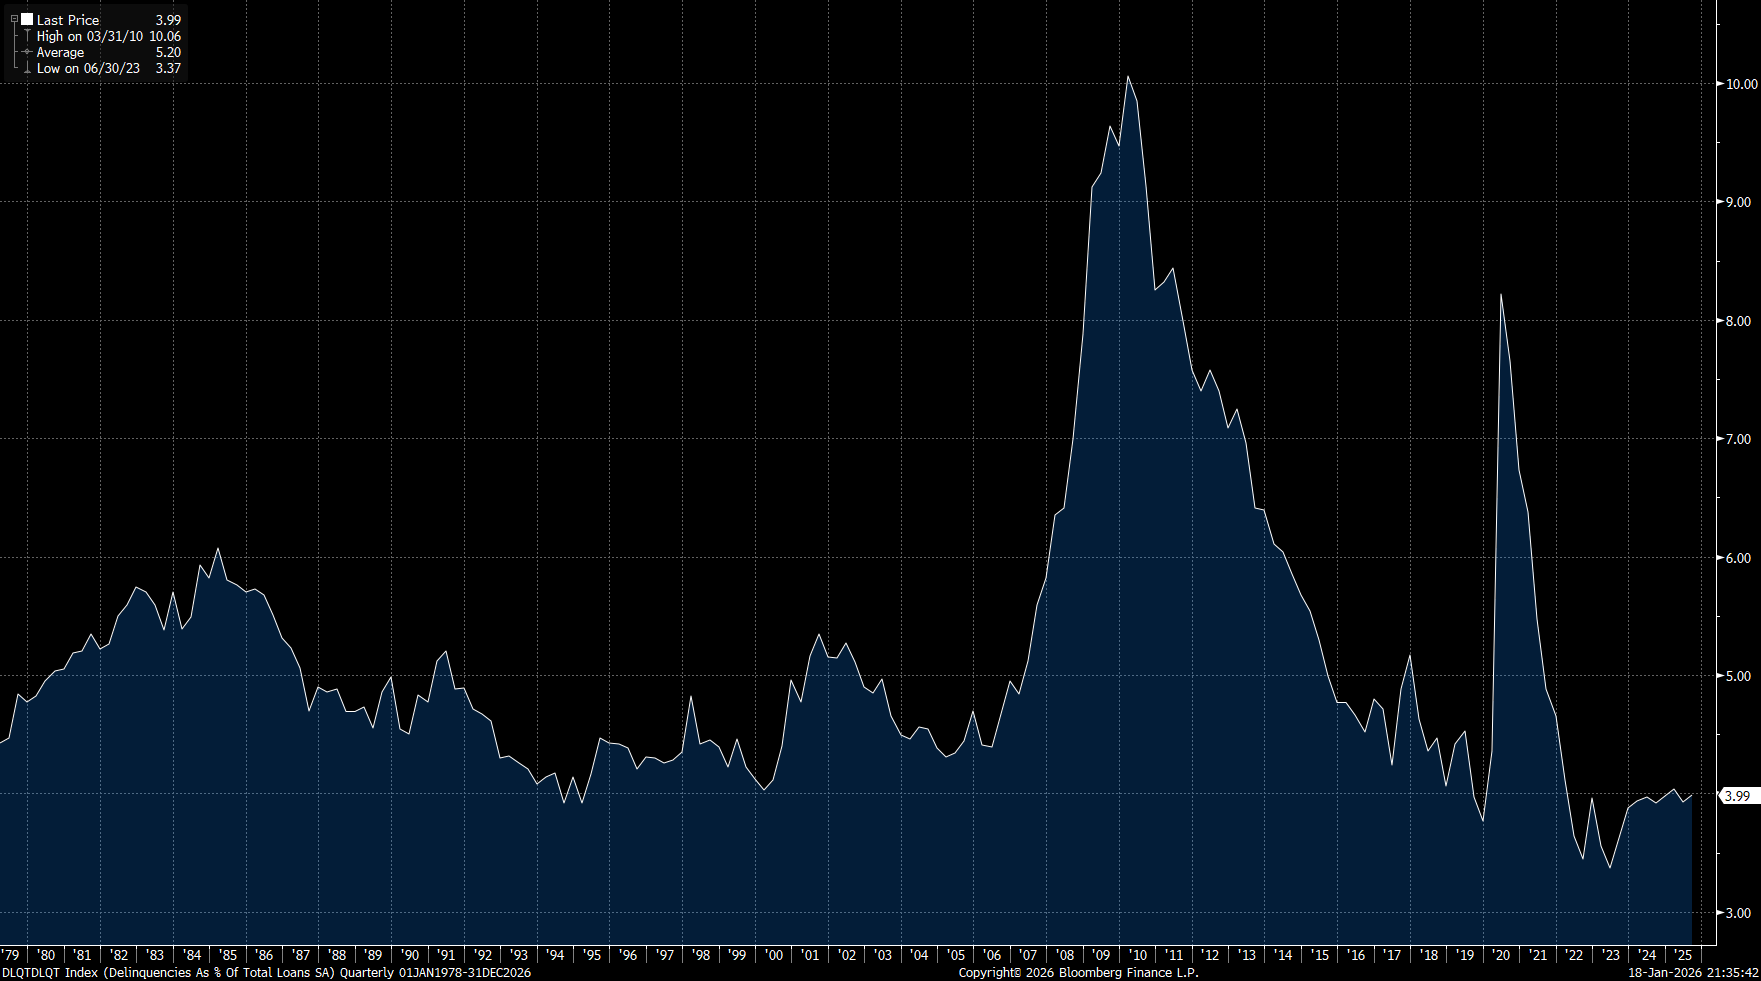
At first glance, macro-economic conditions paint an almost ideal backdrop for bitcoin. The US economy is growing above average, consumption remains resilient, inflation continues to move lower, and the labor market is cooling less severely than previously feared.
On top of that, interest-rate-sensitive companies are gaining ground and the number of bankruptcies has dropped to its lowest level in years. Under such circumstances, you'd normally expect a strong performance from bitcoin. Instead, the recovery has been limited. Although the price managed to bounce from the bottom around $80,000, convincing optimism and real momentum are still lacking.
Bitcoin's weakness may well be the result of rising real rates. These are inflation-adjusted interest rates, which have risen considerably over the past months. Rising real rates act as a brake on global liquidity, because money becomes more expensive and scarcer.
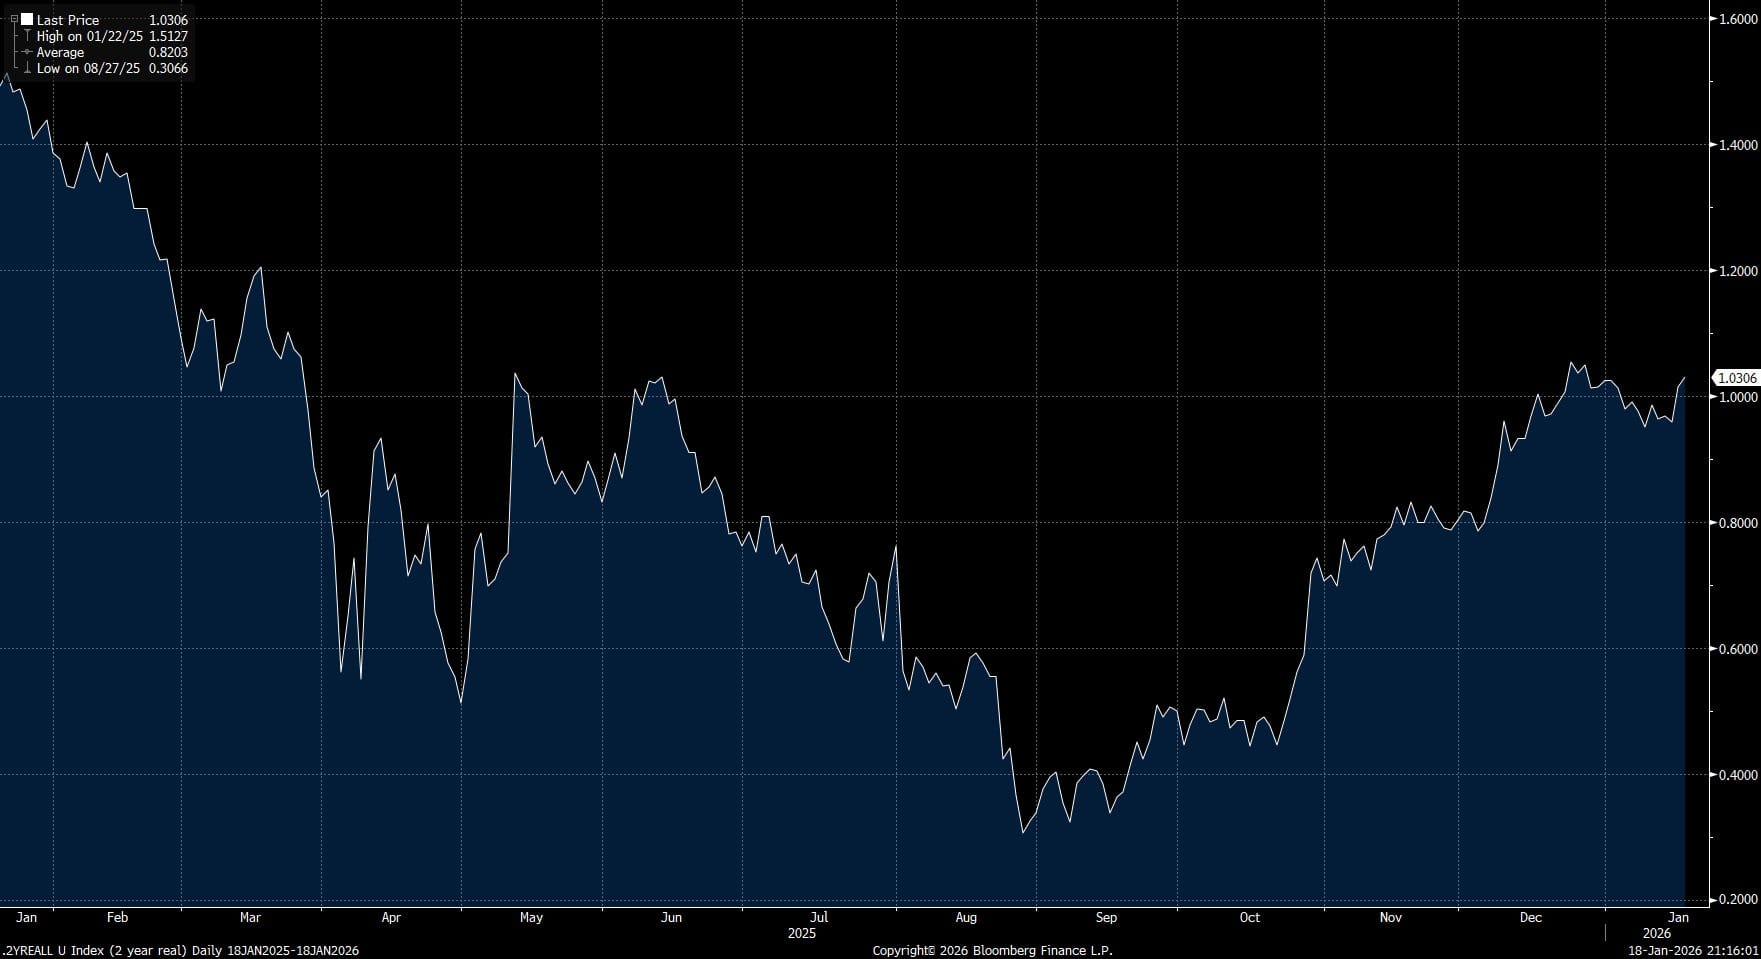
Real rates could be close to a turning point. The market has a tendency to view prevailing conditions as structural and simply extrapolate them. We see that reflected in expectations now: for 2026, markets are pricing in slightly less than two rate cuts by the US central bank.
That can change suddenly. The combination of rapidly fallen inflation expectations, tentative signs of cooling in the labor market, and real rates that are now high enough to further weaken that labor market, makes it likely in my view that the market will eventually price in more rate cuts.
When that happens, the gap between short-term rates and inflation expectations narrows. Real rates then fall, which typically gives a boost to global liquidity. In that scenario, liquidity can once again play the role of catalyst, and that's precisely where the next potential driver for the bitcoin price may lie.
4️⃣ Greenland exposes Achilles' heel of the US economy
Thom
The turmoil surrounding Greenland has triggered a resurgence of the so-called 'sell America' sentiment in financial markets. Wall Street stocks corrected sharply, US Treasuries came under pressure, and the dollar also gave up ground. Investors hate uncertainty, and precisely this market reaction makes it unlikely that Trump can follow through on his threats.
At first glance, this market turbulence seems far removed from the daily lives of American households. "The stock market is not the economy," is a common refrain. Yet it's worth asking whether that distinction is still as clear-cut today.
Conflict situations, like the Greenland dispute, can directly impact the US economy because it has become increasingly dependent on high stock prices on Wall Street. Never before has the share of stocks in American households' financial wealth been so large. According to figures from the US central bank, the share is even higher than during the dot-com bubble around the turn of the millennium.
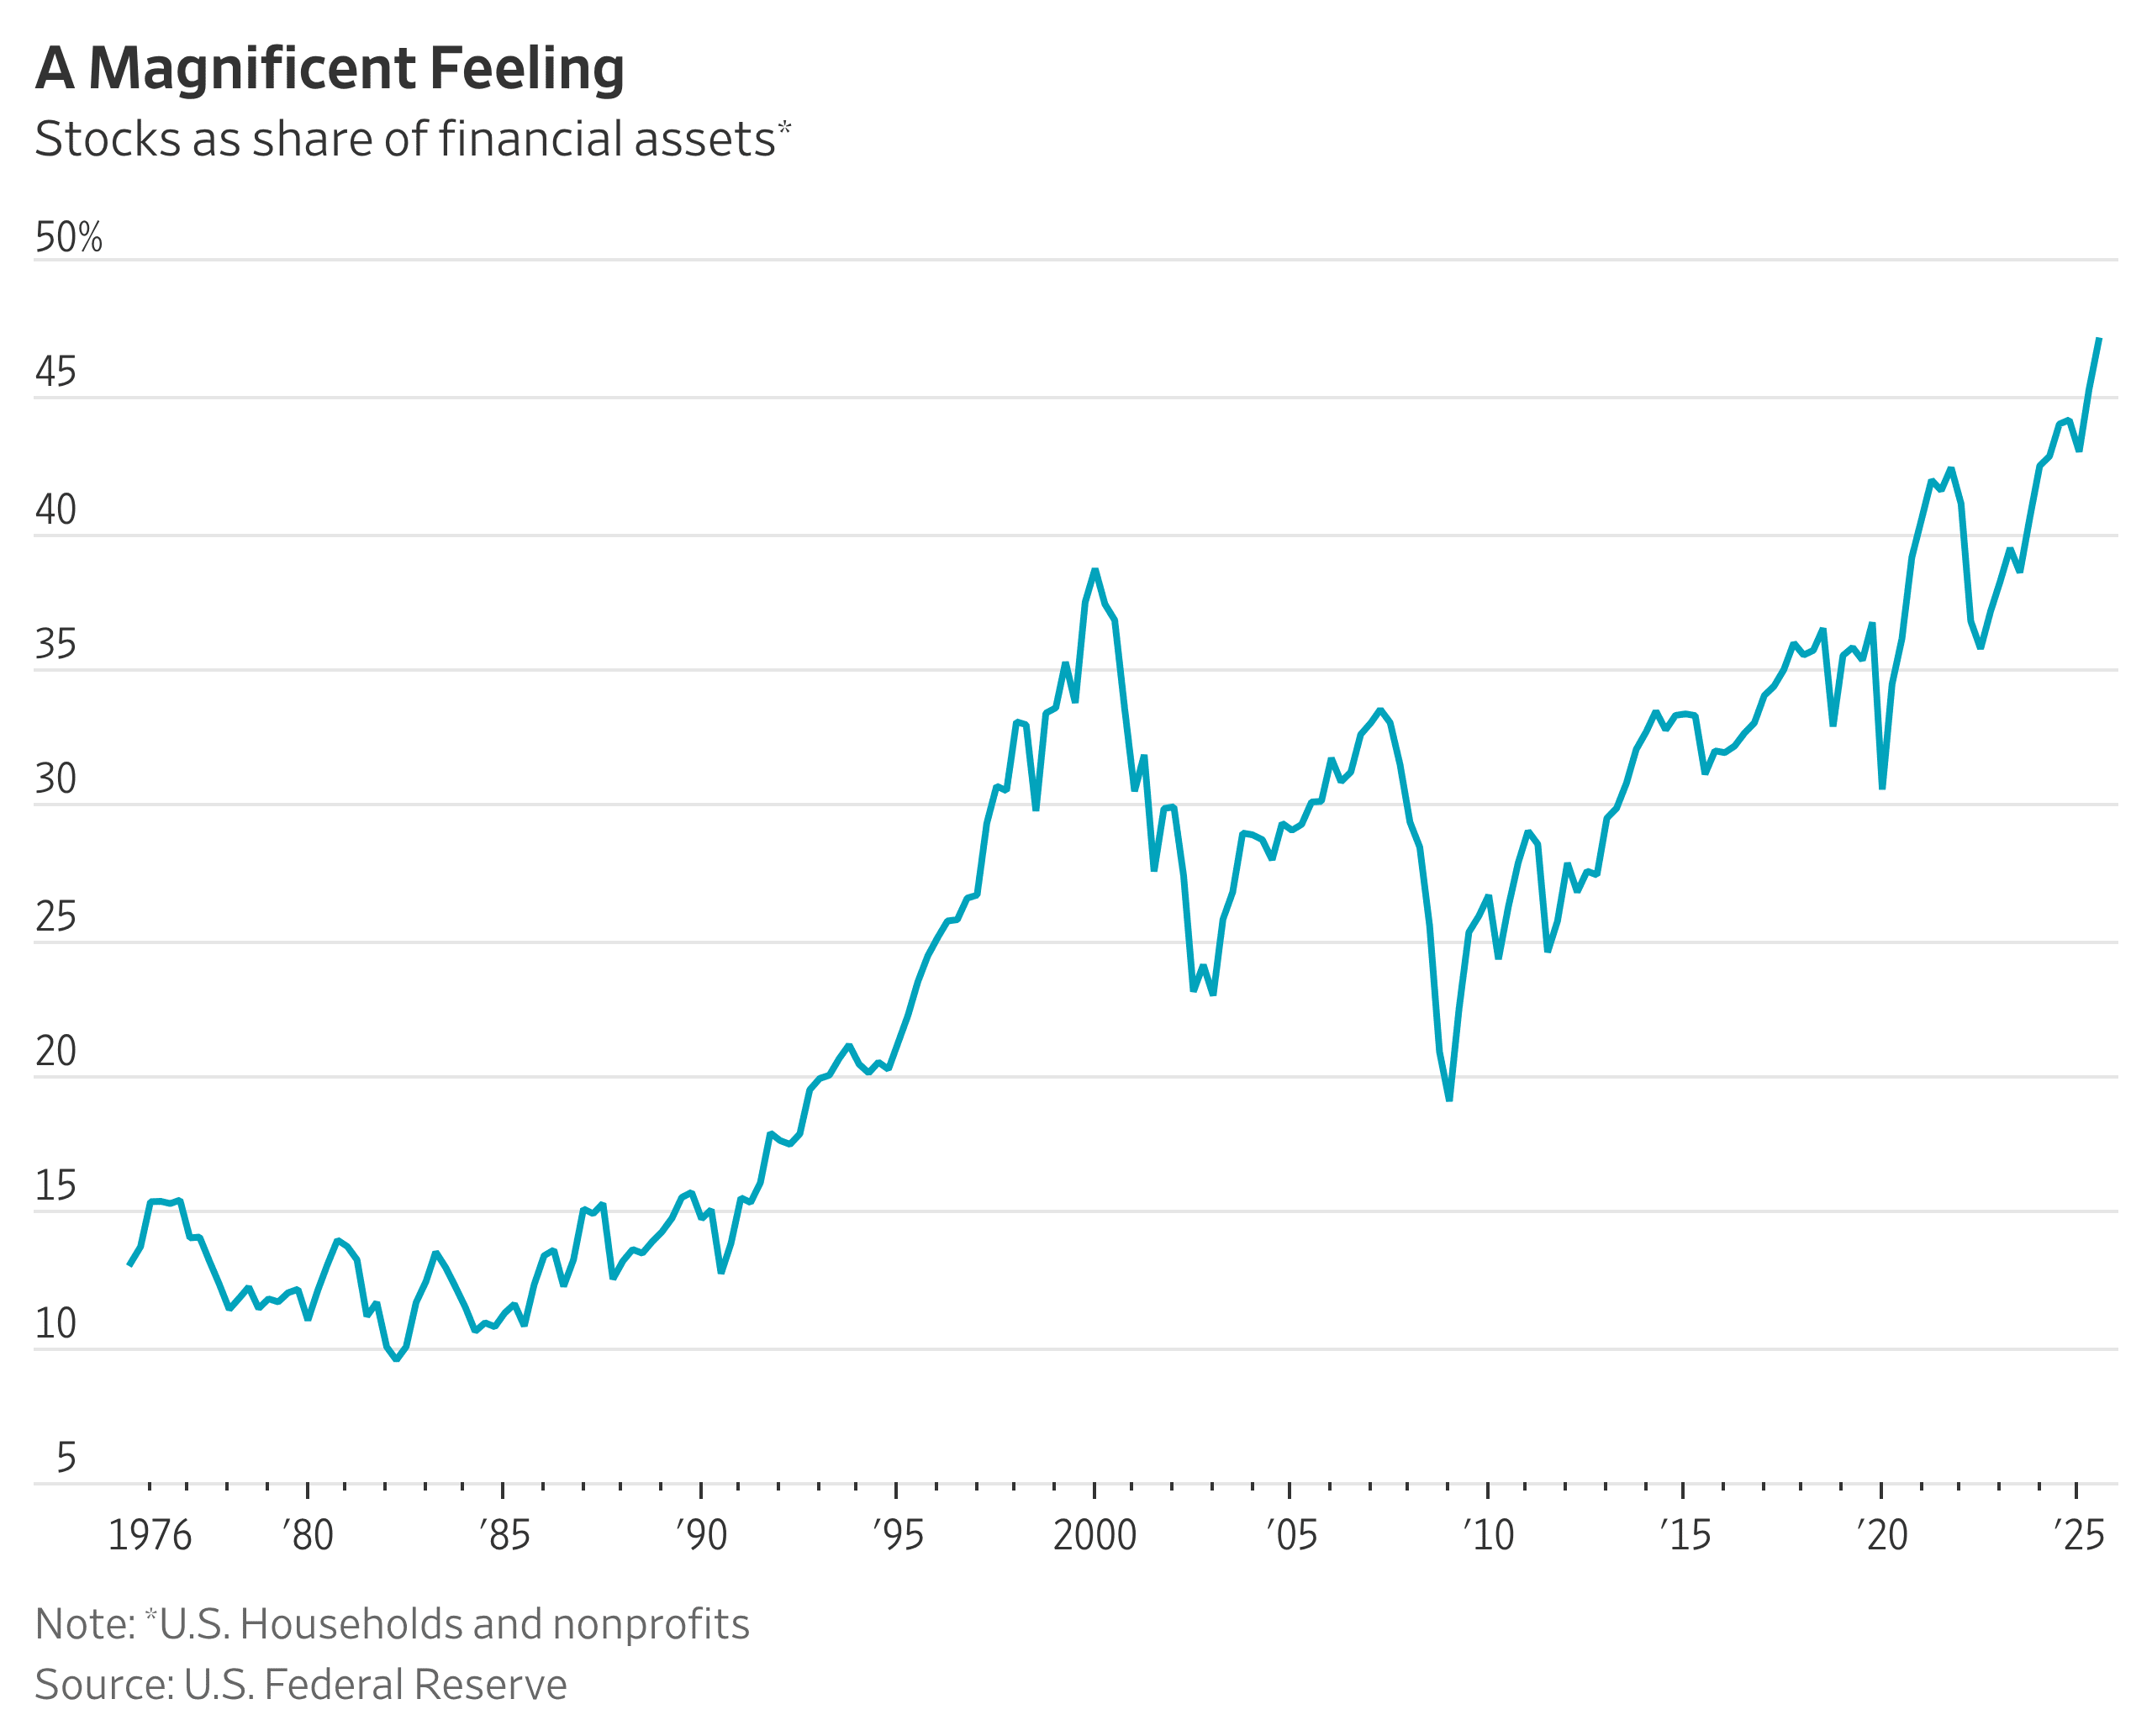
This makes the US economy extra sensitive to stock market movements. Higher income groups play a key role here. Approximately 50% of total consumption in the United States now comes from the wealthiest 10% of households.
This group holds a large portion of its wealth directly in stocks. That means falling stock prices aren't just paper losses. They hit the confidence of consumers who are precisely responsible for a large part of economic growth. Less confidence often translates into postponed purchases: no new car, no big trip, fewer luxury expenses.
It's important to place this within the broader framework of the so-called K-shaped economy. Higher income groups benefit disproportionately from rising stock prices, real estate values, and other financial assets. Lower incomes, on the other hand, primarily feel the higher cost of living and often have little to no buffer to fall back on.
As long as Wall Street rises, the upper echelon of the economy keeps consuming, and that group acts as a crucial pillar supporting US growth. But the moment stock prices come under sustained pressure, that support crumbles. That's precisely why Donald Trump, with issues like the Greenland dispute—especially if it were to escalate further—may have inadvertently exposed the Achilles' heel of the US economy.
In closing
All previous editions of Alpha Markets can be found in the archive. Questions, comments, and suggestions are always welcome in the community.
Thank you for reading!
To stay informed about the latest market developments and insights, follow our team members on X:
- Bart Mol (@Bart_Mol)
- Peter Slagter (@pesla)
- Bert Slagter (@bslagter)
- Mike Lelieveld (@mlelieveld)
We appreciate your continued support and look forward to bringing you more comprehensive analysis in our next edition.
Until then!