Middle Eastern Tensions Weigh on Crypto Markets
Middle East tensions escalate: Israel strikes Iranian nuclear sites, sending oil prices surging and crypto markets into a tailspin. Bitcoin fell 7% in days and ETH's rally was shattered. Is this the calm before a market storm?

TRUMP: SOMETHING MAY HAPPEN SOON IN THE MIDDLE EAST
(Thursday, June 12 at 6:41 PM)
It was hardly surprising. Israel had announced its strike on Iranian nuclear targets, and there were plenty of signs that something big was about to unfold in the Middle East. Oil prices surged while pizza stands near the Pentagon were working overtime.
Risk asset prices had been under pressure all day Thursday. Despite strong macroeconomic data and optimistic discussions about the negotiations between China and the US, both the stock and crypto markets were sliding.
Around midnight, bitcoin was at $106,000 – roughly 4% below Wednesday’s local high of $110,400. When Israeli missiles were launched at 2:00 AM, the price fell to $103,000. That’s a 7% drop in just a day and a half.
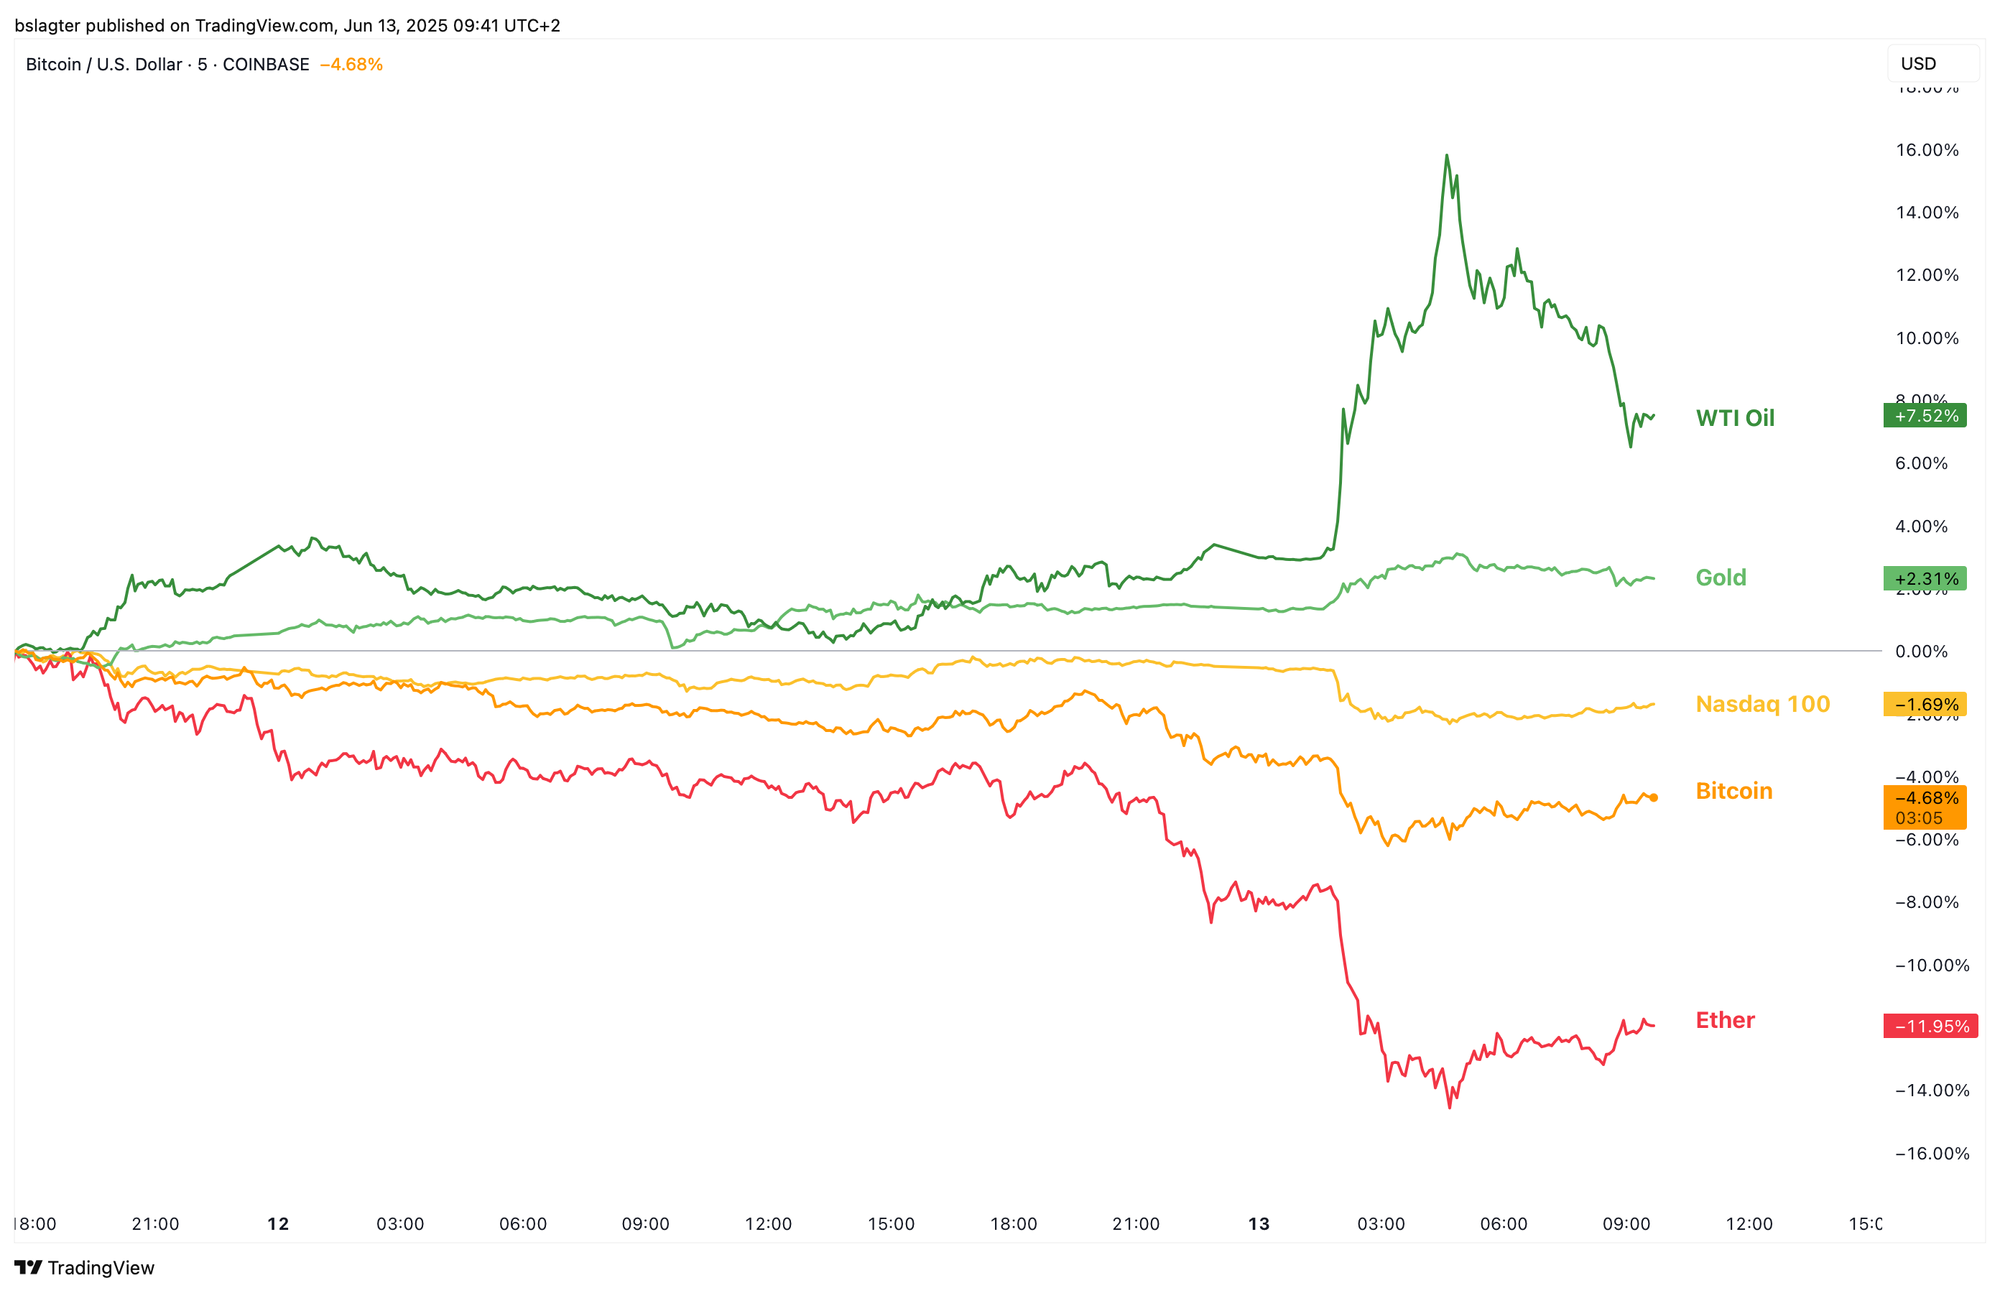
The rest of the crypto market took an even bigger hit. For ETH in particular, this geopolitical shock came at an inopportune time. The second-largest asset had just begun a careful recovery after years of struggle, with sentiment improving and inflows into spot ether ETFs gaining real momentum.
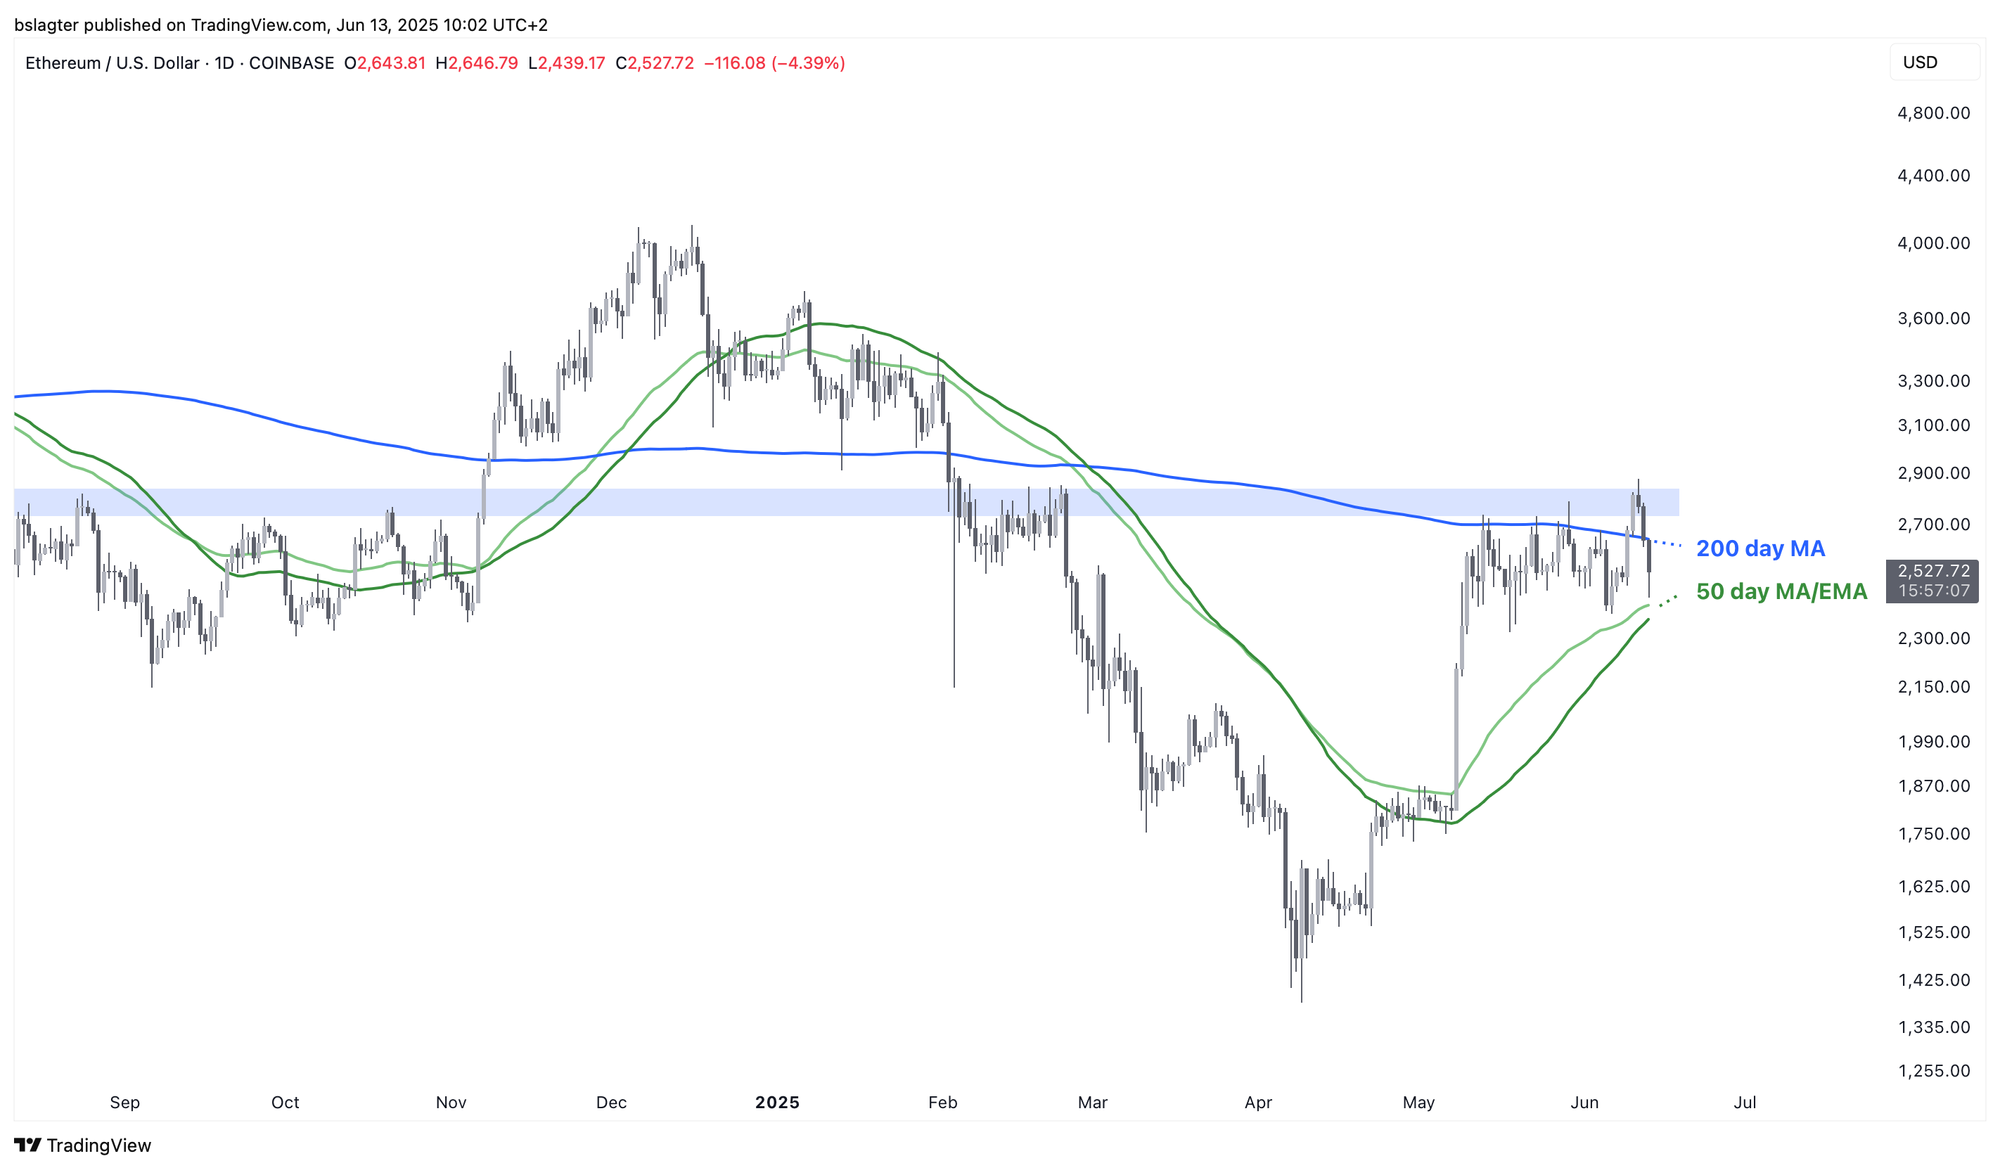
For several weeks, the price of ether had been fighting to break through the $2,800 barrier and its 200-day moving average. This week, it finally looked poised to break out, surging above the 200-day average and climbing well past $2,800 on Wednesday. Was this ETH’s moment?
Not quite. The conflict between Israel and Iran pushed ether down by around 15%, from $2,880 to $2,440 – sending it back below the horizontal zone, trapped between the 50-day and 200-day averages.
Typically, long-term trends and cyclical forces set the direction in financial markets. The day’s news is really just background noise – barely noticeable when you look at the chart. In such cases, it makes sense to focus on macroeconomic data and technical analysis.
Occasionally, however, an event occurs that drowns out all other signals – a shock that renders all analysis moot in an instant. One example is the turmoil with the Japanese yen last August, when bitcoin’s price dropped 25% in four days, only to nearly recover its losses within the next four days.
The situation in the Middle East has the potential to trigger a similar shock. For example, if Iran were to block the Strait of Hormuz, oil prices could soar above $100, leading to higher inflation and increased pressure on economic growth.
And that’s just one way this conflict could spiral out of control. What was once considered a remote risk is now a realistic scenario that can’t be ignored.
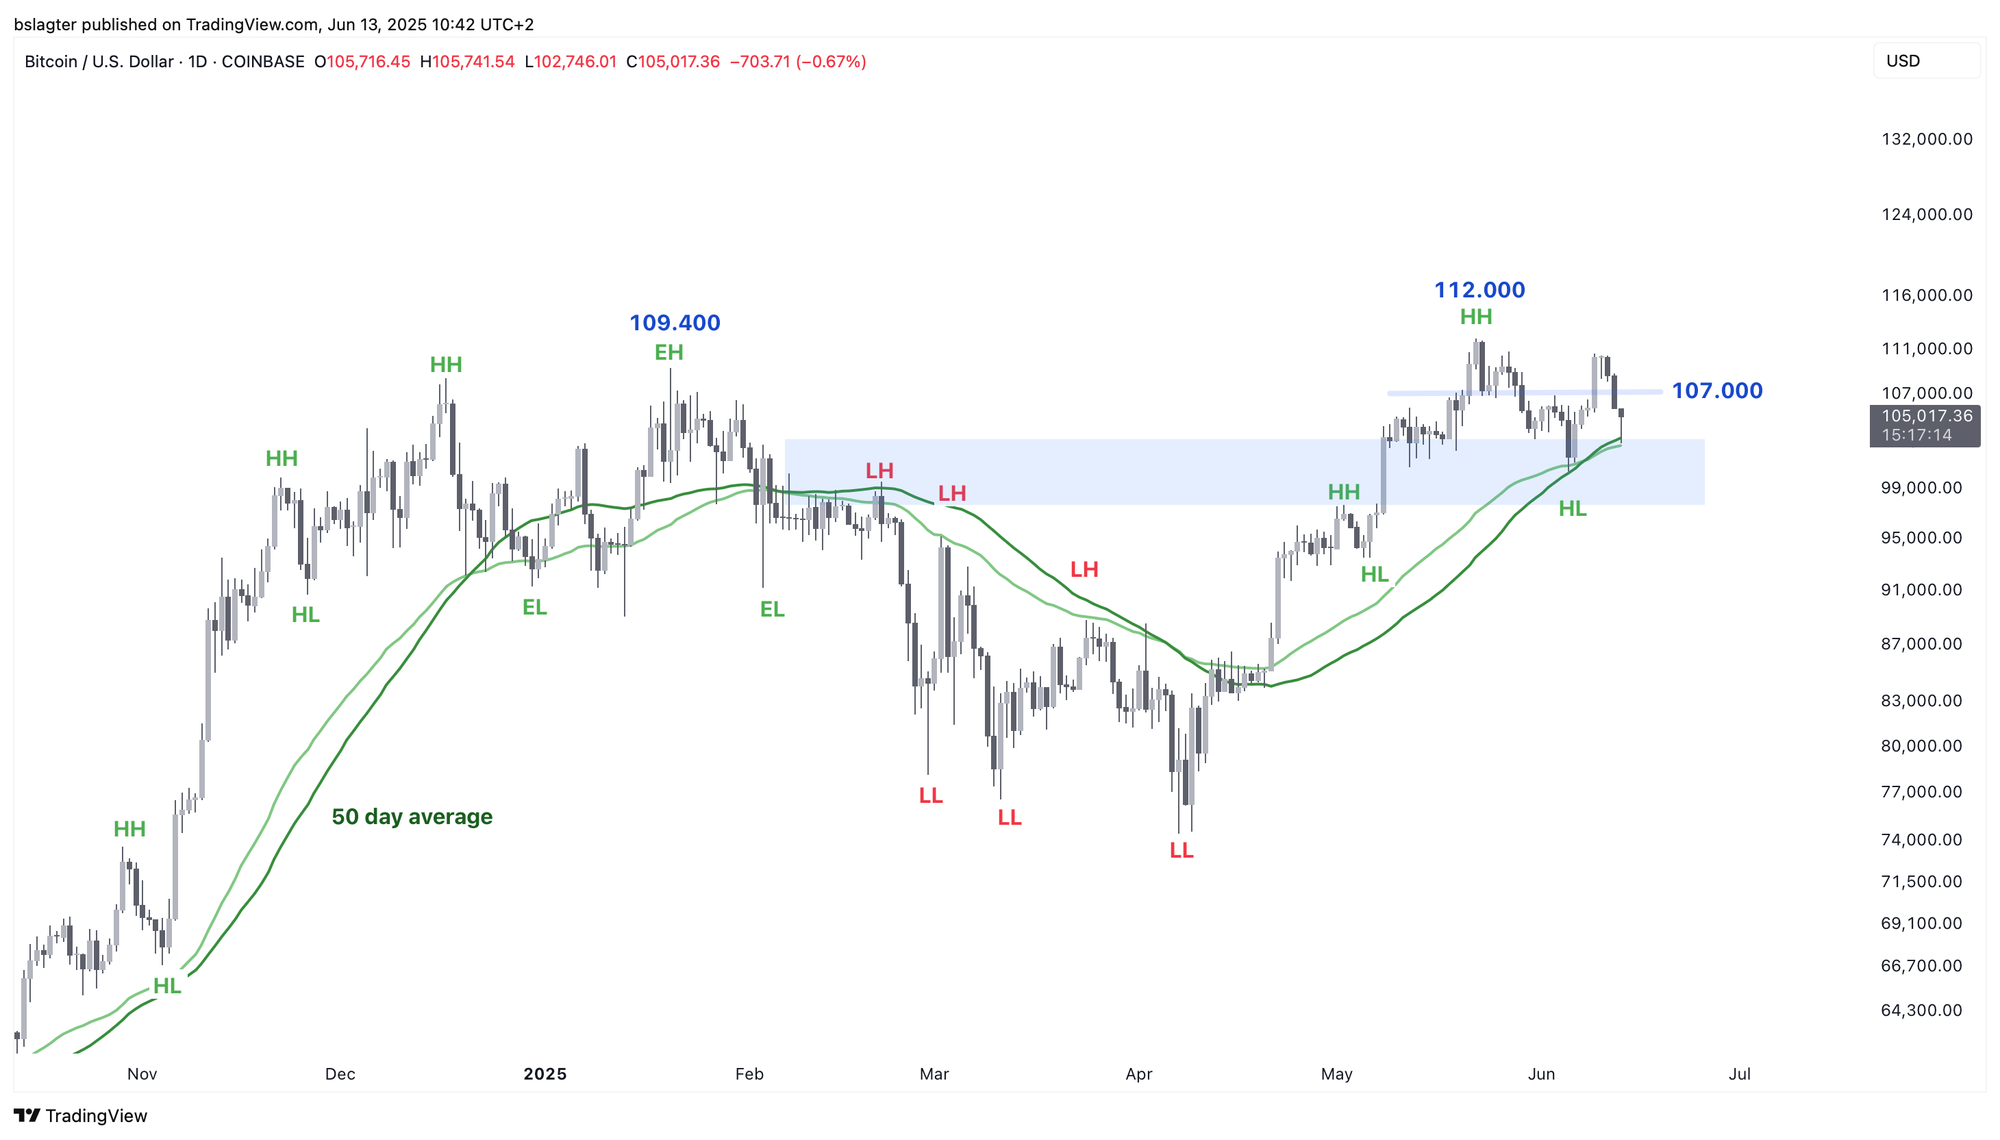
The best case would be if the unrest doesn’t spread further. In that scenario, bitcoin has tested its 50-day average and remains above the daily cycle low from June 5. The crucial threshold of $107,000 will need to be reclaimed, but that shouldn’t be an issue since nothing fundamentally has changed for bitcoin.
If that holds, it stands to reason that ETH will get another chance to demonstrate its strength – likely accompanied by a range of altcoins.
However, it would be unwise to count on that. According to Israel, this is just the beginning of the offensive, which is expected to last for days. If bitcoin’s price falls below $100,000, the outlook for the coming months could worsen, breaking the pattern of higher highs (HH) and higher lows (HL).
It’s too early to draw definite conclusions. In these uncertain times, it pays to be cautious and wait until the picture becomes clearer.
We continue with the following topics for our Alpha Plus members:
- Is the daily cycle in danger?
- Dr. Copper Goes Off Course
- Strong signal for the S&P 500, good for bitcoin
1️⃣ Is the daily cycle in danger?
Bert
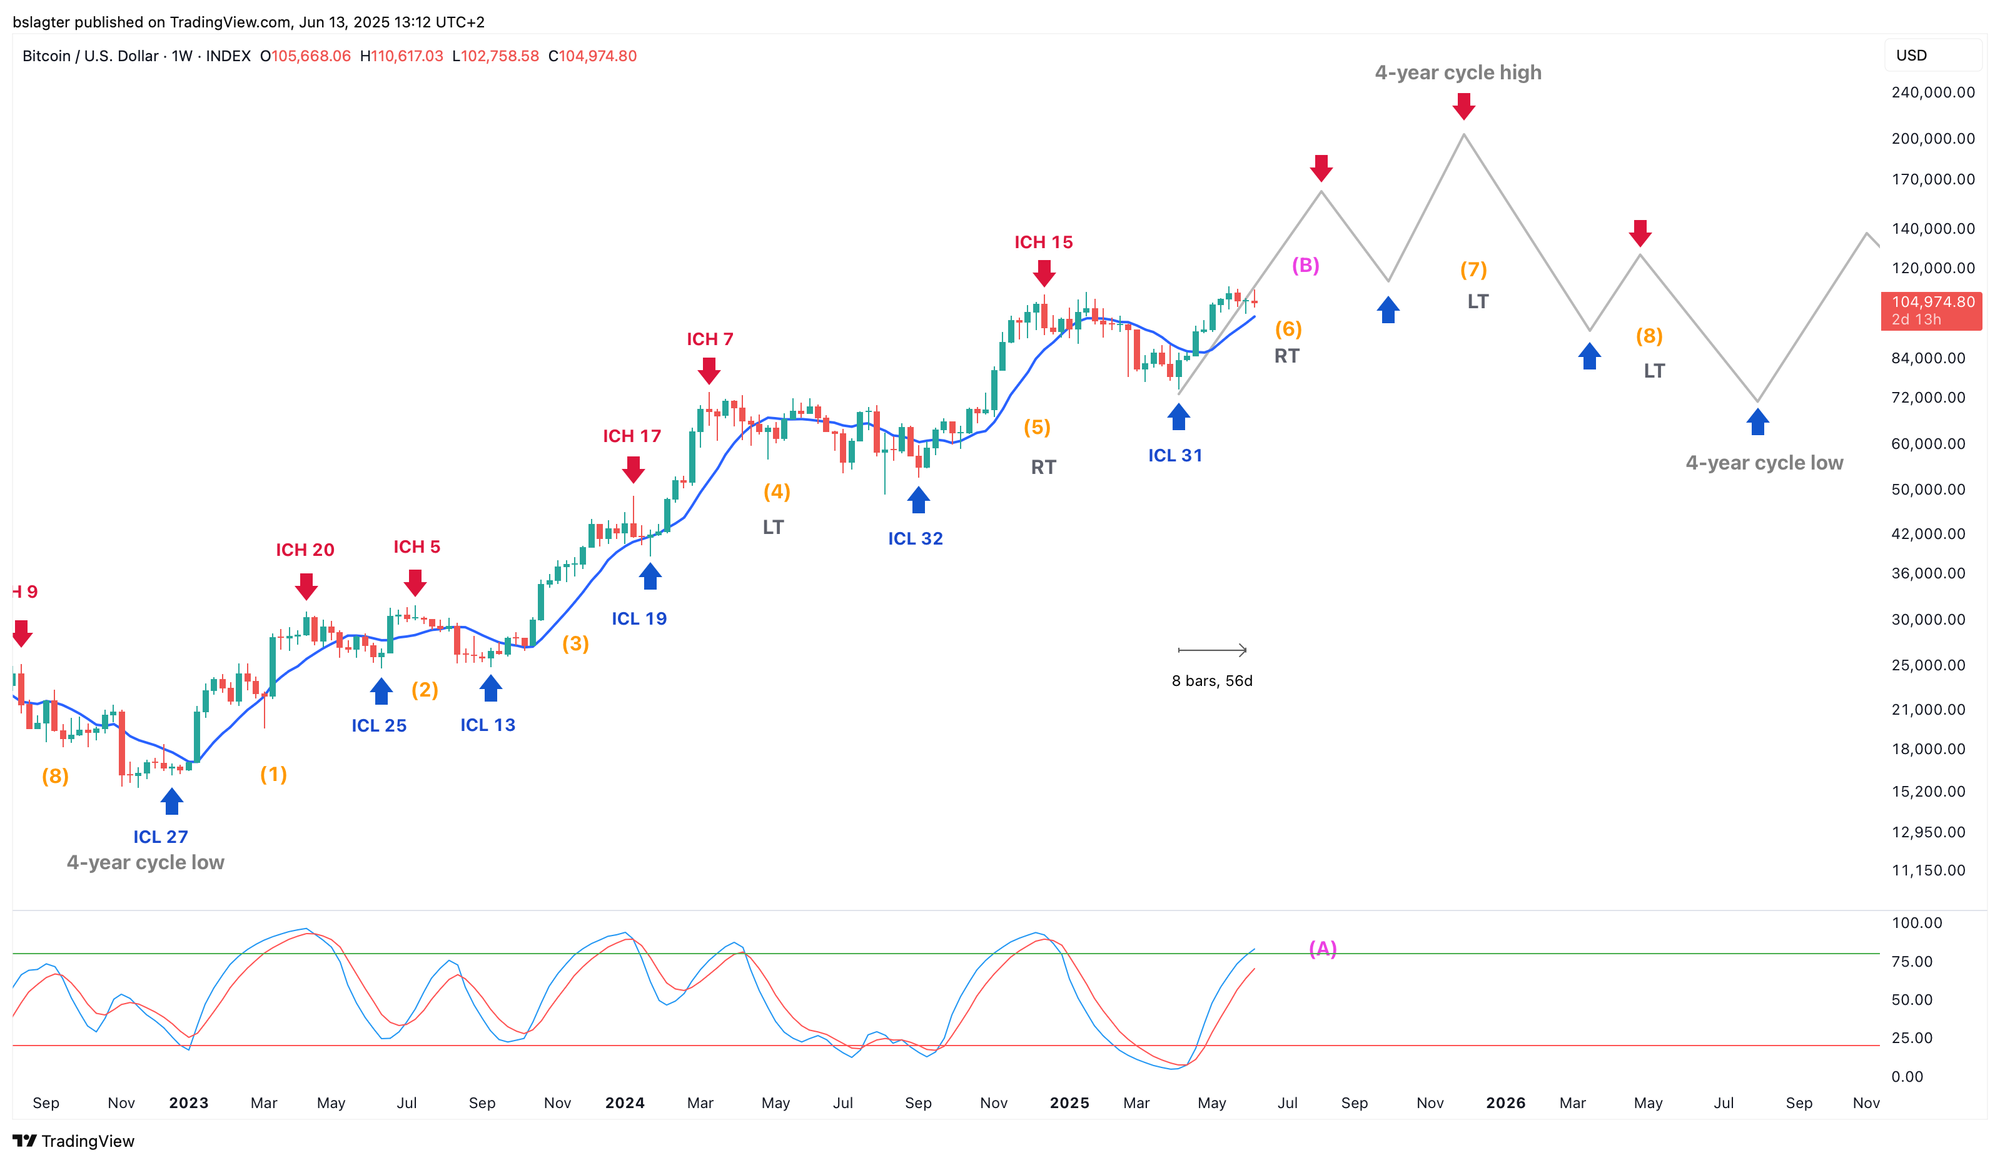
Last week in Alpha Markets, there was uncertainty over whether the $100,300 low on June 5 truly represented the daily cycle low (DCL).
If this was indeed the DCL, then it’s checkmate – great news for the bulls. We would then begin the second daily cycle of this weekly cycle on a strong note, and under these circumstances, that cycle is usually very bullish.
On Monday, June 9, we received strong confirmation. The price surged well above both the 10-day average and the horizontal level of $107,000. The momentum indicator picked up and the average edged higher, making it seem as though a new all-time high was within reach.
However, the price stalled at $110,700 before beginning a gradual decline, slipping back below the 10-day average – a typical sign of weakness early in the daily cycle.
Now, with a clearly identifiable external shock in play, we can’t immediately dismiss this daily cycle. Nonetheless, some damage has been done to the prospects of a smooth run above $130,000.
From a cycle analyst’s perspective, it’s now crucial to remain above the DCL of $100,300. Falling below that level would mark the cycle as 'failed', and we would expect the next DCL to be even lower. A good example is the final daily cycle of the previous weekly cycle (see chart A).
This could signal the start of another summer consolidation phase – a period where prices trade sideways, for example between $90,000 and $110,000.
But let’s not get ahead of ourselves. This second daily cycle is only 8 days old and has plenty of time to recover from the setback. If we stay above $100,300, there’s little cause for concern. However, dropping below that level would require a rapid recovery and a strong V-shaped rebound to prove it was only a temporary dip.
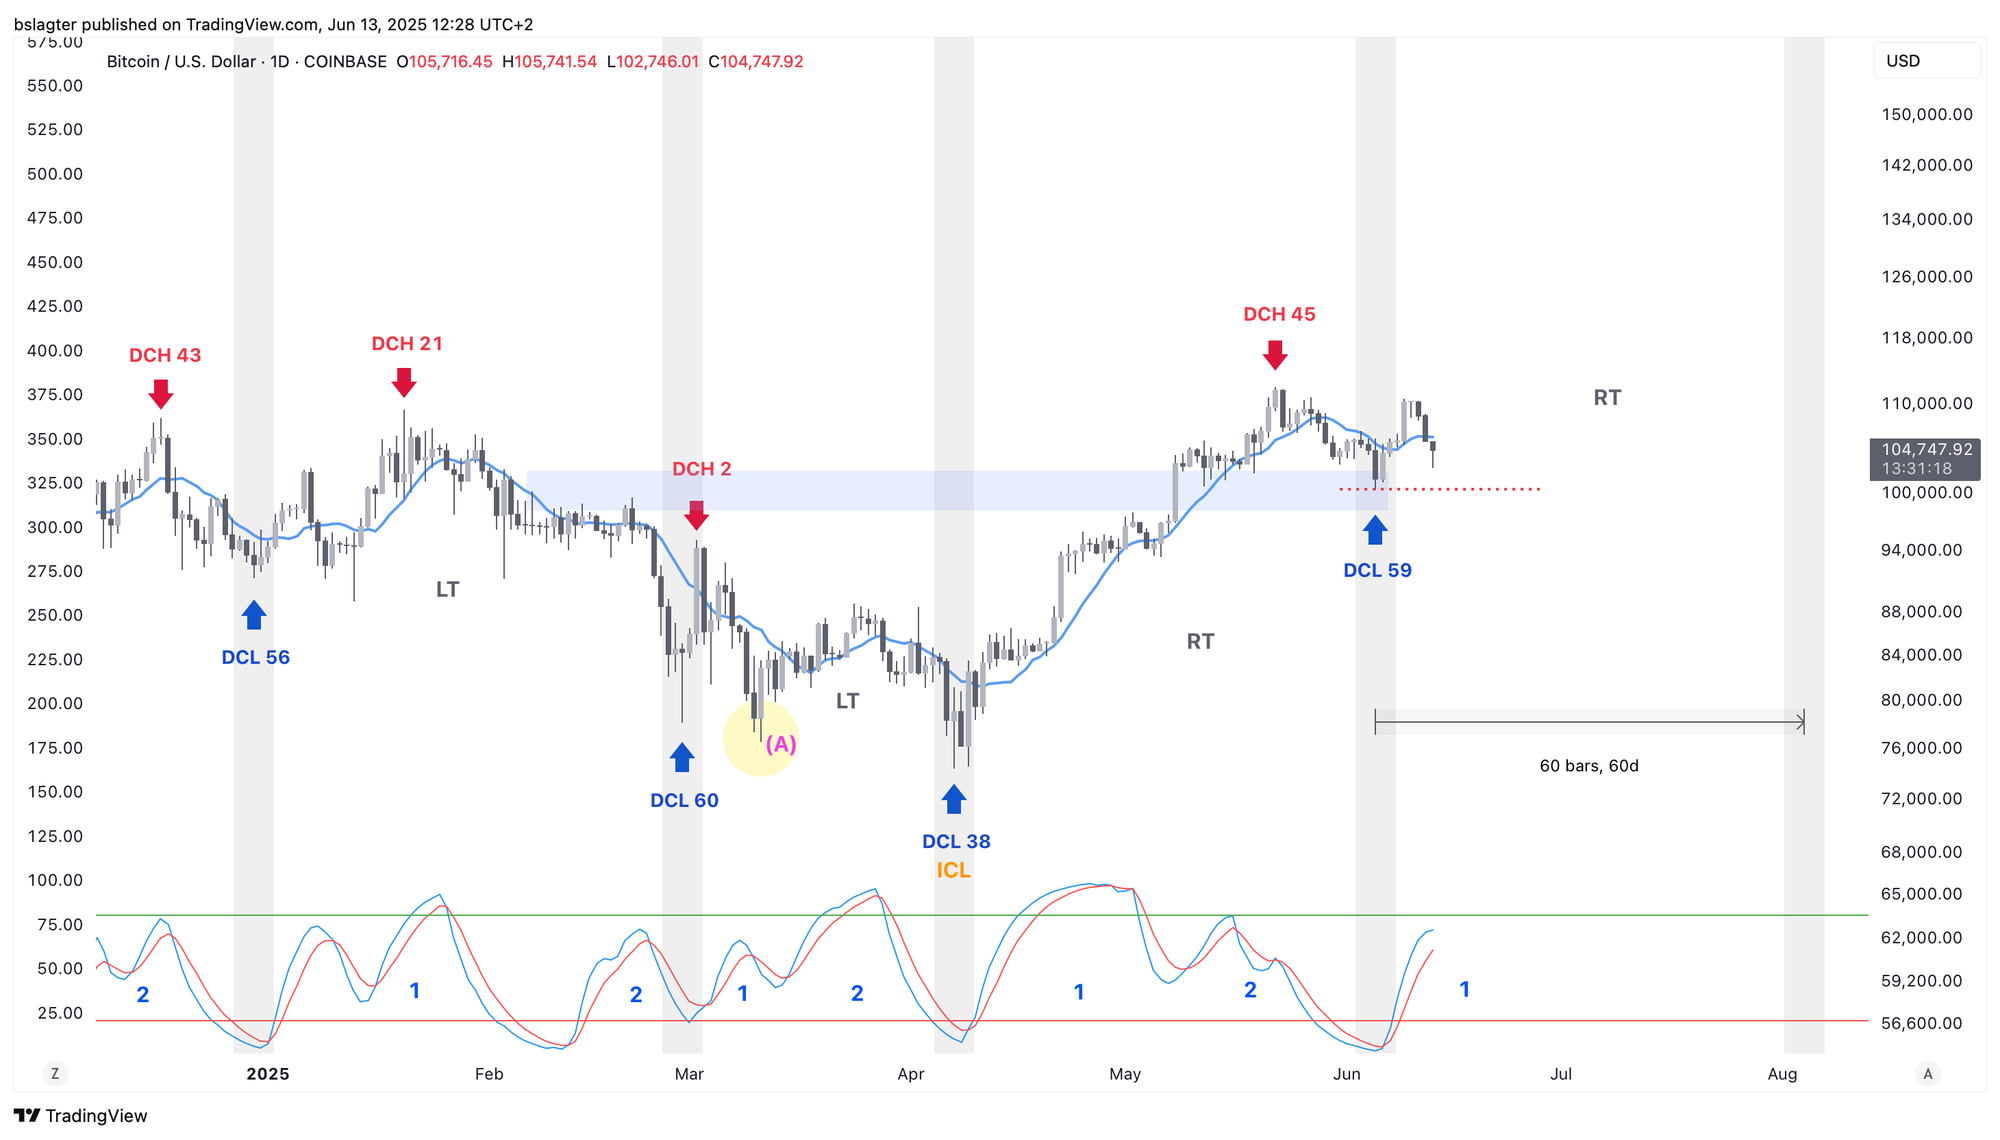
At this stage in the weekly cycle, most of the upward gains are still expected – and we have ample time for that, as indicated by both the oscillator (A) and the price (B). In other words, an upward stall for a week isn’t a disaster.
A weekly close below the 10-week average – currently at $99,000 – is typically a signal that the weekly cycle’s downward phase has begun. Until that happens, everything still appears in order according to the weekly chart.
2️⃣ Dr. Copper Goes Off Course
Thom
The ratio between copper and gold is gradually increasing, which is generally good news for risk assets. Copper, a widely used industrial metal, often sees a price rise signaling increased economic activity, while gold is viewed as a defensive asset during uncertain times.
Historically, every bitcoin bull market was accompanied by a rising copper-to-gold ratio. However, in recent years this correlation has broken down – bitcoin surged while copper continued to decline relative to gold.
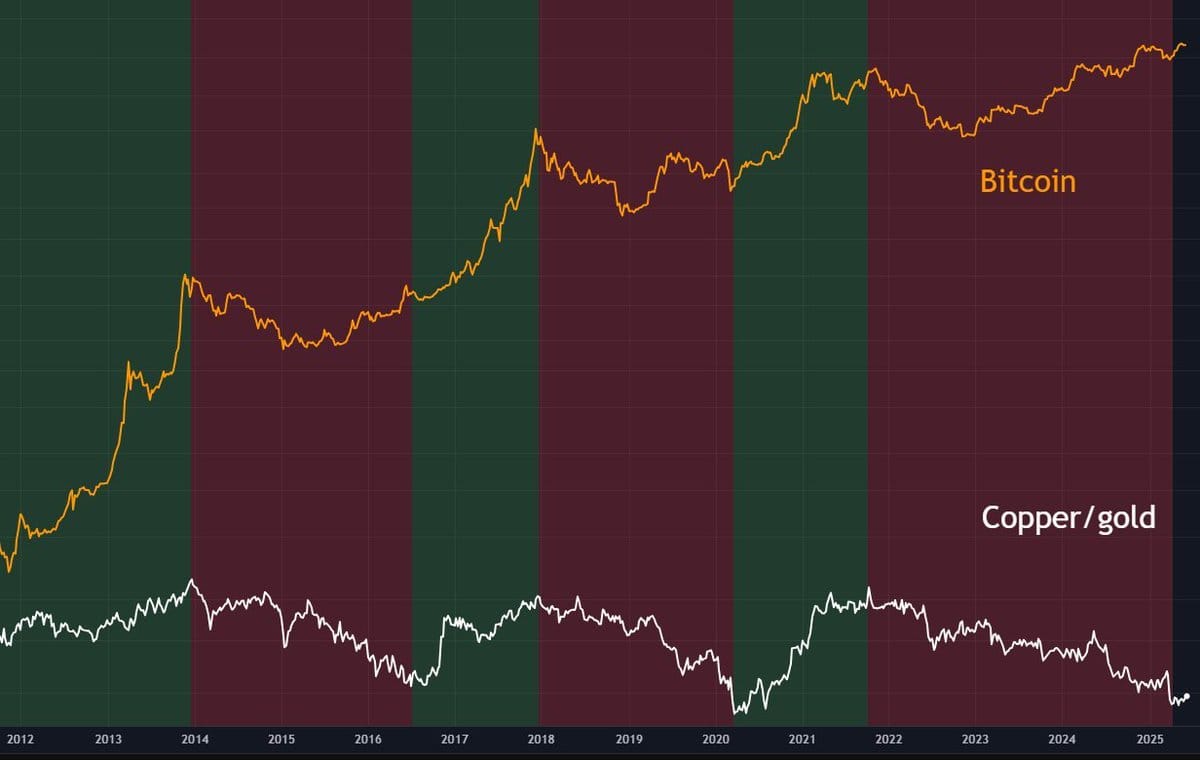
This shift may be attributed to the so-called China effect. As the world’s largest consumer of copper, China’s weakened economy has dampened copper demand, while the longstanding tradition of accumulating gold as a safeguard has boosted gold’s appeal.
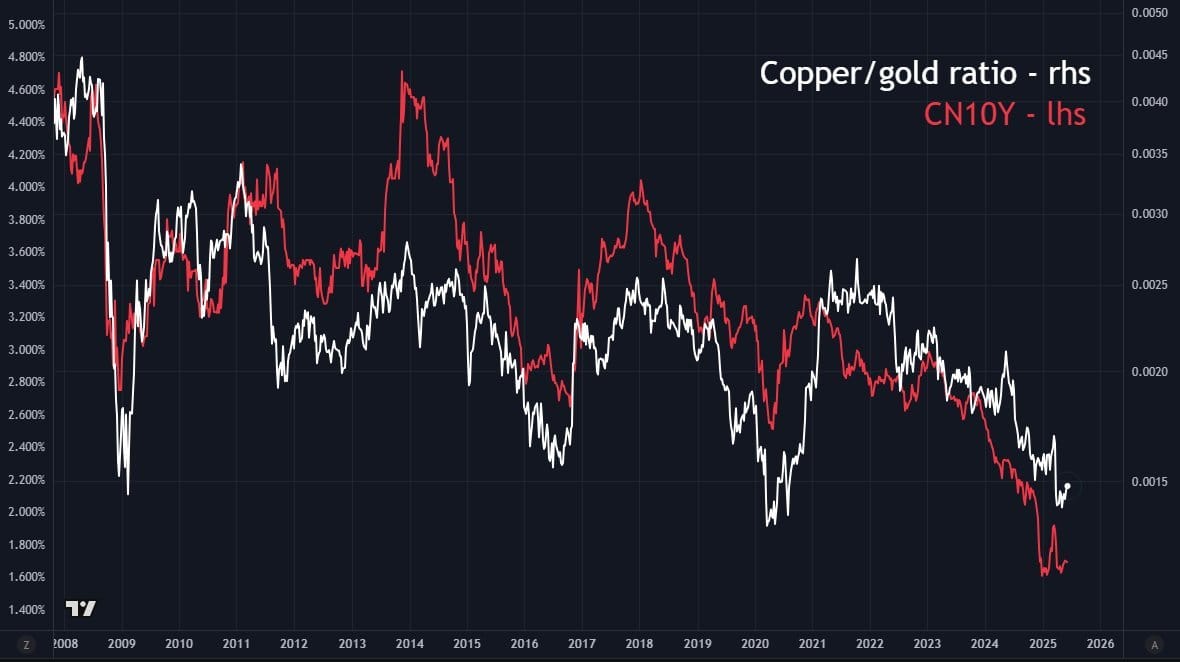
The slowdown in China’s economy is reflected in the yields on Chinese government bonds, shown in red in the chart below, which correlates with the declining copper-to-gold ratio.
Since late 2024, the 10-year yield in China has stabilized after the government injected $630 billion to stimulate the economy. If China’s economy rebounds, demand for copper is likely to increase while the appetite for gold is expected to drop.
Copper is worth watching, as it often reacts early to signs of economic growth – sometimes even before other indicators. Although this is by no means a guarantee, it serves as an interesting signal of potential economic expansion.
In recent decades, governments and central banks have stepped in as soon as the economy showed signs of slipping – or the threat of recession emerged. With grand promises of artificial intelligence and robotics potentially enabling nearly unlimited production capacity, this might be the last moment major powers like the United States and China will tolerate a recession.
Numerous signals now suggest that we are on the brink of a new upswing in risk assets. My main concern, however, is the potential volatility of this bull market. Despite the positive tone in US trade talks, import tariffs remain at decade-high levels – and eventually, someone will have to pay the price.
3️⃣ Strong signal for the S&P 500, good for bitcoin
Thom
Along with the US economy looking solid—with historically low unemployment, no sign of a second wave of inflation, and a gradually easing trade war—momentum in risk assets is starting to deliver positive signals.
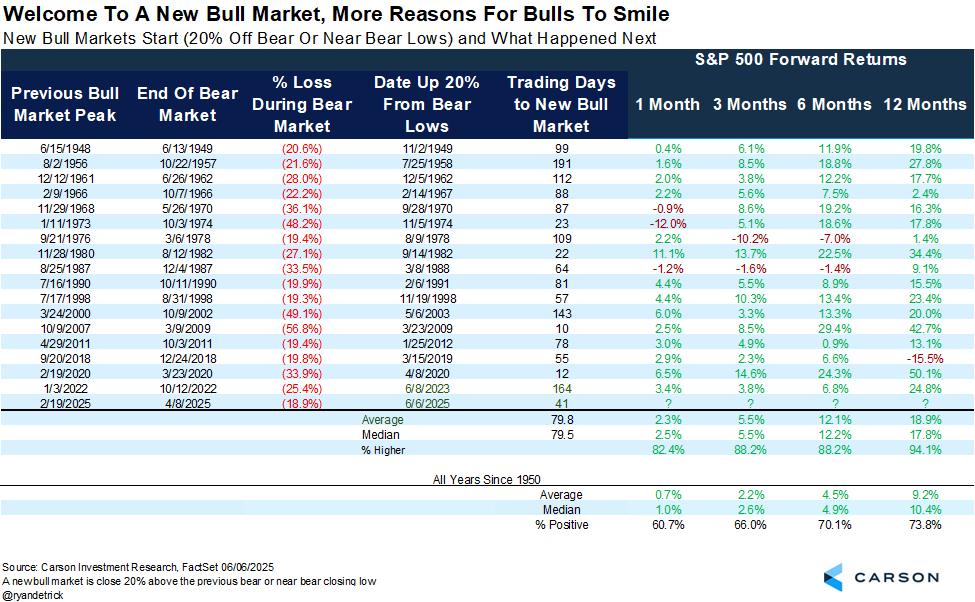
The S&P 500 is now more than 20% higher than its tentative low on April 8, after the index had nearly slipped into bear market territory (a drop of over 20%). According to data from Carson Investment Research, this bodes well for at least the next 12 months.
In 16 out of 17 cases, the leading US stock index was higher 12 months later, with an average return of 18.9%. The only exception was in the 12 months following March 15, 2019 – yes, the year before the pandemic. In March 2020, the market experienced a dramatic decline, and this signal missed its mark.
This illustrates that while no signal is foolproof, the overall message is clear: momentum in the financial markets should not be underestimated, and risk assets currently remain in a strong position.
Thank you for reading!
To stay informed about the latest market developments and insights, you can follow our team members on X:
- Bart Mol (@Bart_Mol)
- Peter Slagter (@pesla)
- Bert Slagter (@bslagter)
- Mike Lelieveld (@mlelieveld)
We appreciate your continued support and look forward to bringing you more comprehensive analysis in our next edition.
Until then!