How to Spot the End of a Bull Market
Last Friday’s crash sent Bitcoin tumbling from $126K to $104K amid Trump's fury over China. Has the bull market ended, or will a rebound follow? Meanwhile, gold soars as a $40B AI surge reshapes the market.

Last Friday evening, the crypto market crashed—a topic we discussed extensively throughout the week. On Saturday in Discord, Monday in the Alpha News, Tuesday in a YouTube video, and Thursday in the podcast.
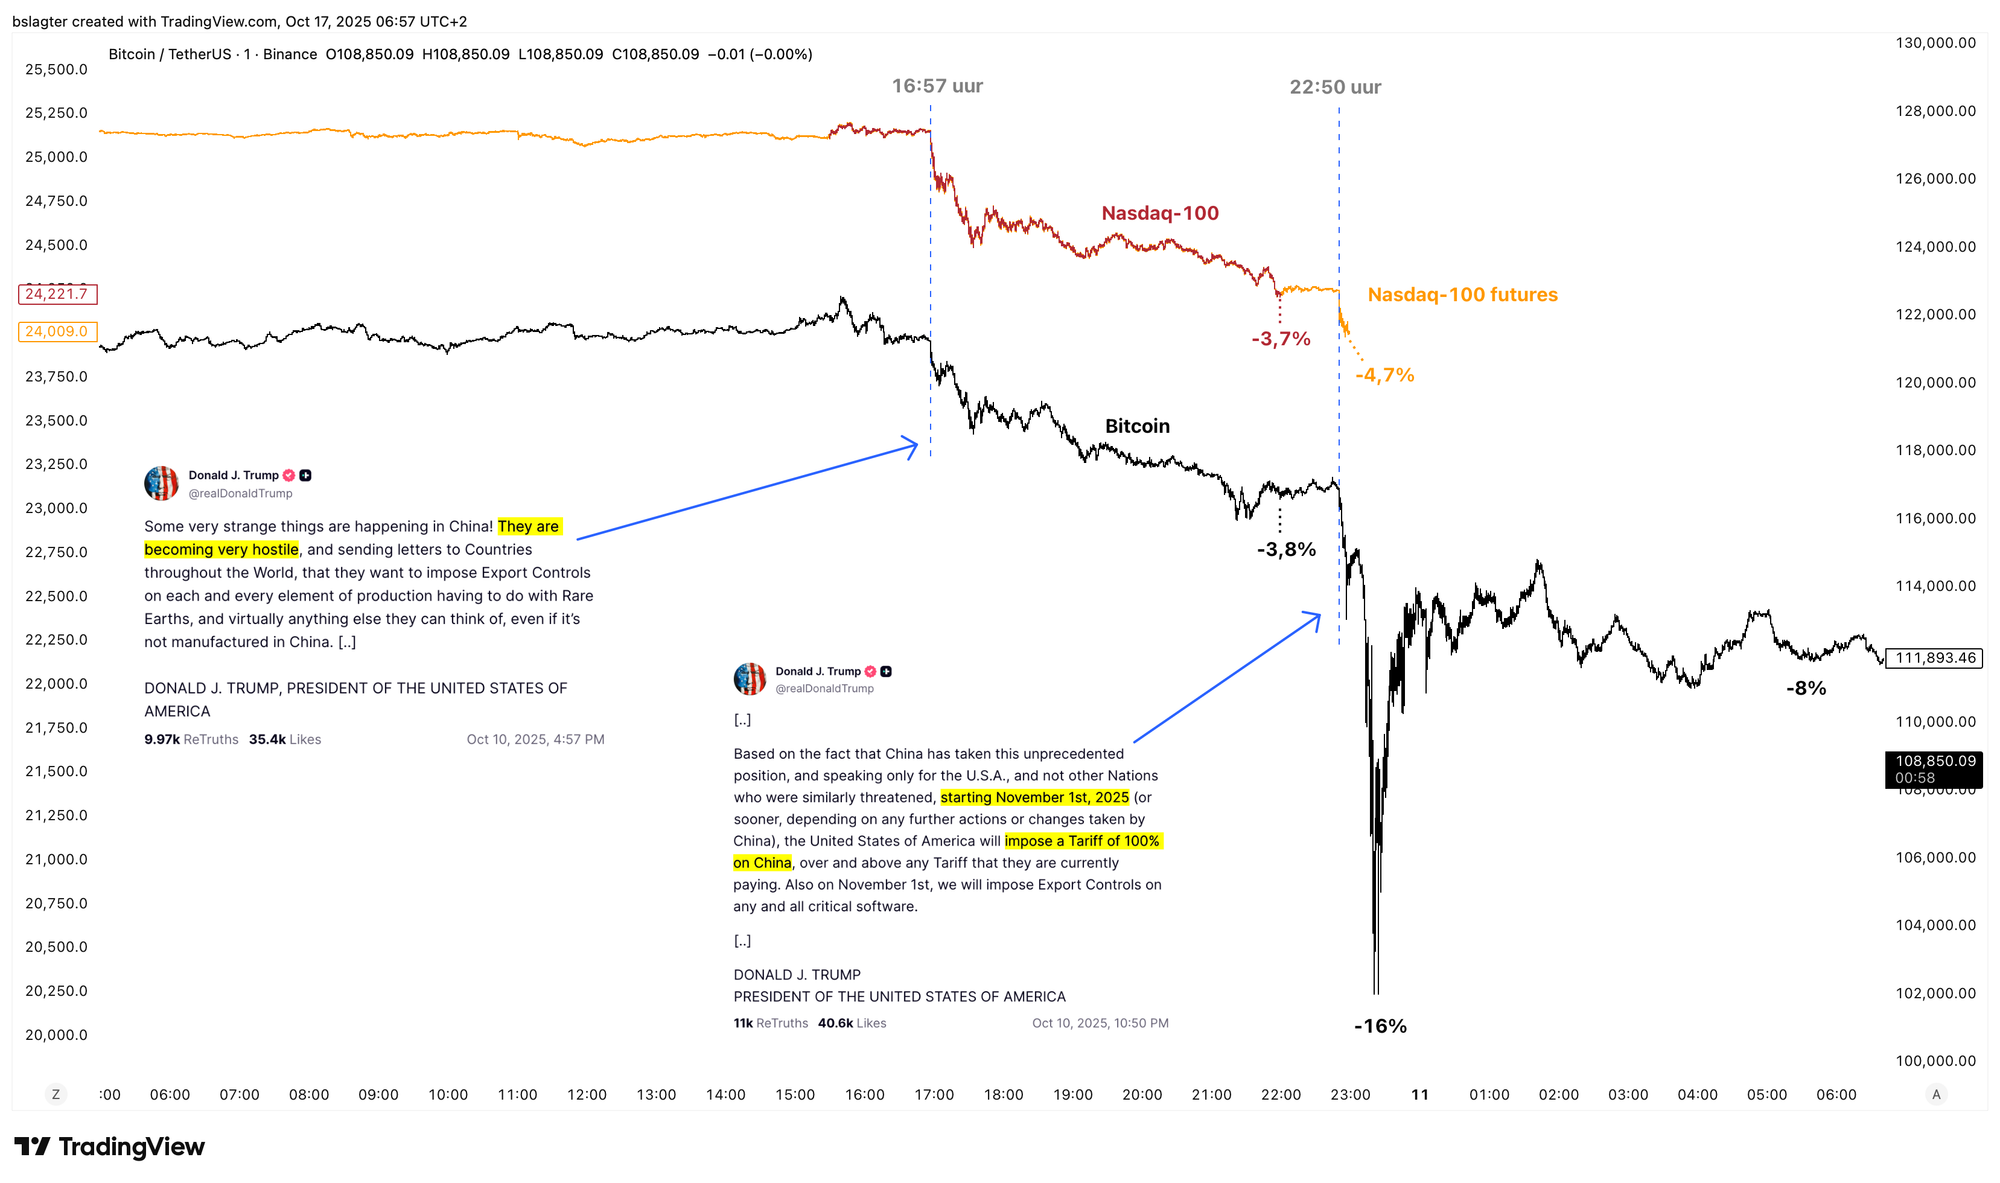
The chart below shows what happened on the evening and night of Friday, October 10th.
At 16:57 Dutch time, President Trump reacted furiously to China’s decision to restrict the export of critical raw materials. The American stock markets were still open, and the tech-heavy Nasdaq dropped by 3.7% amid the shock.
At 22:50, Trump posted on Truth Social, declaring that starting November 1st, the US would impose 100% import duties on Chinese goods. By that time, the stock market had closed, leaving only the futures market trading. That market dropped another 1%, and ten minutes later, it closed for the weekend. Only the crypto market remained open.
At 23:10, a chain reaction set in. Losses in the crypto market mounted, stop-loss orders were triggered, collateral for leveraged positions was liquidated, and the downward trend gained further momentum. The altcoin market, in particular, was hit hard, with some tokens losing tens of percent in mere minutes.
Over the weekend, a recovery followed. The White House softened its stance on import duties, and investors began buying back positions. When the futures market reopened on Sunday evening, Bitcoin’s loss had narrowed to 5%, compared to a 16% drop at its lowest point.
In the days leading up to the crash, the price was above $120,000. On Monday, October 6th, we even reached an all-time high of $126,300. It would have been remarkable if the market had rebounded quickly, forming a neat V-shape on the chart. That, however, did not happen.
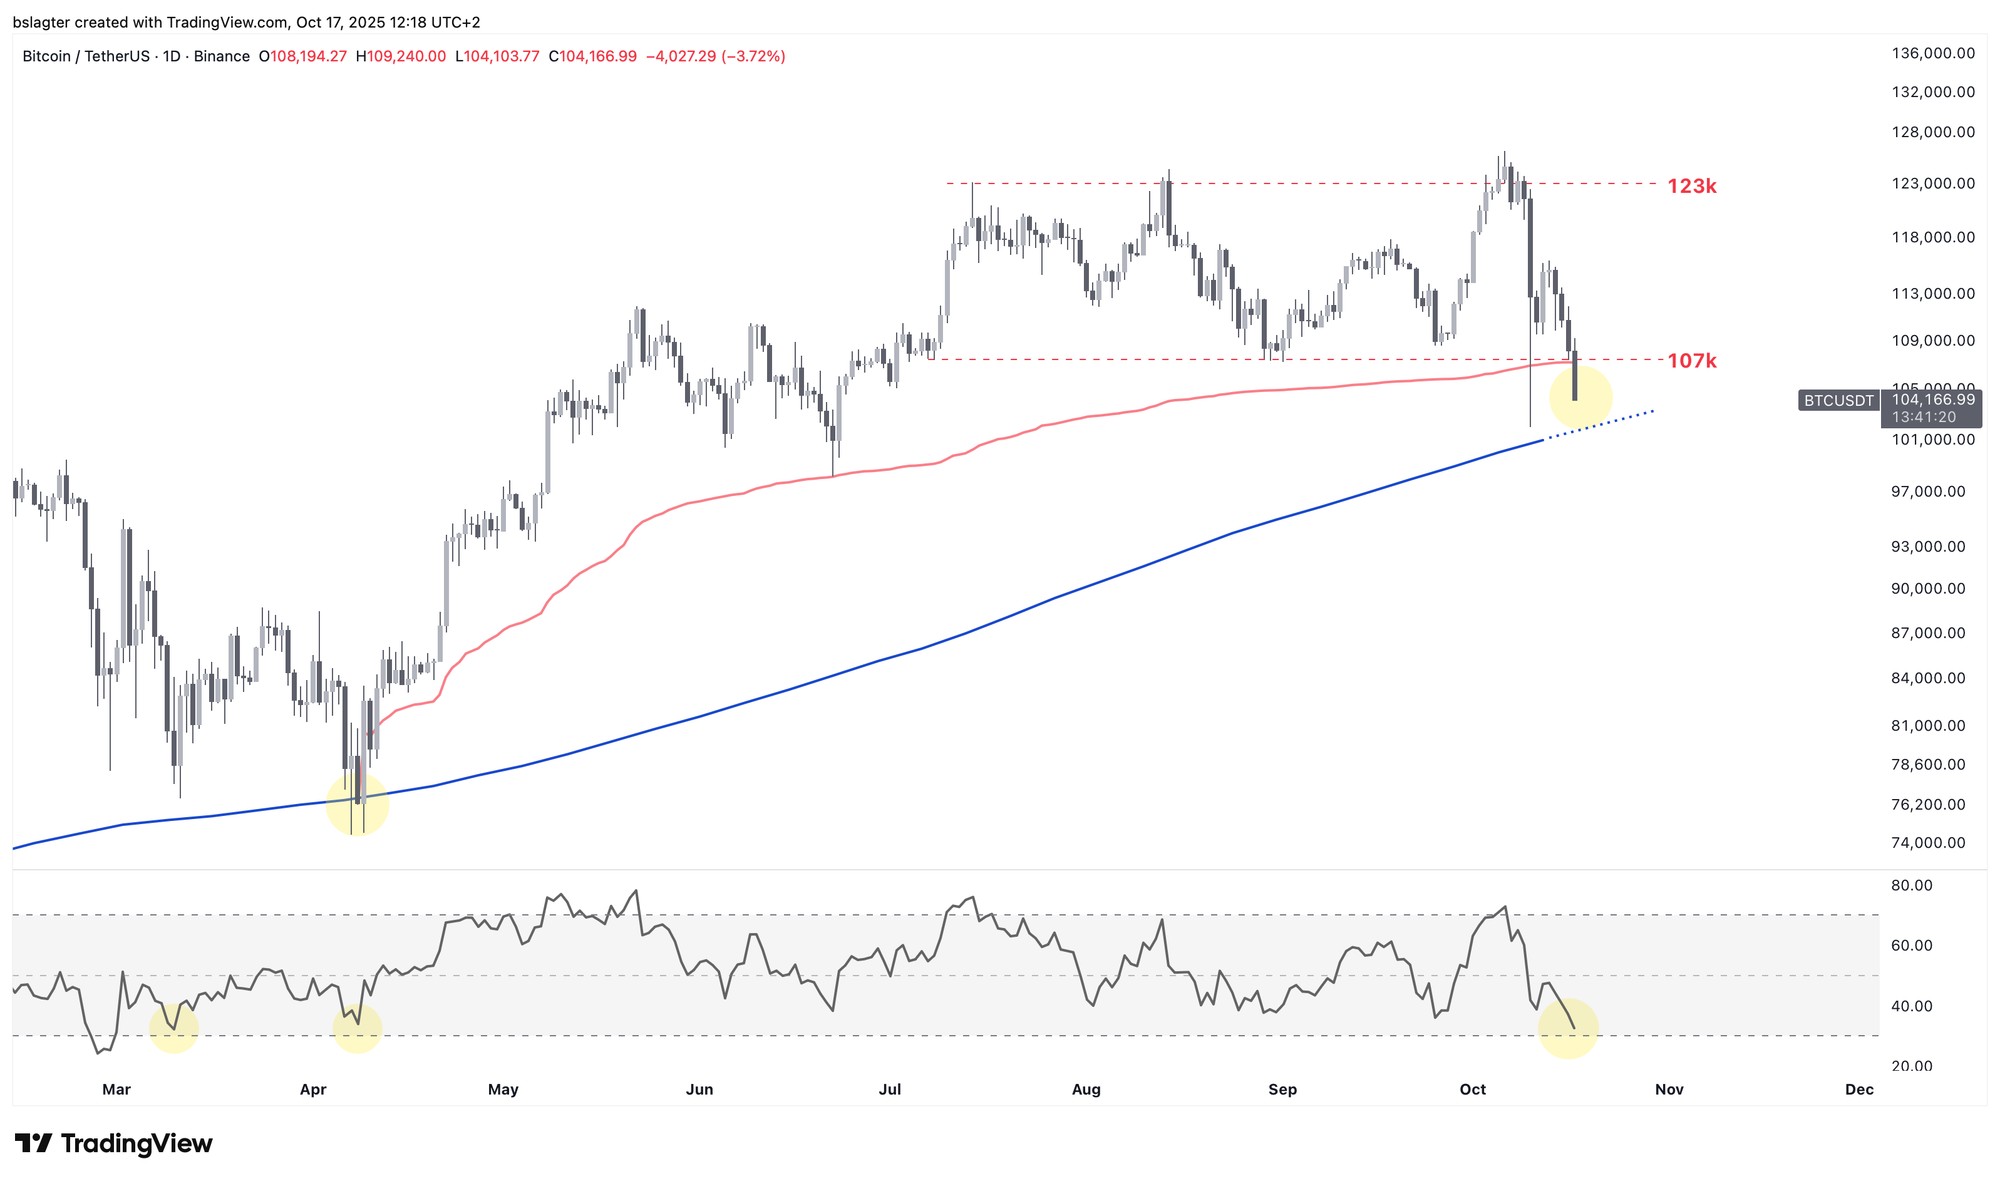
Instead, the price slid yesterday and last night down to the lower end of the trading range between $107,000 and $123,000, a range that has held since early July.
This morning, that support level was breached even further. The price has since plummeted to $104,000, and the decline shows no sign of stopping. This is disappointing, especially as gold soared to record levels this week and even the US small-cap index Russell-2000 hit new records.
Crypto investors are growing increasingly frustrated and pessimistic. It’s not just the 17% drop from the peak—which isn’t exceptionally severe—but also the stark contrast with other asset classes. The sentiment can be summarized as, “There’s plenty of capital available, just not flowing into Bitcoin.”
Our base scenario is that this downturn is temporary and that Bitcoin will eventually reclaim its spotlight.
Investors worldwide are seeking alternatives to bonds. They’re favoring assets that can’t be easily printed and that aren’t simply claims on a counterparty. This explains the recent interest in gold, silver, raw materials, AI-related stocks, and Bitcoin. It’s only a matter of time before this rotation is reflected in Bitcoin’s price as well.
But that won’t happen just yet.
First, Bitcoin needs to establish a base on the weekly chart. A logical target is the zone between $100k and $102k, where both the 50-week average and the 10-month average lie. It’s also the level of the lowest wick on October 10th observed on Binance, Bybit, and Kraken.
A slight dip below that zone wouldn’t be catastrophic, but ideally, we’d like to see the weekly close hold above $102,000.

The crash on October 10th, the shaky recovery afterward, and Bitcoin’s underperformance relative to gold and stocks all contribute to growing concerns that the bull market might be ending—or that it may be time to rotate out of crypto into other markets.
But is that concern justified?
Is the bull market truly over?
And what exactly do we mean by “bull market” anyway?
For our Alpha Plus members, we continue with the following topics:
- Is the bull market over?
- Tension in the Depths of the Financial System
- Risk-On Until Proven Otherwise
1️⃣ Is the Bull Market Over?
Bert
What we refer to in the crypto world as bull and bear markets are essentially the upward and downward trends on the weekly chart. A few weeks ago, I made this explanatory video on market trends.
Looking back, it’s relatively straightforward to pinpoint when the upward trend ended and a new downward trend began—the peak of the bull market. However, at this stage, we can only discuss probabilities.
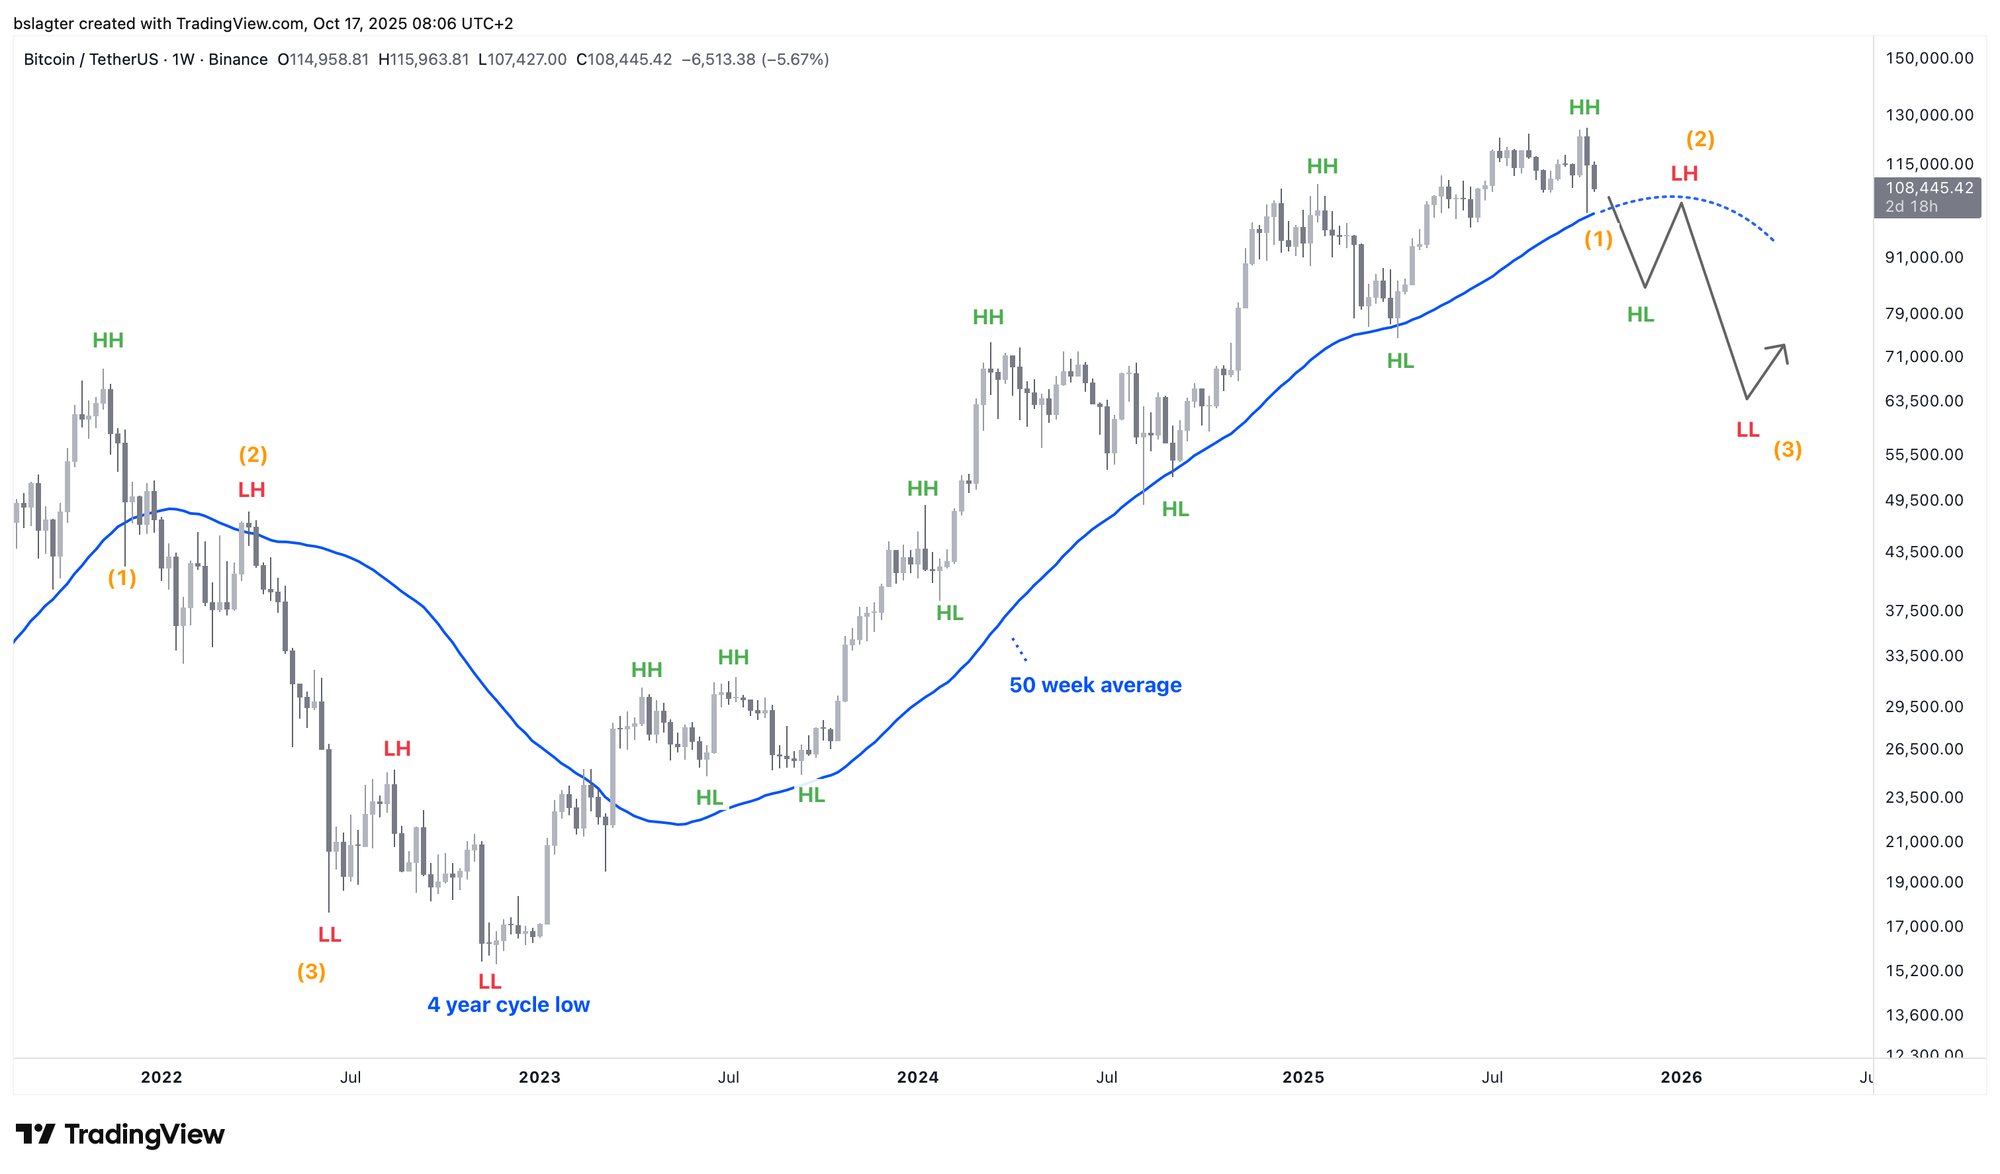
In an uptrend, you see a series of higher highs and higher lows. The price remains above a dominant average that is itself trending upward, and previous resistance levels turn into support.
When these characteristics are clearly present, it’s unlikely that a bear market has just started. That scenario typically comes with “buy the dip” confidence and the expectation of a rising weekly cycle.
While the key features of the uptrend are still in place, several signals now cast doubt on the sustainability of the bull market:
- The former “resistance turned support” between $107k and $112k appears to have given way.
- Bearing divergences are emerging on several momentum indicators on the weekly chart.
- Bitcoin is lagging behind stocks and gold.
- It’s underperforming relative to indicators that reflect risk sentiment and global liquidity.
- MicroStrategy’s stock is now trading below its dominant average.
- Treasury companies such as Nakamoto and Metaplanet are slipping and trading at a discount.
- From a cycle analysis perspective, we are at the stage where a yearly peak—a bull market climax—might be expected.
The crash on October 10th has shone a spotlight on these points. The prolonged lack of a strong recovery reinforces the feeling that the end might be near.
On Discord, immediately after the crash on Saturday, October 11th, we distributed the following probability estimates:
70% chance that the wick’s bottom marked the true bottom
10% chance that prices will dip slightly lower before setting new records
20% chance that the bear market has now begun
With the ongoing lack of recovery and a fall below the lower bound of the trading range, we’ve increased the likelihood of a bear market from 20% to 35%. Nonetheless, our base assumption is still that we are in a bull market—albeit one that is now shrouded in more uncertainty than it was three months ago.
This means exercising more caution: no leverage and no exposure to (small) altcoins, and perhaps reducing your overall crypto exposure if you’re heavily invested in it.
We would consider the probability of a bear market even higher if we observe these additional signs of a trend reversal on the weekly chart:
- A weekly close below the 50-week average (currently at $102,000)
- A new high lower than $126,000
- A new low lower than $74,000
If all these conditions are met, it would be a clear indication that the bear market has begun, as the trend would have definitively shifted from upward to downward. Conversely, if an uptrend resurfaces later, that would signal the start of a new bull market.
The chart below marks the three points—with (1), (2), and (3) indicating a hypothetical beginning of a new bear market (right) and the start of the previous bear market (left).
How you respond to these signs depends entirely on your personal situation. Some investors will hold on to their positions, others may sell part of their holdings once a certain probability is reached, and still others might start buying in anticipation of the next bull market.
Personally, I plan to maintain my spot position for now, using a weekly close below the 50-week average as my signal. At $102,000, this is only 19% below the previous high of $126,000, which is not a drastic drop. Therefore, I won’t rush to sell if the weekly close falls just a little below that mark.
If we see clear acceptance below the 50-week average, I will trim part of my spot position—but not completely exit, because selling everything would be extreme. Essentially, I’d be shifting from an “overweight” to an “underweight” stance.
If I decide to sell, I accept the risk that I might have to buy back at a higher price if this signal turns out to be a false alarm and the uptrend resumes with the price climbing back above the 50-week average.
The coming days and weeks are likely to be turbulent for financial markets. Stress in the US bond market and uncertainty over economic data could create further volatility—and Bitcoin is not immune to these pressures.
In April, the price briefly dipped below the 50-week average, hitting the weekly low precisely there. A similar occurrence happened in September 2024. We’re keenly watching to see if the bulls can now defend this key level!
2️⃣ Tension in the Depths of the Financial System
Thom
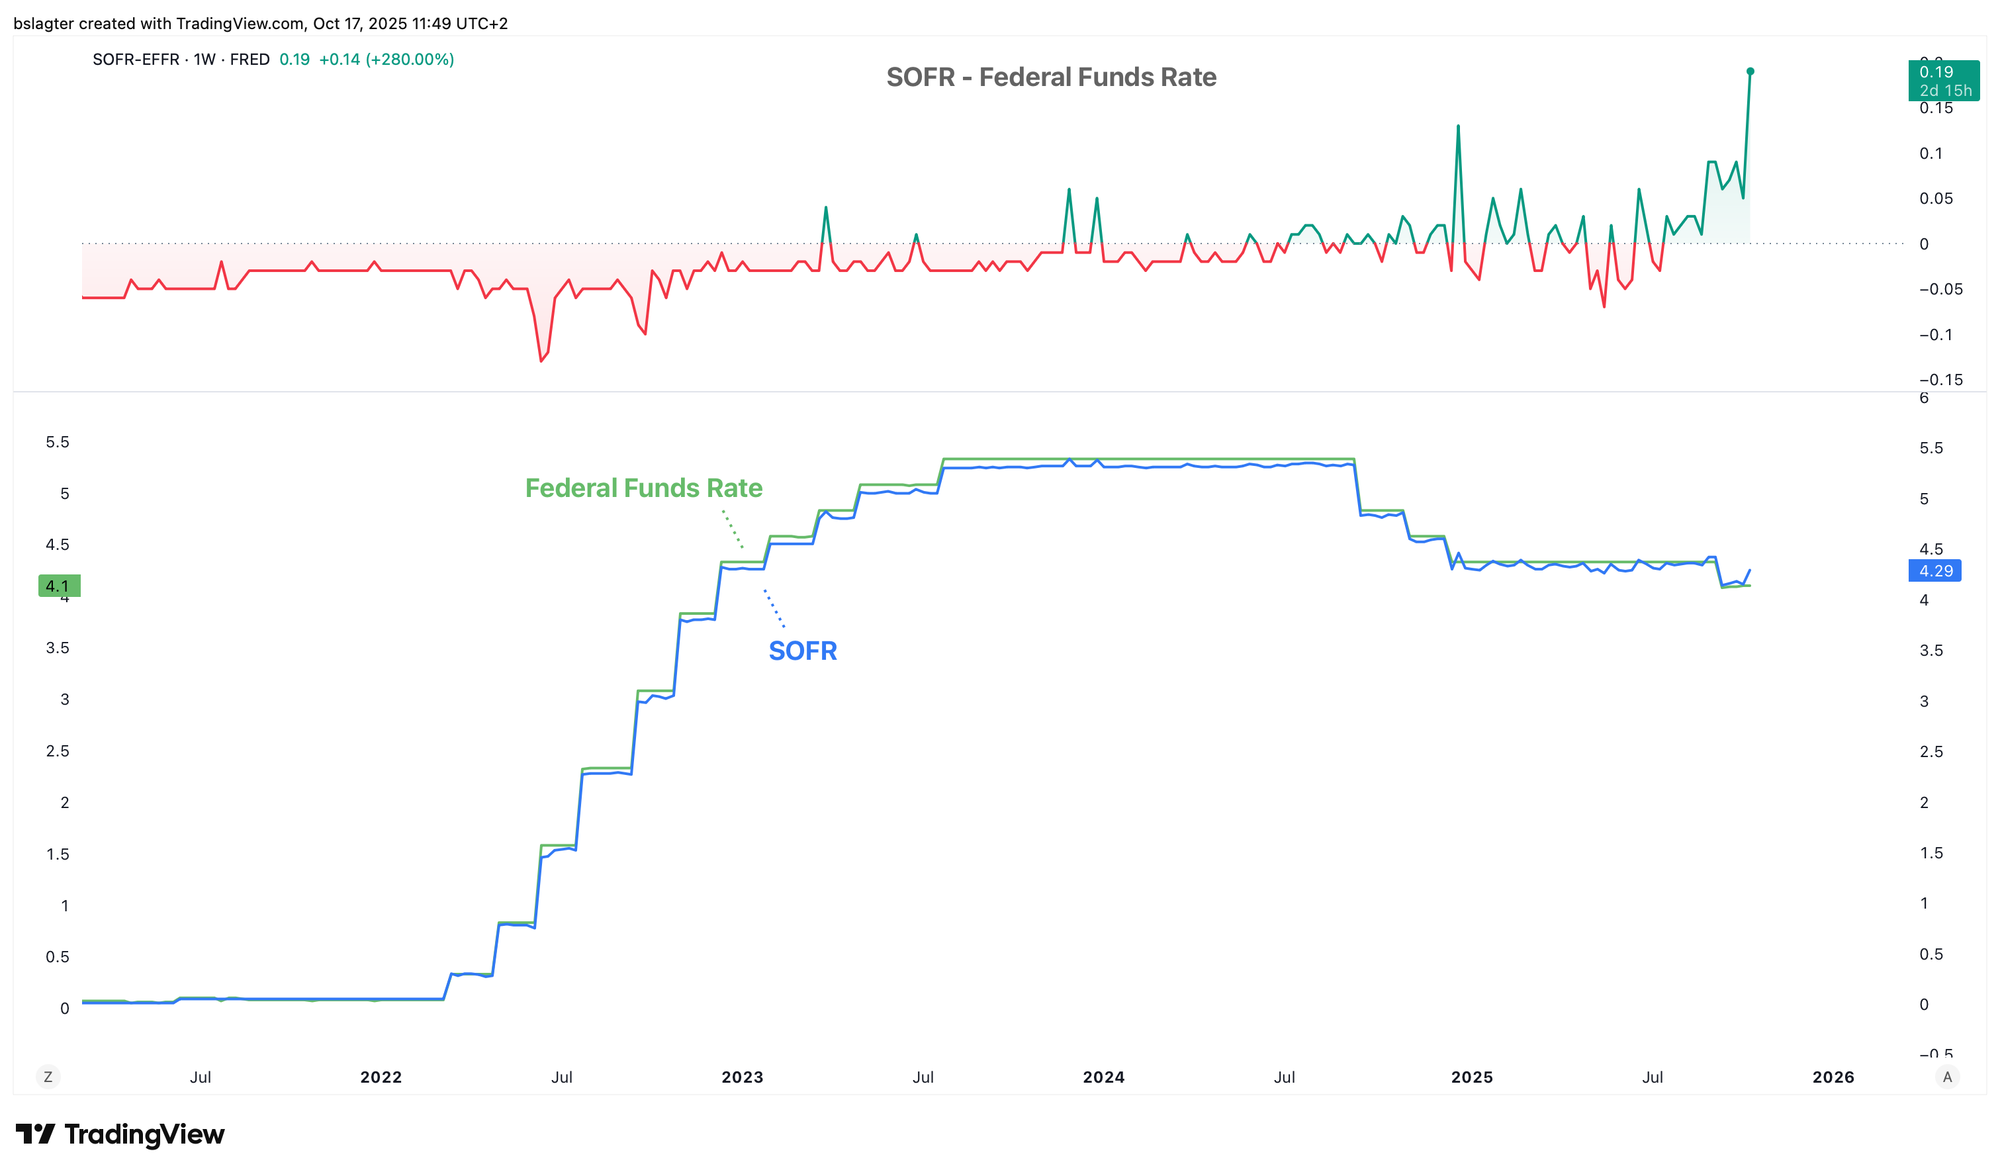
Deep within the financial system, something significant is unfolding. Banks and large investors—normally able to borrow cheaply by using US government bonds as collateral—are suddenly having to pay a premium for these loans.
This concerns the so-called “secured overnight funding rate” (SOFR), the primary benchmark for the cost of very short-term loans. In recent years, SOFR was typically below the US central bank’s policy rate, the Federal Funds Rate. However, recently, the situation has reversed: SOFR has surged well above the Fed’s rates.
Why is this important?
The repo market, where these loans take place, is the backbone of the financial system. Here, major banks, hedge funds, and dealers determine the cost of borrowing using government bonds as collateral. If stress hits this market, the repercussions can quickly ripple through the entire economy:
- Reduced liquidity: There’s less money available to finance transactions.
- Higher borrowing costs: Companies and investors face higher expenses to refinance their debt.
- Risk of intervention: Prolonged strain might force the Fed to step in—for example, by pausing balance sheet reduction (quantitative tightening) or by establishing emergency funding facilities.
In other words, even if the economy looks stable on the surface, the underlying signals of stress are emerging, particularly a potential shortage of dollars in key channels within the financial system.
What does this mean for Bitcoin?
For Bitcoin, this situation creates two opposing forces:
- Short-term pressure: If investors suddenly require cash due to liquidity issues, they are typically the first to offload riskier assets like stocks and Bitcoin, which could put downward pressure on its price.
- Long-term support: If the Fed ends up injecting extra liquidity into the system, it could ultimately benefit Bitcoin, as many investors view it as a hedge against a weakening dollar.
We observed similar tensions in 2019 and 2020, when the Fed had to intervene to keep the markets functioning smoothly. It is hardly coincidental that Fed Chairman Jerome Powell recently spoke about the potential end of quantitative tightening.
3️⃣ Risk-On Until Proven Otherwise
Thom
It’s clear that Bitcoin has not yet recovered from last Friday’s crash. In the short term, it has lost significant momentum, a weakness that I attribute to two main factors:
- Exchange companies that once held Bitcoin as a reserve asset are struggling. The enthusiasm for these stocks has waned, and companies like Strategy and Metaplanet are no longer making the aggressive purchases they once did.
- Gold continues to set new records and is attracting considerable attention as a “store of value.” Bitcoin may need a local rally in gold before it can regain its momentum.
When taking a broader view, Bitcoin still manages to post higher highs and higher lows. For this reason, I don’t see a compelling argument that the bull market is definitively over—especially when we consider the overall risk sentiment in the financial markets.
This week, the US Russell-2000 index once again hit new record highs—a positive signal for investor risk appetite, as this index is largely composed of smaller companies that tend to do well when there is strong future confidence.
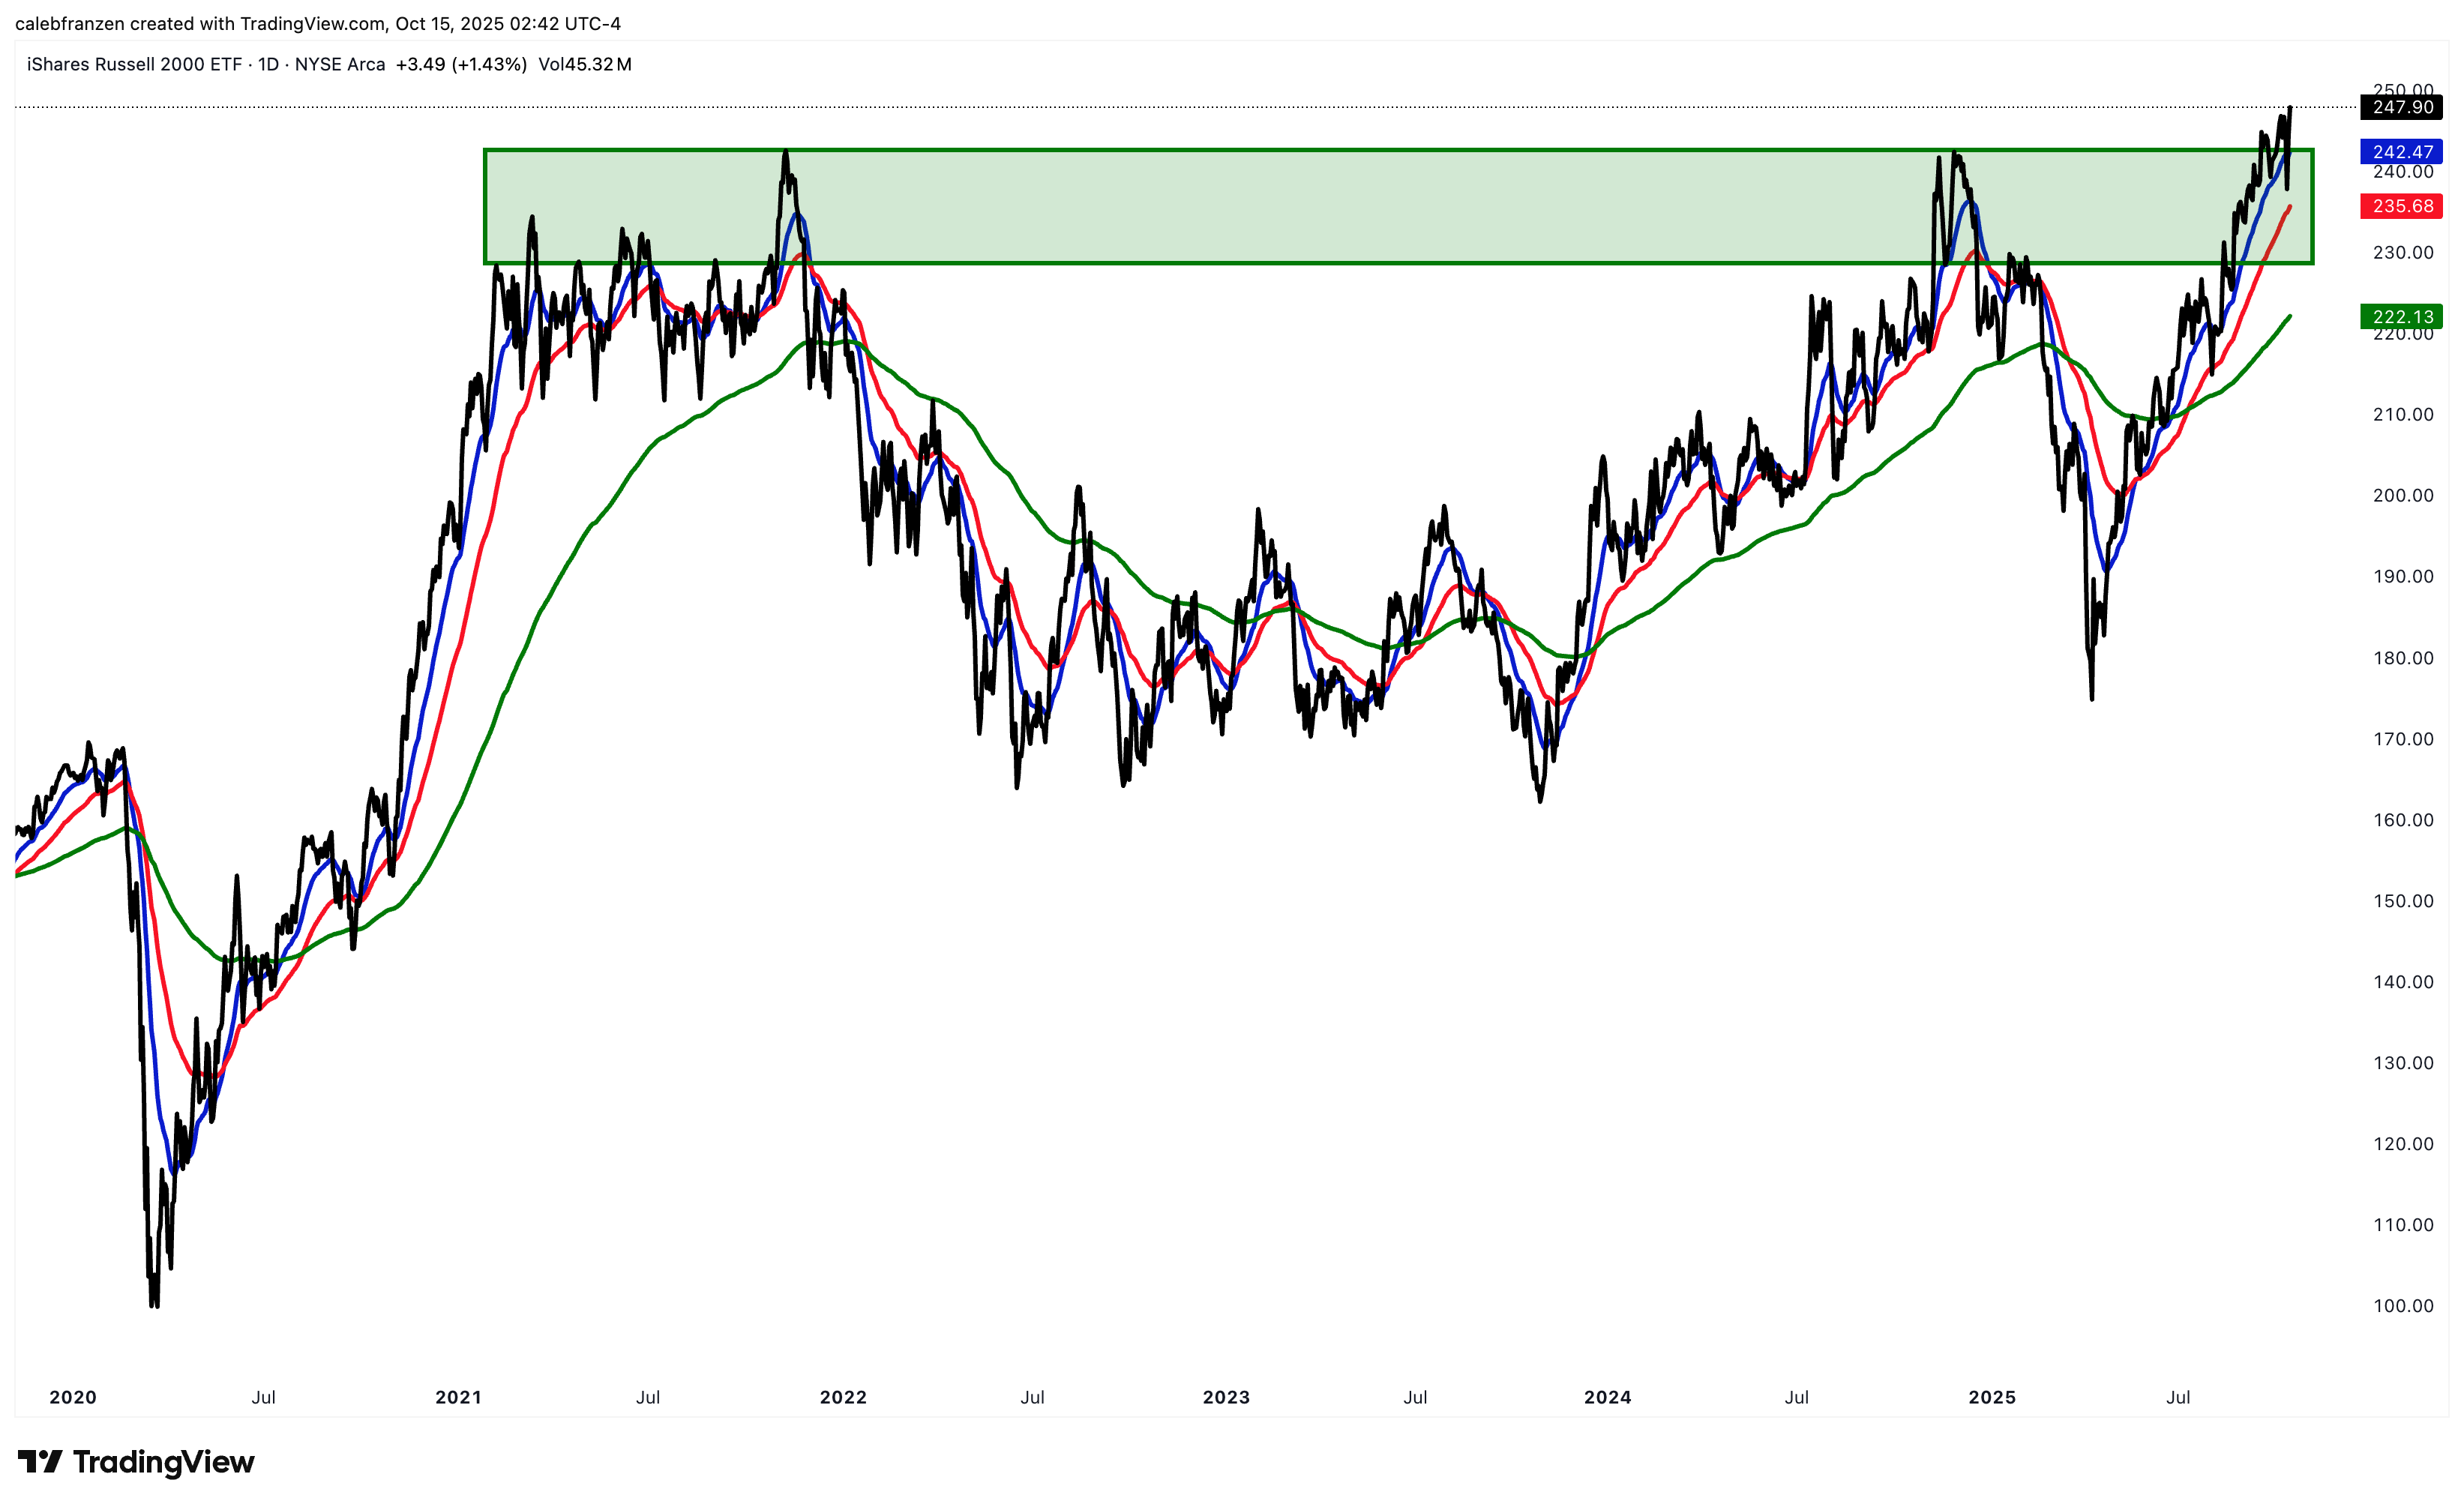
Investor confidence implies an expectation that the US economy will remain robust, few companies will falter, and for that reason, investors will continue putting their money at risk.
Additionally, this week again highlighted the massive investment cycle in artificial intelligence. An investment group including BlackRock, Nvidia, Microsoft, and xAI is funneling $40 billion into acquiring data centers in Texas.
BlackRock and Nvidia in $40bn data centre takeover to power AI growth https://t.co/qPYzVNS7Ni
— Finance News (@ftfinancenews) October 15, 2025
Such developments bolster investor confidence in the AI narrative, a key component of this market cycle. As long as confidence in AI’s future endures and billions continue to flow in, it’s unlikely that the broader bull market will simply vanish.
As long as that remains true, I expect that there will eventually be a phase when capital flows back into Bitcoin.
Thank you for reading!
To stay informed about the latest market developments and insights, you can follow our team members on X:
- Bart Mol (@Bart_Mol)
- Peter Slagter (@pesla)
- Bert Slagter (@bslagter)
- Mike Lelieveld (@mlelieveld)
We appreciate your continued support and look forward to bringing you more comprehensive analysis in our next edition.
Until then!