Has the four-year cycle run its course?
The four-year Bitcoin cycle might be evolving. Are record peaks and retracement levels ($91.6k–$95.5k) a prelude to a new bull run or signs of a shift? With Fed moves and macro trends in play, the crypto clock may be ticking differently—don't blink!

The traditional four-year cycle is over in crypto. — Matt Hougan, CEO Bitwise.
The regular rhythm of the Bitcoin market is striking—four years between peaks and four years between bottoms. You could almost set your watch by it. The four-year cycle has become a familiar concept, featured in everything from memes to in-depth analyses, and many companies even plan their strategies around it.
But will this pattern continue? Or is there reason to believe that its time has passed?
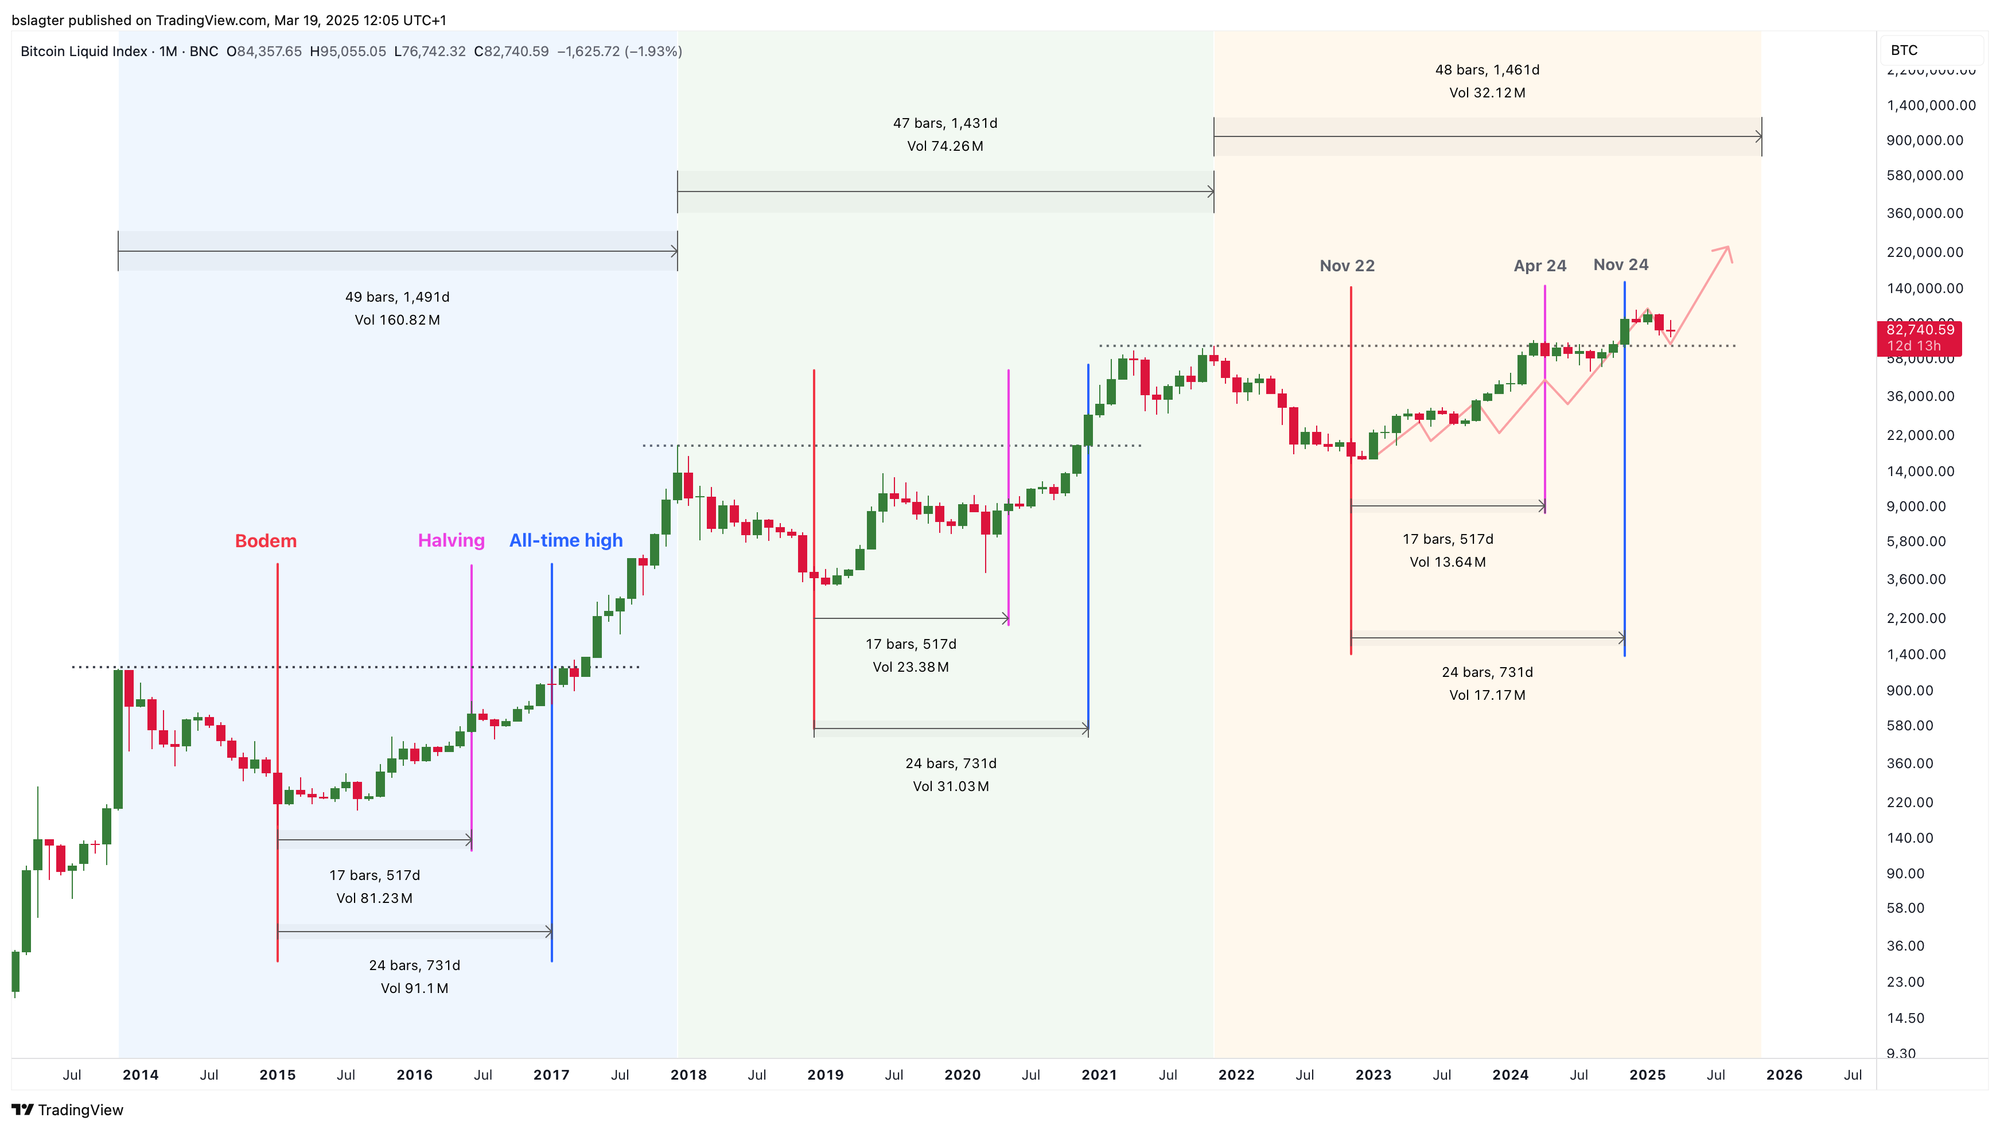
Before addressing these questions, let’s first outline what the market cycle looks like. We’ll start by looking at it in terms of peaks, bottoms, and halvings.
At times, the market cycle is linked to halvings. Every 210,000 blocks, the bitcoin block subsidy is halved, and with an average block time of ten minutes, this happens roughly every four years. The theory goes that this sudden reduction in supply triggers a price surge over the following 18 months.
If that theory were entirely true, we could now say that period is behind us—so few new bitcoins are being introduced that the halving no longer has a decisive impact on the supply-demand balance.
Yet many analysts still incorporate the halving into their forecasts. And if enough people believe in a pattern and act accordingly, its effects tend to follow.
The chart below was created two years ago, shortly after we emerged from the bear market. It even appears in our 2023 outlook. The halving did indeed occur in April 2024, and if you look closely, you can spot November 2024 as a breakout above the previous bull market’s all-time high.
You can also view the crypto market through a macroeconomic lens. Over the years, Bitcoin has increasingly become part of diversified portfolios, with investors not only following Bitcoin itself but also keeping an eye on broader economic and financial market developments.
When investors’ risk appetite wanes, Bitcoin also encounters headwinds. We see this during economic downturns, periods of rising uncertainty, and times when financial conditions tighten.
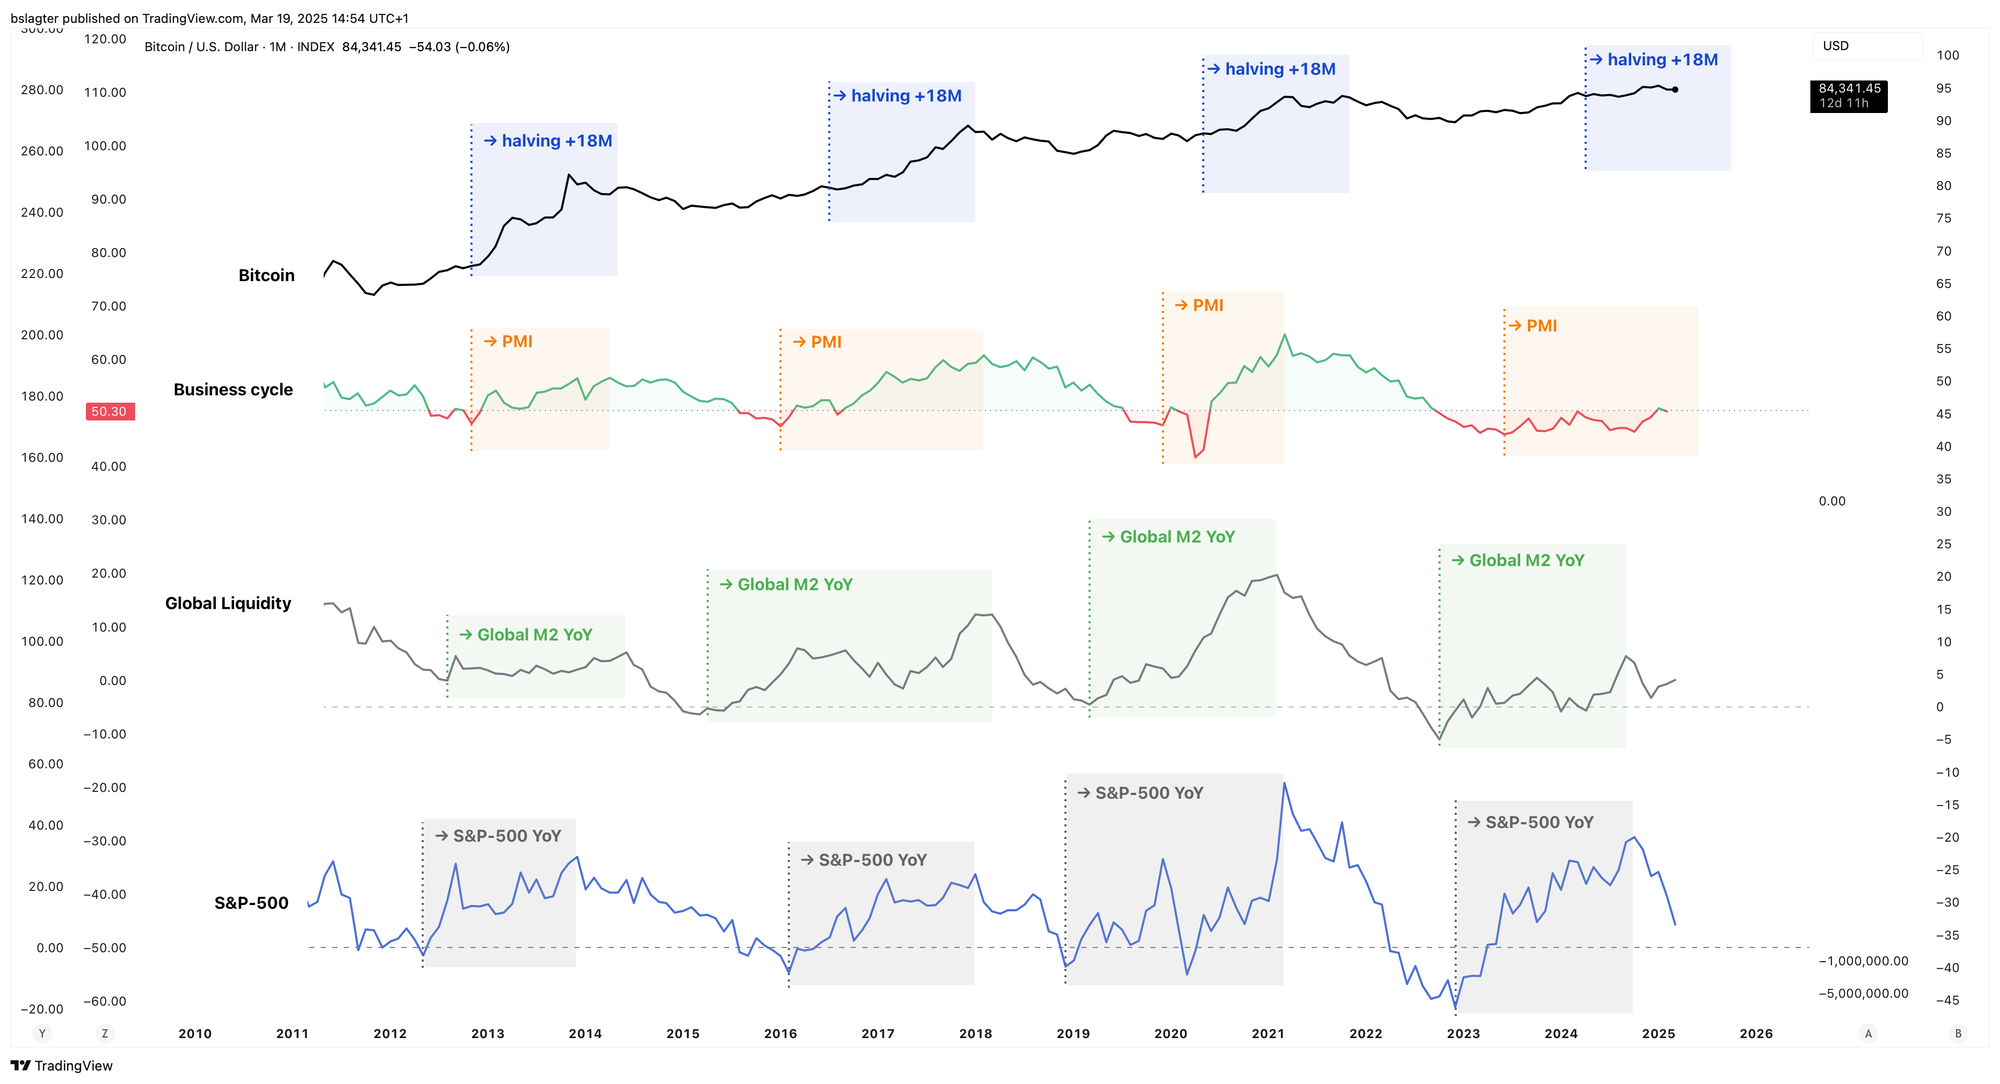
The chart below displays four lines:
- The bitcoin price, with the halvings and the subsequent 18 months highlighted in blue.
- The U.S. Purchasing Managers' Index (PMI), which offers a clear picture of the business cycle—a blend of rapid and slow economic growth.
- Global liquidity, representing the total capital available across financial markets for risk-taking. The money supply M2 serves as a rough approximation of this.
- The year-over-year change in the U.S. S&P 500, which reflects investor optimism and risk appetite.
If you look closely, you’ll notice that the growth periods in the bottom three lines almost perfectly coincide with the 18 months following Bitcoin’s halving. So, is the post-halving price surge due to the change in Bitcoin’s supply, or is it driven primarily by macroeconomic factors?
According to the first chart—which maps out the peaks, bottoms, and halvings—there’s no reason yet to declare the four-year cycle dead. Give it some time. If you only examined the macroeconomic conditions, the four-year pattern might just be a coincidence; it could just as easily turn out to be three or five years this time. We delve deeper into this in our premium article, “Is the four-year cycle over?”
In the remainder of the free section, we briefly explore the price outlook for the coming weeks. It seems likely that the U.S. stock market will rebound after four consecutive weeks of decline, and naturally, Bitcoin is expected to follow suit.
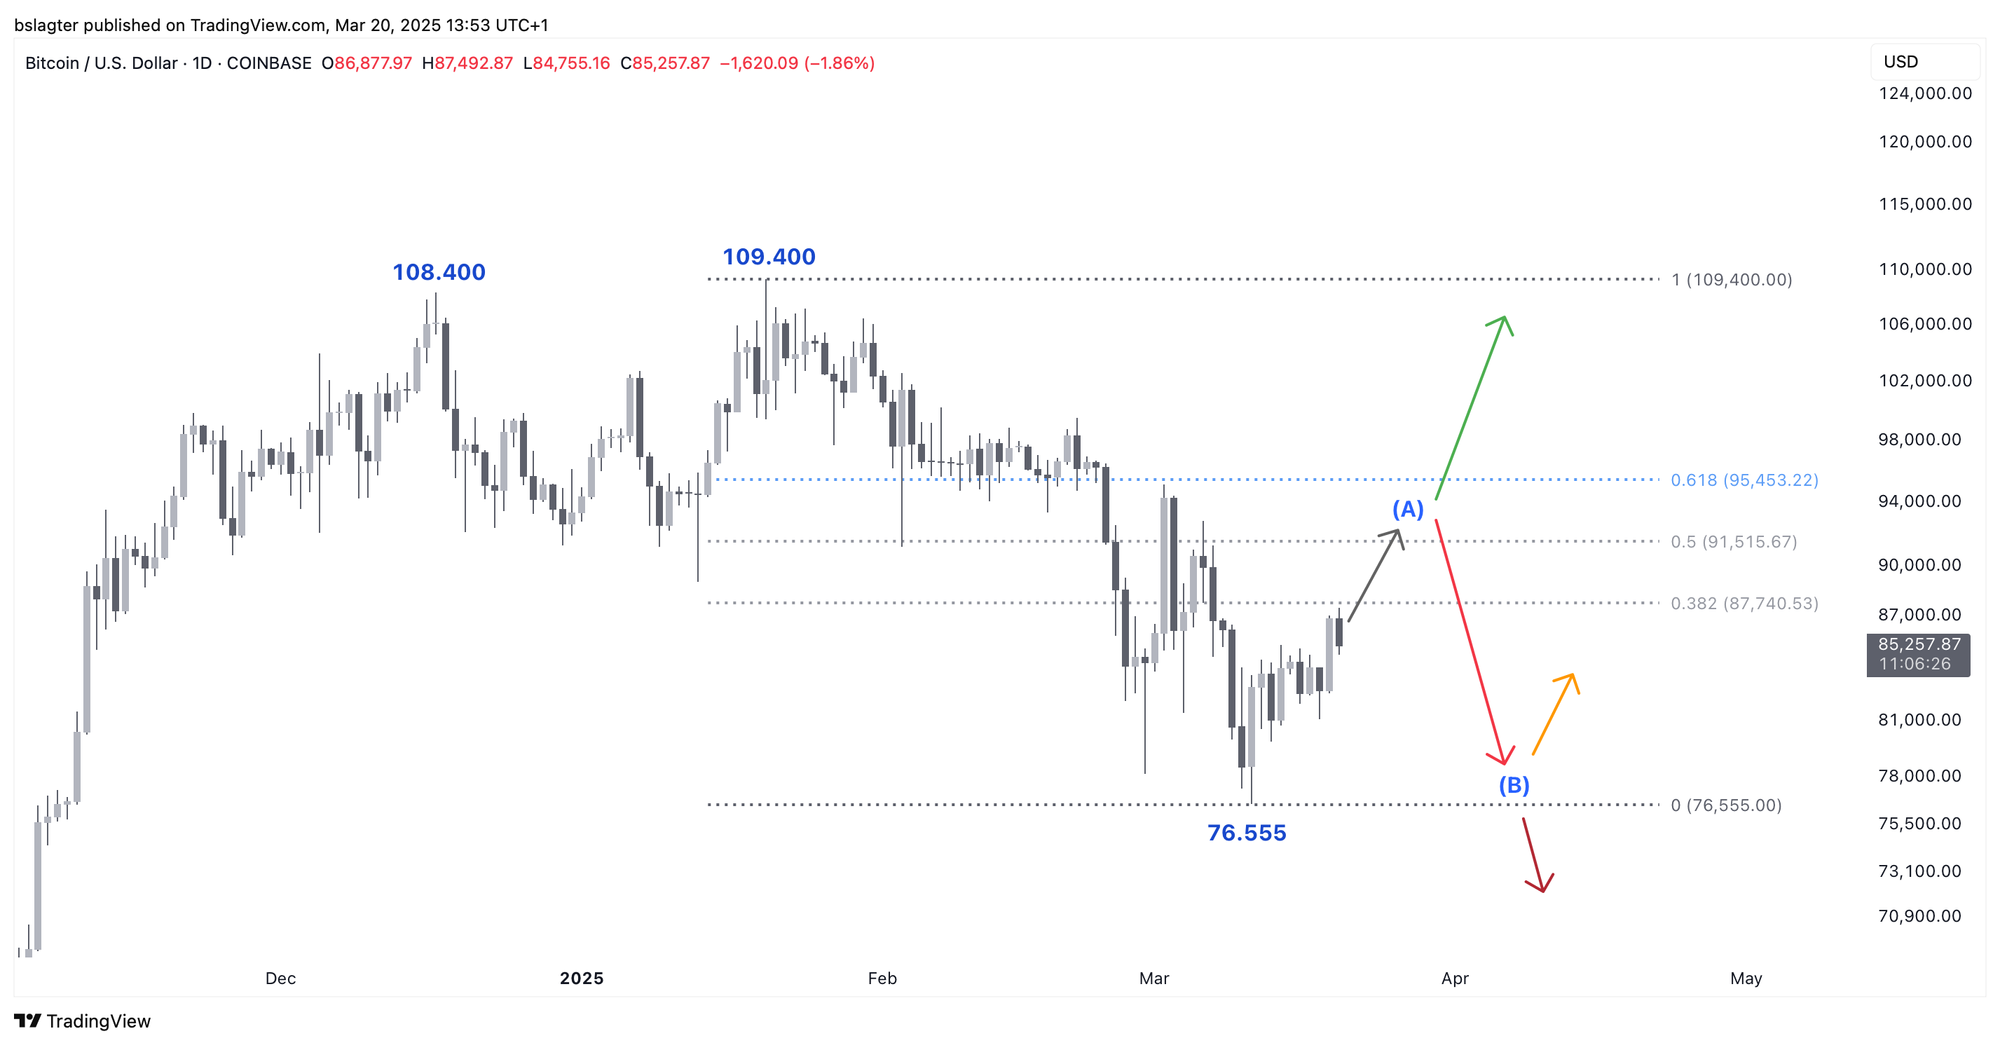
For a retracement, we consider the Fibonacci levels based on the drop from 109.5k to 76.6k:
- 50% = $91,600
- 61.8% = $95,500
If prices reach that zone, the first decision point (A) arises: will they continue climbing to new all-time highs, or will they decline again? And if they fall, the second decision point (B) will emerge: will we see a double bottom at 76.6k, or will there be an even lower trough? These two levels will be crucial.
We continue with the following topics for our Alpha Plus members:
- Is the four-year cycle over?
- Prices rise after Fed rate decision
- Fears of a U.S. recession remain exaggerated