Hanging by a Thread
The bull market is at its most tense point yet. A government shutdown, bond market stress, and vertigo in AI stocks create a perfect storm of uncertainty. What if AI doesn't deliver on its promises? Bitcoin has arrived at a critical juncture. Is this a new bottom or a bear market trap?

This is the most tense the situation has been during this bull market. On the Bitcoin chart, it looks a lot like early April, but back then, there were clearly identifiable external shocks whose impact on financial markets was already fading. Trump's trade war and the conflict between Israel and Iran, for example.
Now, things are different. A solution to the U.S. government shutdown is still not in sight. And once it ends, there will be uncertainty about the economic data we've been missing for almost six weeks, as well as the U.S. central bank's reaction to it.
At the same time, there's tension in the U.S. bond market. This is partly due to the shutdown, which has the government issuing bonds but leaving the cash raised in its bank account. Another factor is that under the quantitative tightening (QT) regime, all excess liquidity has been used up, and shortages are now starting to emerge.
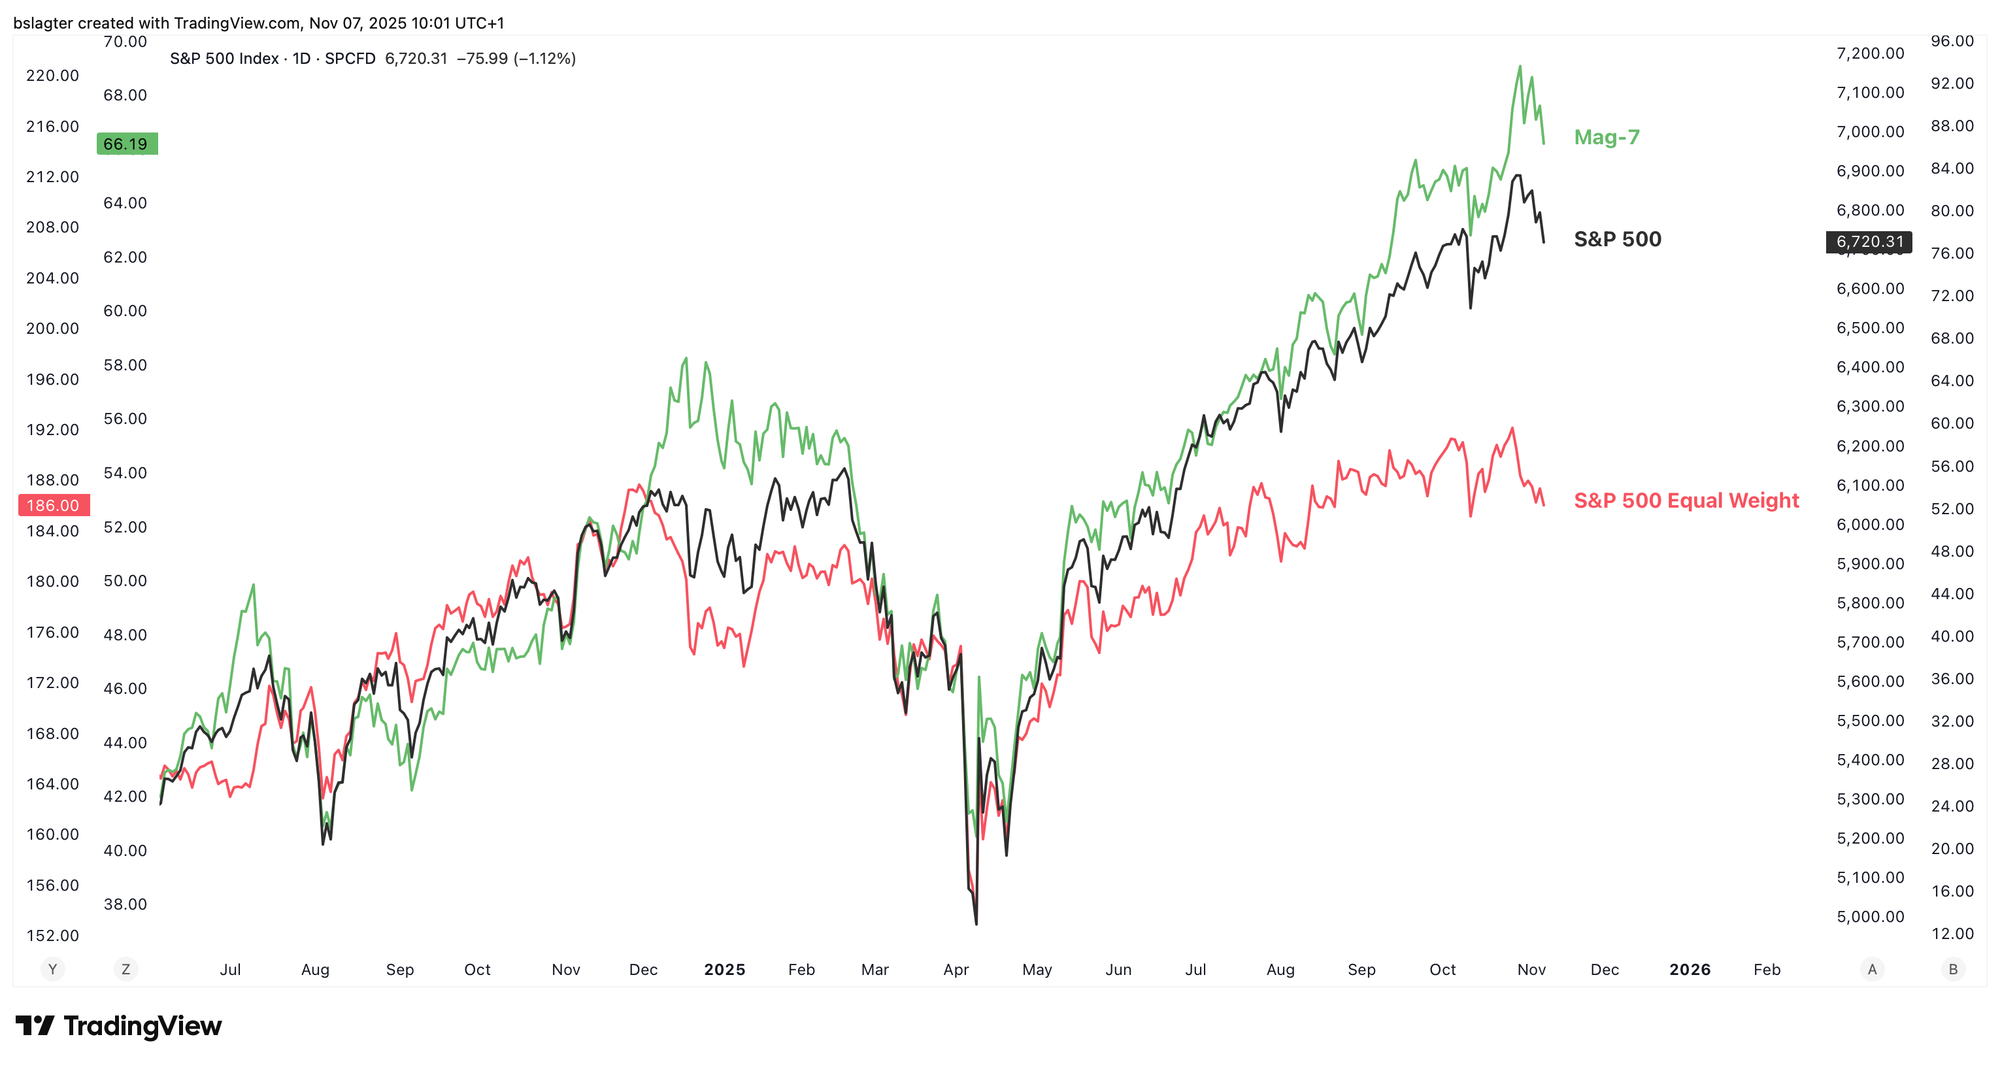
And then there's the vertigo surrounding AI stocks. They have been the driving force in recent months. The S&P 500 Equal Weight Index, where each company has an equal 0.2% weighting, has moved sideways in recent months. And the market breadth of the S&P 500 has even declined.
But what if AI doesn't deliver? What if the promises aren't met? Maybe it's time to take profits? Such doubts seem to be casting a pall over stock markets worldwide.
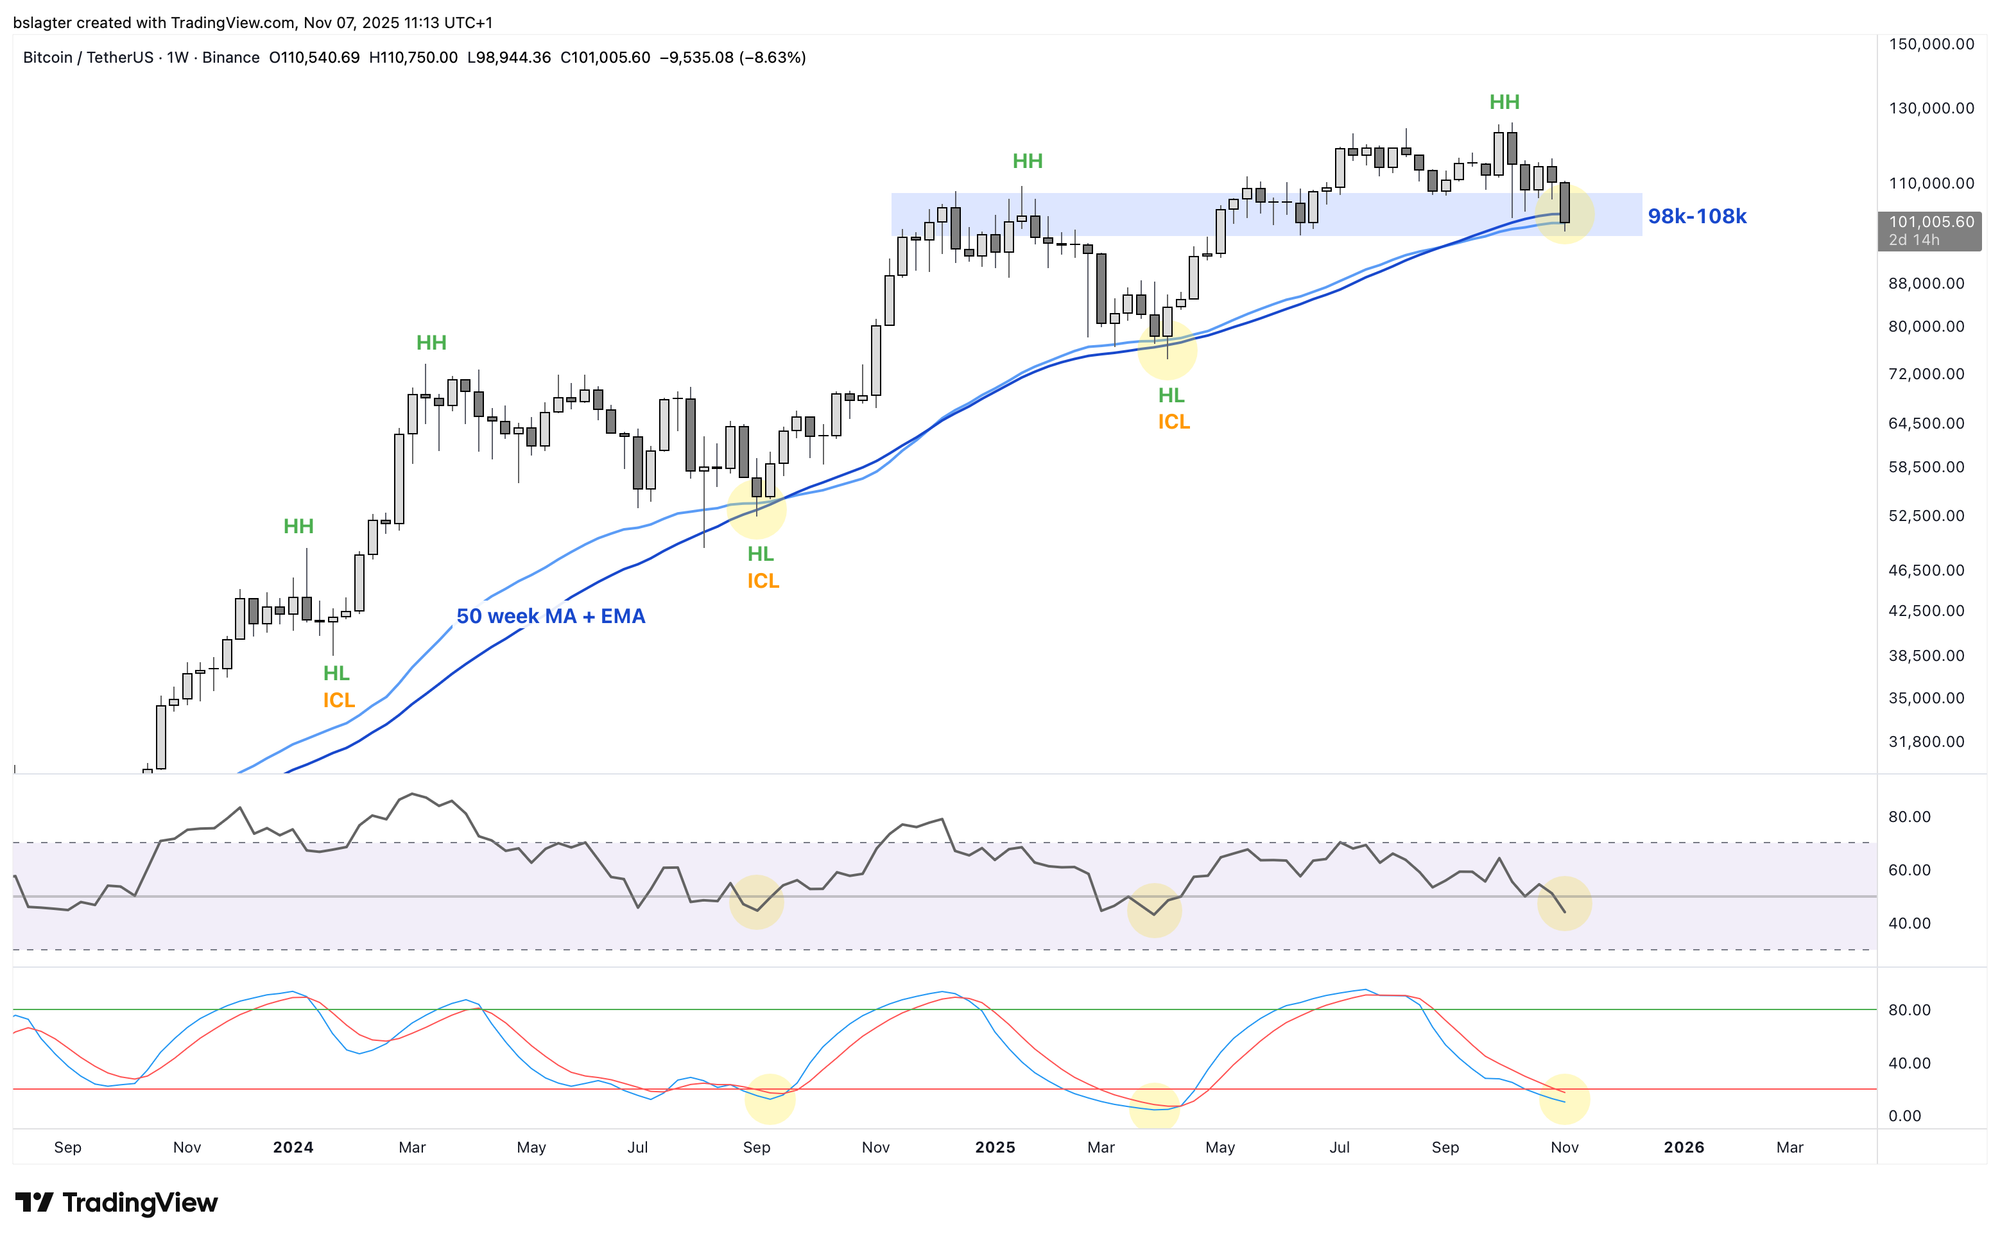
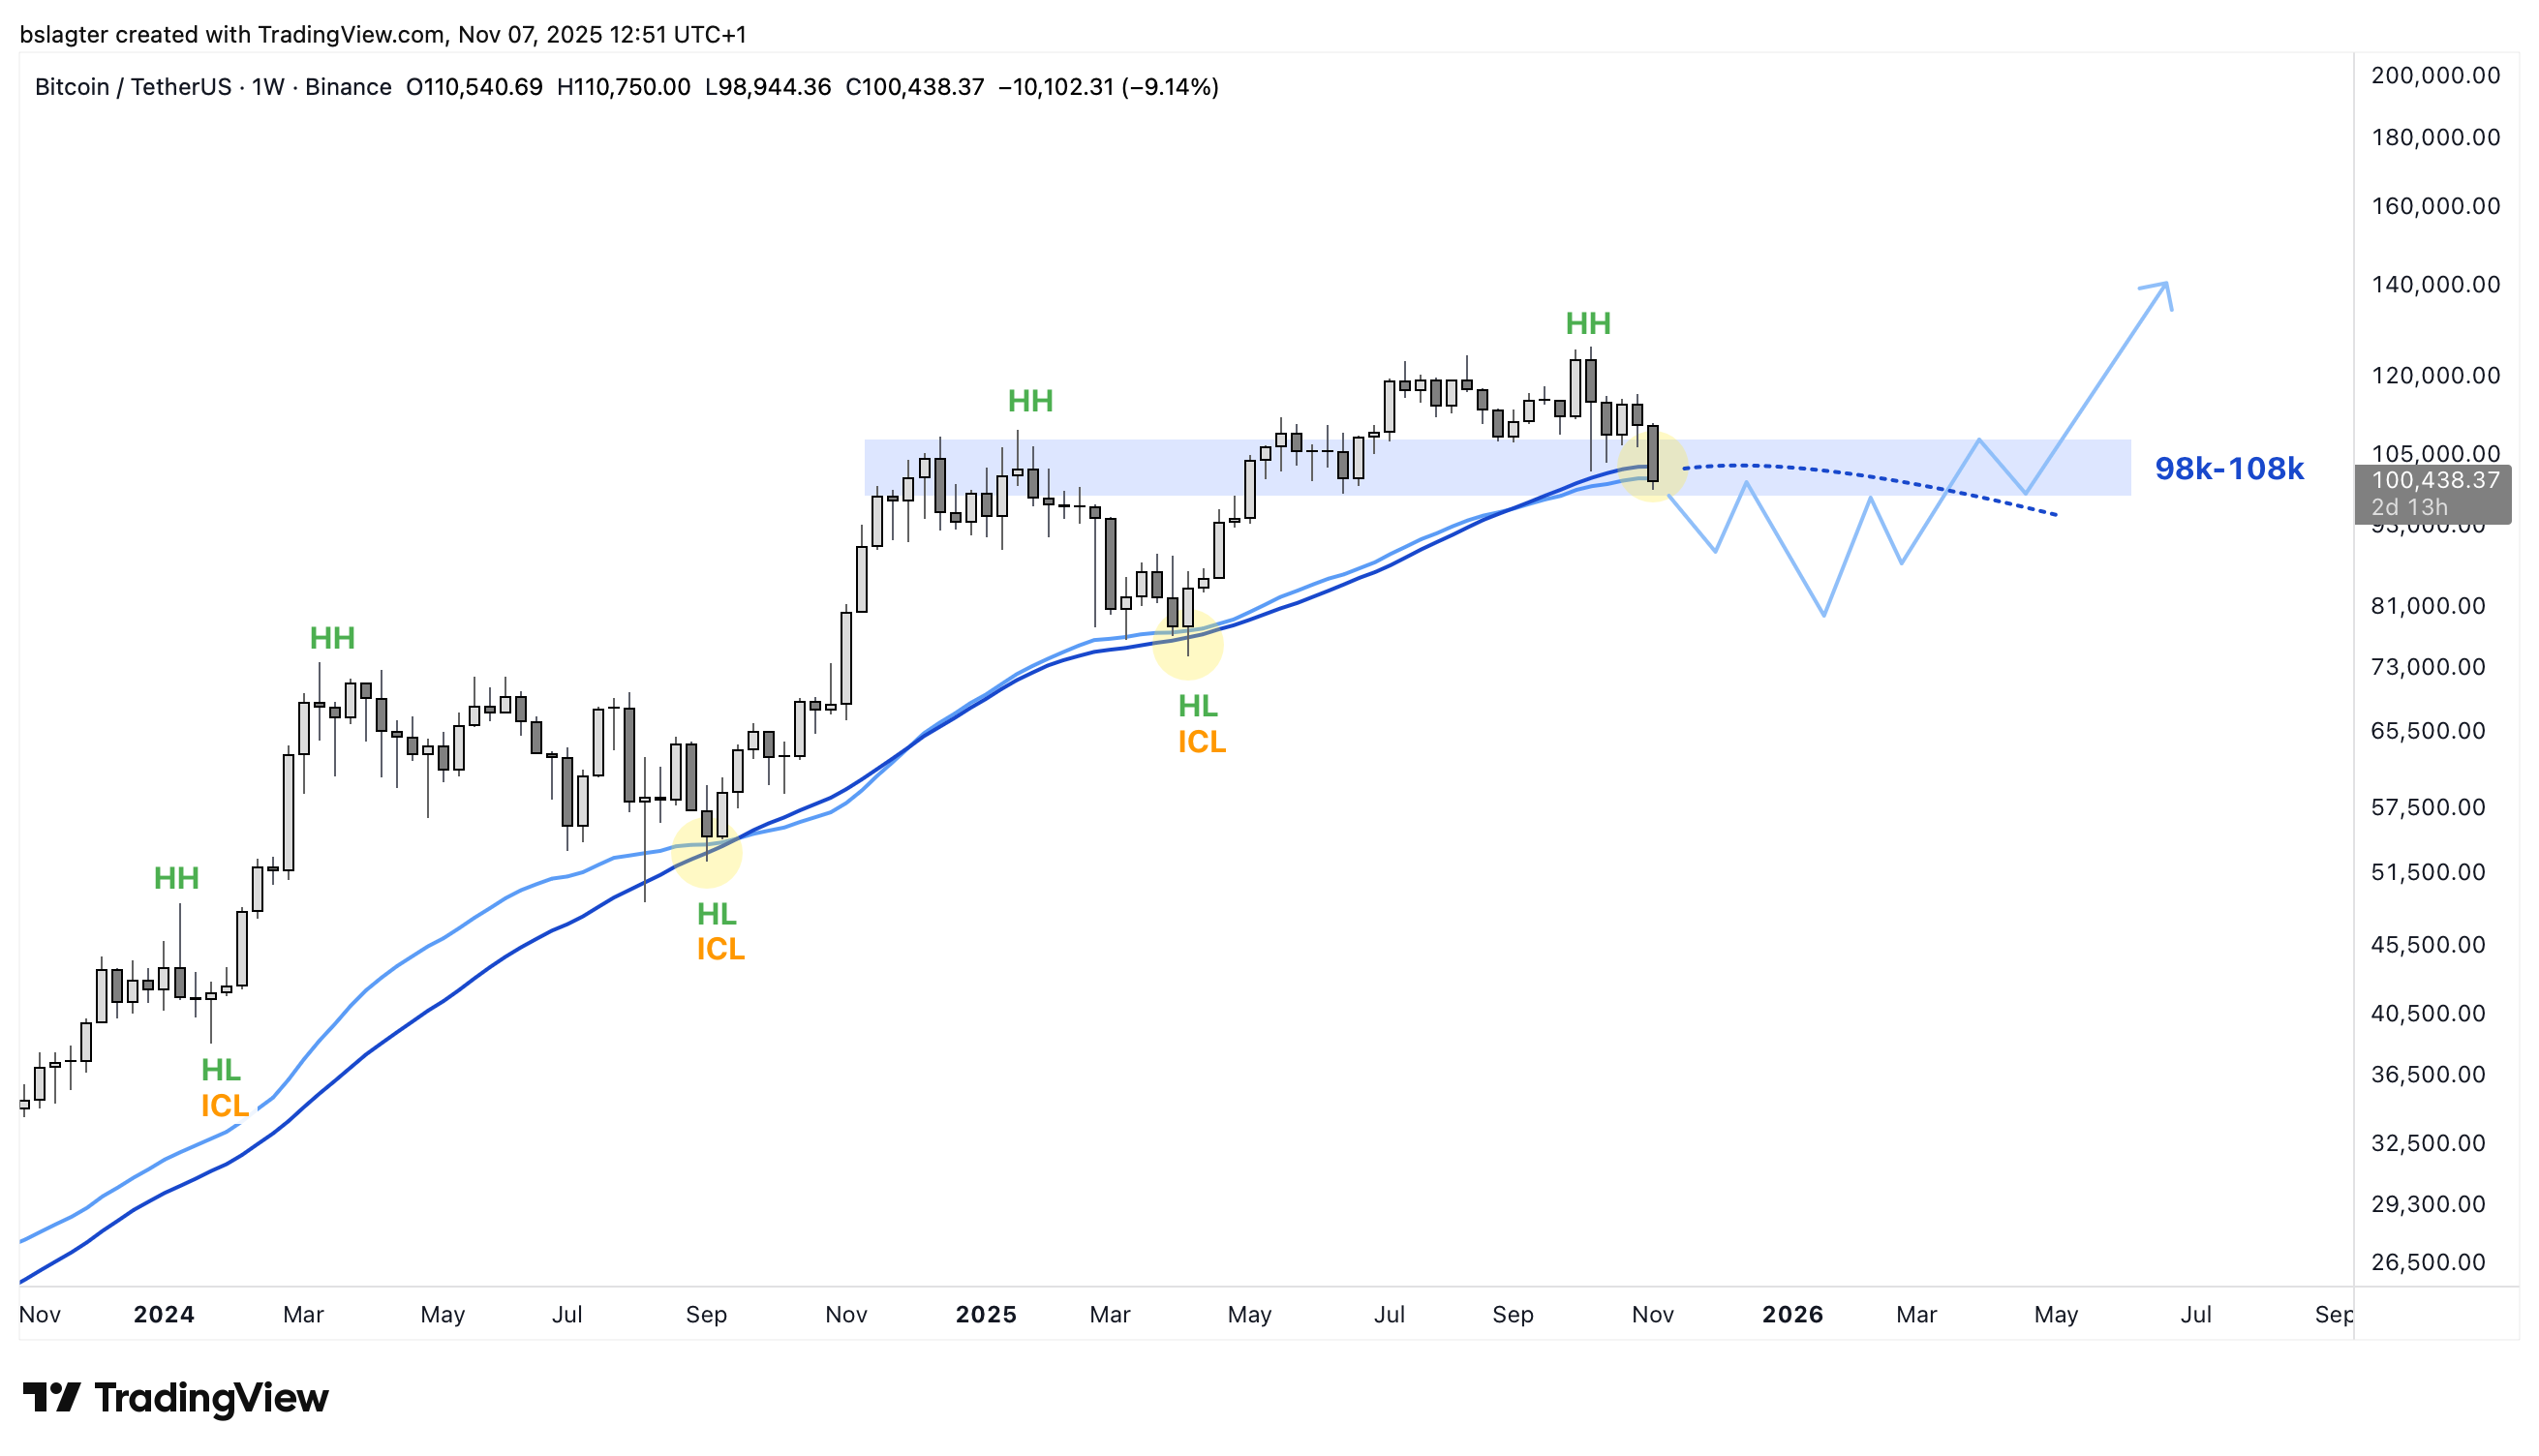
And in that context, Bitcoin has arrived at roughly the same point as on April 7, 2025, and September 6, 2024. Those also happened to be the last two bottoms on the weekly chart. The last two weekly cycle lows (ICL).
In the chart below, we see the first three of this (incomplete) list of signals that are characteristic of a weekly cycle low in a bull market:
- The price has dropped to the 50-week moving average (MA/EMA).
- The RSI on the weekly chart has fallen below 50.
- Momentum oscillators like the Stochastic RSI and DSS Bressert are at low values on the weekly chart.
- The MVRV has dropped to support at 1.8.
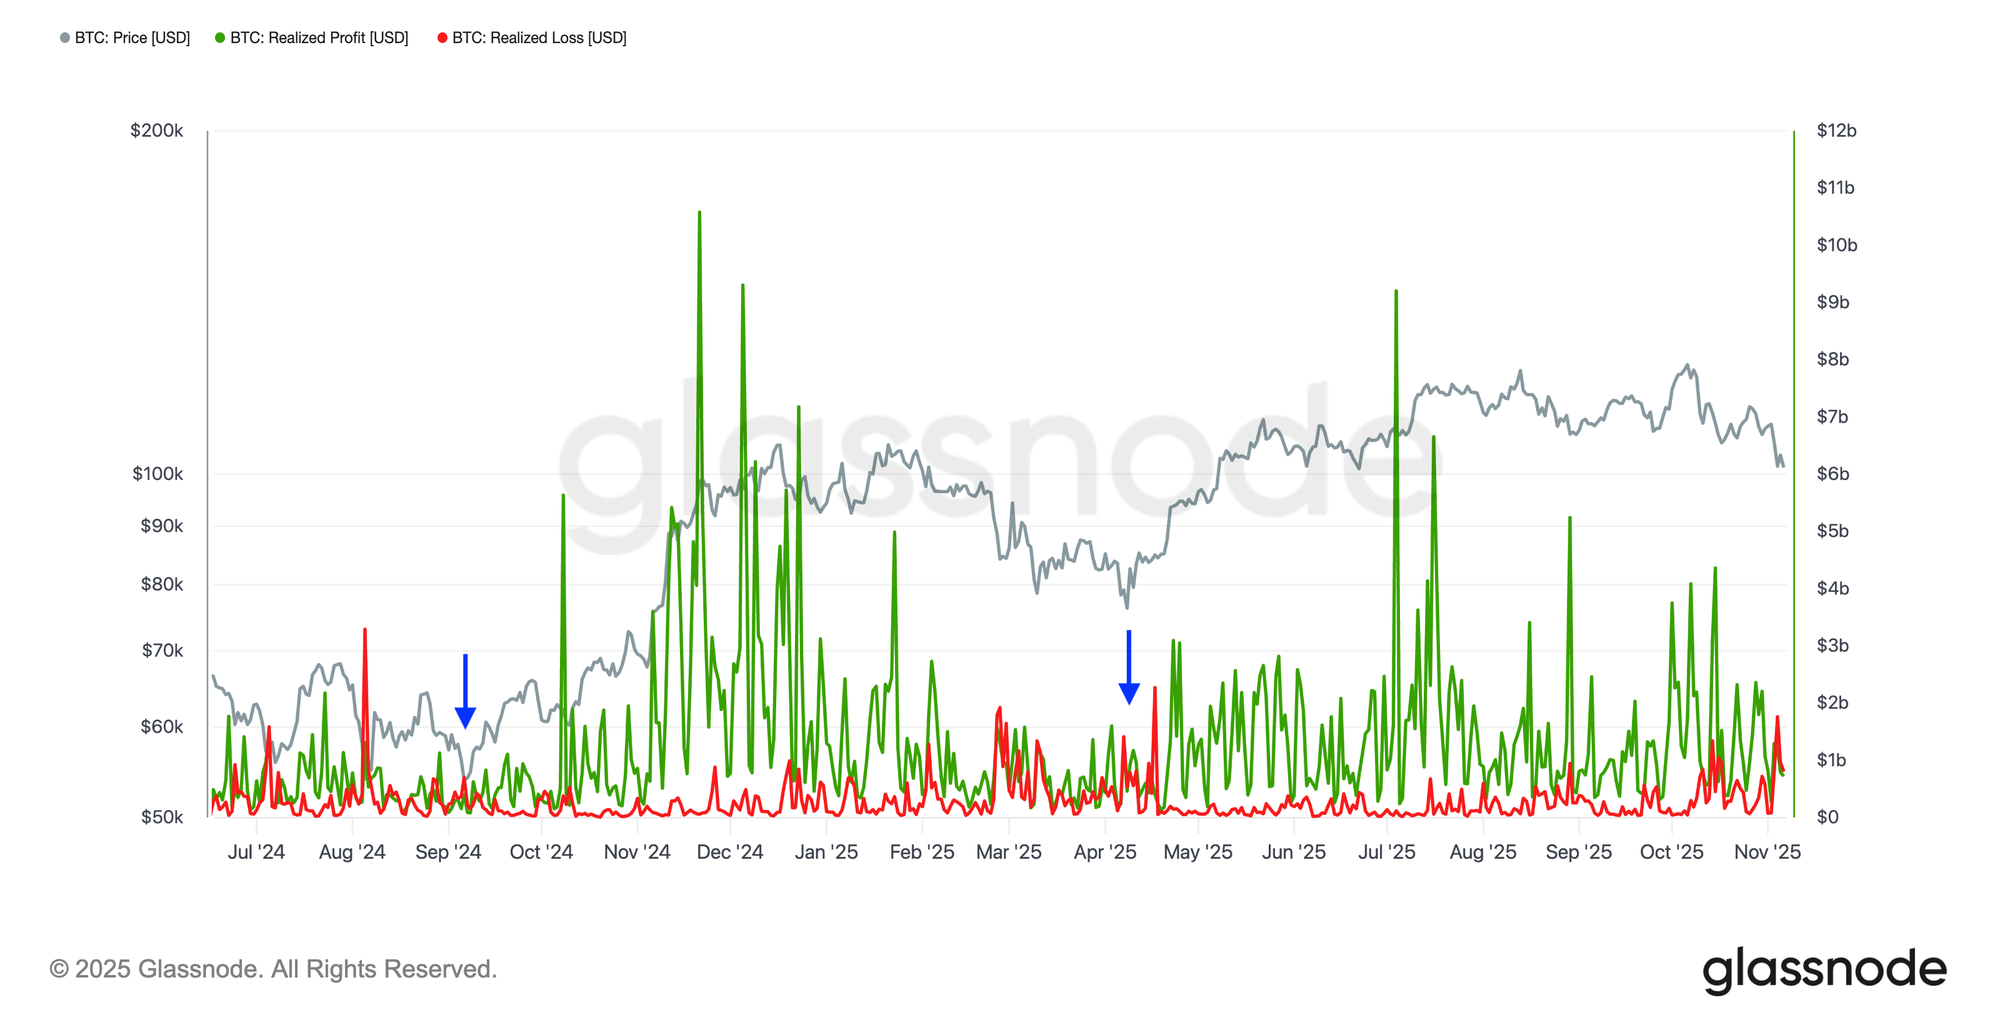
- We see a modest spike in realized losses in the on-chain data.
- The Fear & Greed Index has fallen below 25 and is at “Extreme Fear”.
- Sentiment has shifted from frustration and indifference to fear and panic.
But if the upcoming weekly cycle low is the start of a bear market, then the price will drop through the 50-week moving average, the RSI will fall much further, and the MVRV might even fall below 1.
The values we are seeing on these indicators now marked the turning point on previous occasions, because we were in a bull market.
This time, that's a lot more uncertain. There are now more data points consistent with a bear market than in April 2025 or September 2024. Based on that data, in the October 17th Markets edition, we arrived at a 35% chance of a bear market and a 65% chance of a bull market.
That remains unchanged because we had a monthly and weekly close above the dominant moving averages last weekend. If we were to break down through them now, the probability of a bear market would increase significantly.
It's worth considering that scenario. For some, this is just a mental preparation, as the decision has been made to hold a spot position for the next four years. Others might want to reduce their position slightly as more characteristics of a bear market regime become visible.
We often talk about the dominant moving average. That is the average that guides trends in a particular market and a particular time frame. In an uptrend, this average provides support, and in a downtrend, it provides resistance.
When choosing such an average, you always make a trade-off between false positives and false negatives. A signal that comes too early means you frequently exit and enter positions incorrectly, and in hindsight, would have been better off staying put. A signal that comes too late means you've already lost a lot by the time you react.
It's possible that the averages that are widely used now — the 50-week, the 12-month, the 400-day — are about to give a false signal. That's one of the risks of the game.
This could be a temporary breakdown, a downward spike that is quickly corrected. But there are also periods without a clear trend, where the market moves sideways and hovers around the average. Who knows, we might be at the beginning of a half-year of 'chopsolidation'.
As you can see, investing isn't easy. No one knows the future; the best we can do is understand the present as well as possible.
A good antidote is to divide your portfolio into parts with different time horizons. You would then exit with a portion of your stack to sidestep a cyclical bear market. The rest is intended for 2030 or thereabouts and stays safely in cold storage. This way, you're never at zero, but you also don't lose everything if a black swan event occurs.
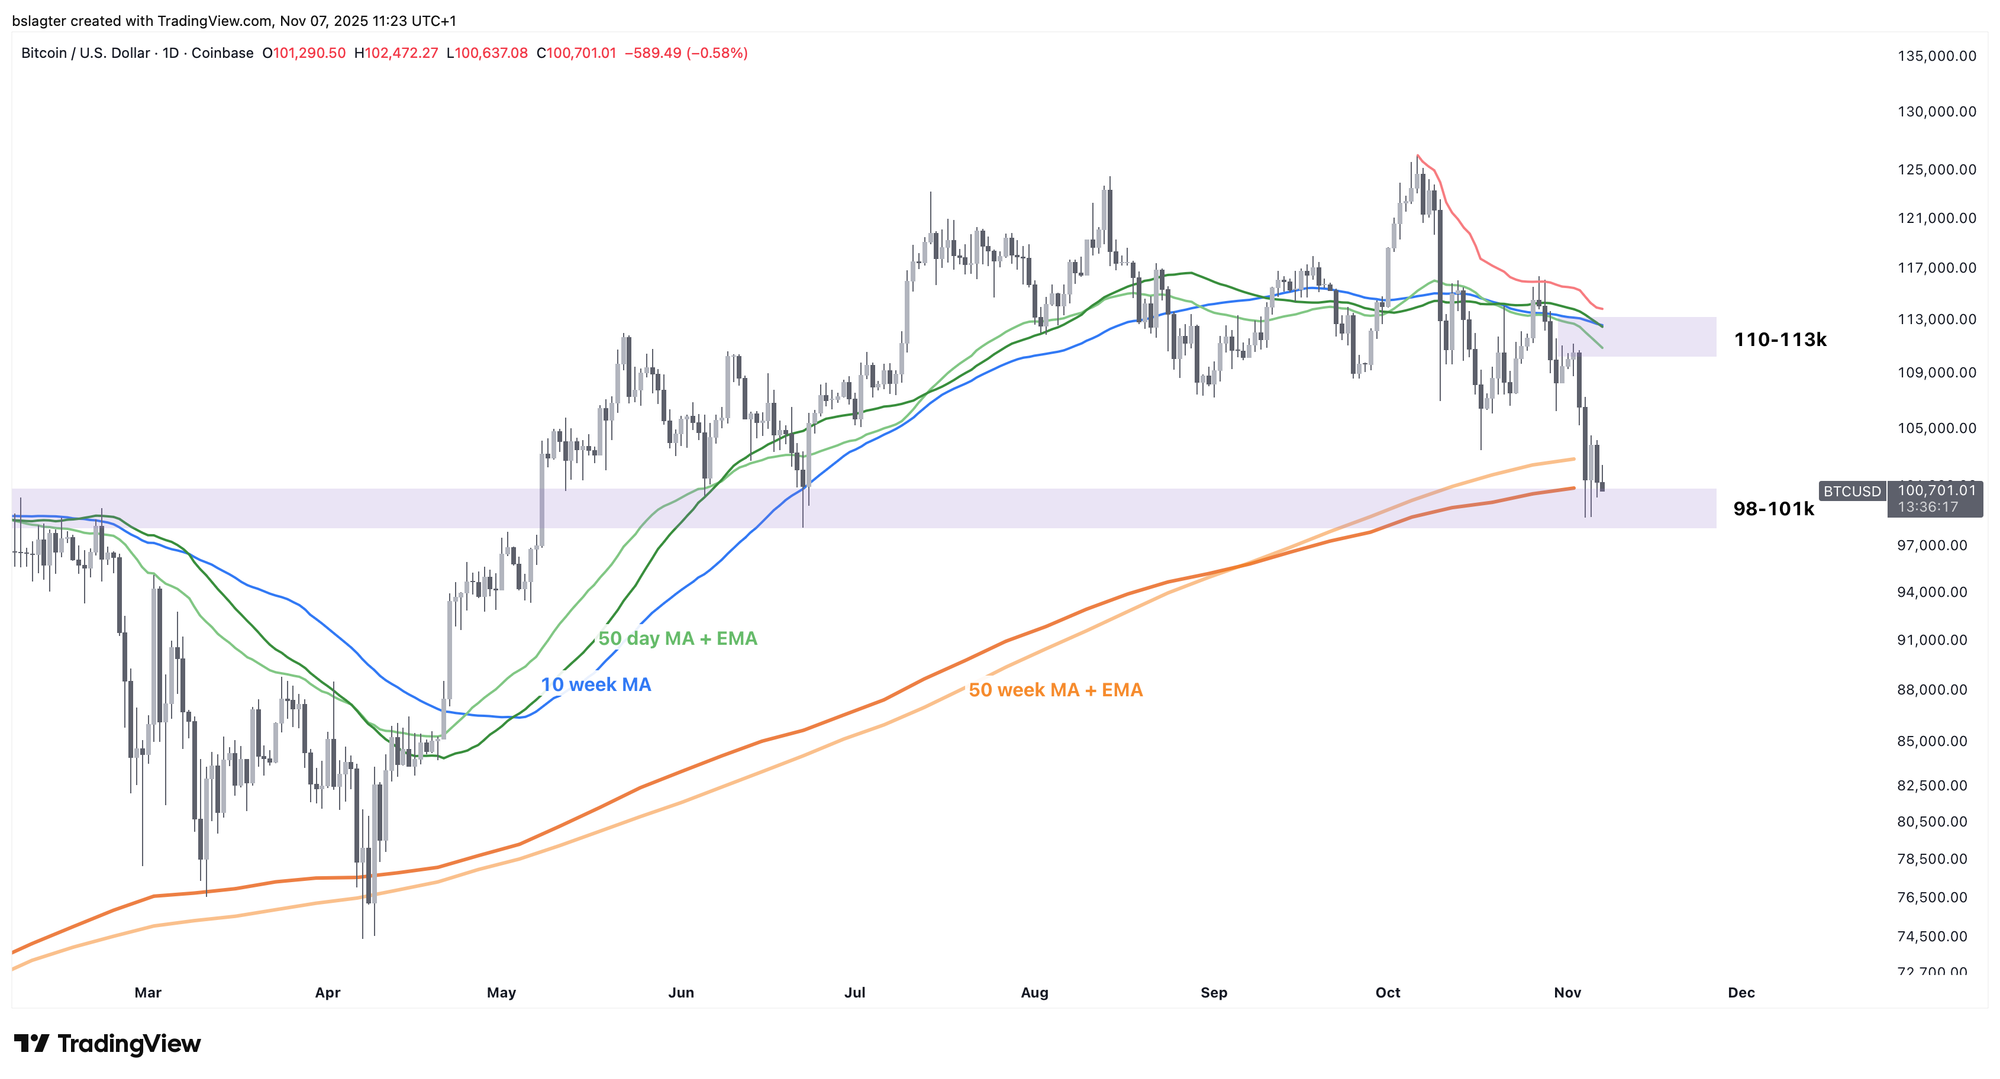
We're curious to see if the bulls will defend the 100k level. So far, there hasn't been a daily close below it. If that happens, we'll likely spend an extended period below 100k.
We will continue with the following topics for our Alpha Plus members:
- What's the deal with that 1.3 billion per day?
- The 50-week moving average in the last bear market
- Bert, what are you going to do yourself?
- Temporary pain, but not enough evidence for a bear market and recession
- Positive signs from the U.S. economy
- Fooled by treasury companies
1️⃣ What's the deal with that 1.3 billion per day?
Bert
We started last week's Alpha Markets with this paragraph:
A huge rotation is underway. Old investors are (partially) exiting and transferring their bitcoin to a new group. This has been happening for a year at a pace of 1.3 billion dollars per day.
So what about that 1.3 billion dollars per day? Are we still seeing capital flow into the Bitcoin market, or is the new group of investors keeping their wallets closed due to the "crash to 100k"?
We use the realized value as a metric. It increases when profits are realized by existing investors. On the other side of that transaction is someone entering the Bitcoin market with new capital.
In the past week, the realized value has not increased. This is not because no more profits are being realized, but because it is being offset by an equal amount of realized loss. They cancel each other out. The green line in the chart below is the realized profit, and the red line is the realized loss.
In a bull market, realized loss is often negligible, except around the weekly cycle lows. We've marked the previous two with a blue arrow. You can see that investors who entered around the top are exiting at a loss, thus realizing that loss. We are seeing this now as well, on the far right of the chart.
In a bear market, realized losses start to dominate. In a bull market, realized profits quickly regain the upper hand. We'll know which one it will be in a few weeks.
In short, new investors are still trickling into the market; they are just being offset by some panicking existing investors.
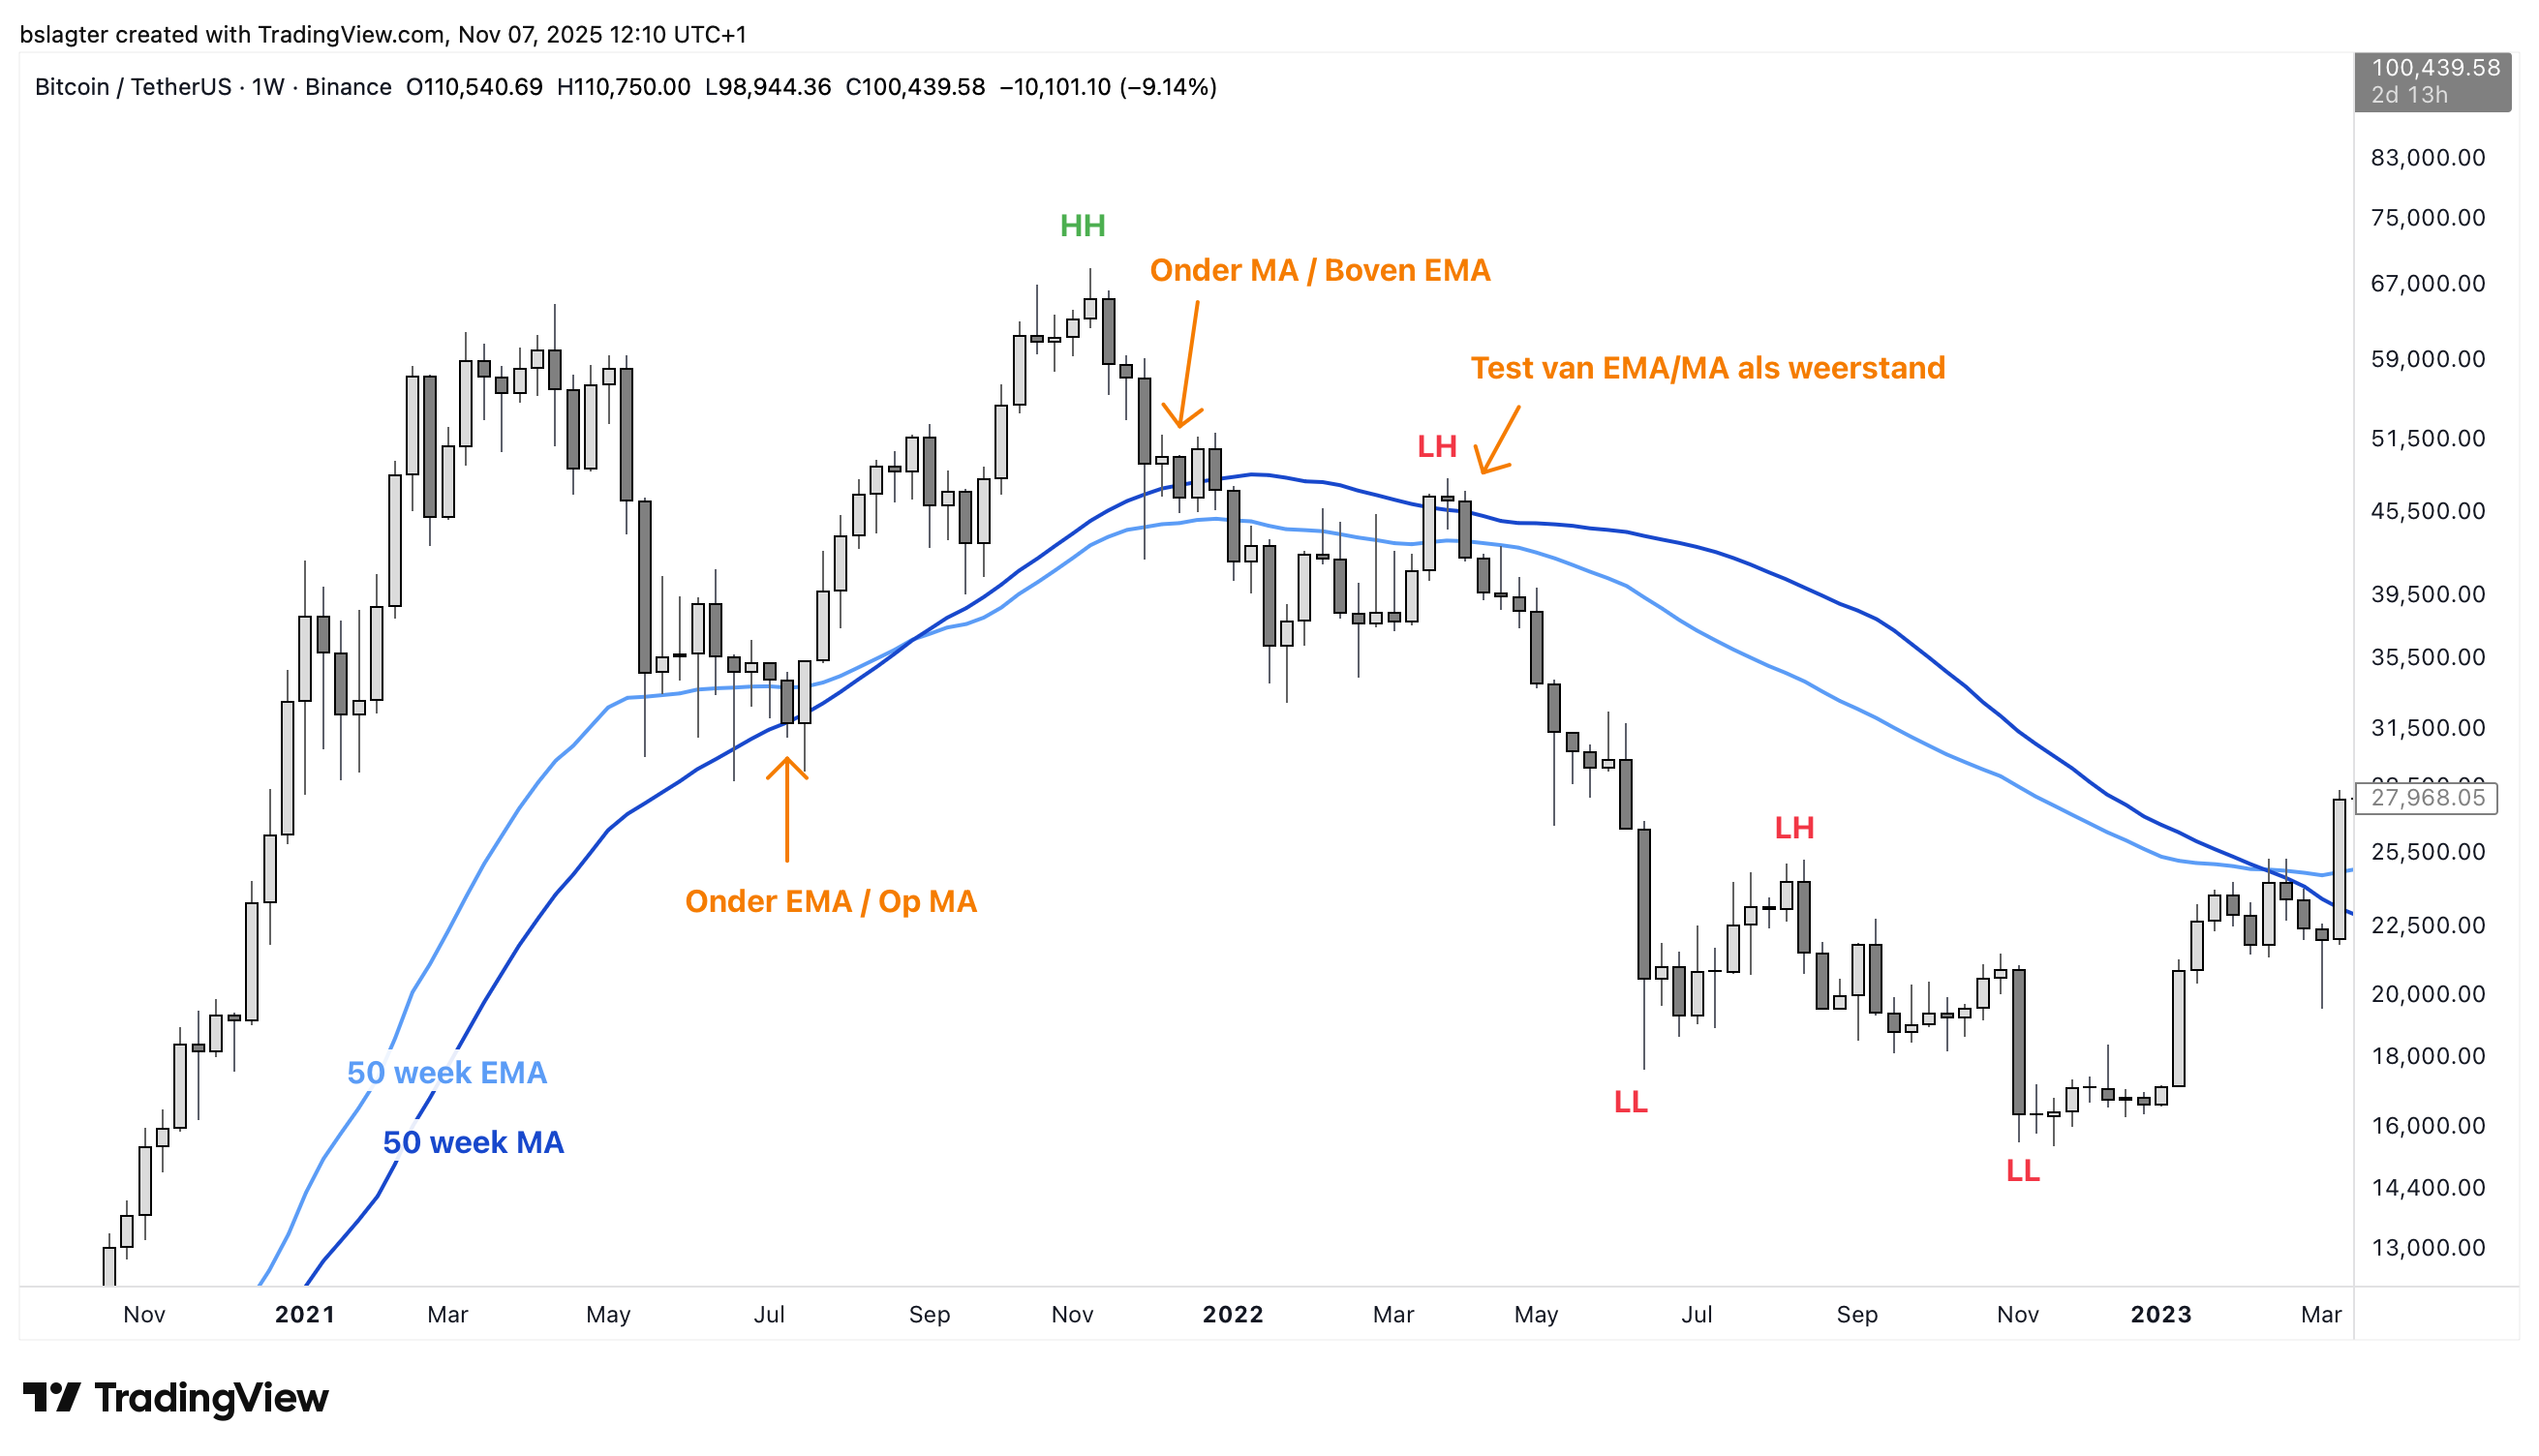
2️⃣ The 50-week moving average in the last bear market
What do you use as a signal to pull the trigger? No single signal is perfect. It's clear that moving averages with a length of about a year play a significant role on the Bitcoin chart. But when you try to translate that into a signal, you suddenly have to make quite a few choices.
- Do I use the daily, weekly, or monthly chart?
- Do I use the SMA, the EMA, or both?
- Is one weekly close enough, or do I want two in a row?
- Is being a cent below it enough, or do I want a certain distance?
Let's look at the last bear market. The chart below shows the 50-week (S)MA and EMA, and three orange arrows.
At the first arrow, the weekly close was a fraction below the MA. About 100 dollars, which is 0.3%. In hindsight, it was wise not to exit and to wait for confirmation.
At the second arrow, the weekly close was below the SMA but still above the EMA. If you had used the SMA, you would have flip-flopped in the following weeks. Here, the EMA performed better than the SMA.
At the third arrow, you can see the price testing the dominant moving average as resistance, a nice confirmation of a downtrend. But for both the MA and the EMA, you would have briefly re-entered.
This shows that it's not easy. There's an argument to be made for judging the dominant moving average a bit more leniently this time as well. The circumstances are different than in 2022.
Back then, we had a period of hype behind us with clear overvaluation and bubble formation. The central bank had just begun a series of aggressive interest rate hikes to slow down the economy and thereby curb inflation.
Now, from a macroeconomic perspective, a period of tailwinds seems to be approaching. And we have the stock market debut of Bitcoin behind us, with a whole new group of investors entering the market.
3️⃣ Bert, what are you going to do yourself?
Bert
Personally, with a large part of my portfolio, I'm not going to exit in a bear market at all. I HODLed through the ones in 2018 and 2022, and I'm going to do it again. That's because I know myself, and having "0 btc" in my portfolio makes me very anxious.
But with a portion of my portfolio, I will try. And then it doesn't matter much to me whether I exit at 96k, 90k, or even 80k. I mainly want to miss the potential drop from 80k to 40k.
Therefore, I will be lenient in my judgment. If we close near the 50-week moving averages on Sunday night, I'll wait another week. If we're a few percent below it, I will partially exit on Monday.
Should I exit, I accept the chance that I might have to re-enter in a few weeks or months at a small loss, in the event that the bull market continues after all. Breaking the average is, after all, just one of the characteristics of a trend reversal. Only with a lower low (below 74k) and a lower high (below 126k) will we have 100% certainty.
A possible scenario is a few months of sideways chop between 80k and 100k, followed by a new period of appreciation. In hindsight, we might call that a "mini bear market." I don't base this on what I see in the chart now, but on the macroeconomic conditions.
The essence of this is that governments worldwide are stimulating their economies, and their central banks are supporting that fiscal policy with increasingly accommodative monetary policy. These are favorable conditions for two types of investments: risk assets and assets with a degree of scarcity. Bitcoin falls into both categories.
This is how you can be bullish on the long term and bearish on the short term at the same time. Upon acceptance below the dominant moving average, my base case scenario becomes that we will see lower prices for the time being. Whether that's in a full, deep bear market or not. In that case, I will have exited with a portion of my portfolio, and with the other portion, I'll hodl straight through it.
4️⃣ Temporary pain, but not enough evidence for a bear market and recession
Thom
Bitcoin is, above all, an asset that is extremely sensitive to global liquidity, the amount of capital available for investment worldwide. Like many stocks that struggled this week, Bitcoin is at the far end of the risk spectrum.
Simply put: Bitcoin is an asset that performs best when investors are fully embracing risk and liquidity is sloshing around.
After the U.S. central bank's hawkish interest rate decision last week, that is temporarily not the case. The real interest rate - interest rates minus inflation expectations, the actual return on capital - has consequently increased.
This chart shows inflation expectations for the next 12 months (thin blue line) versus the terminal rate that the market expects from the U.S. central bank in 2027. While inflation expectations have dropped sharply, the expected terminal rate has actually climbed slightly, or at least has not fallen along with them.
Very simply: if you can earn 5% on government bonds when inflation is 5%, that's not attractive. If inflation drops to 2%, you suddenly get a real interest rate of 3% on the same bonds, and that's much more appealing.
You can then increase your purchasing power with little risk.
Is this the end of the bull market for Bitcoin and other risk assets? No, I don't think so. My suspicion is still that this is a temporary move, in which the U.S. dollar strengthens due to these developments.
We are still dealing with extremely low credit spreads - companies have to pay very little extra interest to borrow capital compared to what the U.S. government pays on its bonds.
At the same time, the U.S. central bank has begun a cycle of rate cuts, and the government is also doing everything it can to support the economy. A recession is still very unlikely.
Bitcoin now needs U.S. dollar weakness. This could come if the U.S. central bank doesn't live up to its hawkish press conference and proceeds with the rate cuts the market was previously expecting.
In other words, the real interest rate needs to fall. In addition, it would be good for Bitcoin if there is a period where it outperforms the returns of tech giants and AI companies, so that momentum shifts back towards the digital currency.
For now, however, it is too early, in my opinion, to say that there has been a structural change in the macro climate. There are still too few clear indications that the credit cycle is taking a negative turn and that we are heading for a bear market and a recession.
5️⃣ Positive signs from the U.S. economy
Thom
Due to the U.S. government shutdown, we've had to do without much macroeconomic data for a while. Especially concerning the labor market, which the U.S. central bank was most worried about, very few useful figures are being released.
Nevertheless, there are a few data points that suggest the U.S. economy may be entering a new phase of acceleration. An increasing number of small businesses are indicating that they plan to hire new people.
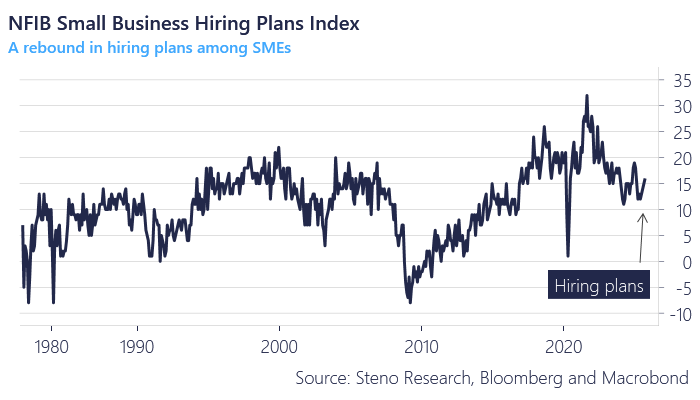
This is interesting because the concerns were mainly about smaller companies. In recent weeks, I've seen more and more analysts mentioning the K-shaped economy. This is the idea that one part of the economy is rock-solid (especially the tech giants/AI companies), while the lower tier is struggling.
The following chart also points towards a U.S. economy that is confident about the future. This chart shows business formation applications that have a high probability of growing into companies with a payroll, meaning they will be hiring people.
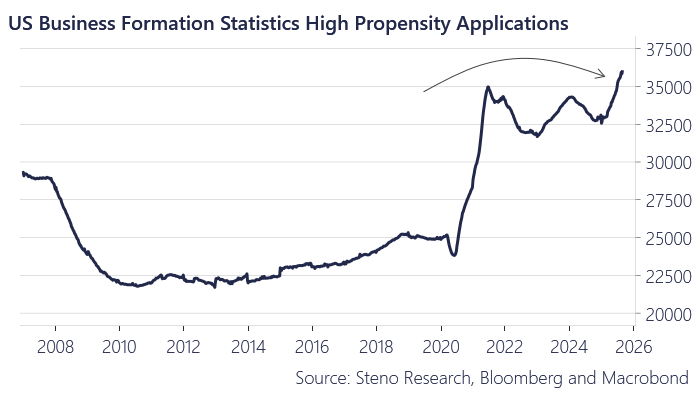
We are currently seeing a sharp increase in this, which is another piece of evidence that the U.S. economy is doing quite well.
It would be going too far to draw conclusions based on these figures alone, but we can say that these are not developments that are consistent with a recession. I still see few reasons to assume that the U.S. economy is heading in the wrong direction, and I consider the chance of a recession to be small.
This is important for Bitcoin, as a strong U.S. economy is a key condition for the continuation of the bull market. Based on the current overall picture, this remains my main scenario for the coming months, despite all the adversity we are currently facing.
If that scenario plays out, we'll immediately debunk the idea that Bitcoin's four-year cycle is some kind of law of nature, and we'll kill two birds with one stone.
6️⃣ Fooled by treasury companies
Bert
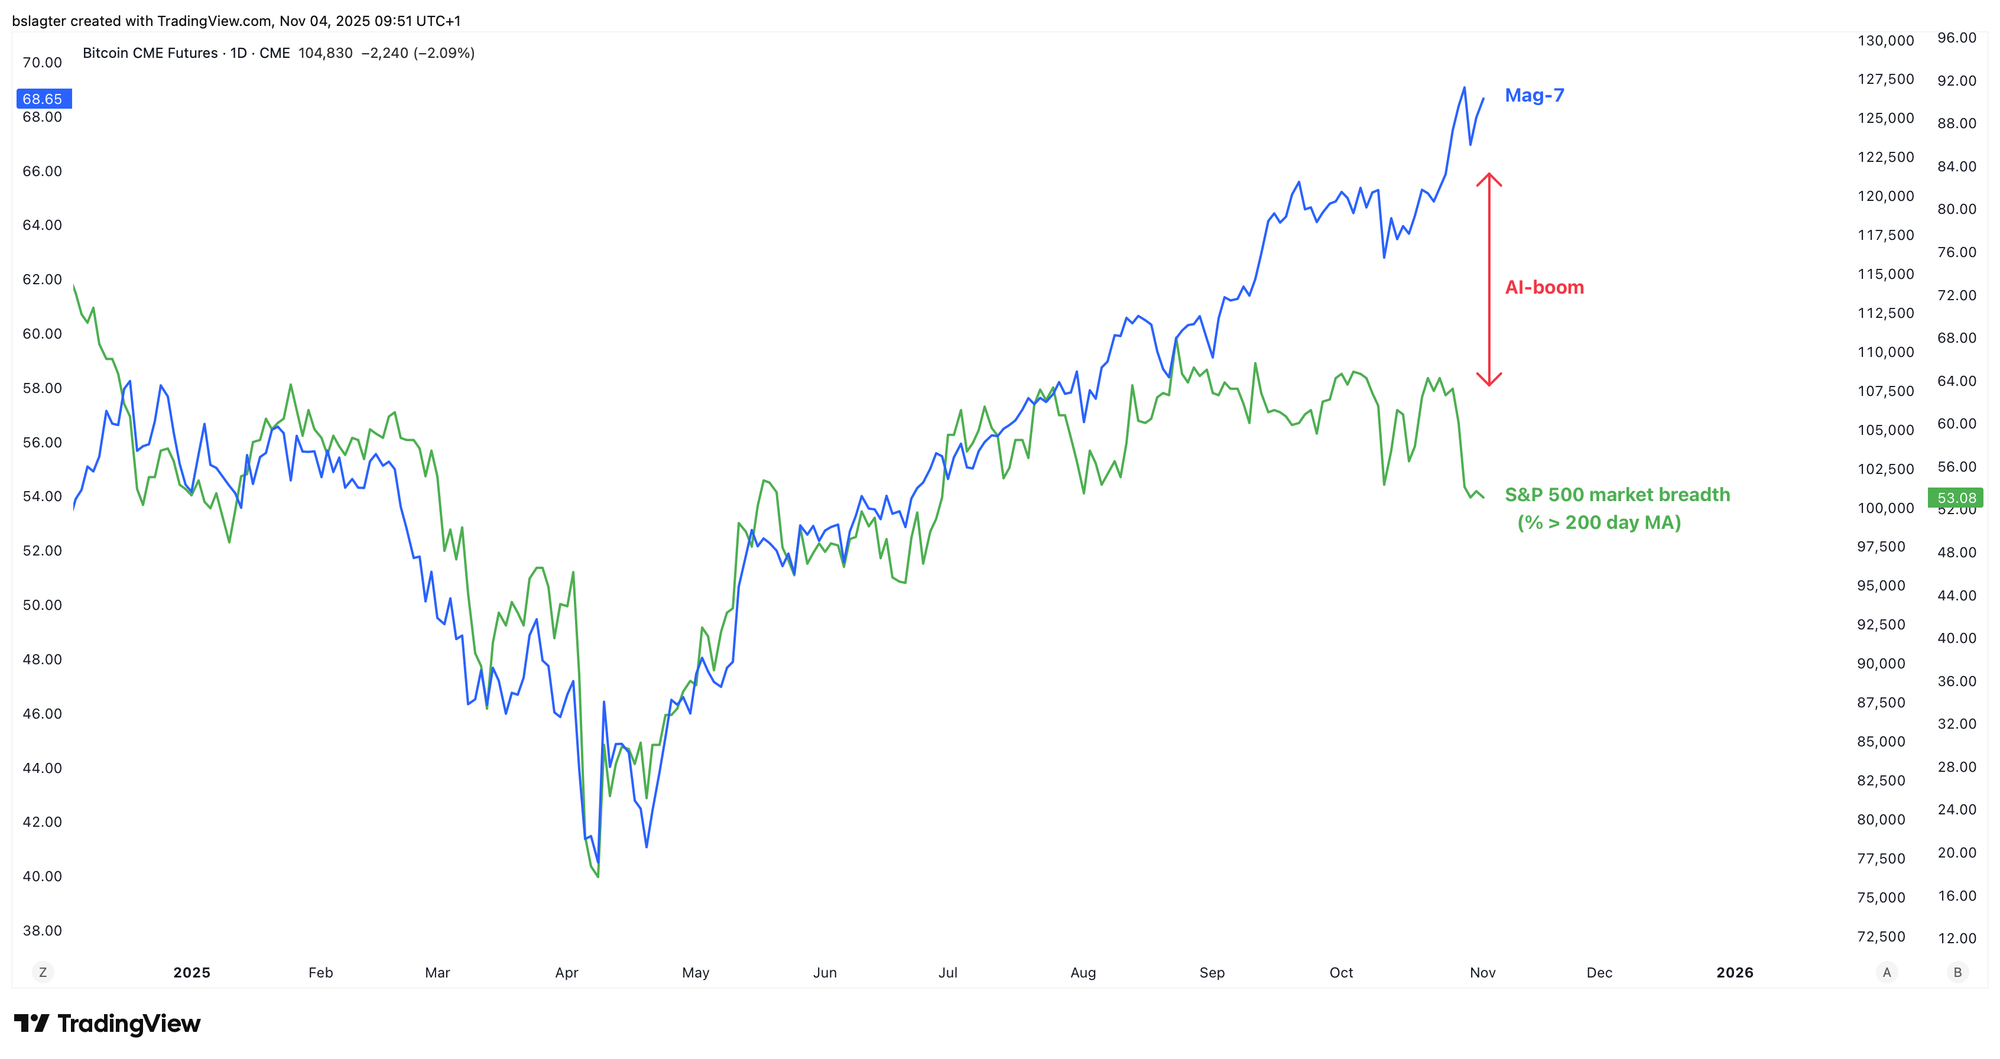
We began this Alpha Markets by observing that a few large tech giants are pulling the entire S&P 500 upwards. If you look at the equally weighted version of the S&P 500, its performance in recent months is far less impressive.
You can also look at market breadth. This is the extent to which the companies in the index are participating in the trend, in this case, the rise. You can measure this by counting how many of the 500 companies are above their 200-day moving average.
In the chart below, the 'magnificent seven', representing the AI boom, are in blue. The market breadth of the S&P 500 is in green. And Bitcoin is in black.
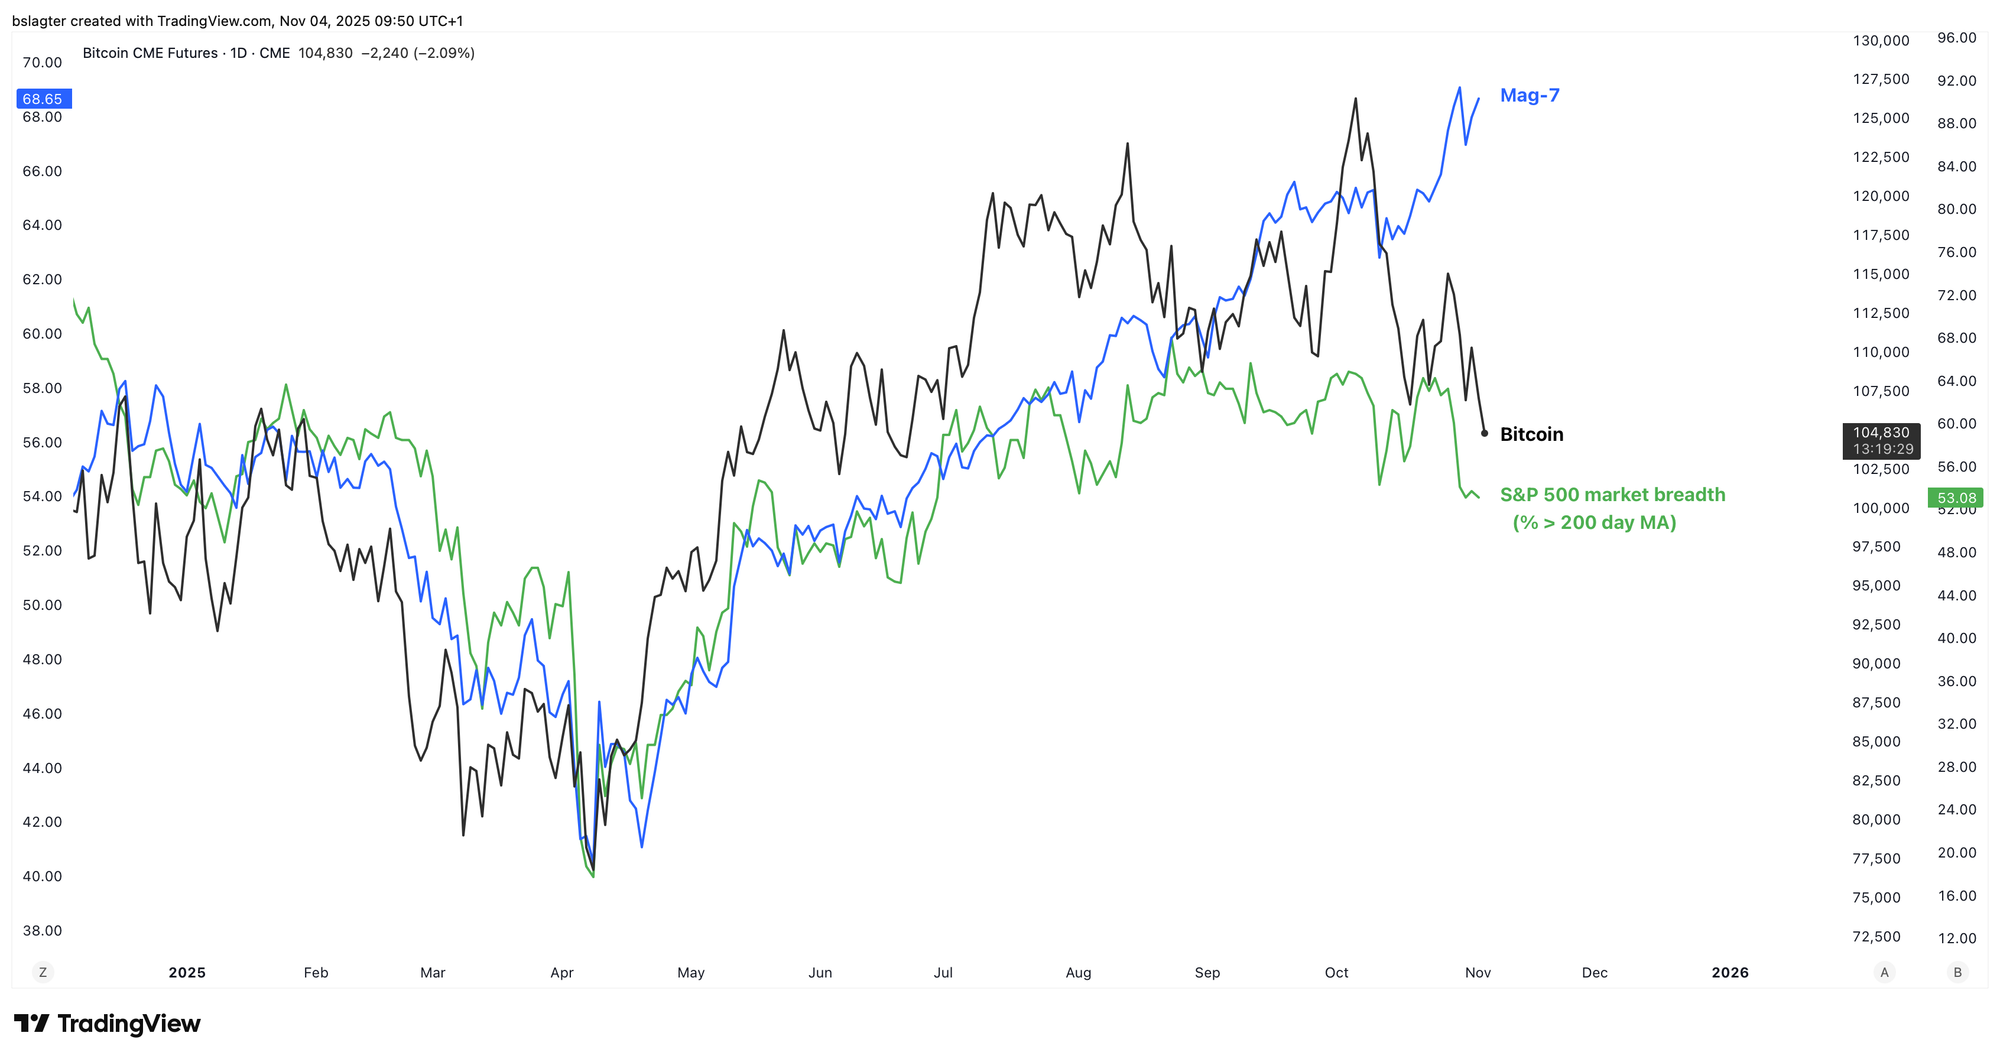
In the spring, Bitcoin actually performed much better than you would expect based on general risk sentiment. This can likely be attributed to the bitcoin treasury hype.
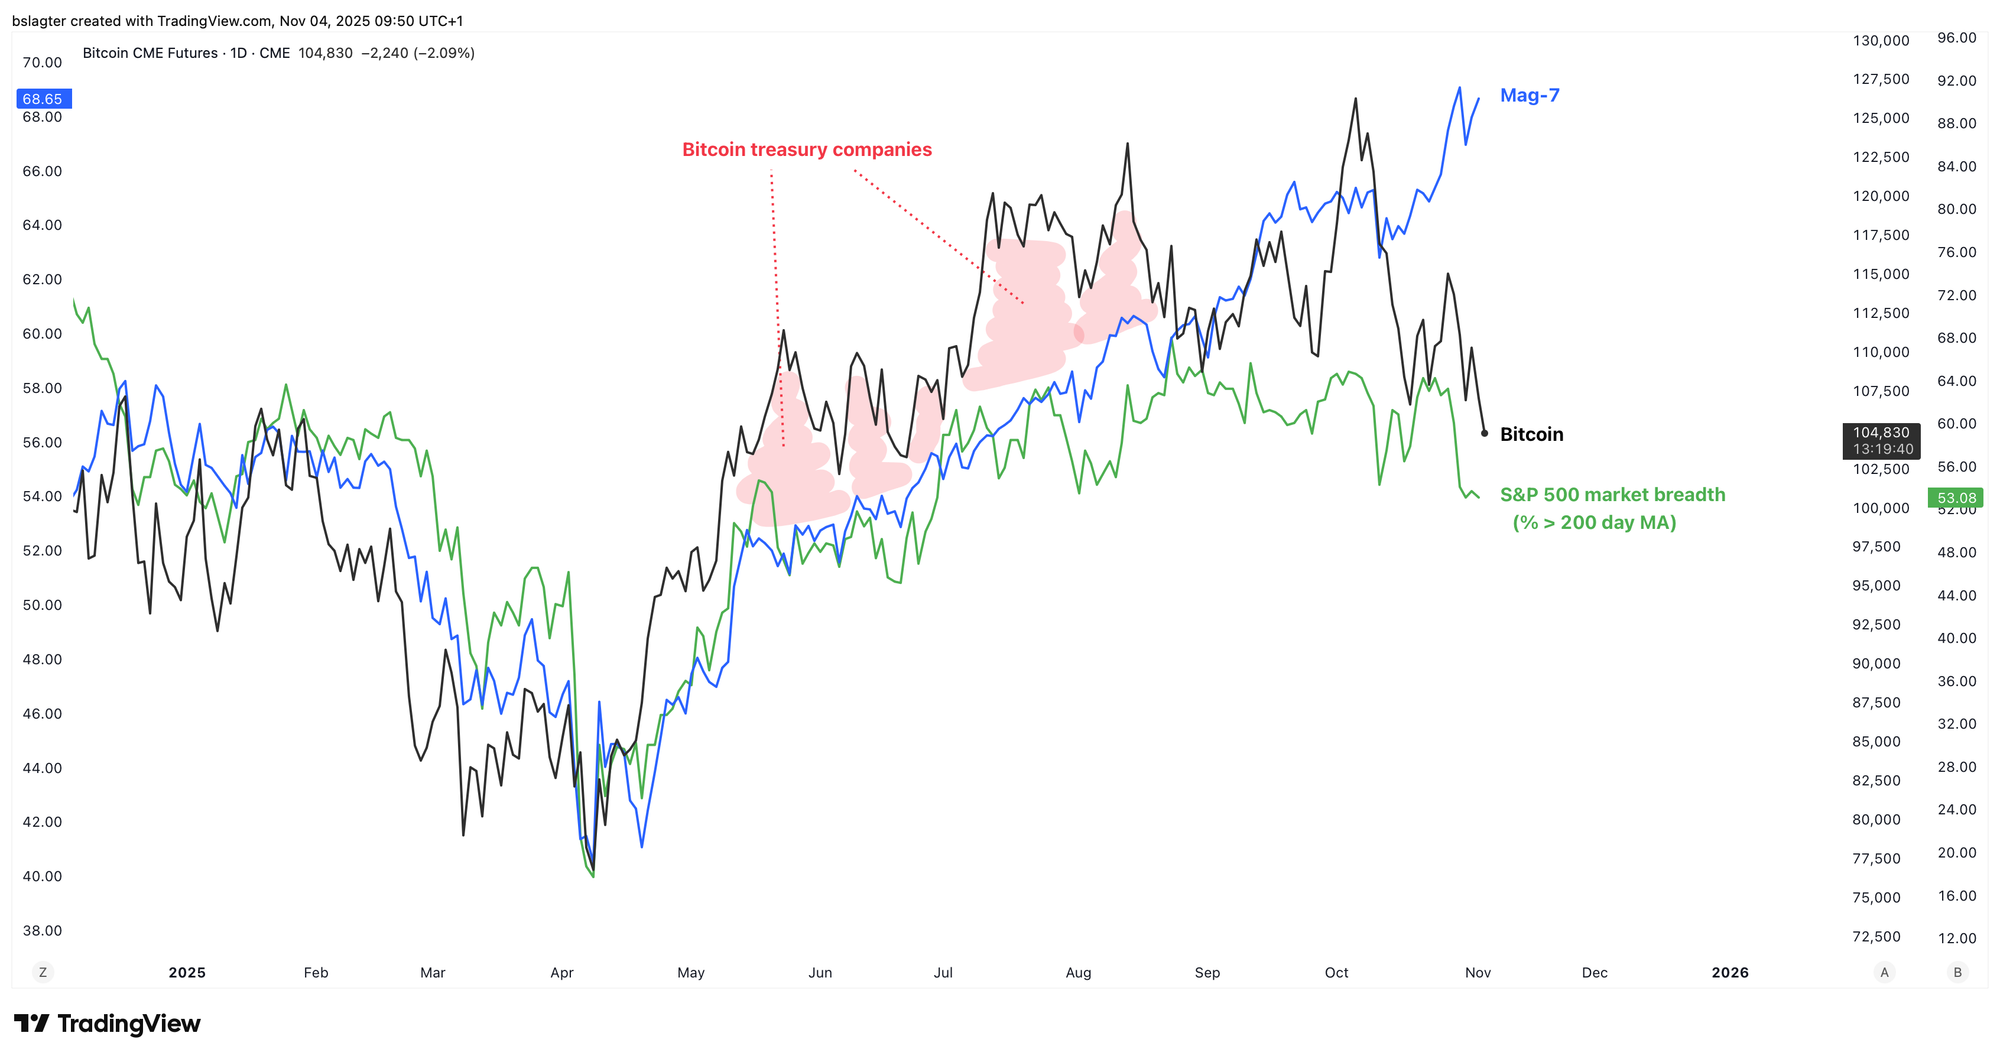
And the AI boom has caused major stock indexes to perform better than the majority of the companies within them in recent months.
You could say that in recent months, Bitcoin has actually been neatly following liquidity and risk appetite. In the months before that, Bitcoin was somewhat inflated by the treasury hype. And now, stock indexes are telling a slightly too-positive story due to the AI boom.
It seems realistic to expect that these will all converge again. A short period of cooling off for stocks, during which Bitcoin performs relatively well, would make that happen.
Thank you for reading!
To stay informed about the latest market developments and insights, you can follow our team members on X:
- Bart Mol (@Bart_Mol)
- Peter Slagter (@pesla)
- Bert Slagter (@bslagter)
- Mike Lelieveld (@mlelieveld)
We appreciate your continued support and look forward to bringing you more comprehensive analysis in our next edition.
Until then!