Gloomy and Grim
Bitcoin’s weekly cycle sours as doomsday narratives grip the market. With investors selling at a loss, $3B in liquidations, and a potential bottom near 108k, is more decline imminent or is a bull run still ahead? Dive in to explore the uncertain tale of today's crypto.

The final weeks of a weekly cycle rarely feel comfortable. As we wind down the six‐month wave, the atmosphere becomes gloomy and somber. Investors who bought near the peak are now selling at a loss, and concerns about even lower prices are mounting.
“Narrative follows price,” even on the downside. Now you mostly hear stories explaining why bitcoin’s value has been falling for weeks, even as gold and stocks hit all-time highs just last week:
- “Based on the halving, it’s logical that the peak occurs in August. The bear market has now begun.”
- “Capital is moving from bitcoin to gold, silver, and commodities in general. Crypto is falling out of favor.”
- “MicroStrategy is on the brink of collapse, and other bitcoin treasuries are in even worse shape.”
- “Geopolitical tensions are rising: new tariffs from Trump and escalating clashes with Russia.”
- “Inflation remains insufficiently contained, and central banks are unlikely to lower rates.”
Each of these points contains a kernel of truth, but when exaggerated unrealistically, they give rise to implausible doomsday scenarios. They are the flip side of the epic narratives circulating amid the euphoria of an explosive rally.
Let’s consider two examples. Although we’re in the final phase of the bull market, which could still last another six months, MicroStrategy’s stock is indeed lagging behind bitcoin; however, there is no immediate crisis, and Saylor isn’t rushing to sell his bitcoin.
Each time the correction ends and we enter a new phase of gains, the fears melt away like snow in the sun. Come morning, the nightmares seem much less intimidating.
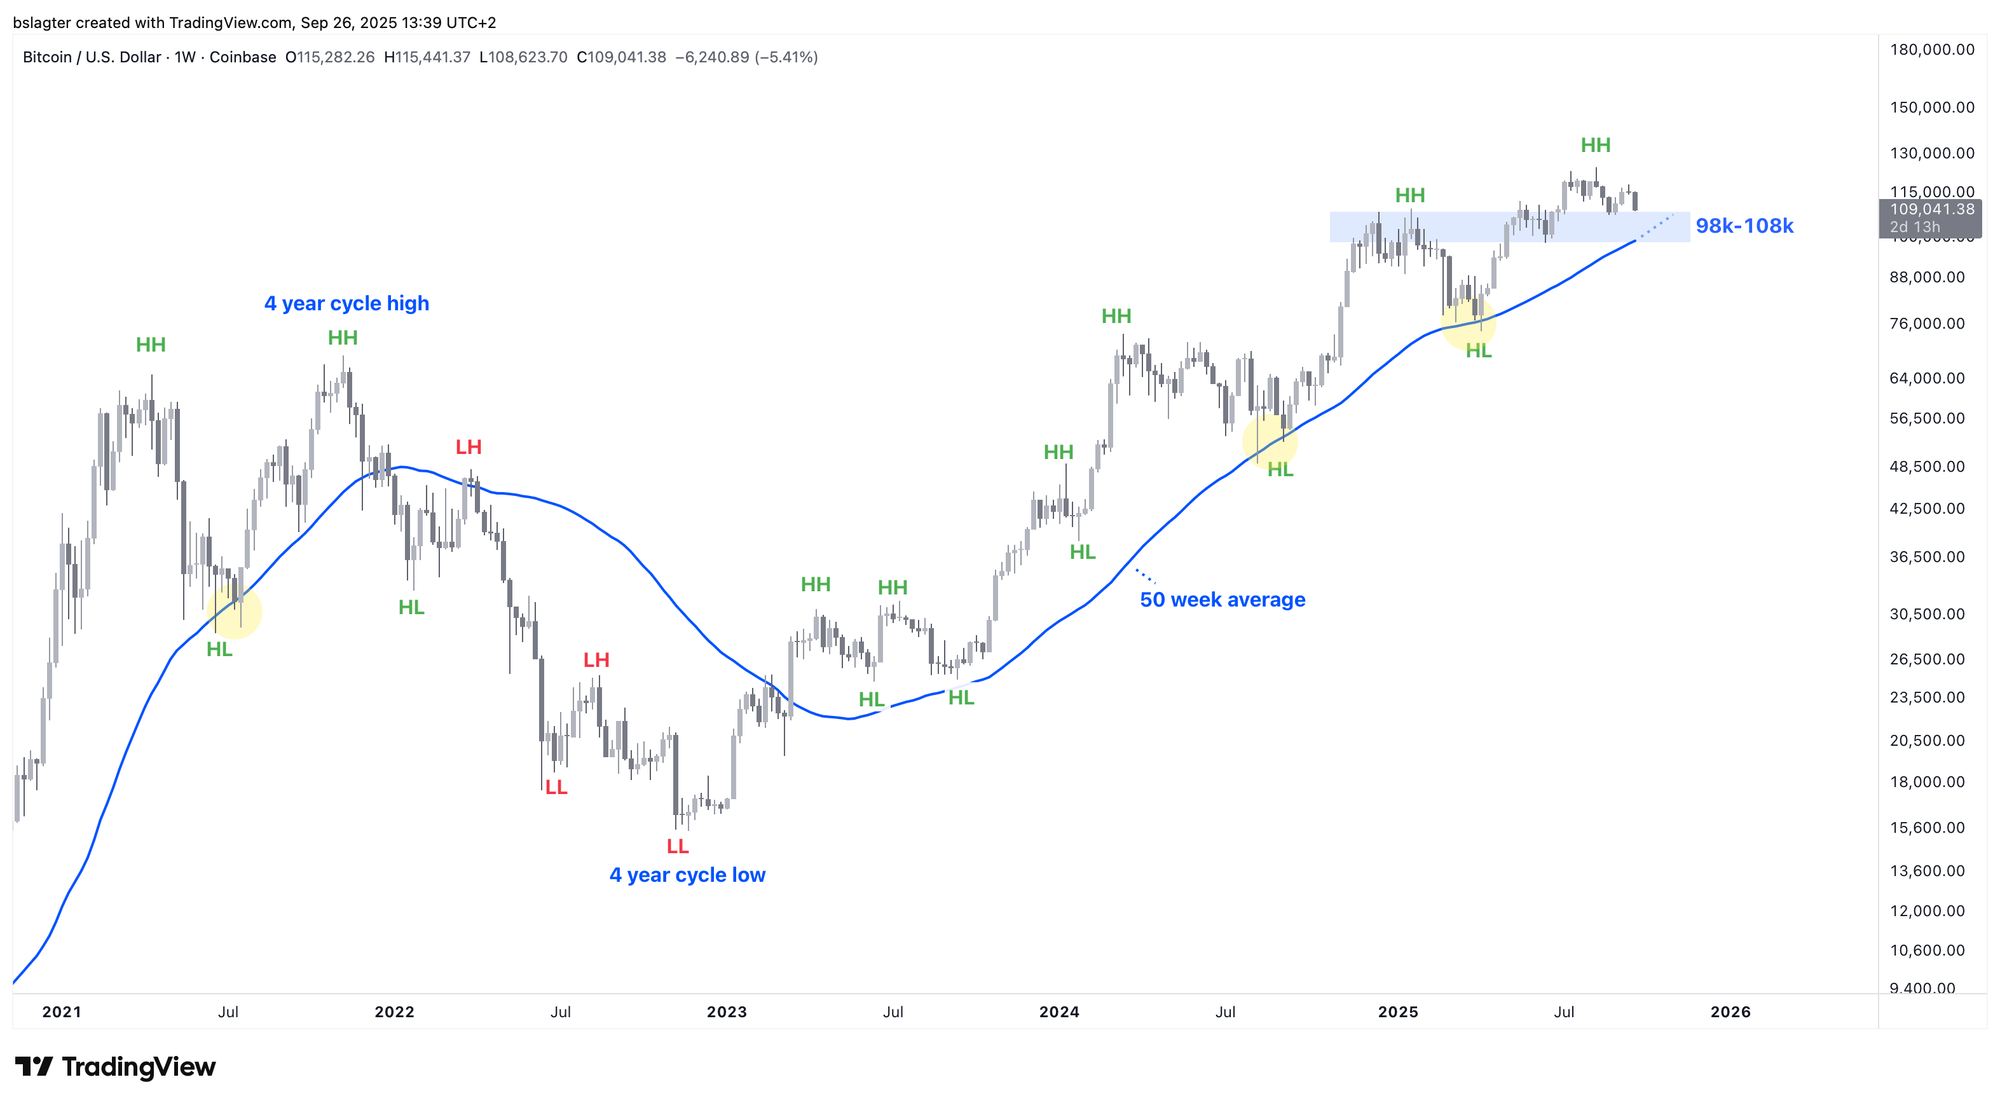
But that hasn’t happened yet. Right now, we are still in the declining part of the weekly cycle—the correction that followed the rise from 75k in April to 125k in August.
We expect a bottom somewhere between 98k and 108k. Yesterday and today, we’ve already seen boards showing 108k. In theory, that could be it, but it’s more likely we haven’t reached the bottom yet.
Back in March, we were in the same phase of the weekly cycle as we are now—amid concerns over a potential war between Iran and Israel, and Trump’s trade war that was expected to plunge the world into a recession.
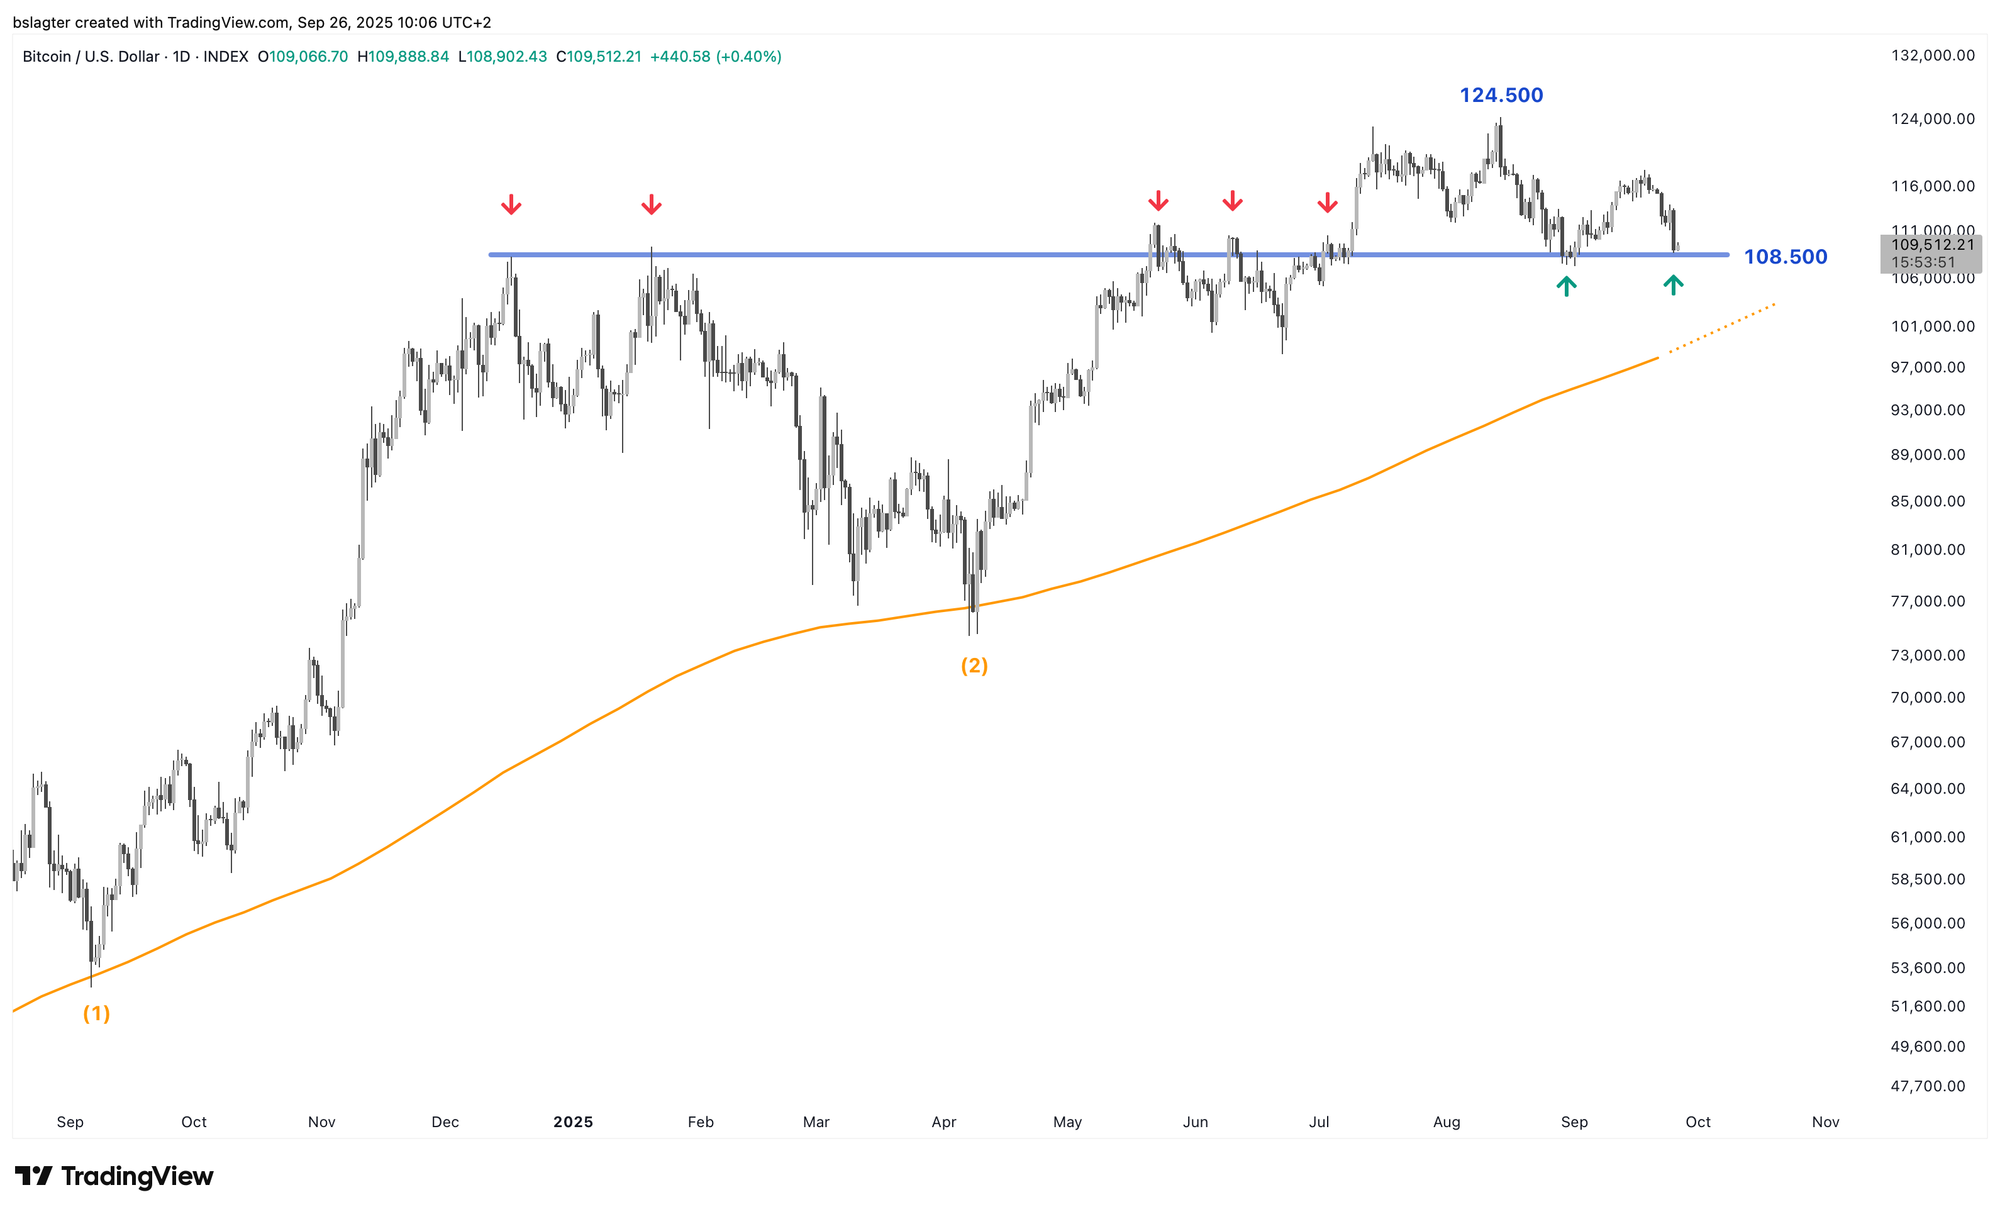
Below is a graph showing the period from April 7, when the weekly cycle hit its low (ICL), up to today. We chose a starting point that was comparable in terms of the daily cycle timing, the oscillator reading at the bottom, and its distance from the 50-week moving average (green).

It’s possible that yesterday’s $108,600 already marked the ICL. However, it seems more likely that we might drop a bit further—below the $107,250 reached on September 1. The ICL is typically the lowest point of the last daily cycle within the weekly cycle.
This is also the path we outlined a few weeks ago when the price lost momentum in the golden pocket—the blue rectangle on the graph below. In one sweep, the price dipped below both the 50-day moving average (blue) and the VWAP from the top (green).
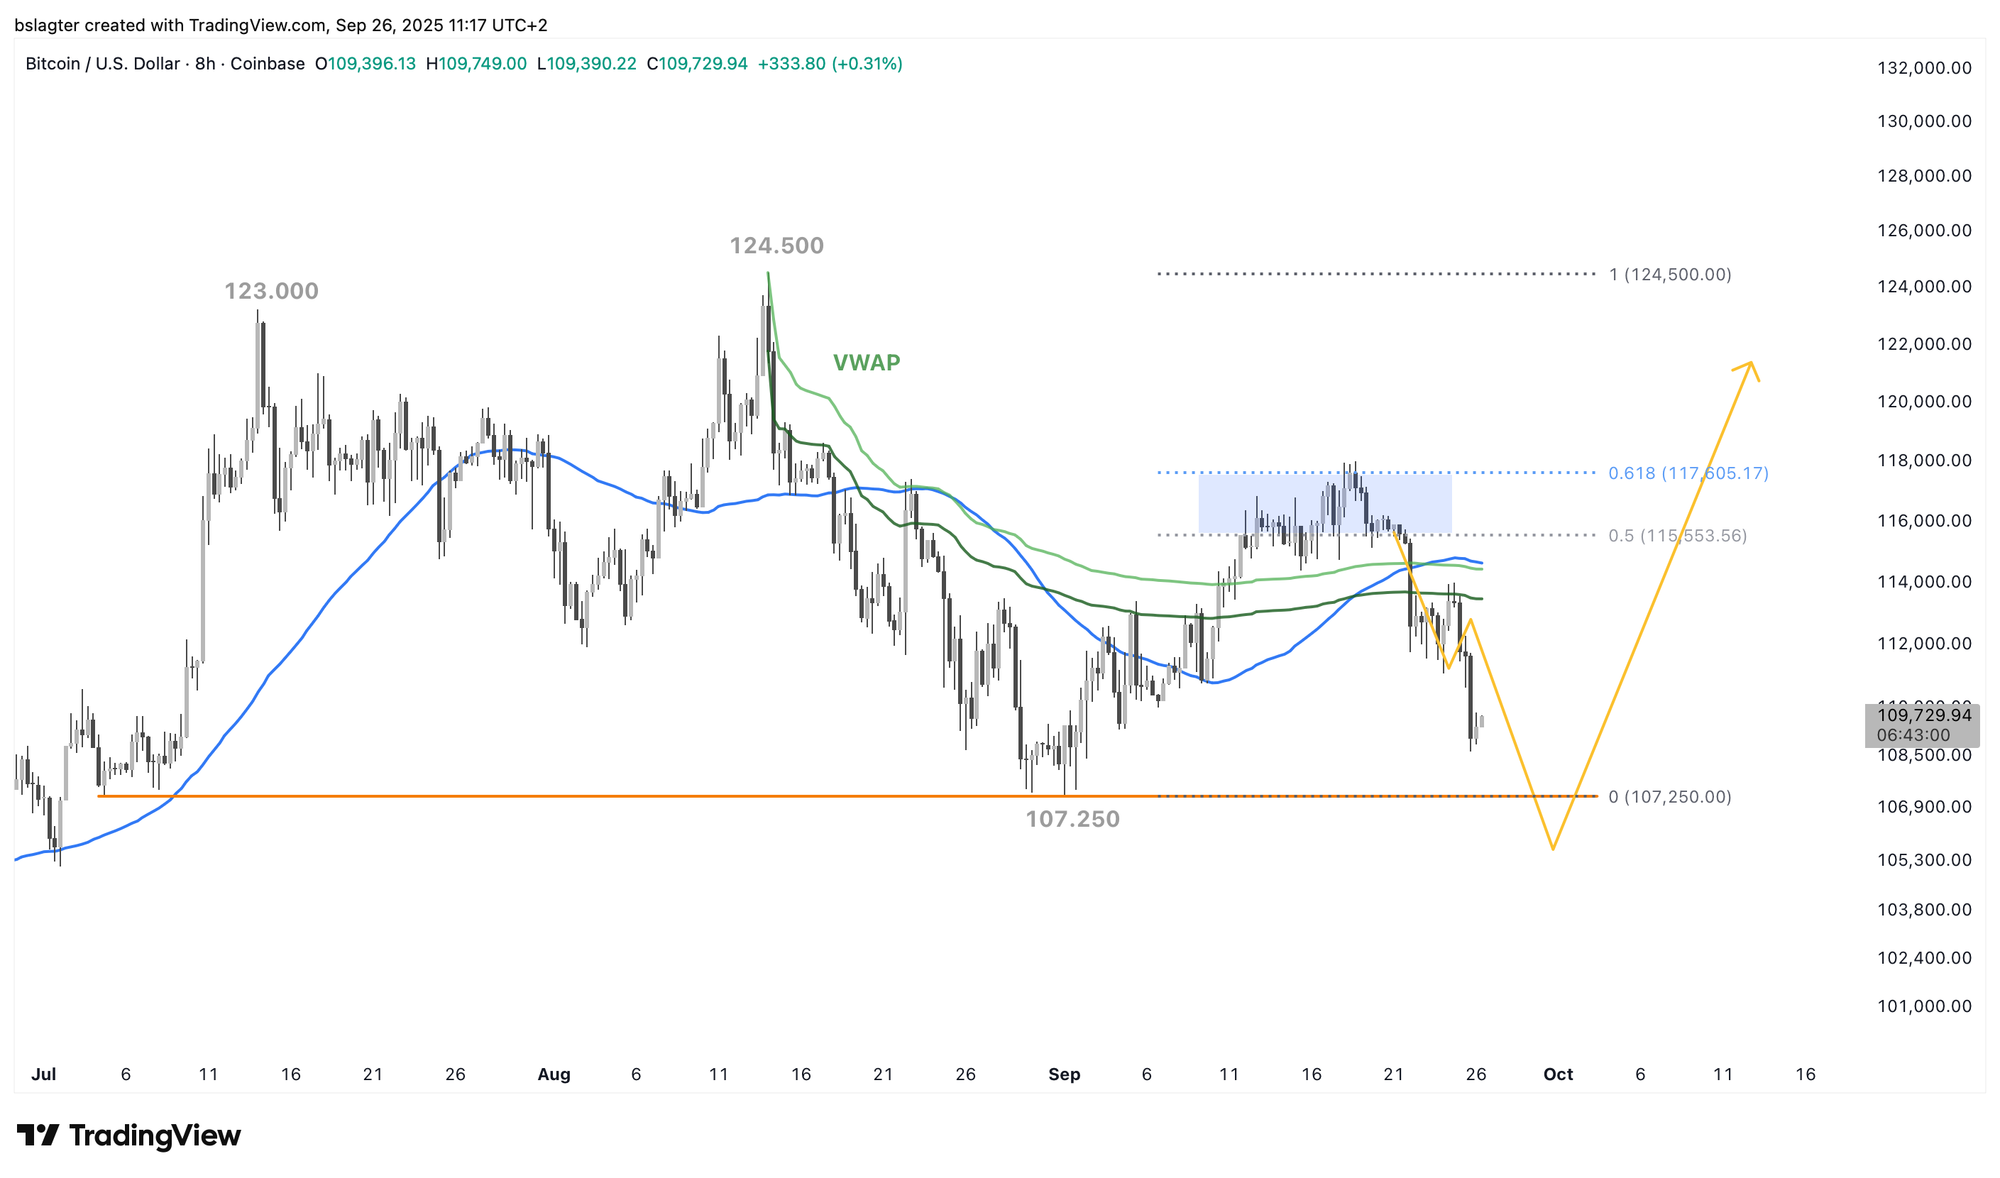
So far, the price is following our projection quite closely. However, it’s unlikely we’ll pinpoint the exact bottom. A “sweep” below the previous bottom of 107k is one possibility; alternatively, as seen in the past two instances, the price might simply brush against the 50-week moving average.
For the bulls, the ideal scenario would be to avoid any daily close below 108k. In that case, the six-week correction could be seen as a test of December’s top acting as support—an excellent starting point for a new weekly cycle.
We now move on to the following in-depth topics:
- $3 billion in liquidations
- Bitcoin underperforms in 3 charts
- Rate cuts melt away like snow in the sun
- Bitcoin still holds Trump’s trump card
1️⃣ $3 Billion in Liquidations
Bert
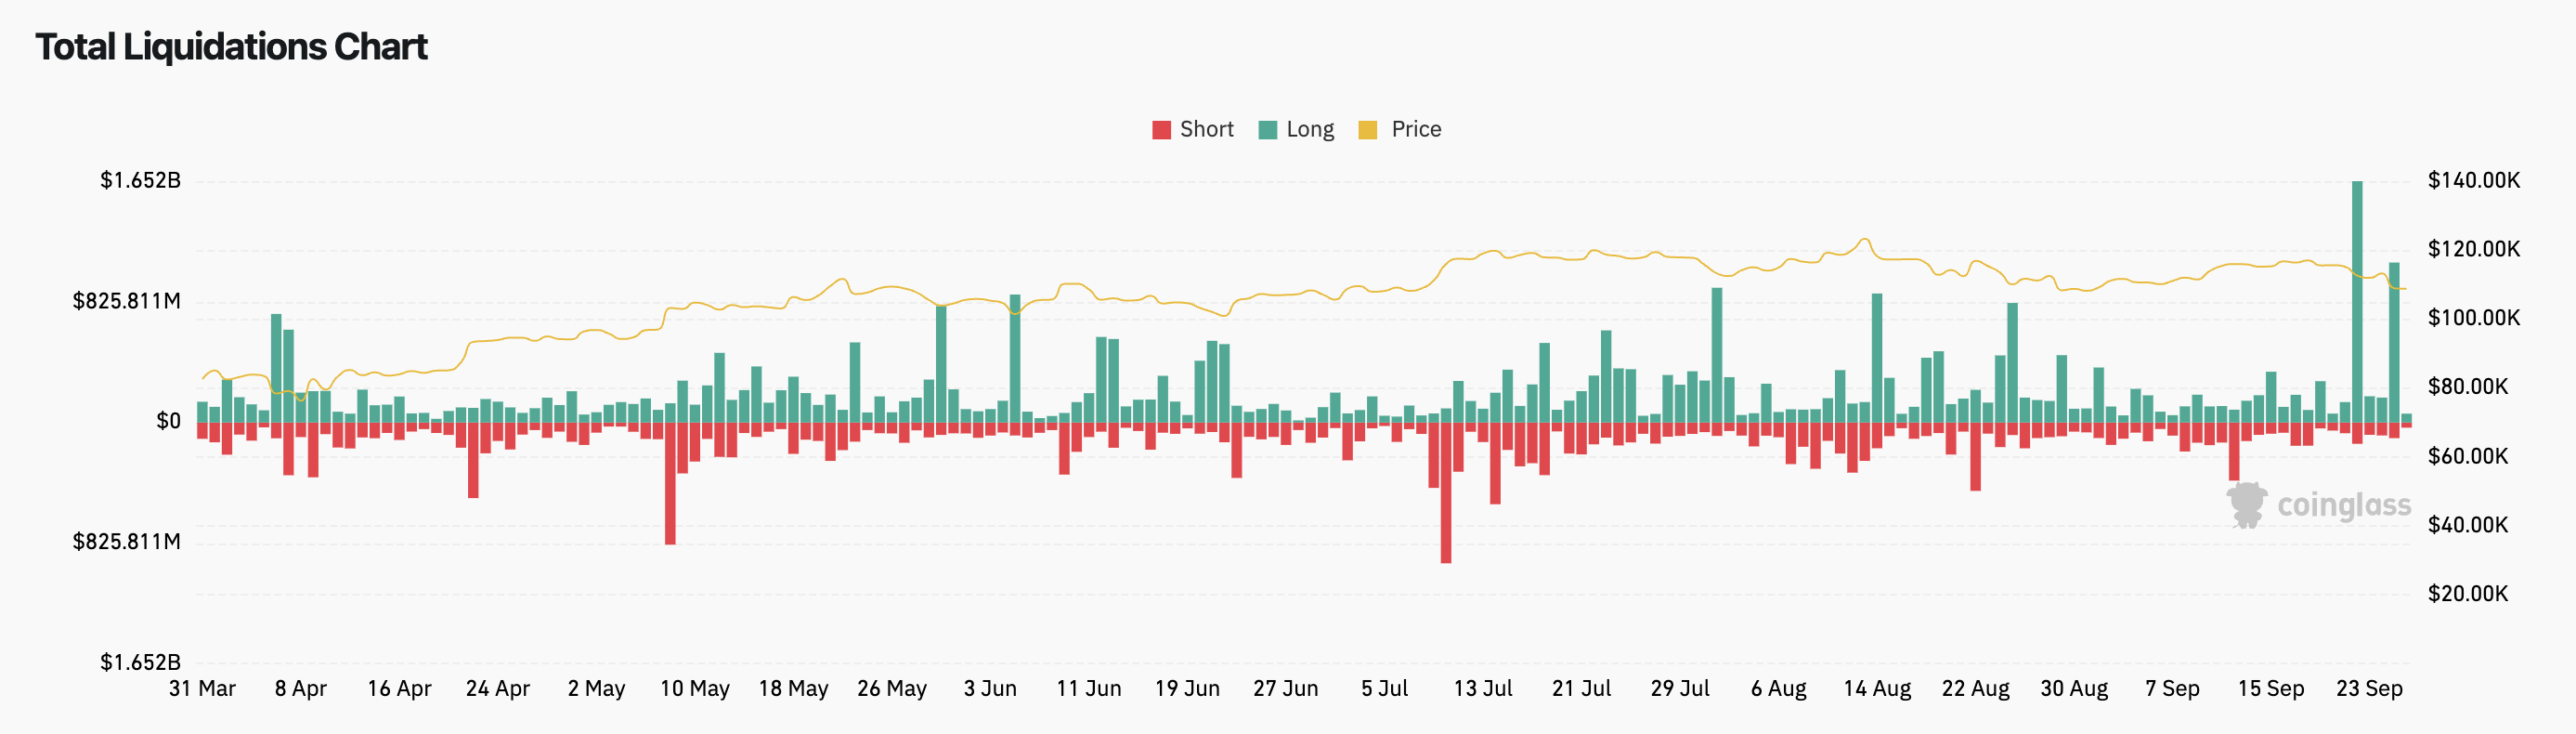
On Monday, September 22, Coinglass reported that leveraged positions worth $1.7 billion had been liquidated. According to their post on X, this is the largest amount so far this year. Yesterday was also challenging, with liquidations coming in just shy of $1.1 billion.
Notably, the price didn’t plummet dramatically—perhaps only dropping by a few percent. In February, March, and April, the declines were much steeper, even though fewer long positions were liquidated.
The fact that speculators are now even more eager fits the broader picture: a major bull run is expected in the fourth quarter and alt season appears imminent. It very well might turn out that they are right. Of course, taking on a bit more risk is understandable, but risking so much that even a drop of a few percent leads to liquidation is a gamble you have to own.
2️⃣ Bitcoin Underperforms in 3 Charts
Bert
Between April 7 and August 14, bitcoin’s price surged by nearly 70%, climbing from 75k to 125k. At first glance, that seems impressive; however, it is disappointing when compared to previous periods of growth in this bull market. Based on earlier trends, we expected a top somewhere between 150k and 165k.
But bitcoin isn’t only underperforming relative to its previous levels—it’s also lagging behind other markets in recent months. Let’s examine a few charts.
We begin with three ratios:
- S&P High Beta vs. S&P Low Volatility
- S&P Discretionary vs. S&P Staples
- S&P-500 vs. TLT (bonds)
The first ratio tends to perform better in a risk-on environment, while the second excels during risk-off periods. In an optimistic market these ratios usually rise, whereas in a defensive market they fall. We can see bitcoin and the Nasdaq-100 moving in line with these ratios until, in August, bitcoin starts to lag behind.
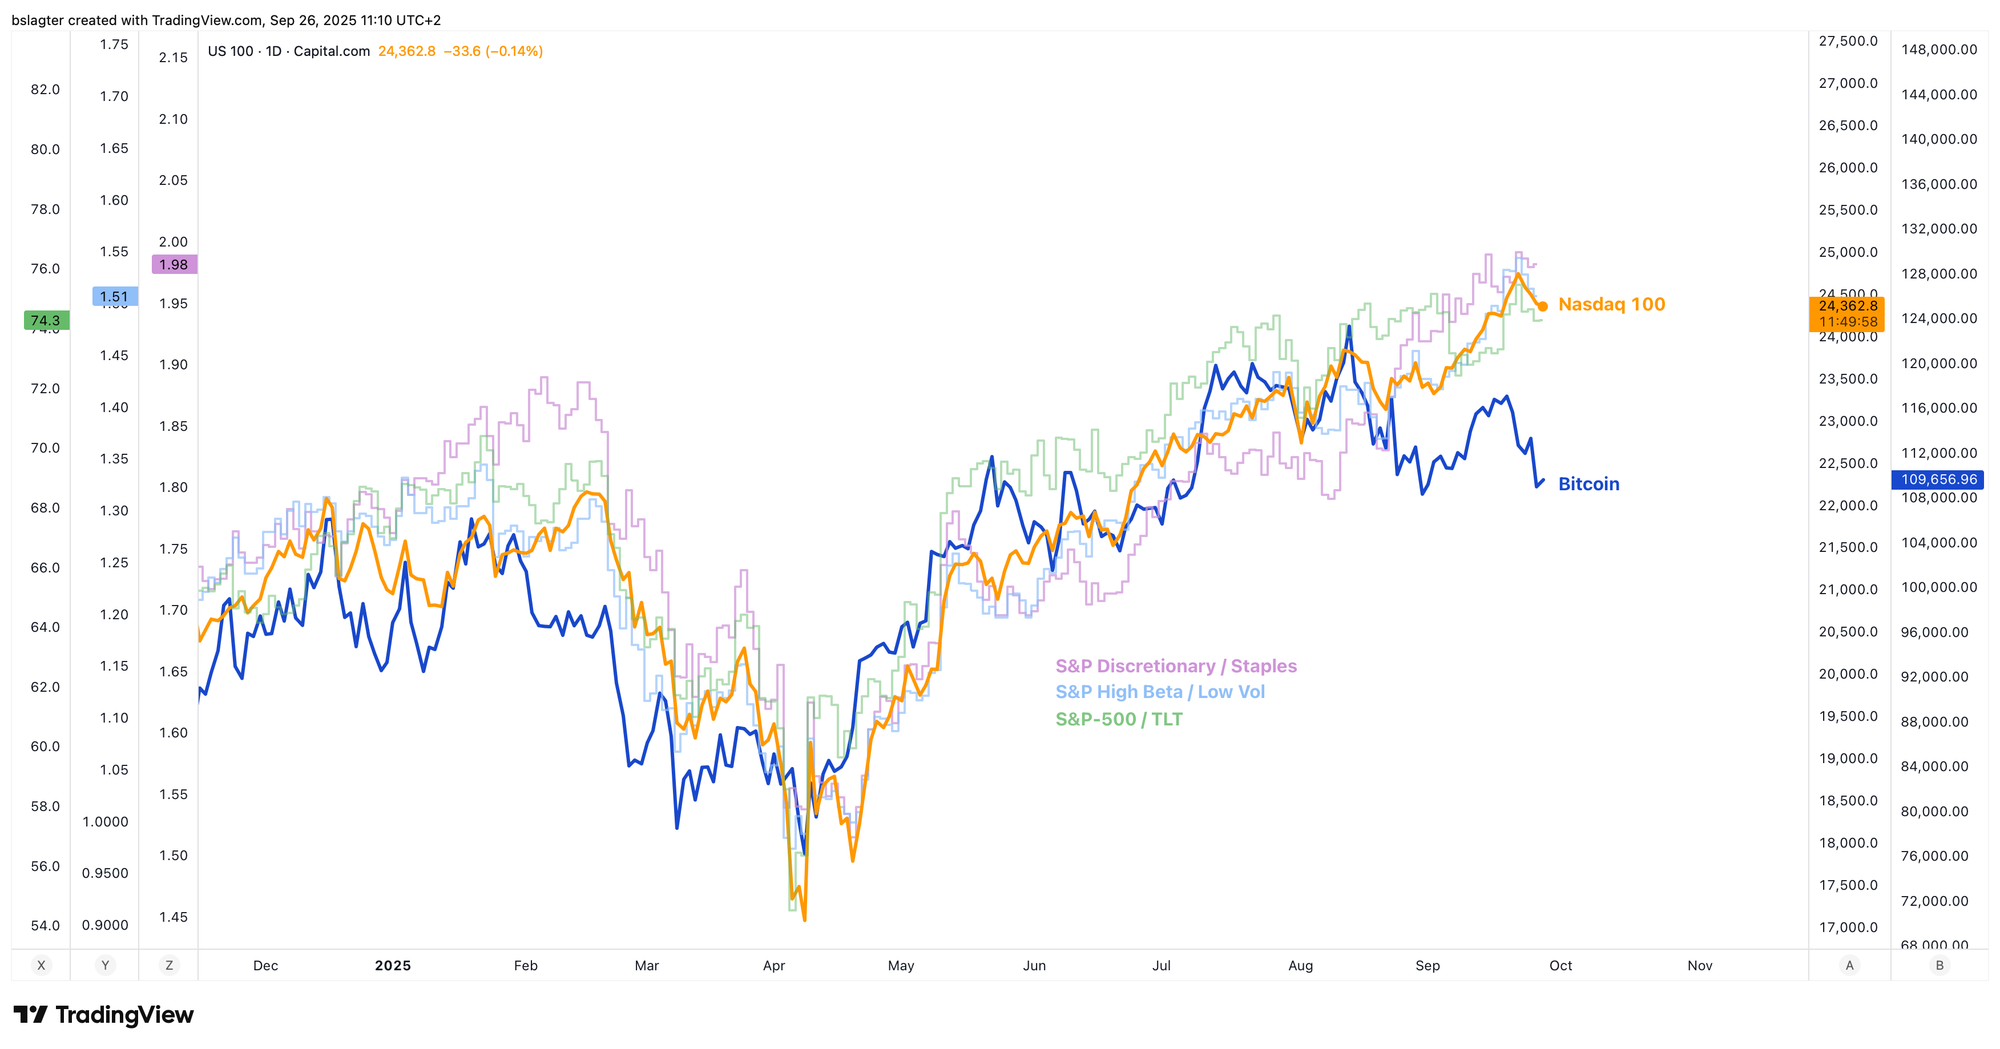
It’s important to remember with these overlay charts that there isn’t an inherent or inevitable link between the two data series. While they often move in the same direction, there are times when they do not.
This discrepancy draws attention to the fact that bitcoin is performing worse than expected. However, that doesn’t necessarily mean bitcoin will soon catch up.
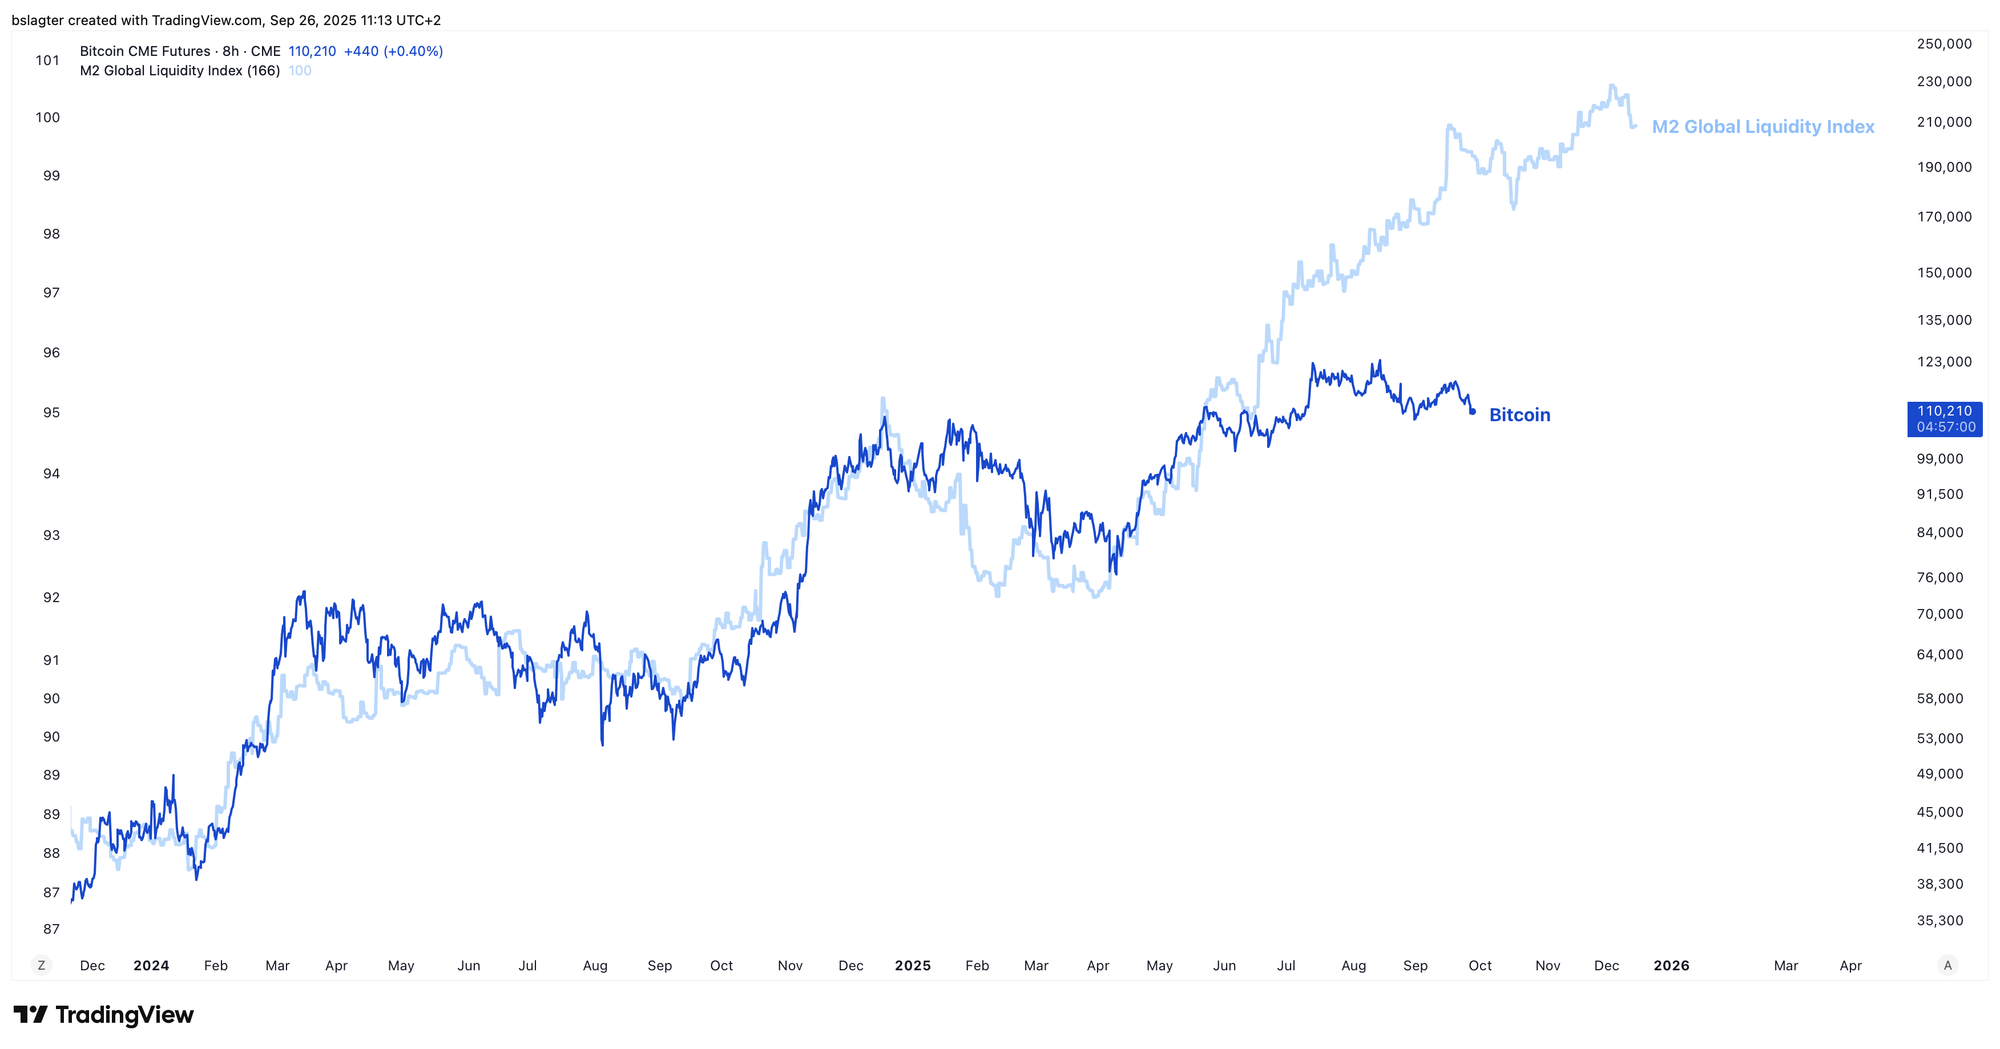
In other words, charts like these are not very reliable predictors. This is further illustrated by the chart comparing bitcoin and global liquidity—often represented by a proxy for “global M2.” At the start of the year, this chart was ubiquitous; now, it’s rarely seen.
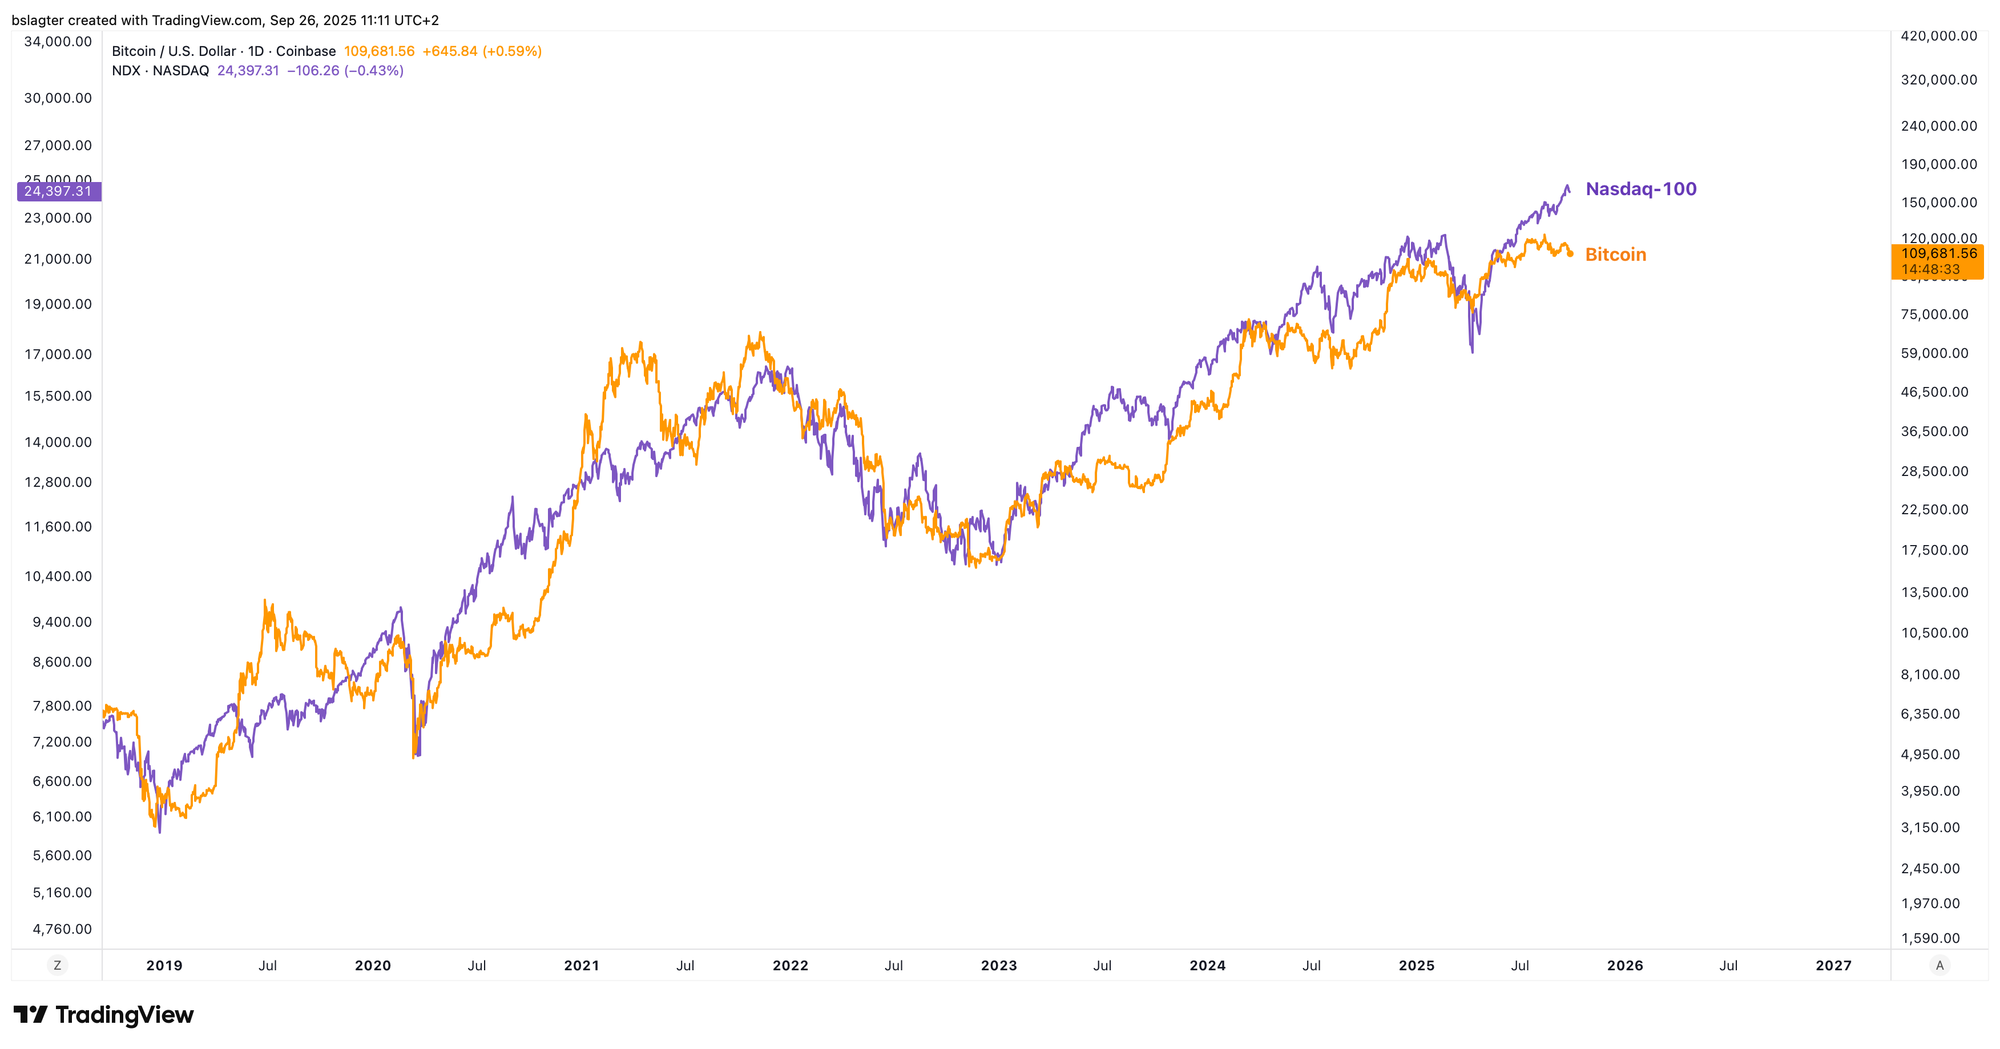
The more common factors two markets share, the longer their correlation remains meaningful. Below, bitcoin and the Nasdaq-100 are compared over the past six years, and you occasionally see deviations as pronounced as what we’re witnessing now.
It’s reasonable to expect that these two lines will eventually converge again. However, that doesn’t necessarily mean bitcoin has to rise—it could also be that U.S. stocks undergo a correction. And that correction is long overdue!
3️⃣ Rate Cuts Melt Away Like Snow in the Sun
Thom
Even in the week following the widely discussed interest rate cut by the U.S. central bank, economic data continue to deliver pleasant surprises.
For example, the latest estimate for real economic growth in Q2 2025 came in at 3.8%, compared to the expected 3.3%.
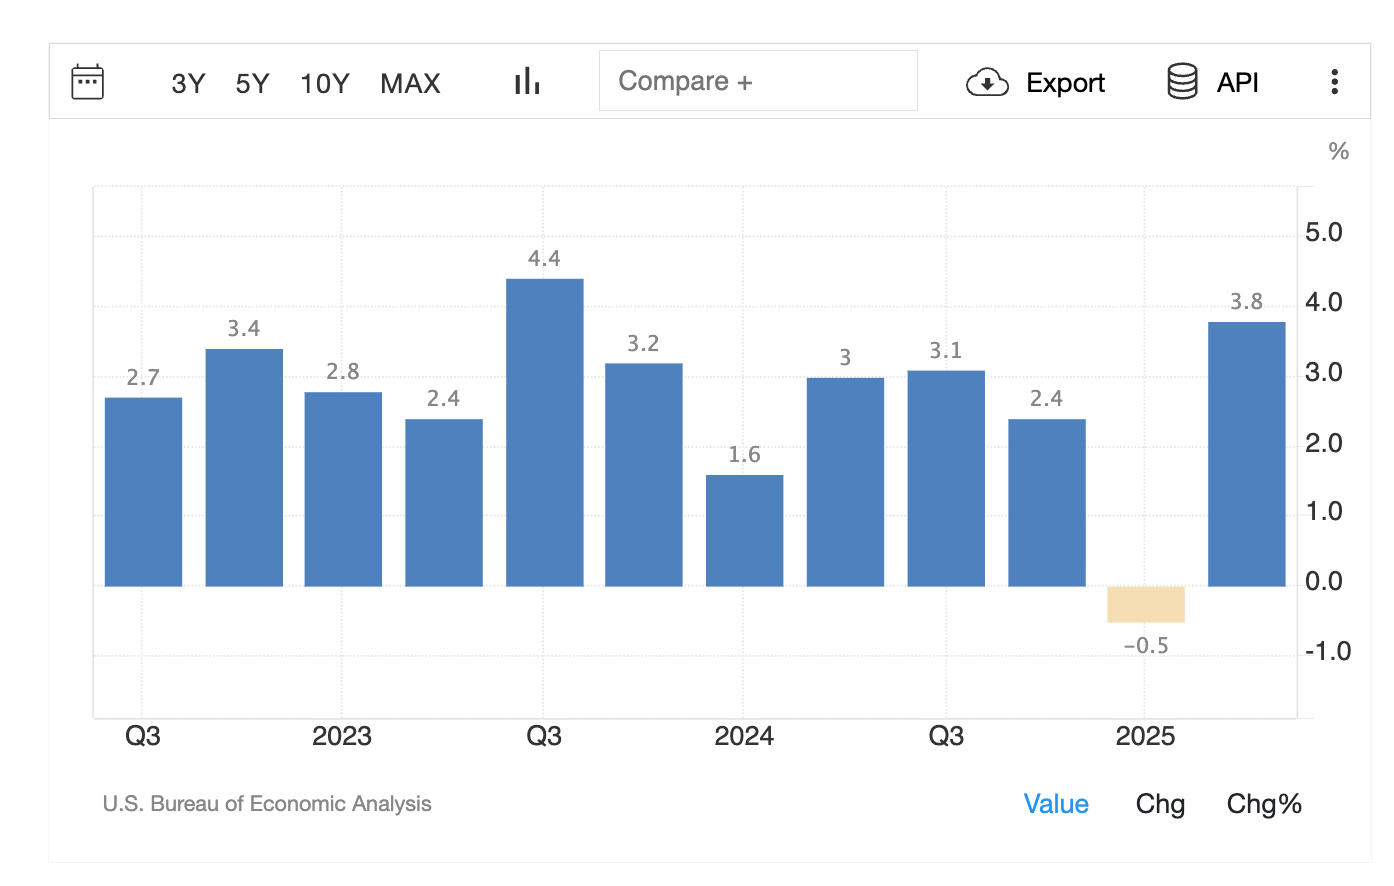
Economic data can vary from quarter to quarter, but it’s clear that the U.S. economy is performing robustly. This picture was further reinforced on Thursday when initial jobless claims were reported at 218,000—well below the expected 235,000.
As a result, the market is now far less certain about the series of rate cuts that were once expected from the U.S. central bank. For 2025, the futures market now anticipates only 38 basis points in rate cuts, whereas not long ago, a much larger cut was expected.
Although the market may see this as a setback, I believe the scenario is better for the long run.
Bitcoin benefits from increased confidence in the long-term health of the economy. That confidence typically boosts risk appetite and stimulates credit creation, paving the way for more capital to eventually flow into bitcoin.
Had we experienced all the rate cuts that were anticipated just last week, it might have meant one of two things:
- The economy wasn’t as robust as we believed; or
- Donald Trump had managed to seize control of the U.S. central bank, resulting in unnecessary rate cuts.
In the short term, option 2 might have favored bitcoin and other risk assets, but in the long run it would likely have sparked considerable instability. After all, such a scenario would only reinforce the narrative that the U.S. central bank has lost its independence to the Trump administration, potentially undermining confidence in the U.S. dollar—the foundation of our financial system.
Although the price action is a bit turbulent right now, my main scenario remains that bitcoin has yet to reach its absolute peak for this cycle.
4️⃣ Bitcoin Still Holds Trump’s Trump Card
Thom
The financial markets may seem a bit shaky at the moment, even though the overall macroeconomic backdrop provides a solid foundation for the bull market. Unfortunately, that doesn’t prevent a lot of short-term uncertainty from emerging.
There’s a saying for a reason: bull markets often scale a wall of concerns.
Despite all the uncertainty, I remain confident that bitcoin will come out positively—not only because of the strong macroeconomic picture, but also thanks to the Trump administration. Under Trump, economic populism is unmistakable; he does everything he can to strongly stimulate the economy and financial markets.
A good example is a tweet from Scott Bessent, where he asserts that the economy is rock solid—even though just last Wednesday he called out that rates need to come down more quickly. It certainly is odd to boast about a robust economy and then plead for rate cuts.
The Atlanta Fed projects 3%+ of real GDP growth in Q3. Private forecasters, meanwhile, project 2% growth this quarter. Yet the CBO remains stuck in a recessionary fantasy.
— Treasury Secretary Scott Bessent (@SecScottBessent) September 15, 2025
Trump’s first term beat the CBO’s lowball forecasts with nearly 3% growth for 3 years and 3.4% growth in… https://t.co/ADQ4El6lQ6
Actions like these make it evident that the Trump administration is determined to avoid a recession at all costs. We also see this in the voting behavior of Stephen Miran, who was appointed by Trump to the U.S. central bank’s interest rate committee. He even sought to implement an additional four to five 25-basis-point rate cuts by the end of 2025 compared to his colleagues.
That, of course, will not happen, but it does indicate just how firmly Team Trump is positioned.
Looking ahead, the midterm elections in November 2026 are on the horizon, and it’s expected that two major legislative budget measures will be introduced—such as the One Big Beautiful Bill Act (OBBBA). The first is scheduled for the fall and the second for the spring.
The Trump administration is clearly gearing up to fire up the spending machine again next year, and for that reason I remain optimistic about bitcoin’s prospects. In any event, this Trump trump card makes it less likely that we’ve already seen the absolute peak of the bull market.
Thank you for reading!
To stay informed about the latest market developments and insights, you can follow our team members on X:
- Bart Mol (@Bart_Mol)
- Peter Slagter (@pesla)
- Bert Slagter (@bslagter)
- Mike Lelieveld (@mlelieveld)
We appreciate your continued support and look forward to bringing you more comprehensive analysis in our next edition.
Until then!