Current Investors Bet on Rising Prices
Bitcoin recently broke the $100k barrier after a leap from $95k, but it's now tightly consolidating. Will investor accumulation fuel a push toward new highs around $109.5k, or might profit-taking drag prices into the $90k range? The next move is crucial.

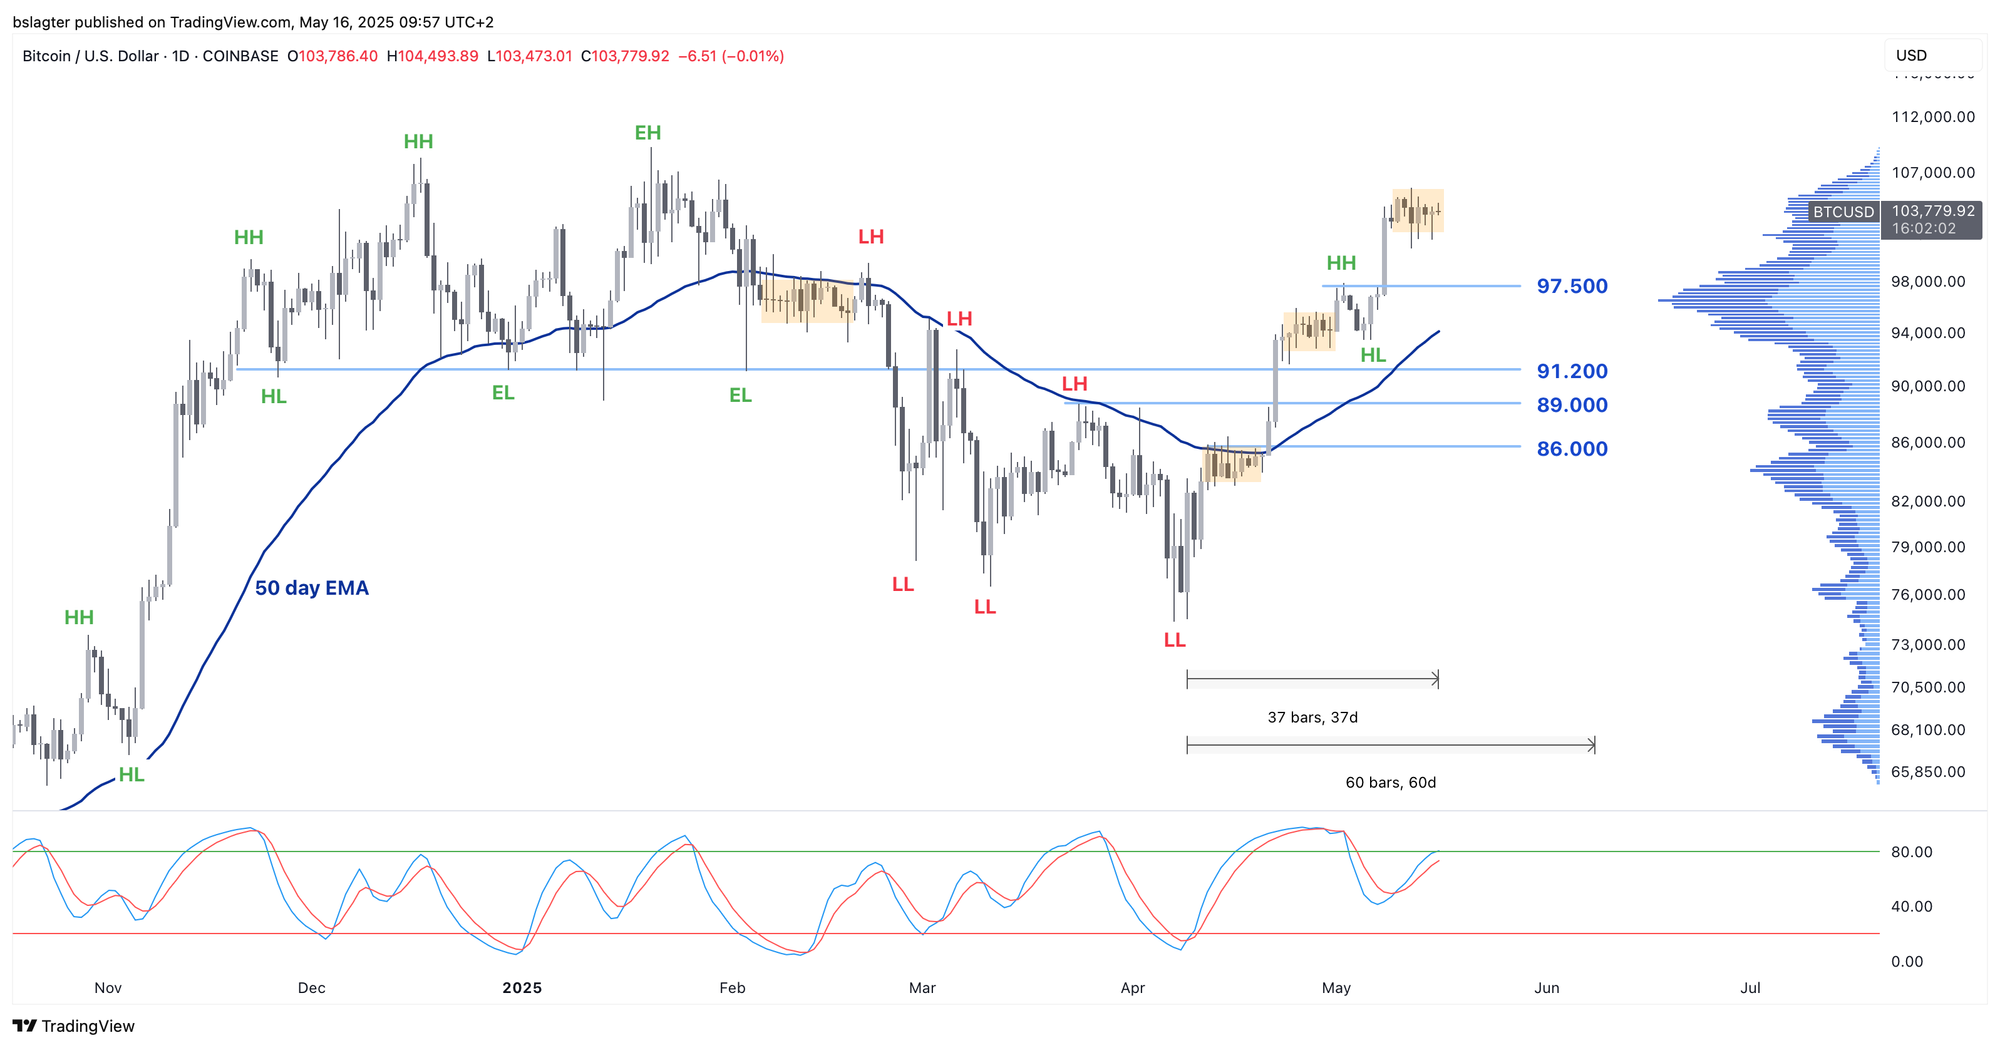
Last week, Bitcoin surged from around $95,000 to $105,000, climbing above $100k for the first time since early February. Since then, it has been trading sideways within a narrow range, with the daily closing prices over the past eight days staying between $102,800 and $104,800—a variation of less than 2%.
We have observed such tight consolidations several times over the past few months. In the chart below, they are highlighted in orange, and each instance was followed by a continuation of the trend.
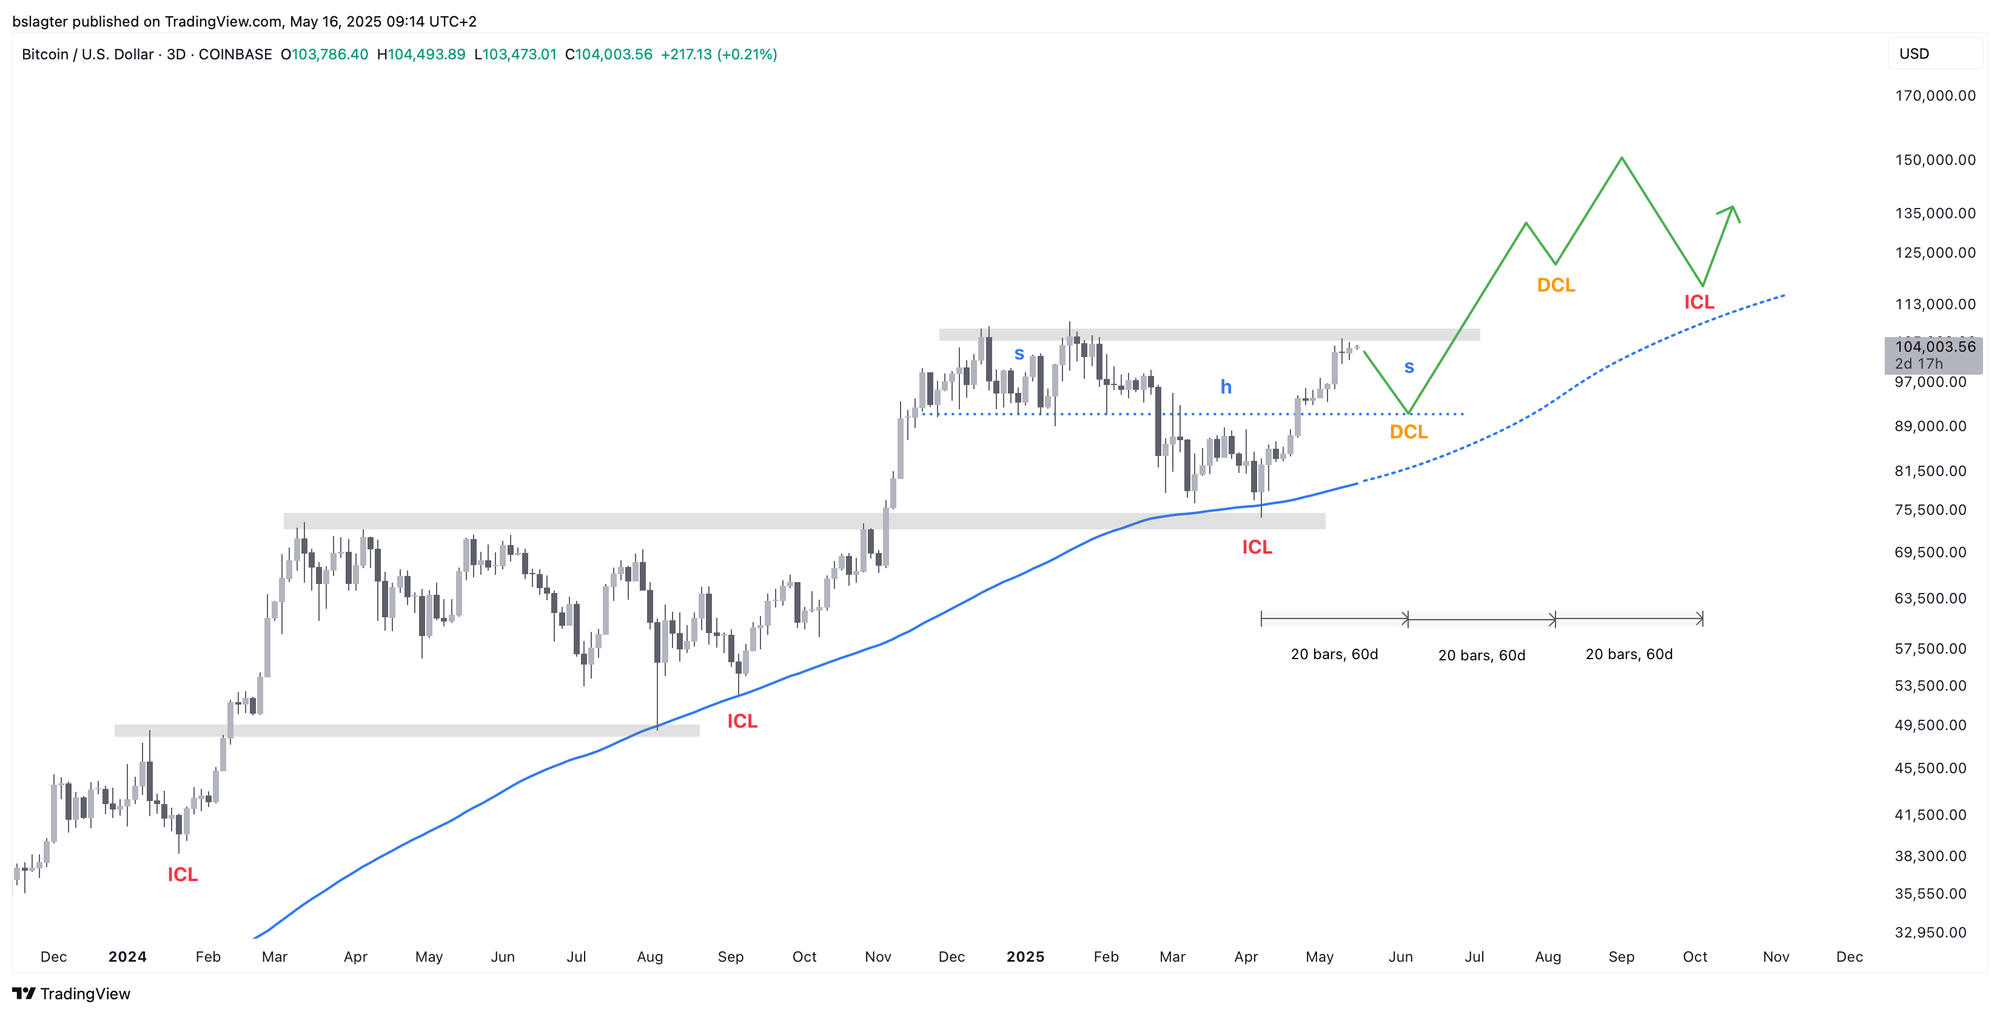
This appears to be the most likely scenario now. We are on day 37 of this daily cycle, which typically lasts about 60 days. There is plenty of time for another upward push toward the all-time high of $109,500, or even a bit higher.
If a deeper correction occurs first, a pullback into the mid-$90k range is likely. The 50-day moving average is trending toward $95,000, and horizontal support can be found around $97,000.
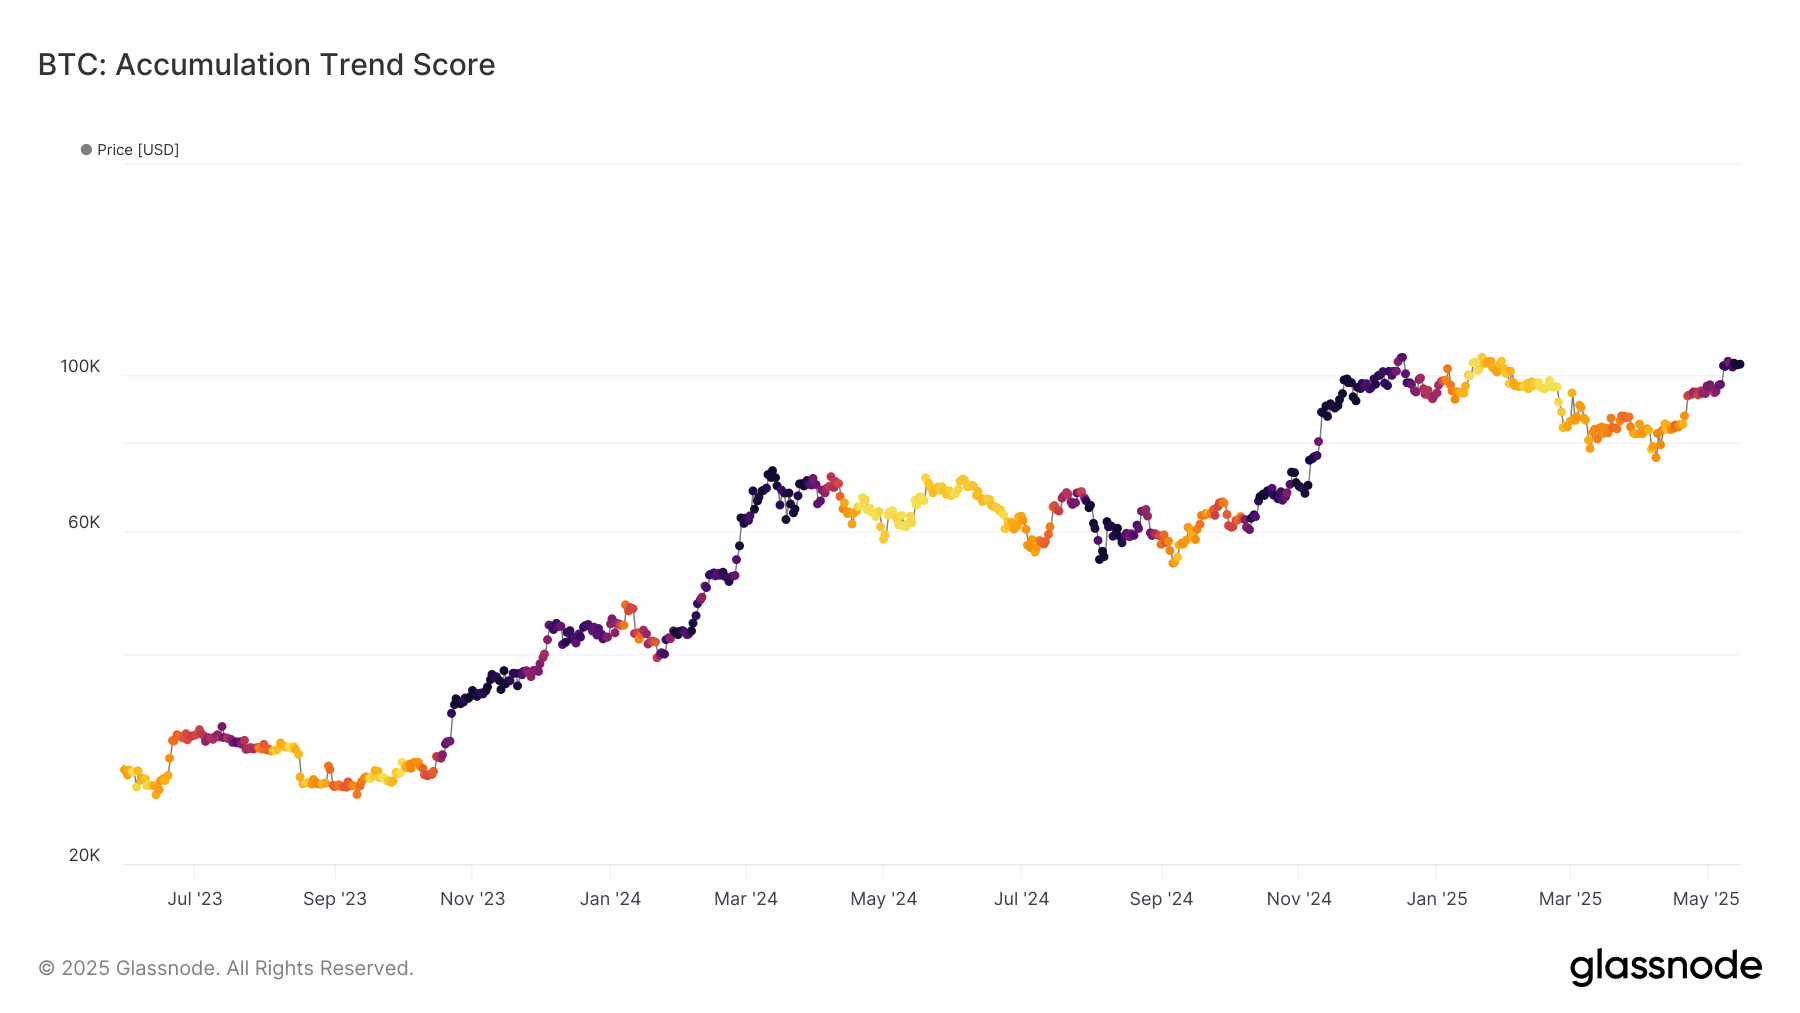
On-chain data shows that long-term investors have remained confident during this recent upward move. The chart below illustrates the shift from a distribution phase to an accumulation phase:
- A light color indicates distribution: existing investors are reducing their positions by selling. This occurred from early January until the end of April.
- A dark color signifies accumulation: existing investors are increasing their positions by buying. This has been the case since the end of April.
This switching between accumulation and distribution is easily explained. Existing investors buy as prices rise until they have locked in significant gains, then sell part of their holdings, while new investors tend to enter near the top.
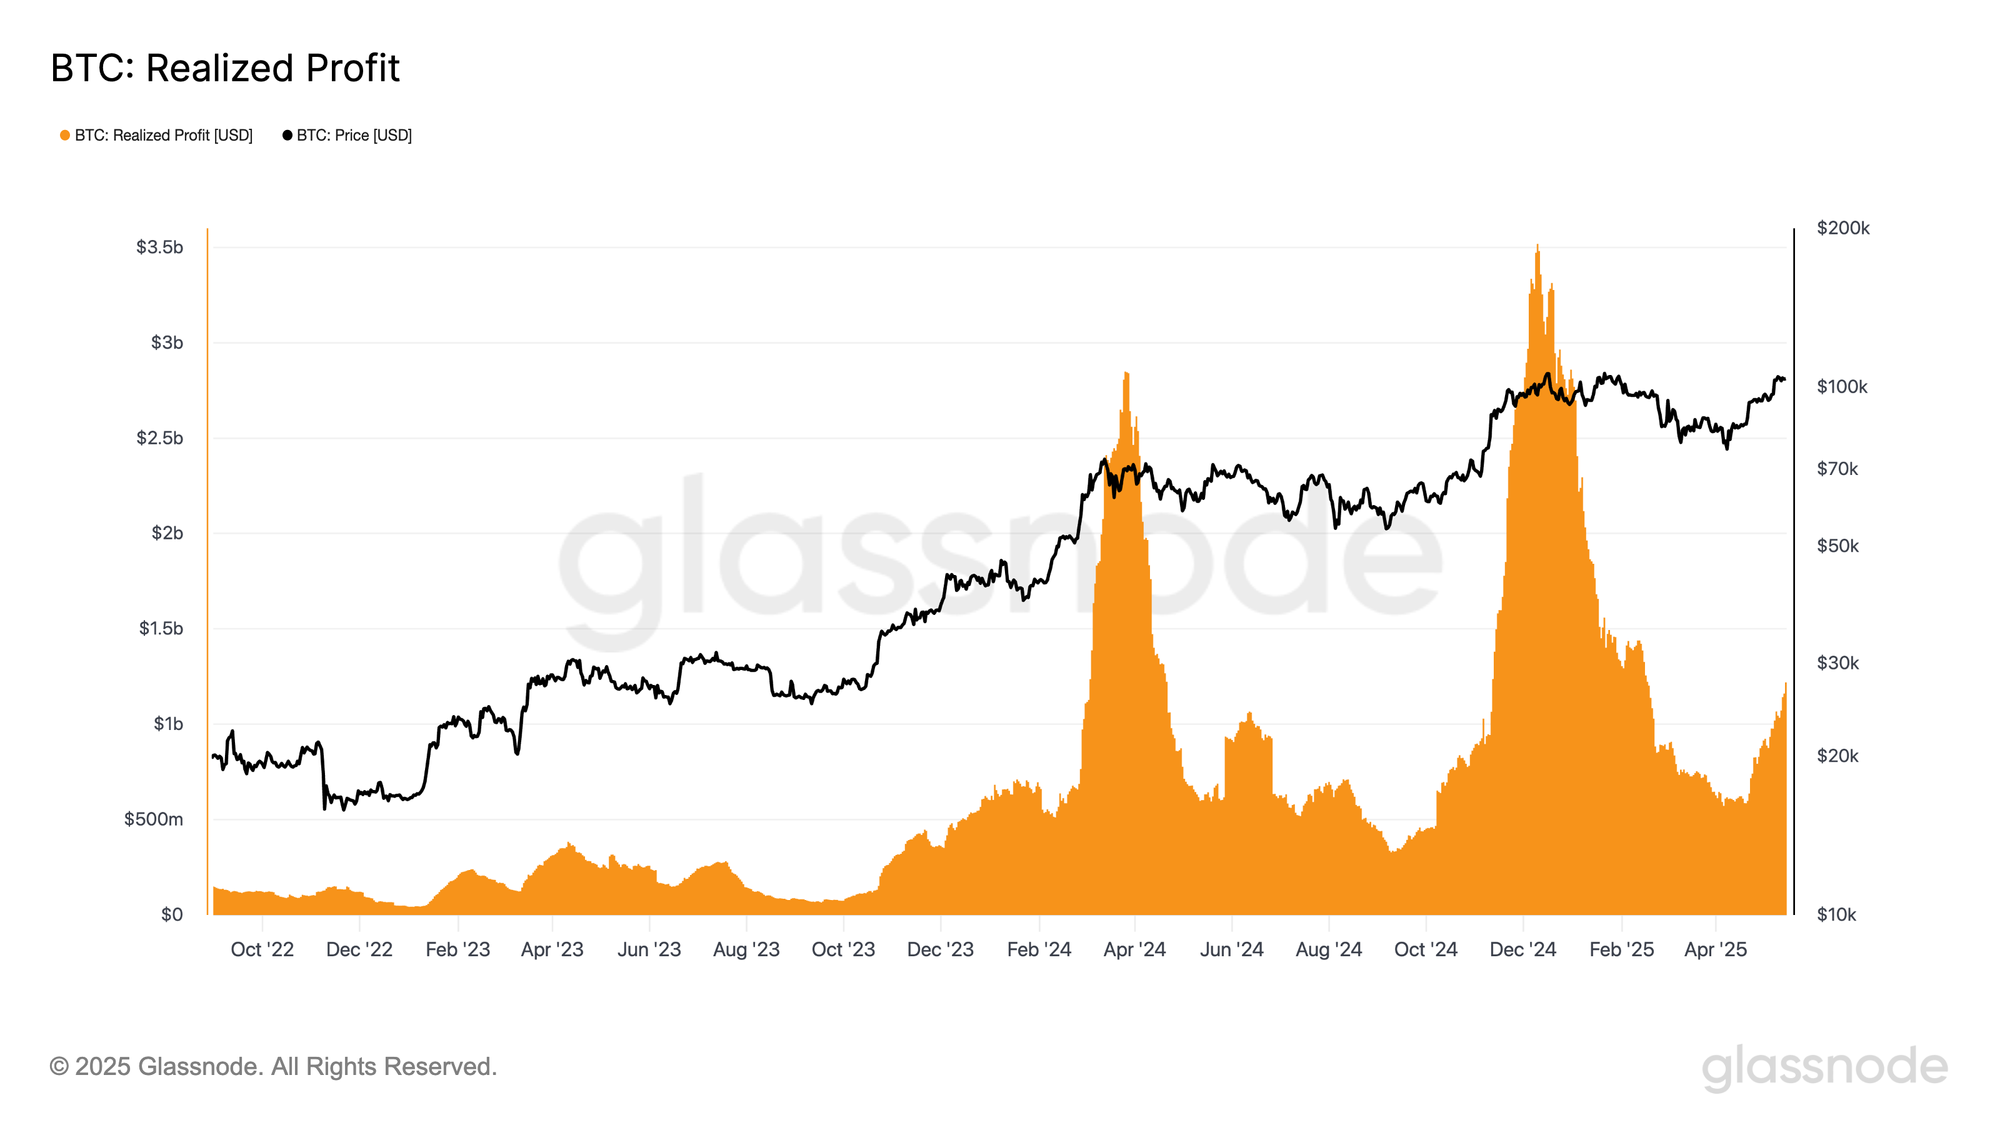
Although prices near $104,000 are close to the all-time high, existing investors have not yet started taking profits aggressively. The chart below, which tracks daily realized profit, shows a modest increase since the early April low, but remains well below the peaks observed in March and December 2024.
It seems that higher prices are needed to incentivize current investors to sell their Bitcoin. In the dynamics of supply and demand, the demand side is now in control; as it grows, prices must rise to encourage existing investors to release more supply.
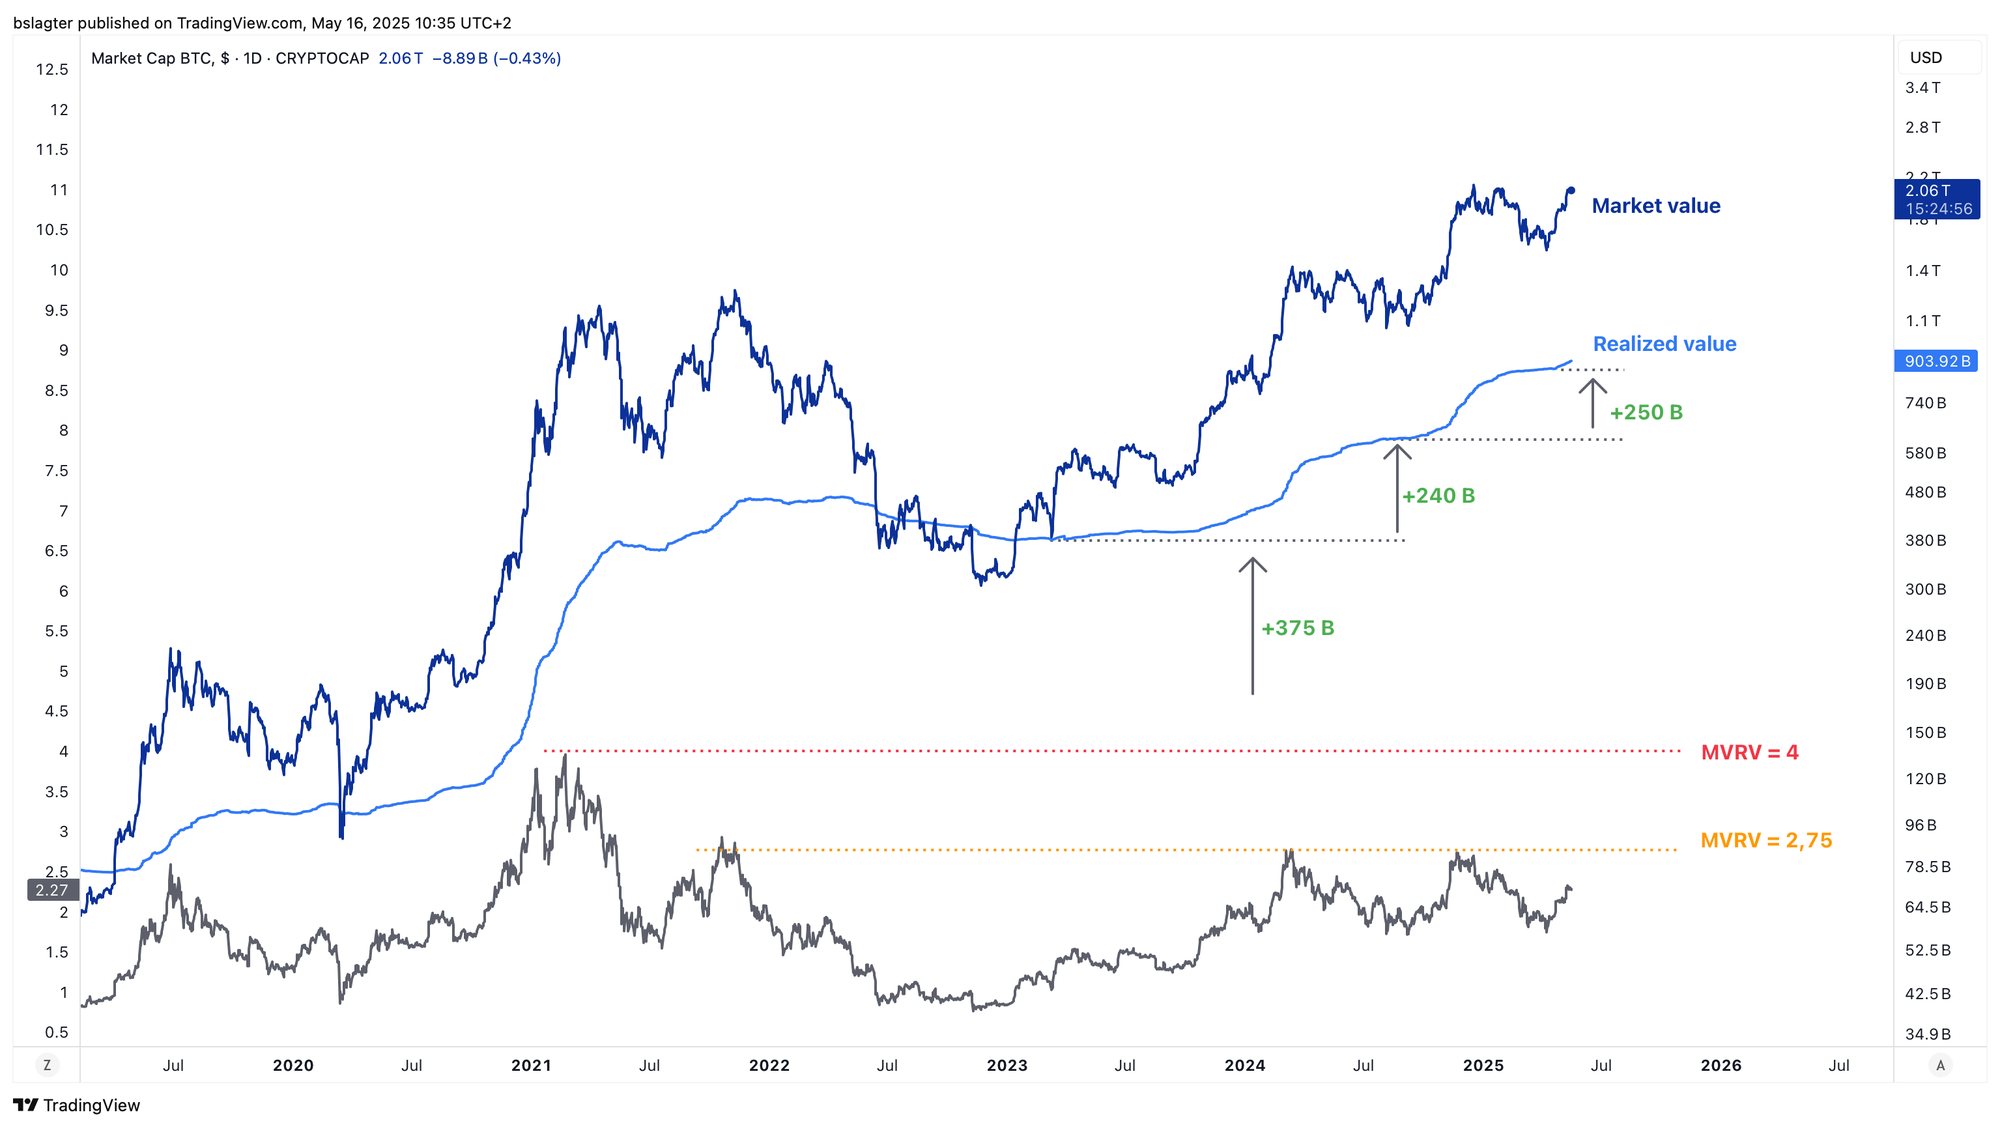
From previous bull markets, we know that investors typically take profits when their gains are between 100% and 300%, with a pronounced peak around the latter. This behavior prevents the MVRV from rising above 3, meaning the market as a whole is roughly at 200% profit. In the previous bull market, the MVRV peaked at 4.0.
The chart below shows the market value (MV) and the realized value (RV) on the top panel, with their ratio (MV/RV) displayed at the bottom.
The MVRV indicates the amount of unrealized profit—a key measure of market sentiment. It is only when the market is extremely optimistic that investors are willing to delay taking profits.
If the MVRV were to climb back to 2.75, as it did in March and December 2024, prices would have to rise to push the MV higher. With the RV remaining constant, this would require a price of $125,000.
However, the RV is not fixed. A hallmark of a strong bull run is that new investors bring in fresh capital while existing investors take profits. The chart shows that the RV has already begun to increase. Should an additional $250 billion flow into the market, the total market value could reach $3,150 billion at an MVRV of 2.75—implying a price of $160,000.
This estimate falls right in the middle of the $150,000 to $165,000 range we mentioned two weeks ago as the price target for this new weekly cycle. We’re excited to see what happens next!
We will continue with the following topics for our Alpha Plus members:
- Risk appetite is bouncing back rapidly
- Between inflation fears and growth concerns
- ETH/BTC faces resistance
- A scenario for the coming months
1️⃣ Risk appetite is bouncing back rapidly
Thom
For months, Donald Trump's trade war has influenced sentiment in the financial markets. In early April, fear indices skyrocketed after the United States and China raised their import tariffs to unsustainable levels.
Yet, just over a month later, the dark clouds have quickly lifted. A provisional trade deal between the US and China is now on the table, and investors have fully regained their risk appetite—a trend that is clearly reflected in market movements.
The easing of the trade war is evident in the following indicators:
- MOVE: the expected volatility of US government bonds. This serves as an important gauge for global liquidity, as US treasuries are the most significant form of collateral worldwide. Higher expected volatility means less capital can be borrowed using treasuries as collateral.
- VIX: the expected volatility of the S&P 500, often referred to as Wall Street’s fear gauge.
- High Yield Credit Spreads: the extra interest that companies with lower credit ratings must pay to borrow funds compared to rates for US government bonds. The smaller this spread (as shown in the chart’s bottom panel), the less risk the market perceives regarding a weak economy and potential defaults.
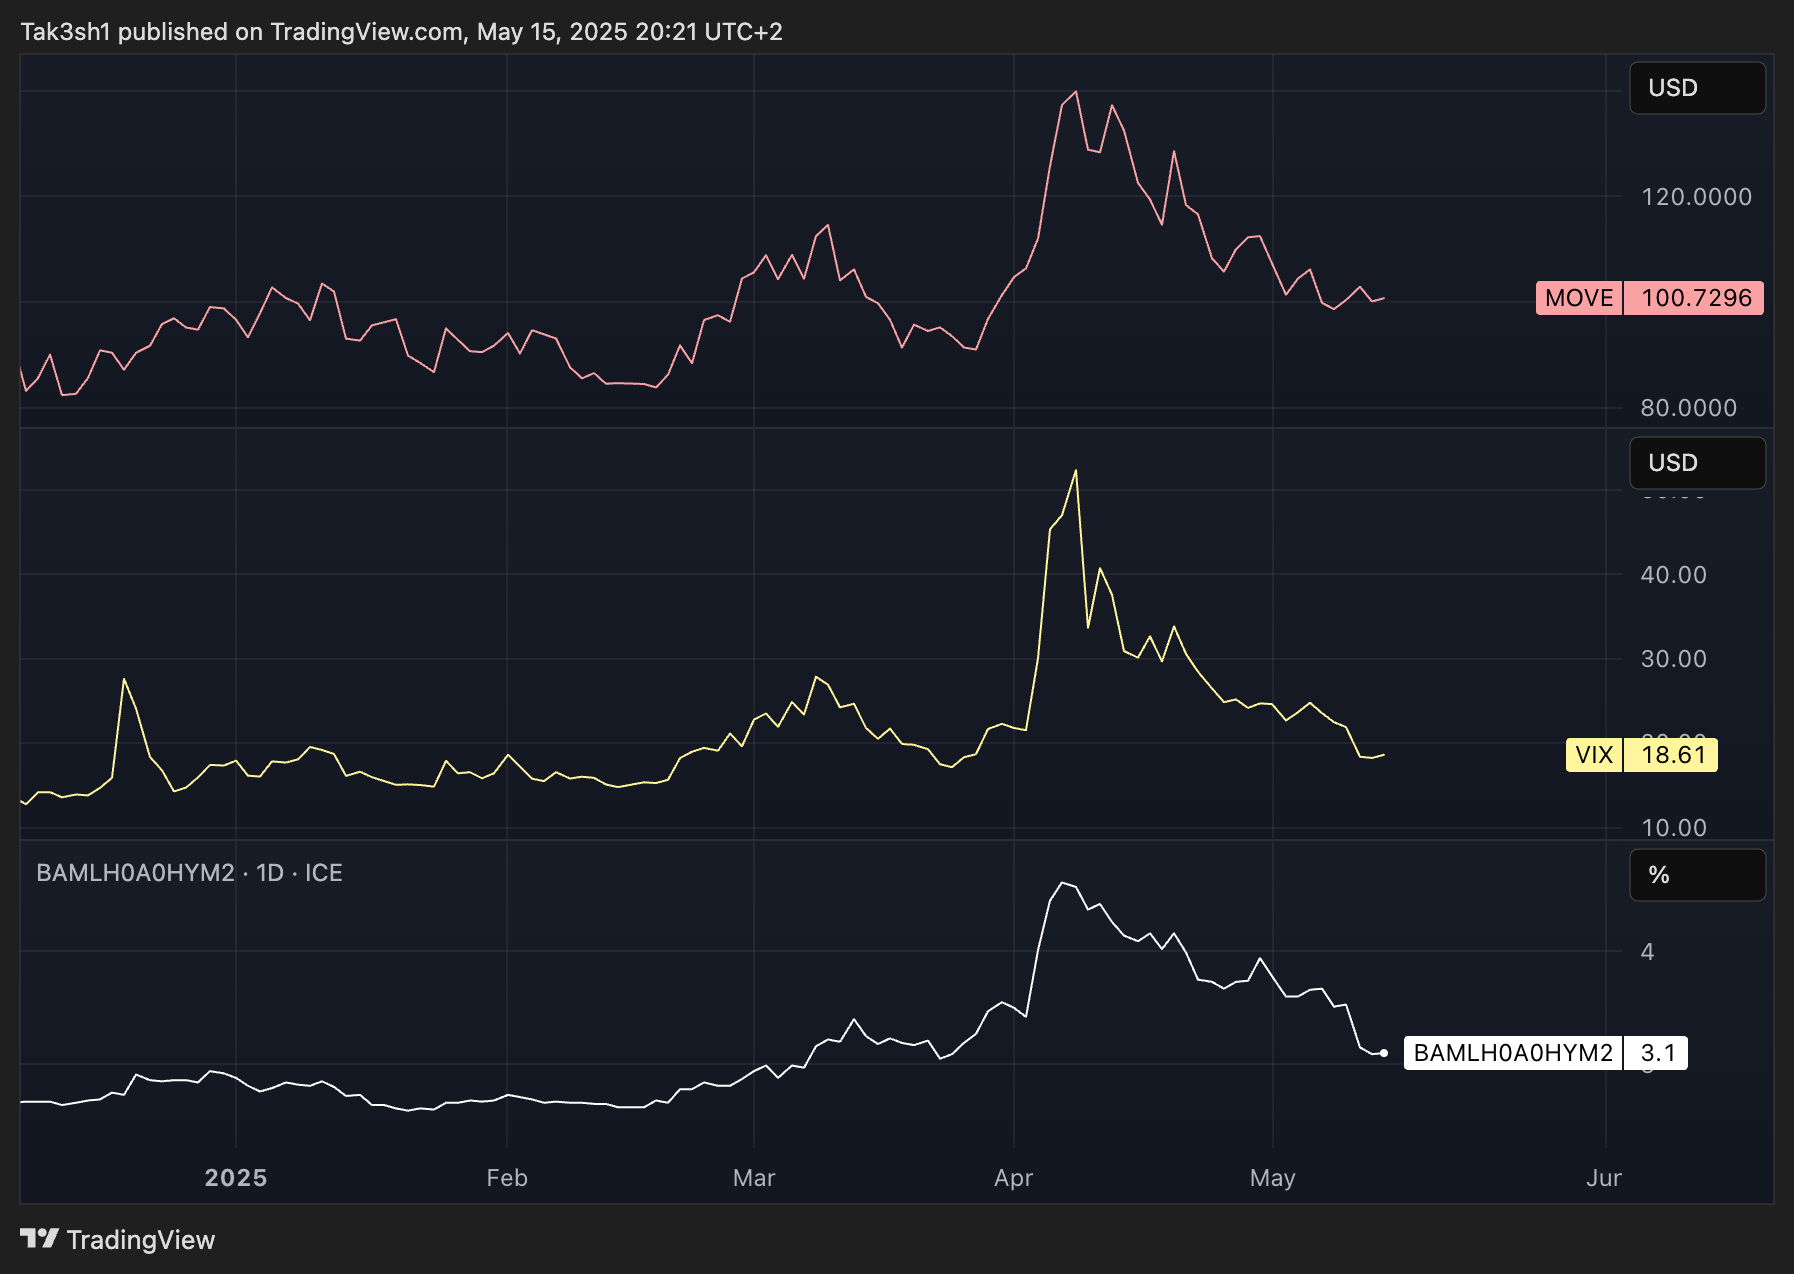
Since the fear spike in early April, these indicators have been falling sharply. We’ve received some positive news, and the market is now trading almost as if the trade war had never happened.
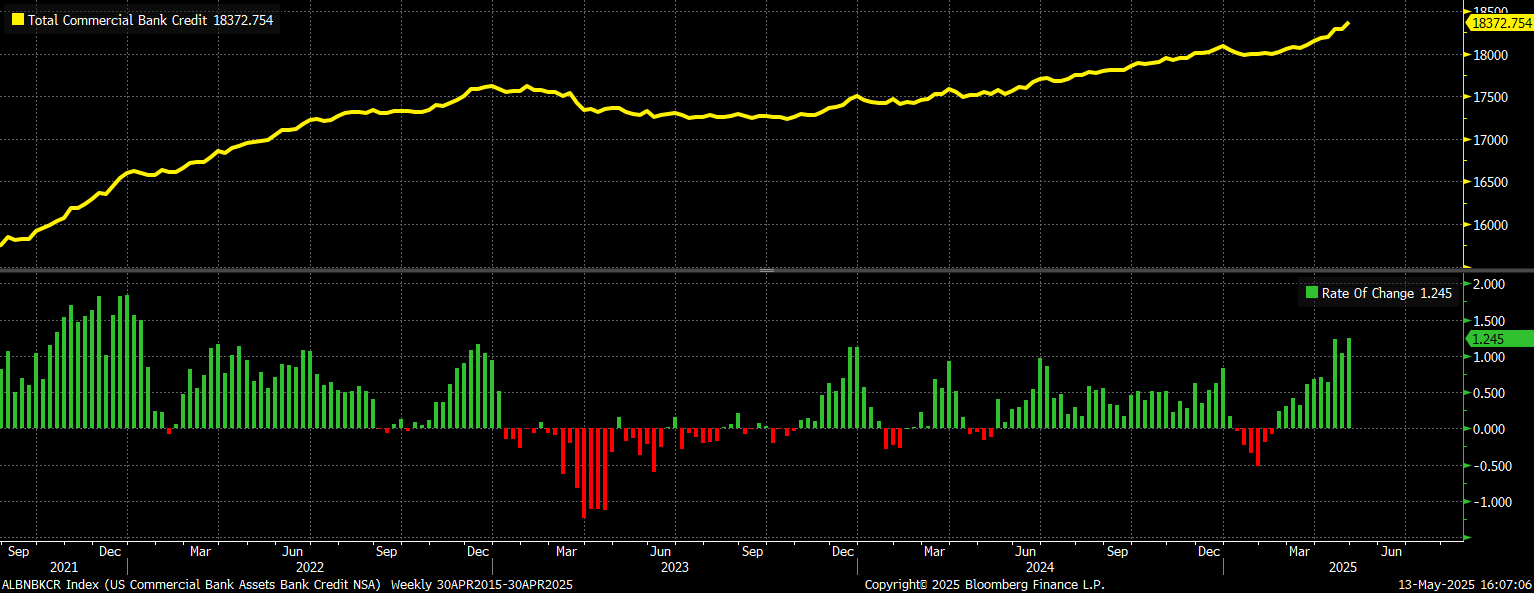
Beneath the surface, we are also seeing signs of a new credit cycle—a period during which lending activity picks up again. Declining Credit Spreads, along with a healthy number of deals and strong dollar volume in the High Yield market for 2025, are positive signals.

We see similar trends in other credit markets, and total outstanding bank loans from US commercial banks are also on the rise.
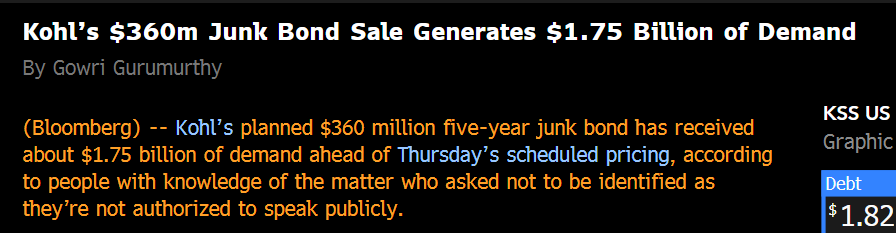
It’s rare to see headlines like the one below on a Bloomberg terminal when a recession is imminent.
More external factors are now favorable for Bitcoin, which makes my base scenario—a resumption of the bull market for the remainder of 2025—even more likely.
That said, we cannot completely ignore the impact of the trade war:
- Record-high import tariffs are still in place worldwide.
- The trade agreement between China and the US is, at best, temporary.
- Businesses remain uncertain about investing in new factories, choosing locations, and hiring additional staff.
While it would surprise me if we immediately entered a new bull market under these conditions, the situation has undeniably improved. However, I still believe there is too much uncertainty in the market for a sustained bull run, and the recent strong rally in Bitcoin makes a period of profit-taking more likely.
2️⃣ Between inflation fears and growth concerns
Thom
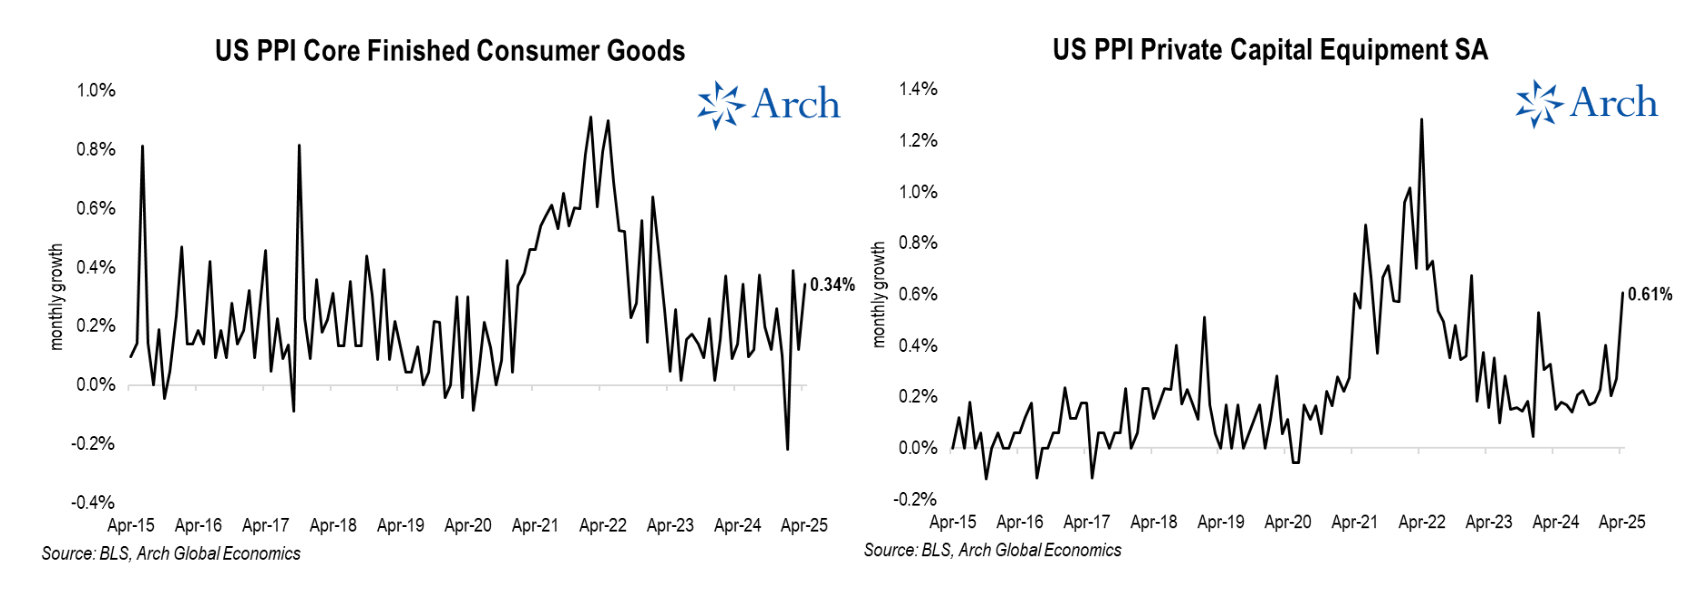
“So far, it appears that the impact of the import tariffs is generally being passed on more to businesses than to consumers,” according to economist Parker Ross, commenting on this week’s inflation figures.
Ross bases his conclusion on the modest increase in the Producer Price Index (PPI) for finished consumer goods. This contrasts sharply with the significant rise in the PPI for capital goods for businesses, which jumped by 0.61% in a single month—the strongest monthly increase since 2008, aside from the pandemic period.
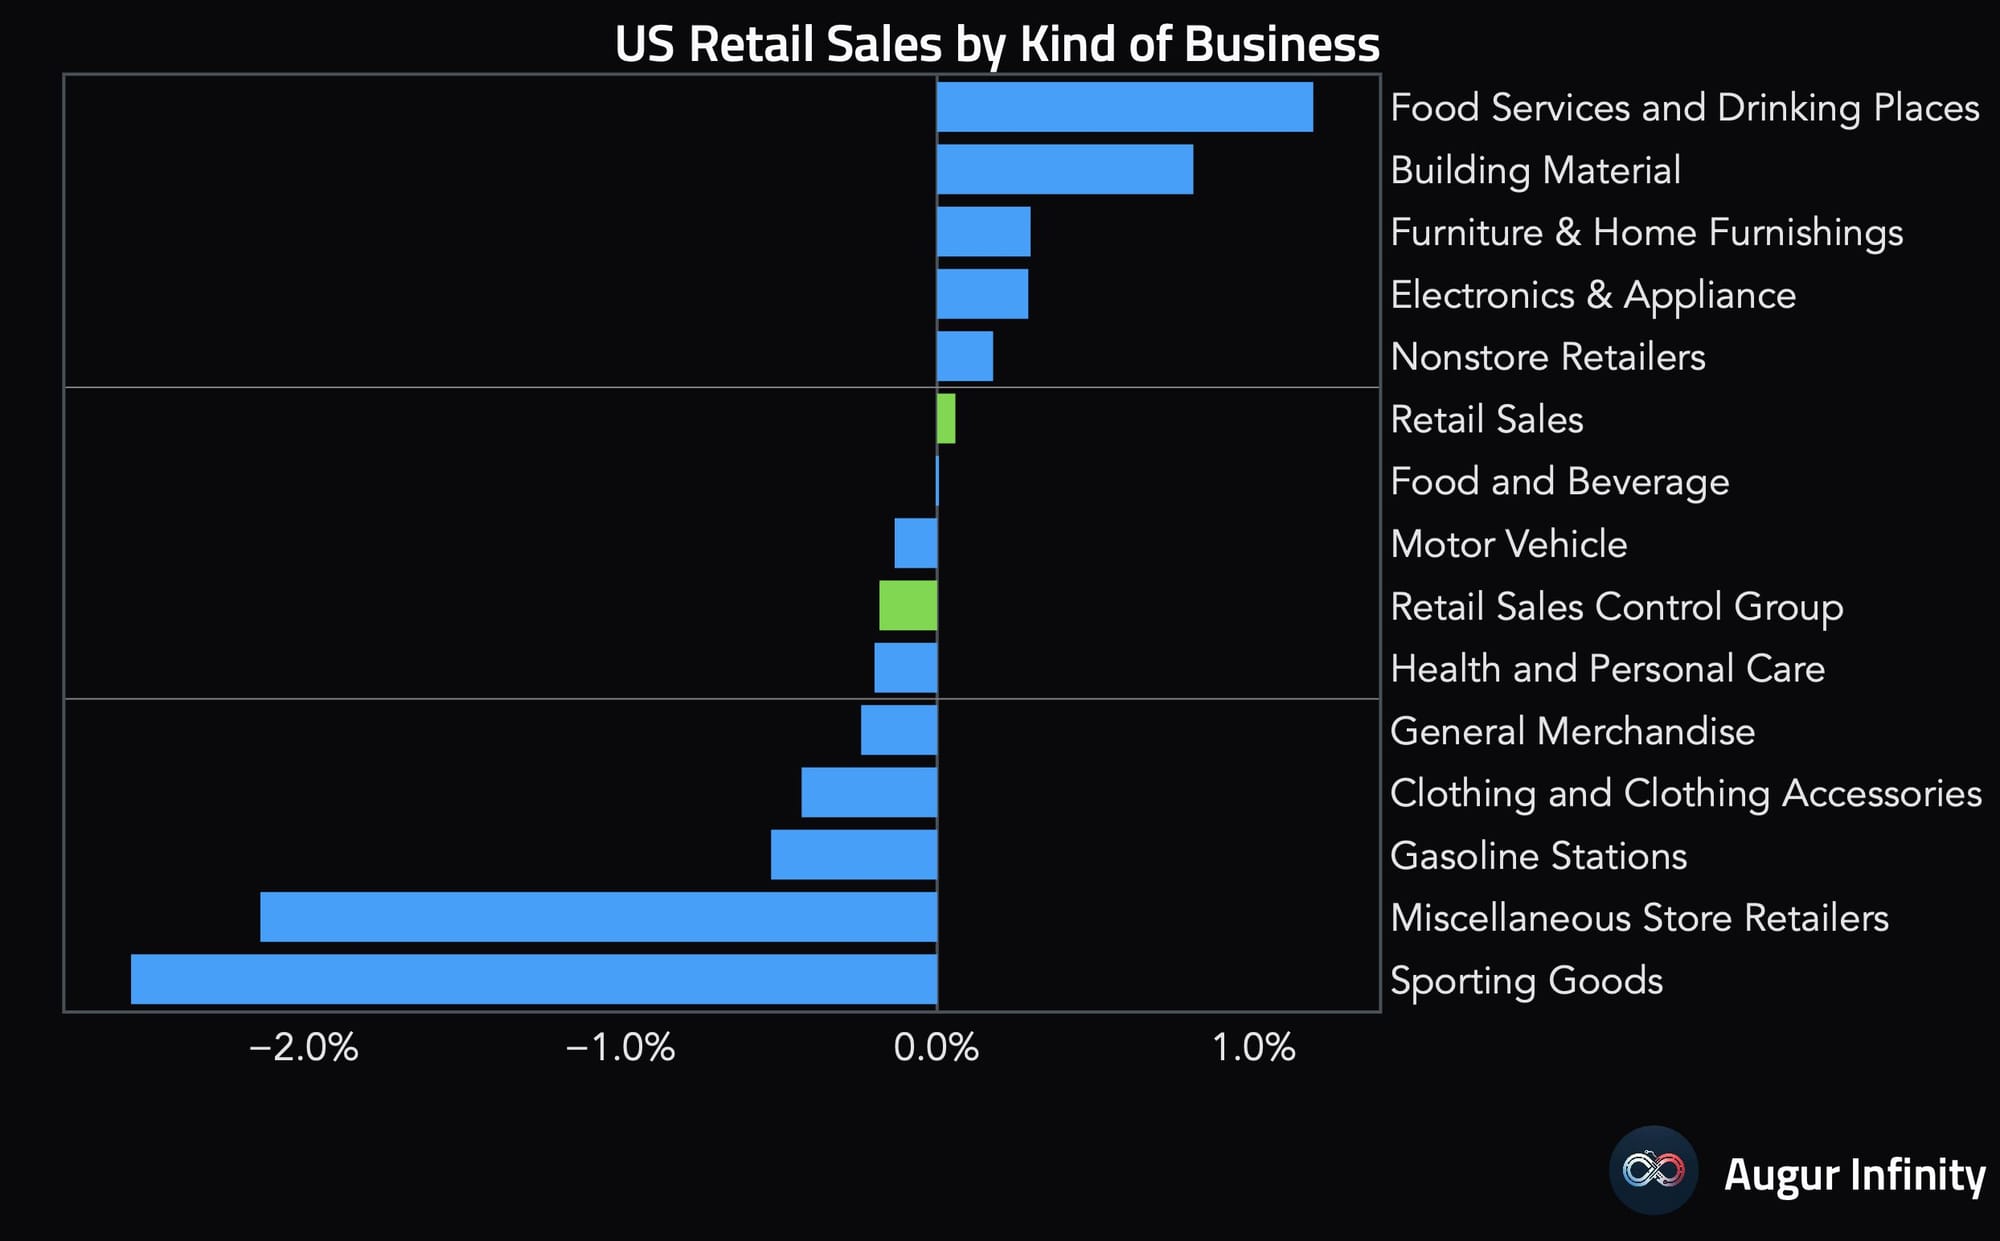
On Thursday, US retail sales figures were released, providing the revenue numbers from the retail sector.
These figures were disappointing. Moreover, after American consumers rushed to make purchases last month to outpace new tariffs, they are now cautious due to concerns about data distortions. Overall, I see no solid foundation for a rapid re-acceleration of the bull market.
Parker Ross is even more pessimistic:
Import tariffs are increasingly being passed on to consumers—and even more so to businesses. Coupled with pressure on profit margins and weaker figures this morning for retail sales, industrial production, and NAHB sentiment, all of this points to a deteriorating growth outlook.
The US central bank now has to decide whether the greatest risk lies in rising inflation or slowing growth. Following the retail sales figures, concerns over growth should carry more weight. The market immediately responded by pricing in additional rate cuts before the end of 2025.
At present, I lean toward the earlier-mentioned recovery in the credit cycle, although it is far from a perfect picture.
It’s also important to remember that financial markets are rarely purely bullish or bearish. The financial media often exaggerate extremes—portraying either a deep recession or a perfectly smooth landing. In reality, things usually fall somewhere in between: more nuanced, less spectacular, and occasionally a bit mundane.
3️⃣ ETH/BTC faces resistance
Bert
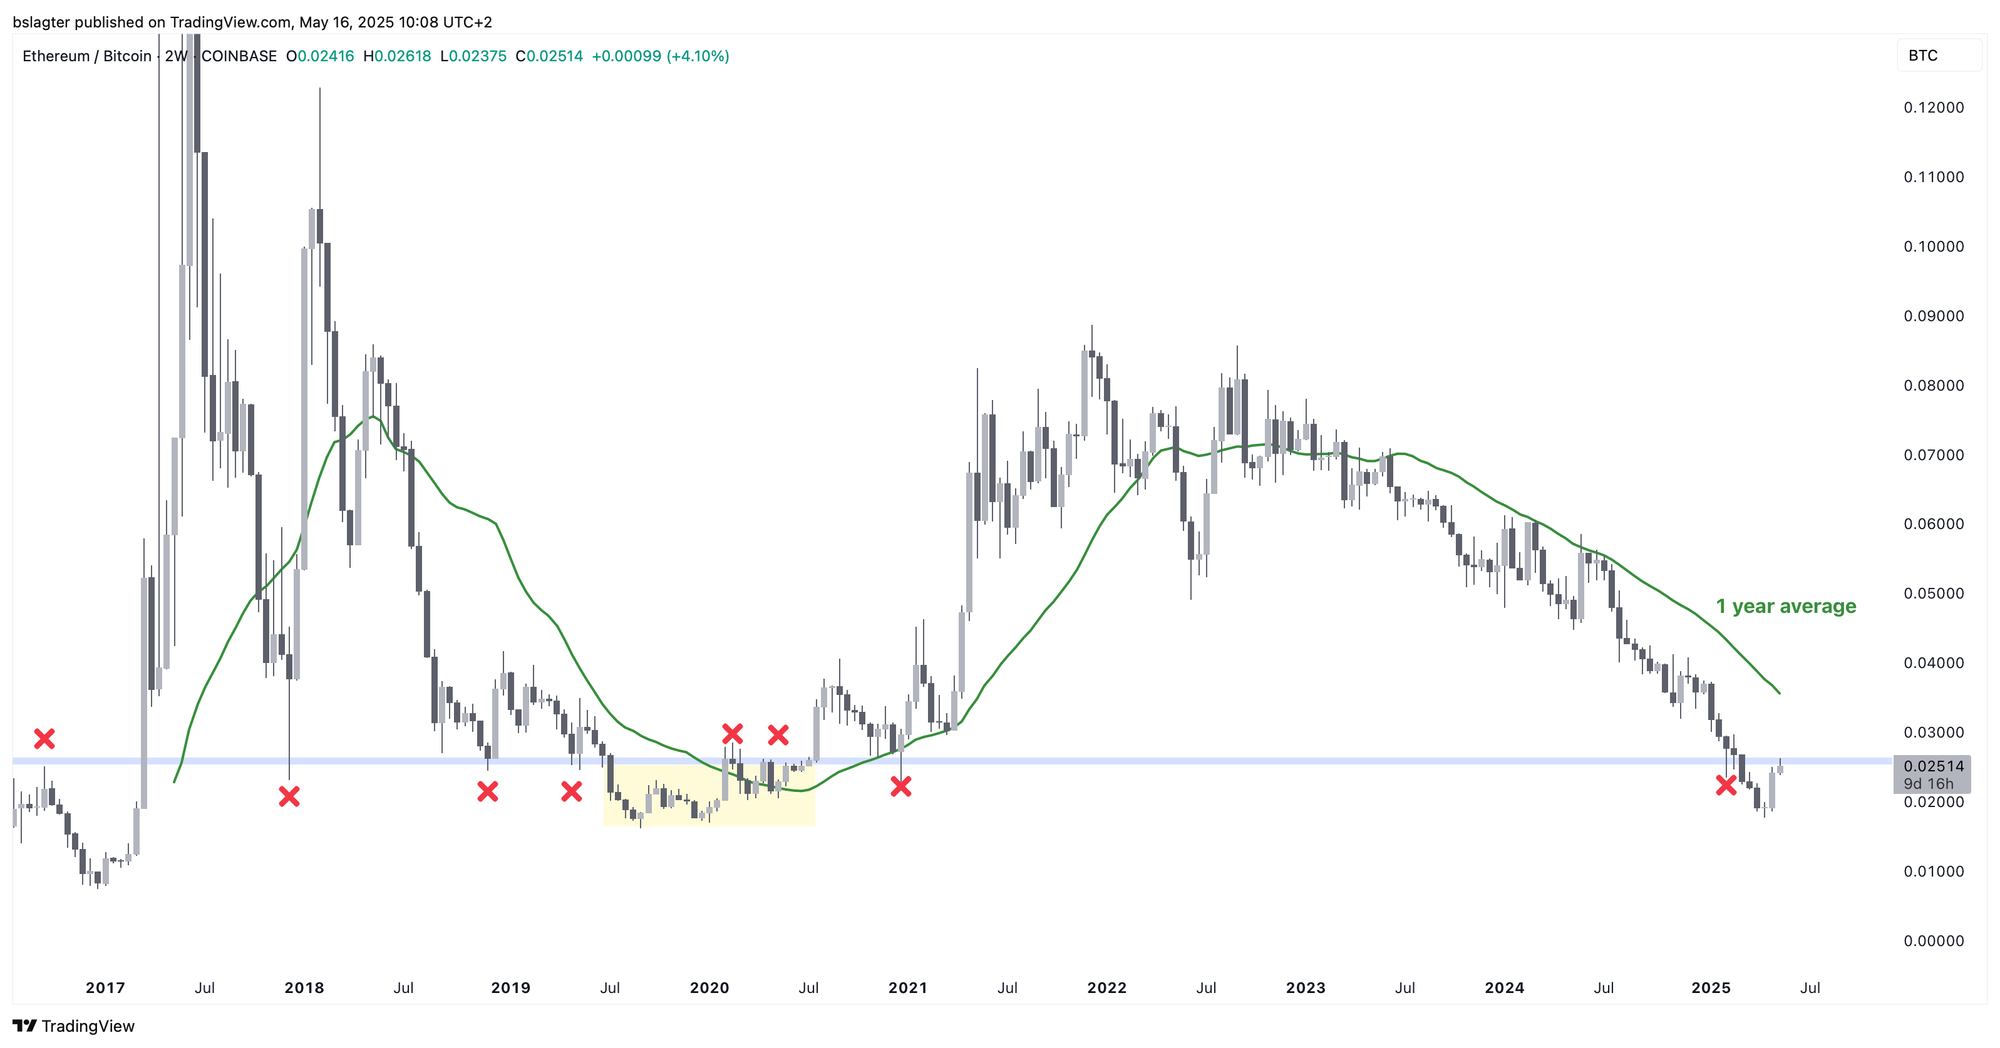
Last week, we highlighted the remarkable comeback of Ether—the second-largest cryptocurrency by market capitalization. Our focus has been on the ETH/BTC ratio, which measures the price of ETH in terms of BTC. A rising ratio indicates that ETH is outperforming BTC.
Over the past three years, the ETH/BTC ratio has trended downward from 0.086 to 0.018. Last week it was at 0.023, and this week it even briefly reached 0.026. This can be seen as a positive sign.
However, for a genuine trend reversal, the ETH/BTC ratio still needs to make several significant moves. The horizontal zone around 0.025 has proven to be a critical level time and again. A weekly close above that zone would be a strong initial signal. After that, we would like to see a weekly close above the dominant moving average, currently at 0.035.
Waiting for these signals might mean you miss the start of a new upward trend if it materializes, yet acting too soon could lead to premature enthusiasm and major losses if the downward trend continues.
4️⃣ A scenario for the coming months
Bert
Whenever possible, we explore various scenarios. Since the future is inherently uncertain, it pays to consider multiple outcomes. Sometimes, when visibility is limited, many scenarios seem plausible; at other times, one scenario clearly stands out.
At the moment, the evidence is increasingly pointing toward further recovery in risk assets in the coming months. The timing is also favorable, as we are at the start of a new weekly cycle.
The base scenario is that, over the next few months, prices will continue climbing to new record highs. On average, one weekly cycle consists of three daily cycles, which could push prices to a peak between $150,000 and $165,000. The chart below illustrates one possible path.
Even in this optimistic scenario, it might take until July before new record highs are reached. Several analysts are considering the possibility of an inverted head-and-shoulders pattern, as seen for example here and here.
It’s also worth noting that Bitcoin often trims the right shoulder—making it less deep and broad than the left shoulder. This is a sign of strong demand and enthusiastic investors. Consequently, the daily cycle low in early June might not drop as far as $91,200, instead finding support at higher levels.
Thank you for reading!
To stay informed about the latest market developments and insights, you can follow our team members on X:
- Bart Mol (@Bart_Mol)
- Peter Slagter (@pesla)
- Bert Slagter (@bslagter)
- Mike Lelieveld (@mlelieveld)
We appreciate your continued support and look forward to bringing you more comprehensive analysis in our next edition.
Until then!