Capitulation
Bitcoin plunged from $73K to $60K on February 5—one of the biggest crashes in its history. What does this mean for our scenarios? We reveal our price and time targets for this bear market.

When everyone finally accepts it's a bear market, it's usually closer to the end than the beginning. That's also where most people throw in the towel. We always behave the same way.
Bob Loukas shared on X two observations about bear markets. Once there's broad acceptance that we're in a bear market, most of the damage is already done. And in the final stretch of the bear market, you see most people capitulate. They lose hope and sell their positions, often at a loss.
When we changed our base scenario on November 14 from 'the bull market is intact' to 'the bear market has begun', we were in the minority. The consensus was that October 10 had caused a temporary shock, and we would soon resume the bull market.
Only in recent weeks have we seen acceptance across the board that the bull market is over and we're in a bear market. We're not yet at the 'everyone' from Loukas's post, but we're getting pretty close.
A bear market, then. And so far a perfectly normal one. Sellers are panicking and selling at a loss, while buyers are nowhere to be found. And why would they be—with price drops like these, you're better off waiting.
This is what it looked like yesterday:
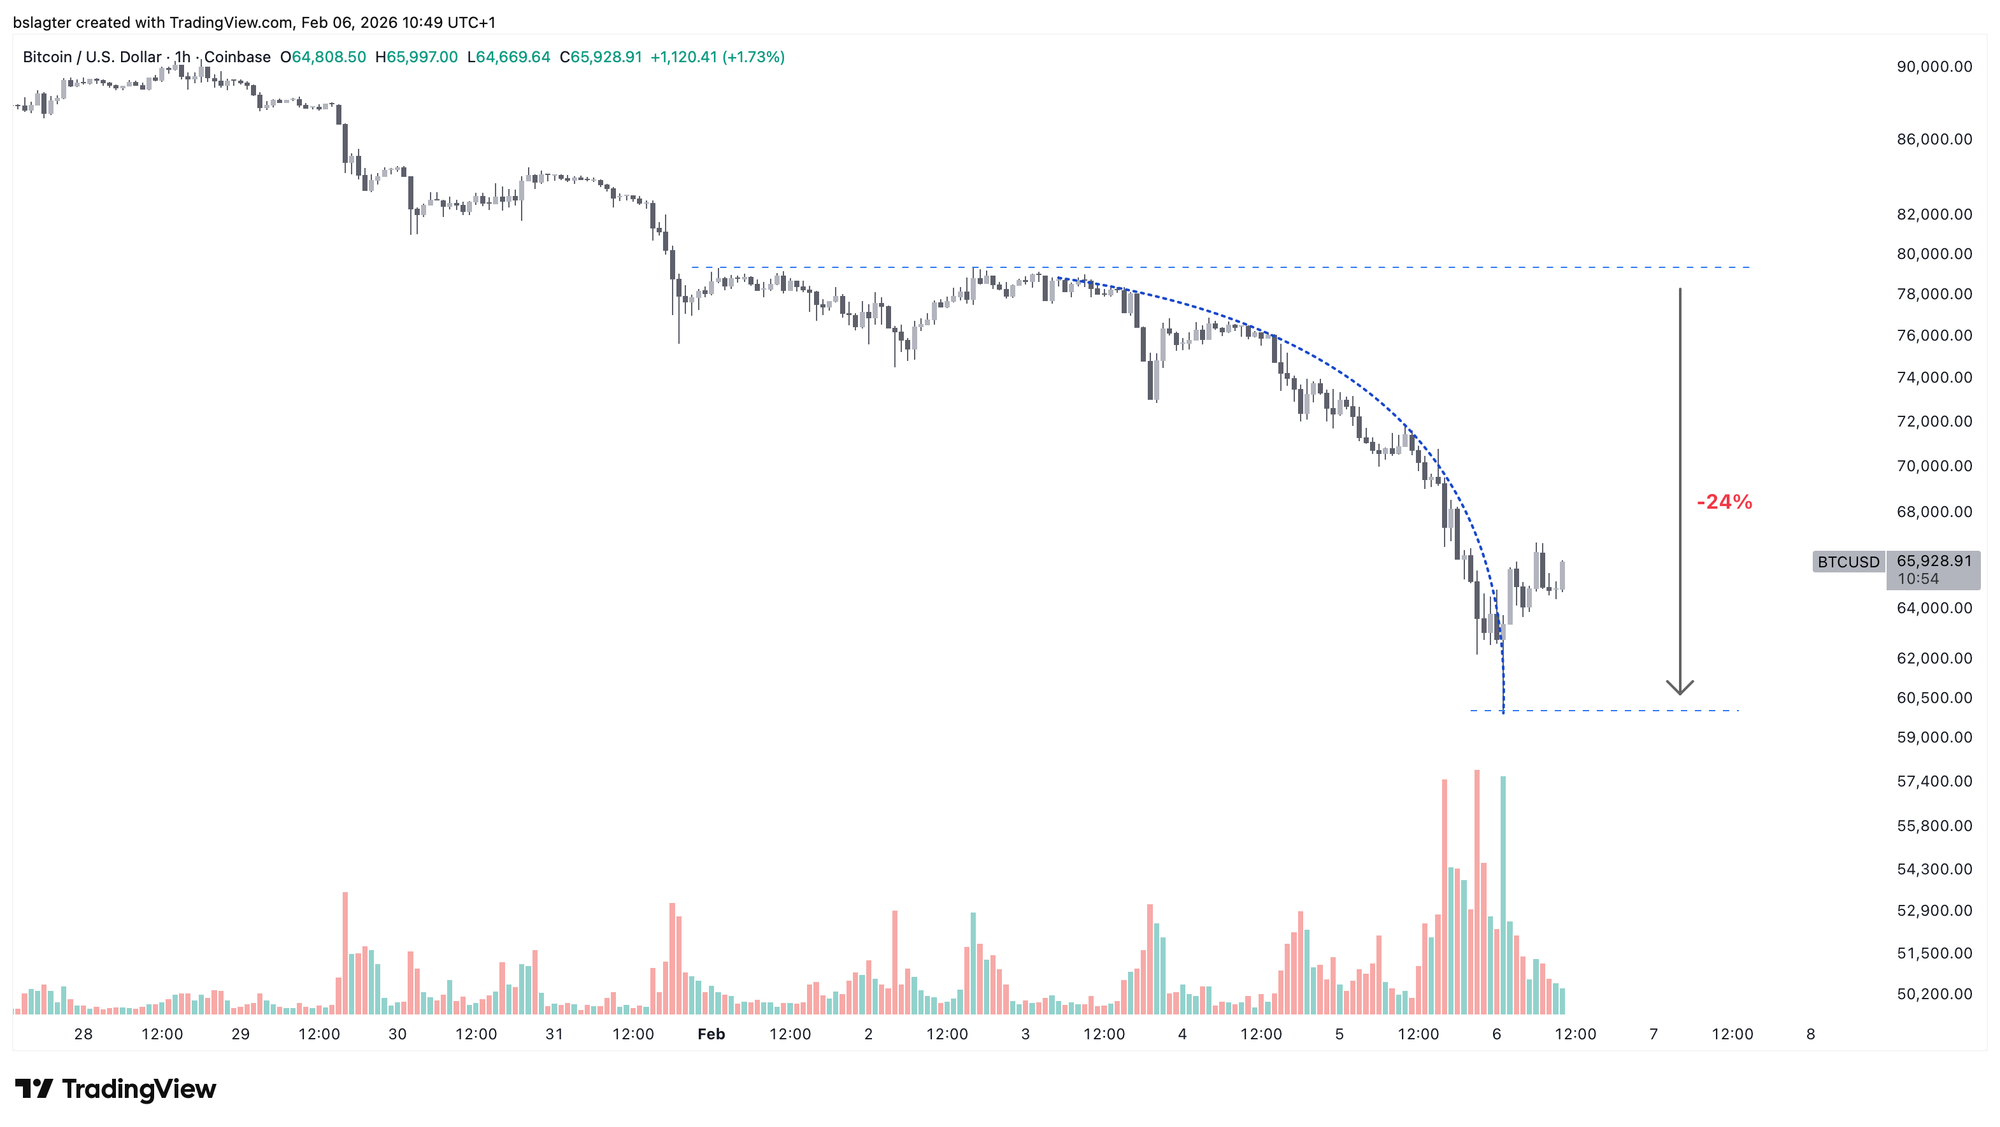
Yesterday was one of the most violent crashes in bitcoin's history books. It ranks in the top ten across numerous indicators:
Price drop: A crash is always measured in relative decline, in percentages. Yesterday's nearly -14% drop ranks 8th place among the largest declines in the past 10 years. In the previous bear market, we had two days like this.
Trading volume: A price drop (or rise) carries more weight when there's high trading volume. Coinbase saw $3.34 billion traded yesterday, good for 8th place on the rankings.
Realized loss: On-chain data shows nearly $6 billion in realized losses yesterday, higher than any crash in the previous bear market, and more than on November 21, 2025.
Sentiment: Bitwise's Cryptoasset Sentiment Index hit its lowest level since the FTX collapse in November 2022.
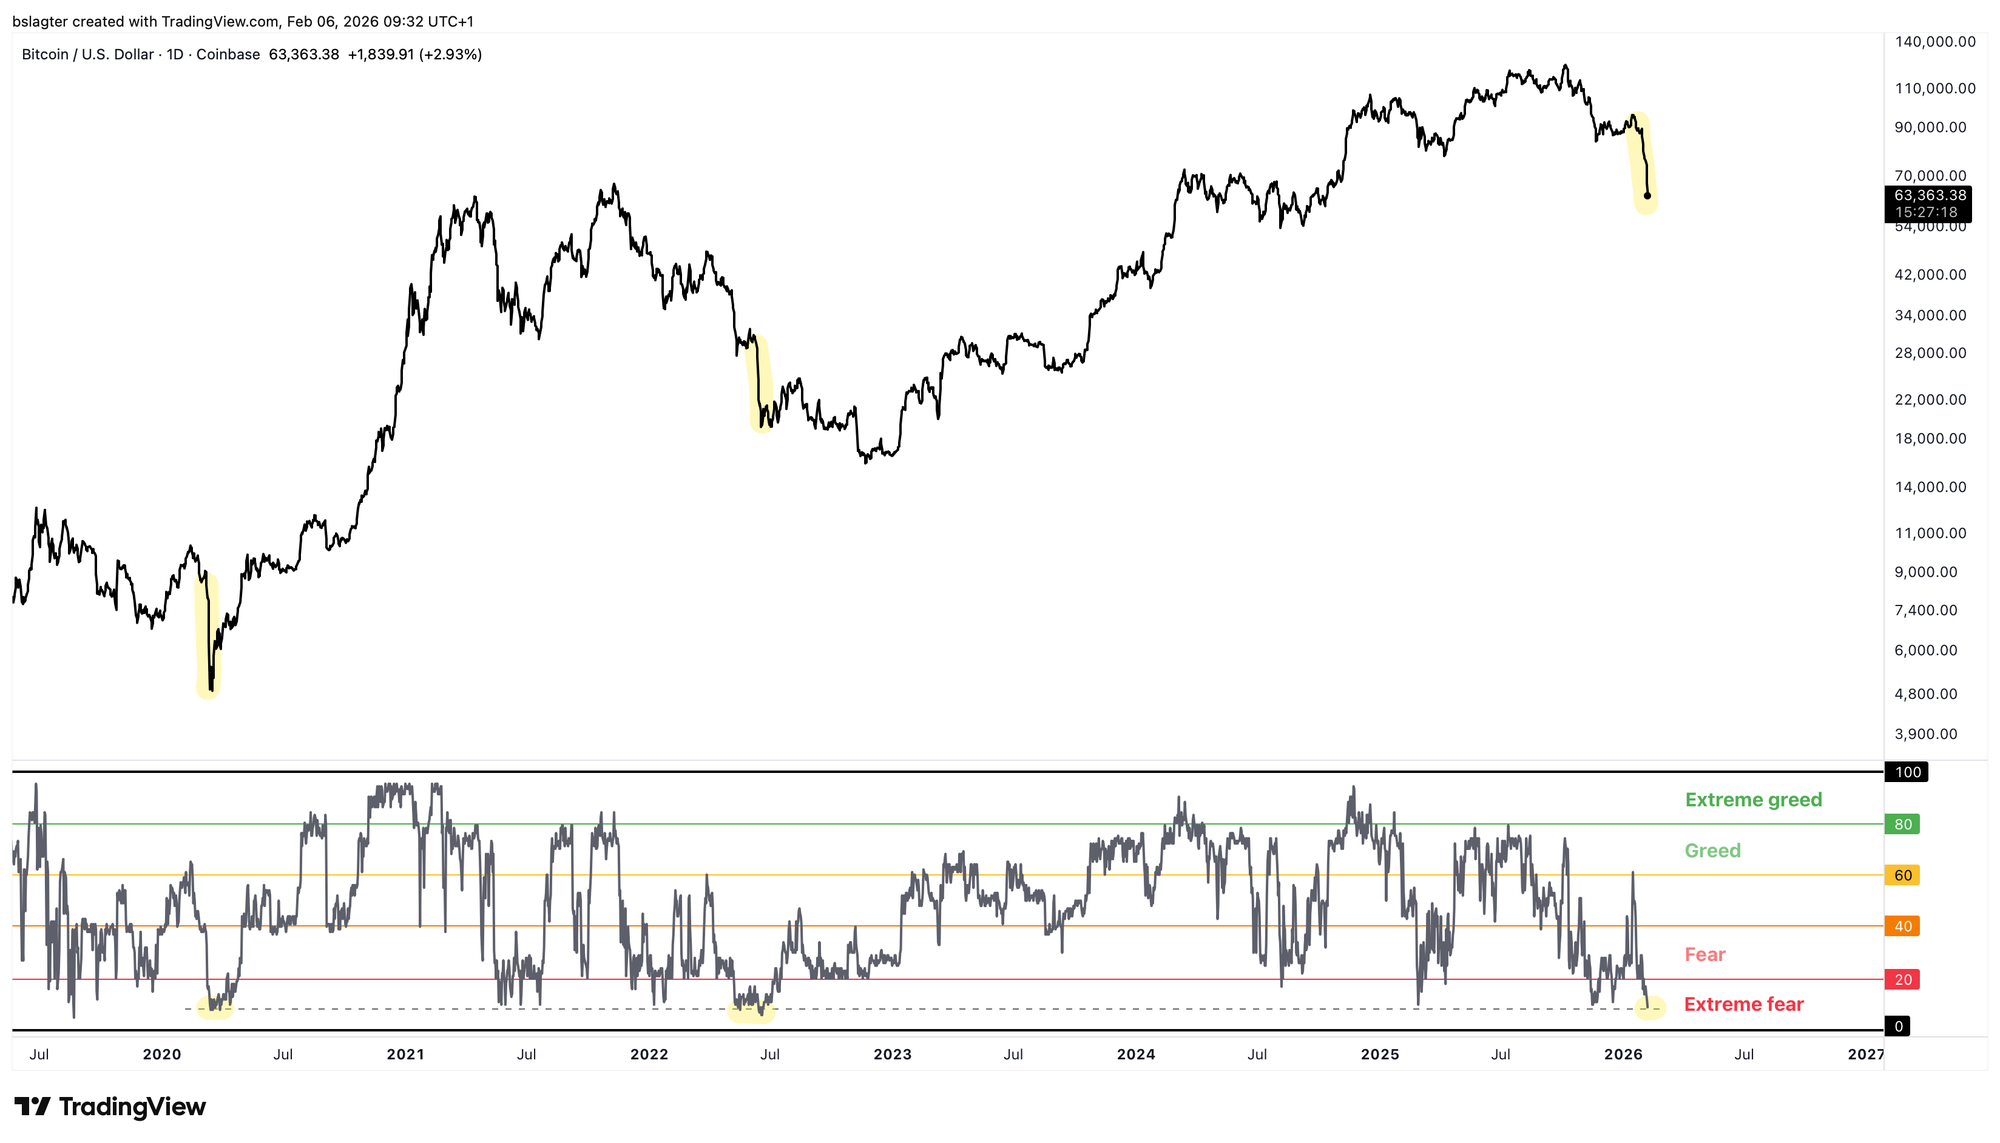
Fear & Greed: The Fear & Greed Index reading is comparable to the 3AC crash in June 2022 and the COVID crash in March 2020.
Yesterday we witnessed capitulation. You can see it in the data through the combination of an accelerating decline, high trading volume, large realized losses, and wide spread. You also see it in sentiment, in the stories people tell. Hope is fading that this is a temporary deviation; the realization is sinking in that we're in a bear market.
Below you'll find the bitcoin chart with the emotions that accompany the progression through the market cycle. In December, I gave a workshop about this in our Discord, which you can watch here.
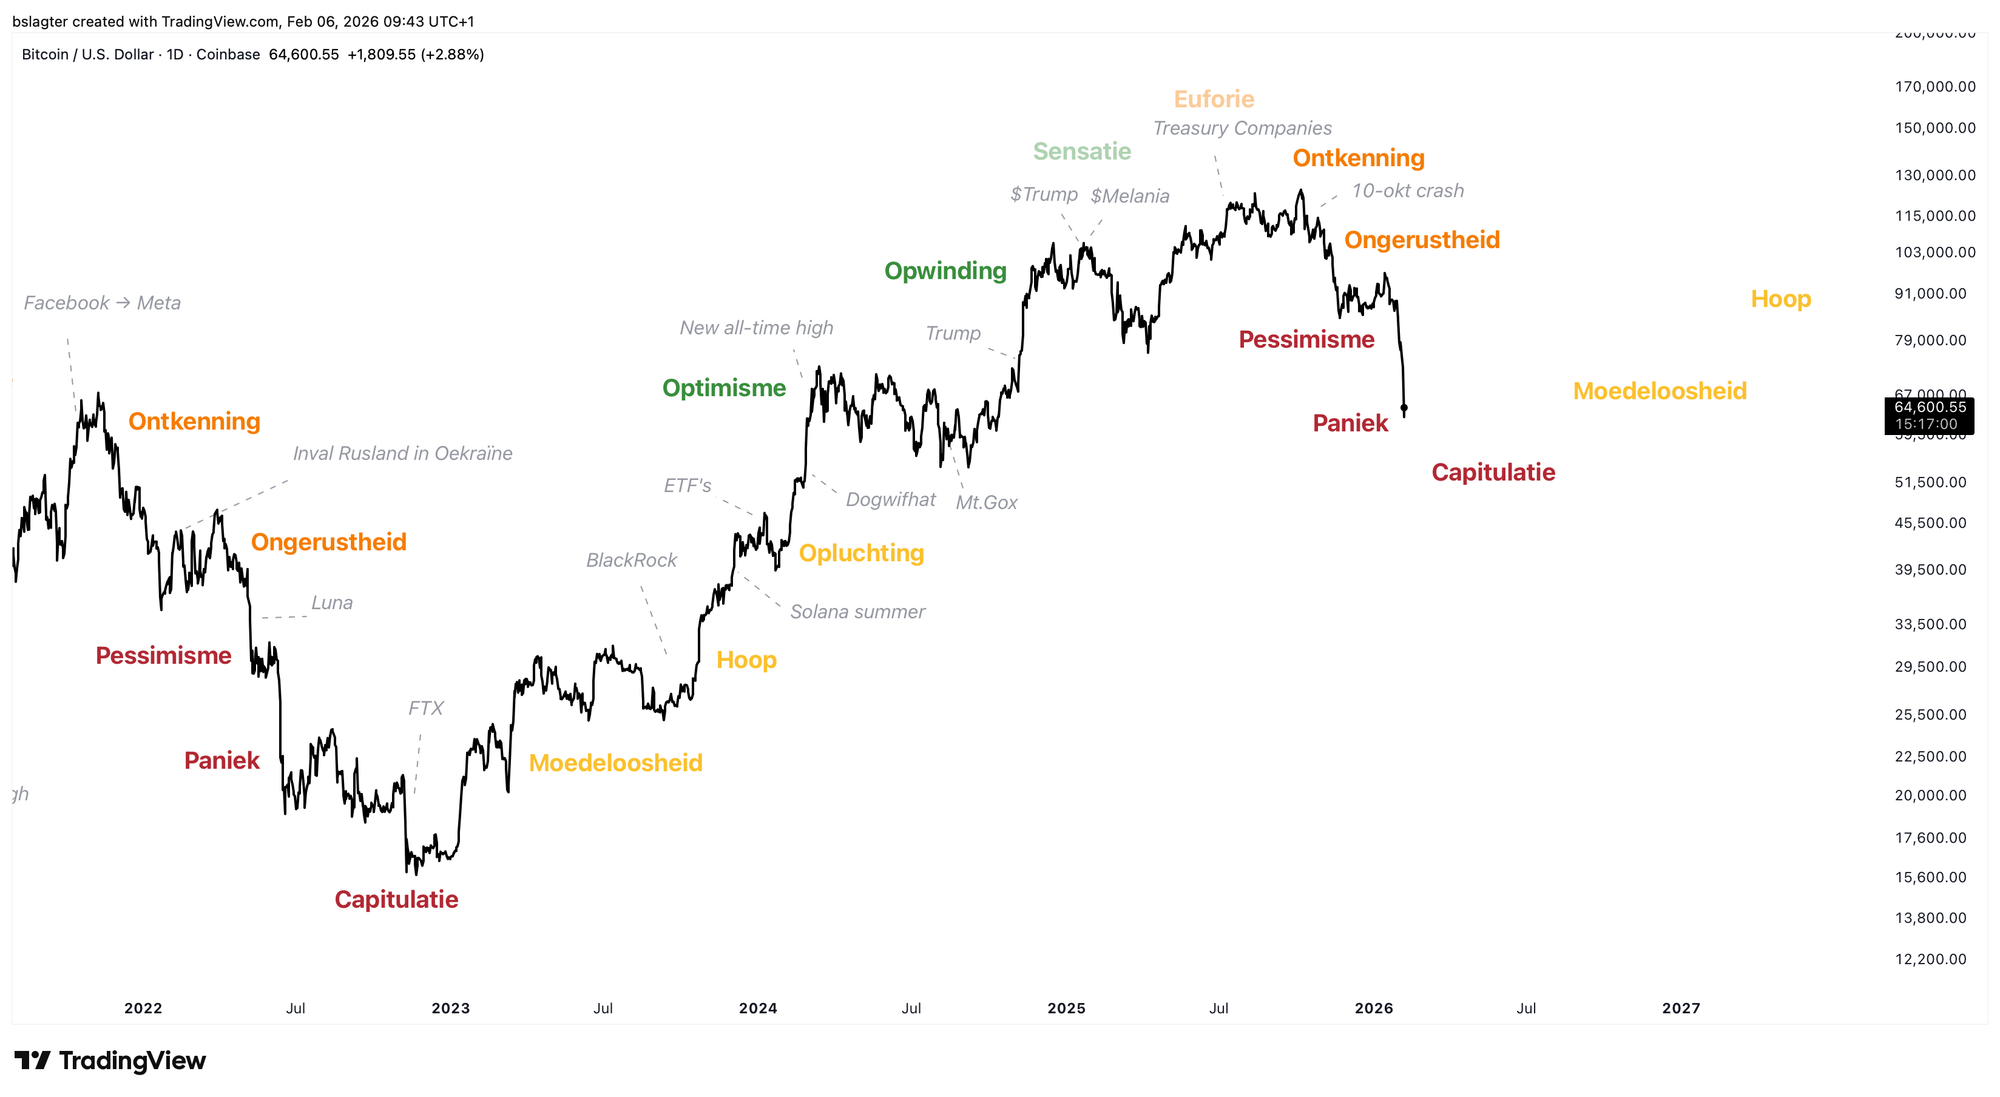
We're now clearly seeing the transition from anxiety and pessimism to panic and capitulation. People are giving up. Sometimes literally: they sell their bitcoin and leave. Often figuratively: they're saying goodbye to dreams of higher prices soon, and the narratives that would make that happen.
For example:
- Trump ends Biden's anti-crypto policies, a strategic bitcoin reserve is coming, and therefore bitcoin has tailwinds for years to come.
- Bitcoin is digital gold and will perform excellently during geopolitical turmoil, becoming an important part of the debasement trade.
- The bitcoin ETFs unlock a large group of new investors who aren't sensitive to crypto market emotions.
This is normal. In bear markets, the narratives from the preceding bull market always die. See, for example, this tweet from Ben Hunt in June 2022, right after the biggest capitulation of the previous bull market:
The biggest problem for Bitcoin!™ is that all of the NGU narratives are dead.
— Ben Hunt (@EpsilonTheory) June 18, 2022
'Store of value', 'digital gold', 'inflation hedge', 'new monetary system' … the crowd no longer believes that the crowd believes any of this anymore.
Common knowledge works both ways. pic.twitter.com/LgZPbR5iI0
Narrative follows price. In a bear market, new stories quickly surface to explain the weakness. For example:
- This is all the result of the disruptive crash on October 10, 2025. Major players are in trouble and are systematically selling.
- Bitcoin turns out not to be digital gold, and therefore has no reason to exist and doesn't belong in investor portfolios.
- Bitcoin is vulnerable to quantum computing, and until there's a solid plan for that, you'd better keep your distance.
- Bitcoin is an American party that's been annexed by Trump. A significant portion of investors worldwide want nothing to do with that.
- The Clarity Act in the US isn't going to happen, so uncertainty about regulation and oversight remains.
Two things stand out.
First, there are topics that first provide a positive narrative and then a negative one. Trump as breakthrough and Trump as brake. Digital gold as destiny and as identity crisis.
Second, there are topics that resurface every bear market. Nobody believes in digital gold anymore. China bans bitcoin. Bitcoin was invented by the CIA, Israel, or Charlie Epstein.
Many narratives contain a kernel of truth, both the positive ones in the bull market and the negative ones in the bear market. They represent forces that are relevant over a timeframe of many years. However, the effect, the risk, the opportunity, the short-term influence is greatly exaggerated.
Over the timeframe of the market cycle, the ebb and flow of economic growth, global liquidity, and investor risk appetite dominate. This rhythm is amplified by the dynamics of fear and greed. Every bull market gives birth to the next bear market and vice versa.
The chart below provides a nice illustration. You could understand bitcoin's price as a combination of (a) the adoption curve and (b) the business cycle.
Over the very long term, the growing network effect of bitcoin as an emerging store of value translates into rising market value. The price swings around this, driven by the inhaling and exhaling of the economic growth cycle.
The forces that play the lead role in the major explanatory narratives (security budget, quantum computing, regulation) primarily influence future adoption, not the oscillation around it. Yet they're used to explain precisely that oscillation. And therefore: narrative follows price.
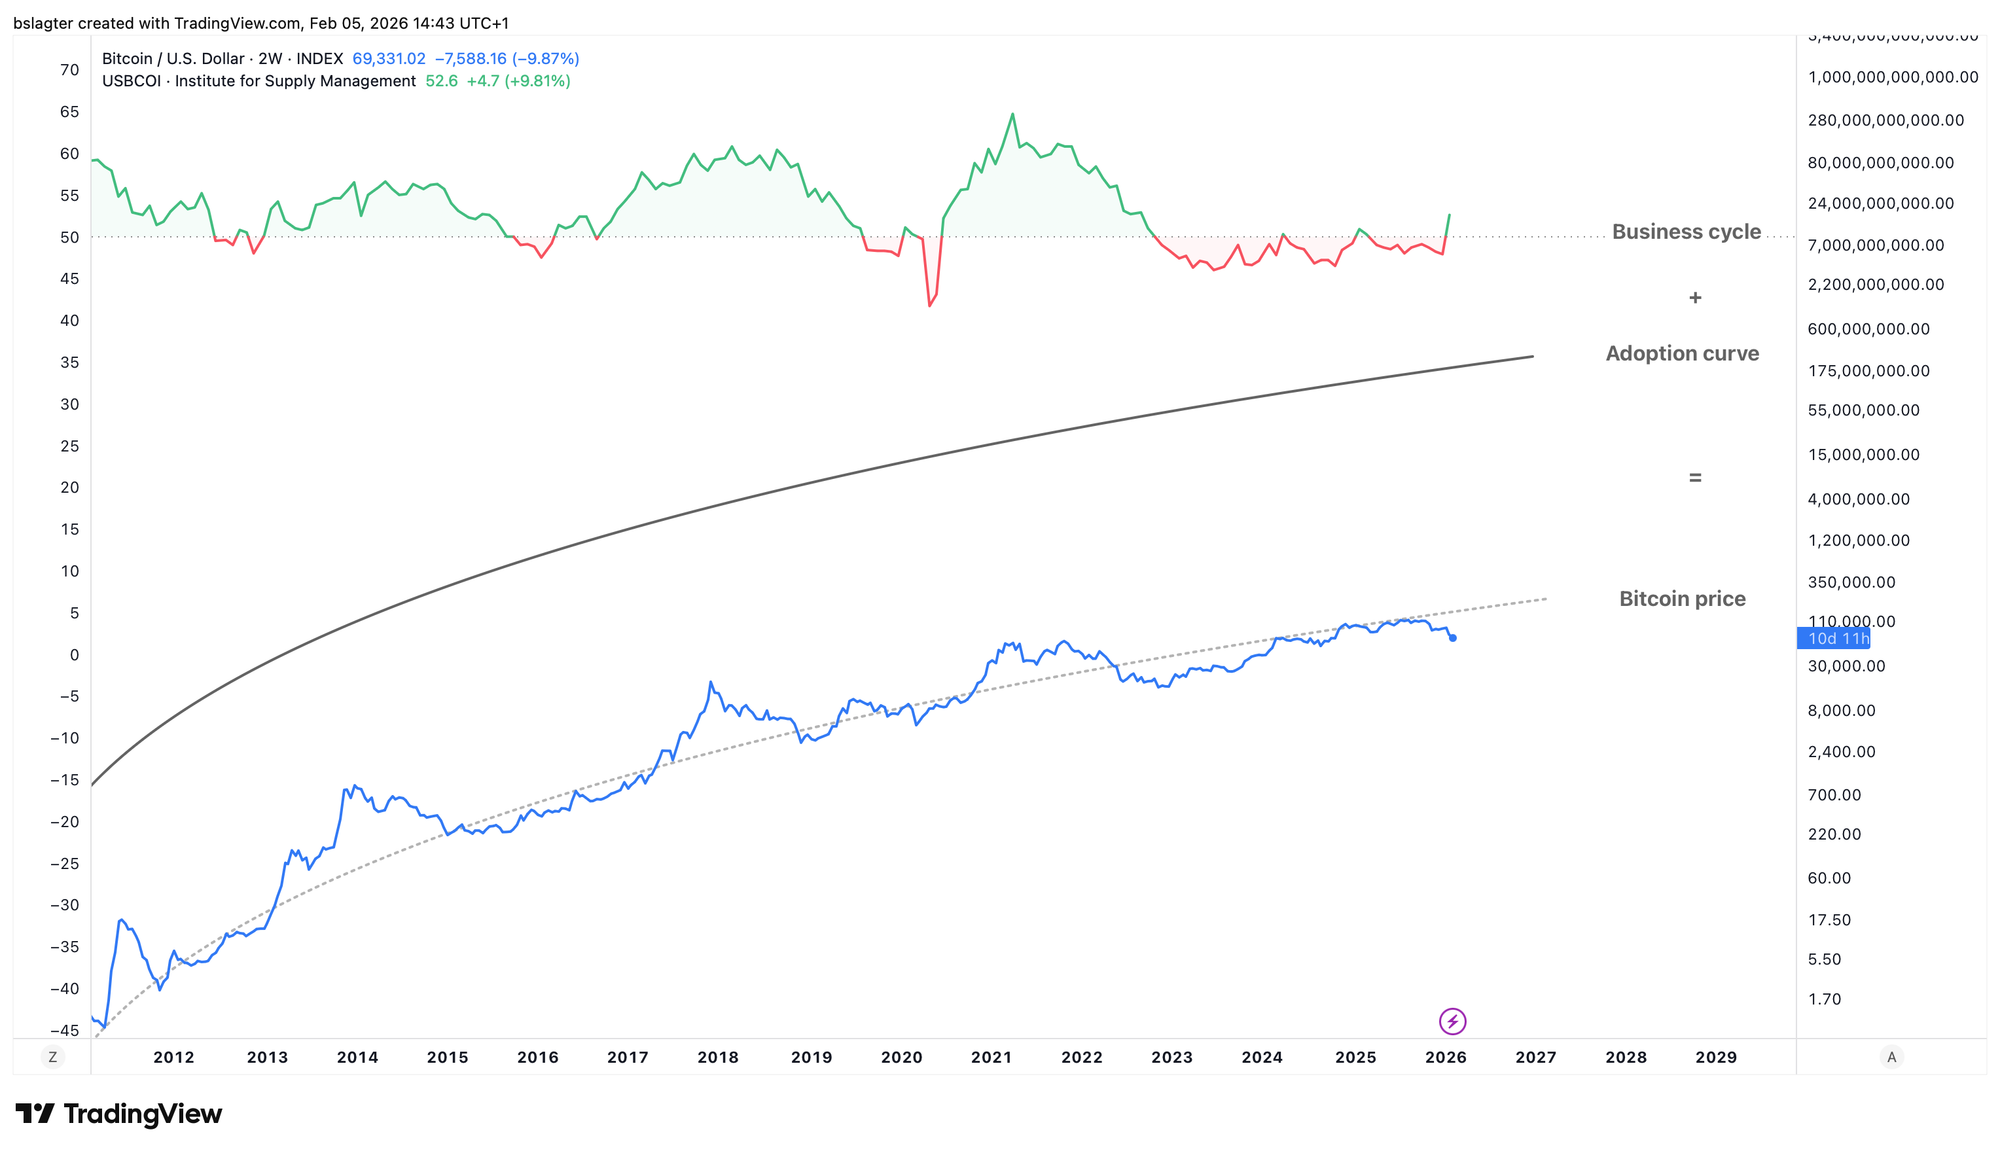
The top chart is the Manufacturing PMI from the Institute for Supply Management (ISM). It reflects manufacturing purchasing managers' view of the present and future, and has historically proven to be a good gauge of economic growth.
We've come through an unusually long period of contraction, with PMIs largely below 50. This can be explained by the central bank's aggressive intervention to curb inflation in 2022. Only in recent months has Jerome Powell taken his foot off the brake pedal.
In January, the PMI jumped to its highest level since May 2022. This could be an early signal of a new period of economic growth. That would mean we're "early cycle" with an average of 9 to 18 months of expansion ahead. The narrative that might later be attached to this could be the AI boom driving productivity and prosperity.
But one swallow doesn't make a summer. January could be an anomaly. An outlier in the data. A one-time effect. We'll have to wait and see before drawing major conclusions.
For now, we're still in a bear market. In this Alpha Markets, we'll cover the following aspects for our Plus members:
- Scenarios and probabilities
- A price target for this bear market
- A time target for this bear market
And also these topics:
- All high-risk investments are under fire
- Accepting losses to limit the damage

Scenarios and probabilities
Our scenarios were as follows until now:
- Bull market continuation: 20%
- A sideways period: 30%
- A mild bear market: 30%
- A deep bear market: 20%
By almost every measure, the crypto market was already lower last weekend than the bottom of April 7, 2025. Total market cap, most altcoins, and even bitcoin when expressed in euros, yen, gold, or S&P 500. Only when measured in dollars, it wasn't.
That has now happened too. The price dropped on Tuesday, February 3 below the $74,400 that marked the lowest point of 2025.
However this weekly cycle unfolds from here, we know a few things for certain:
- The uptrend on the weekly chart (= bull market) is over.
- This is a failed weekly cycle. The end is lower than the beginning.
- So we're in the declining portion of the yearly cycle.
We can reduce the probability of scenario 1 to 0%. A bull market continuation is no longer possible. If we were to rise to a new all-time high now, we would call it a new uptrend, and therefore a new bull market.
Let's look at scenario 2. This scenario describes a trendless period on the weekly chart, where price moves sideways in a range. The dominant moving average becomes horizontal and price oscillates around it. This is becoming increasingly unlikely.
We knew bitcoin would face a cyclical period of weakness, the market's ebb and flow. If this played out in an optimistic context—think booming economy and high risk appetite—then a shallow bear market could result. That was the idea behind scenario 2.
However, the facts and circumstances strongly point to a normal bear market, with a clearly declining trend on the weekly chart. Scenarios 3 and 4, then.
The only way scenario 2 stays alive is if we fully recover this week's decline in the coming days, leaving only a long wick on the weekly chart. Similar to the yen crash in August 2024. That chance is very small. Let's put it at 5%.
So we now have:
- Bull market continuation: 0%
- A sideways period: 5%
That leaves:
- A mild bear market
- A deep bear market
But it's also time to add a new scenario. Namely, the scenario that yesterday's crash marked the deepest point of the bear market, and we've now begun a new bull market.
This is unlikely based on both depth and timing. We'll show shortly that we haven't yet hit the obvious price target and time target. At the same time, there are now data points that fit with the bottom of a bear market. Let's also put this at 5%.
All together, we arrive at this picture:
- Bull market continuation: 0%
- A sideways period: 5%
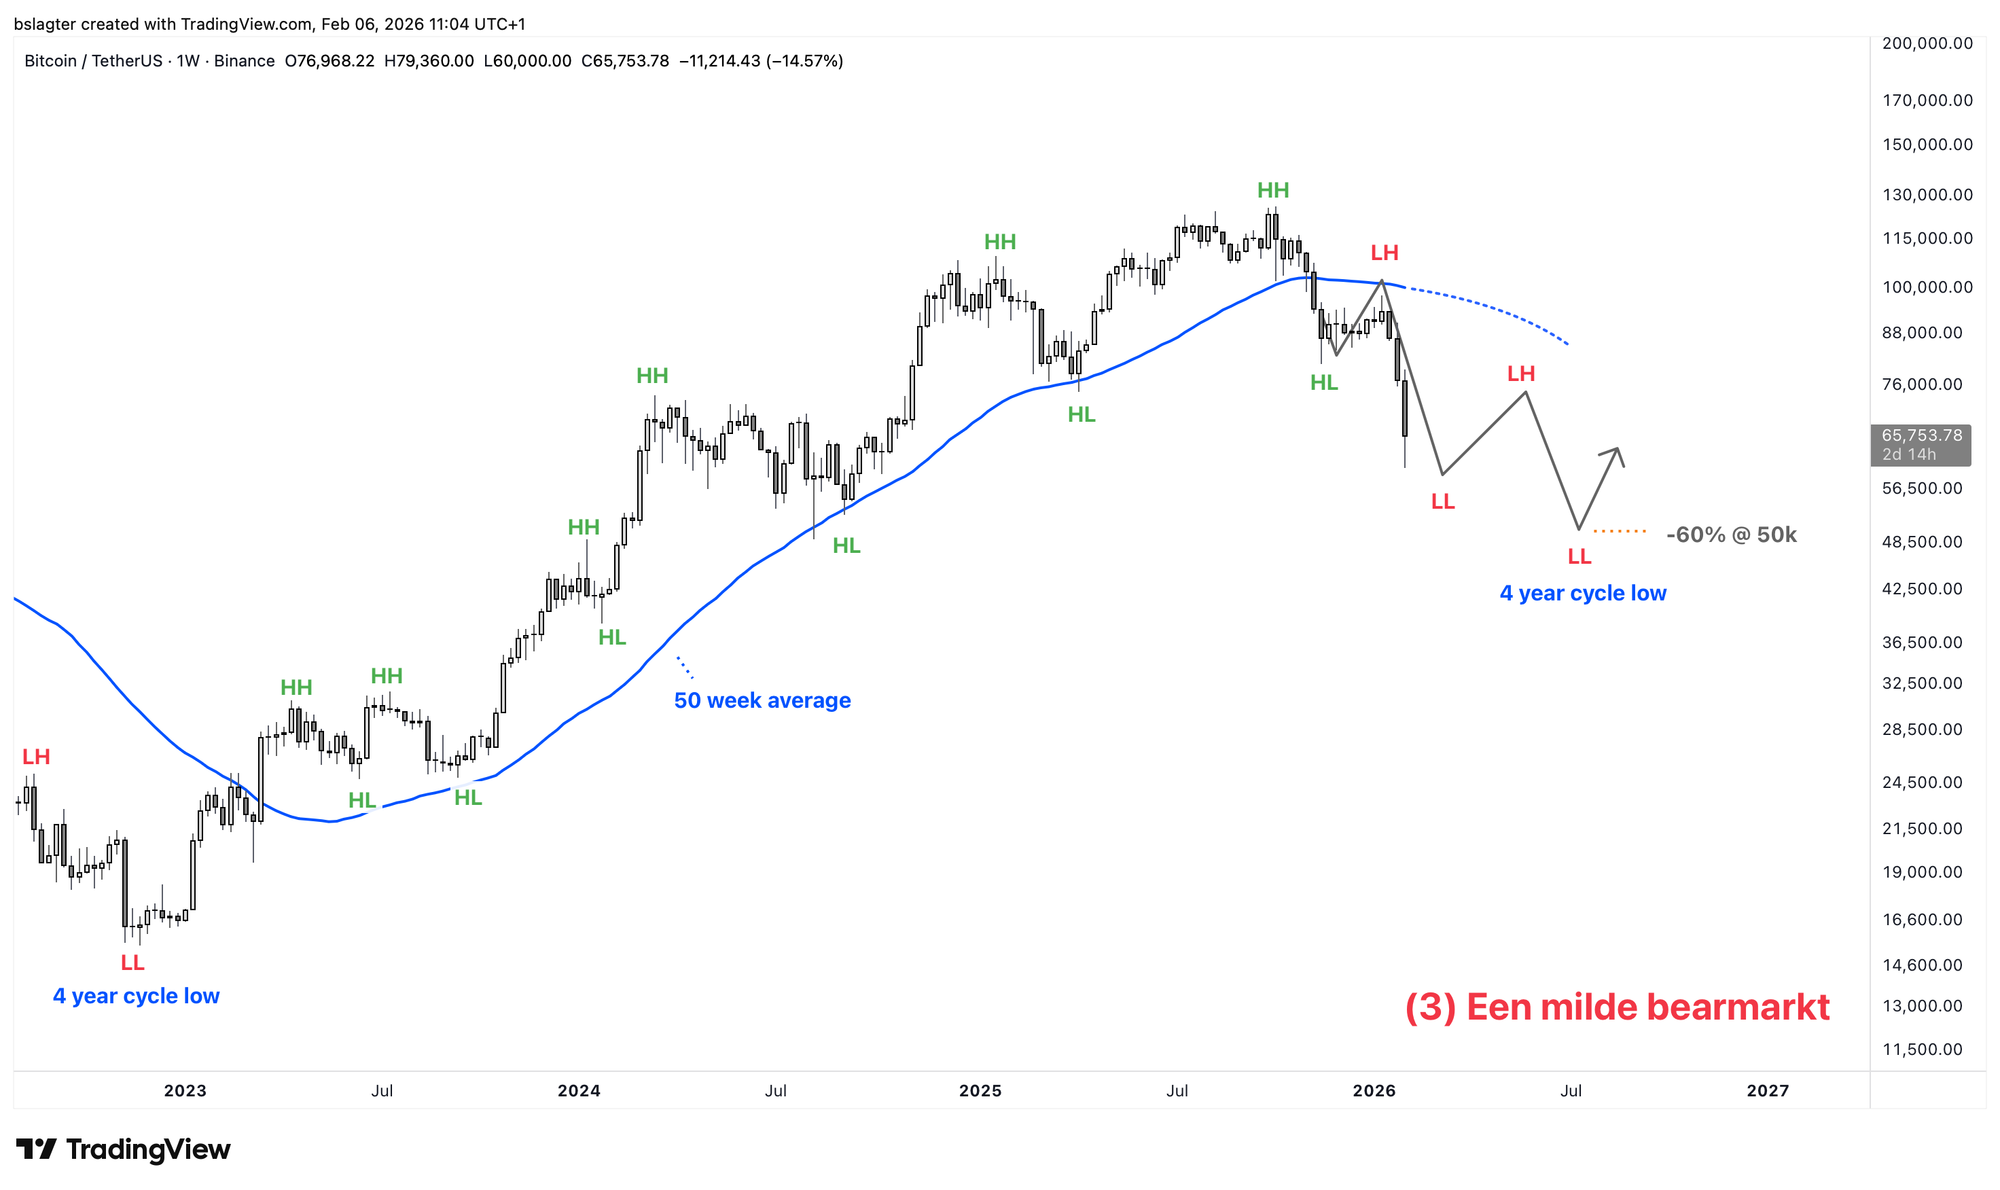
- A mild bear market: 70%
- A deep bear market: 20%
- A new bull market: 5%
Our base scenario is therefore as follows. The bull market is over; we're in a bear market. The trend on the weekly chart is declining with lower highs (LH) and lower lows (LL). The bear market will reach the same depth in valuation terms as previous bear markets. For price, this means a mild bear market with a decline of around 60%.
A price target for this bear market
If we accept that we're in a bear market, attention shifts to different signals. We're no longer looking for investors hitting the buy button out of enthusiasm and optimism. Jumping in and FOMO are no longer the driving forces for now.
In bear markets, we want to see buyers who find bitcoin undervalued. Those who perhaps sold some near the top and are now stepping back in. Or those who decided in 2024 and 2025 that they wanted a bitcoin position but waited until the froth had come out of the price. The accumulation this creates lays the foundation for the bottom.
At the moment, we're barely seeing this. Apparently, the bear market hasn't been deep or long enough to create a collective feeling of 'this is a bargain.'
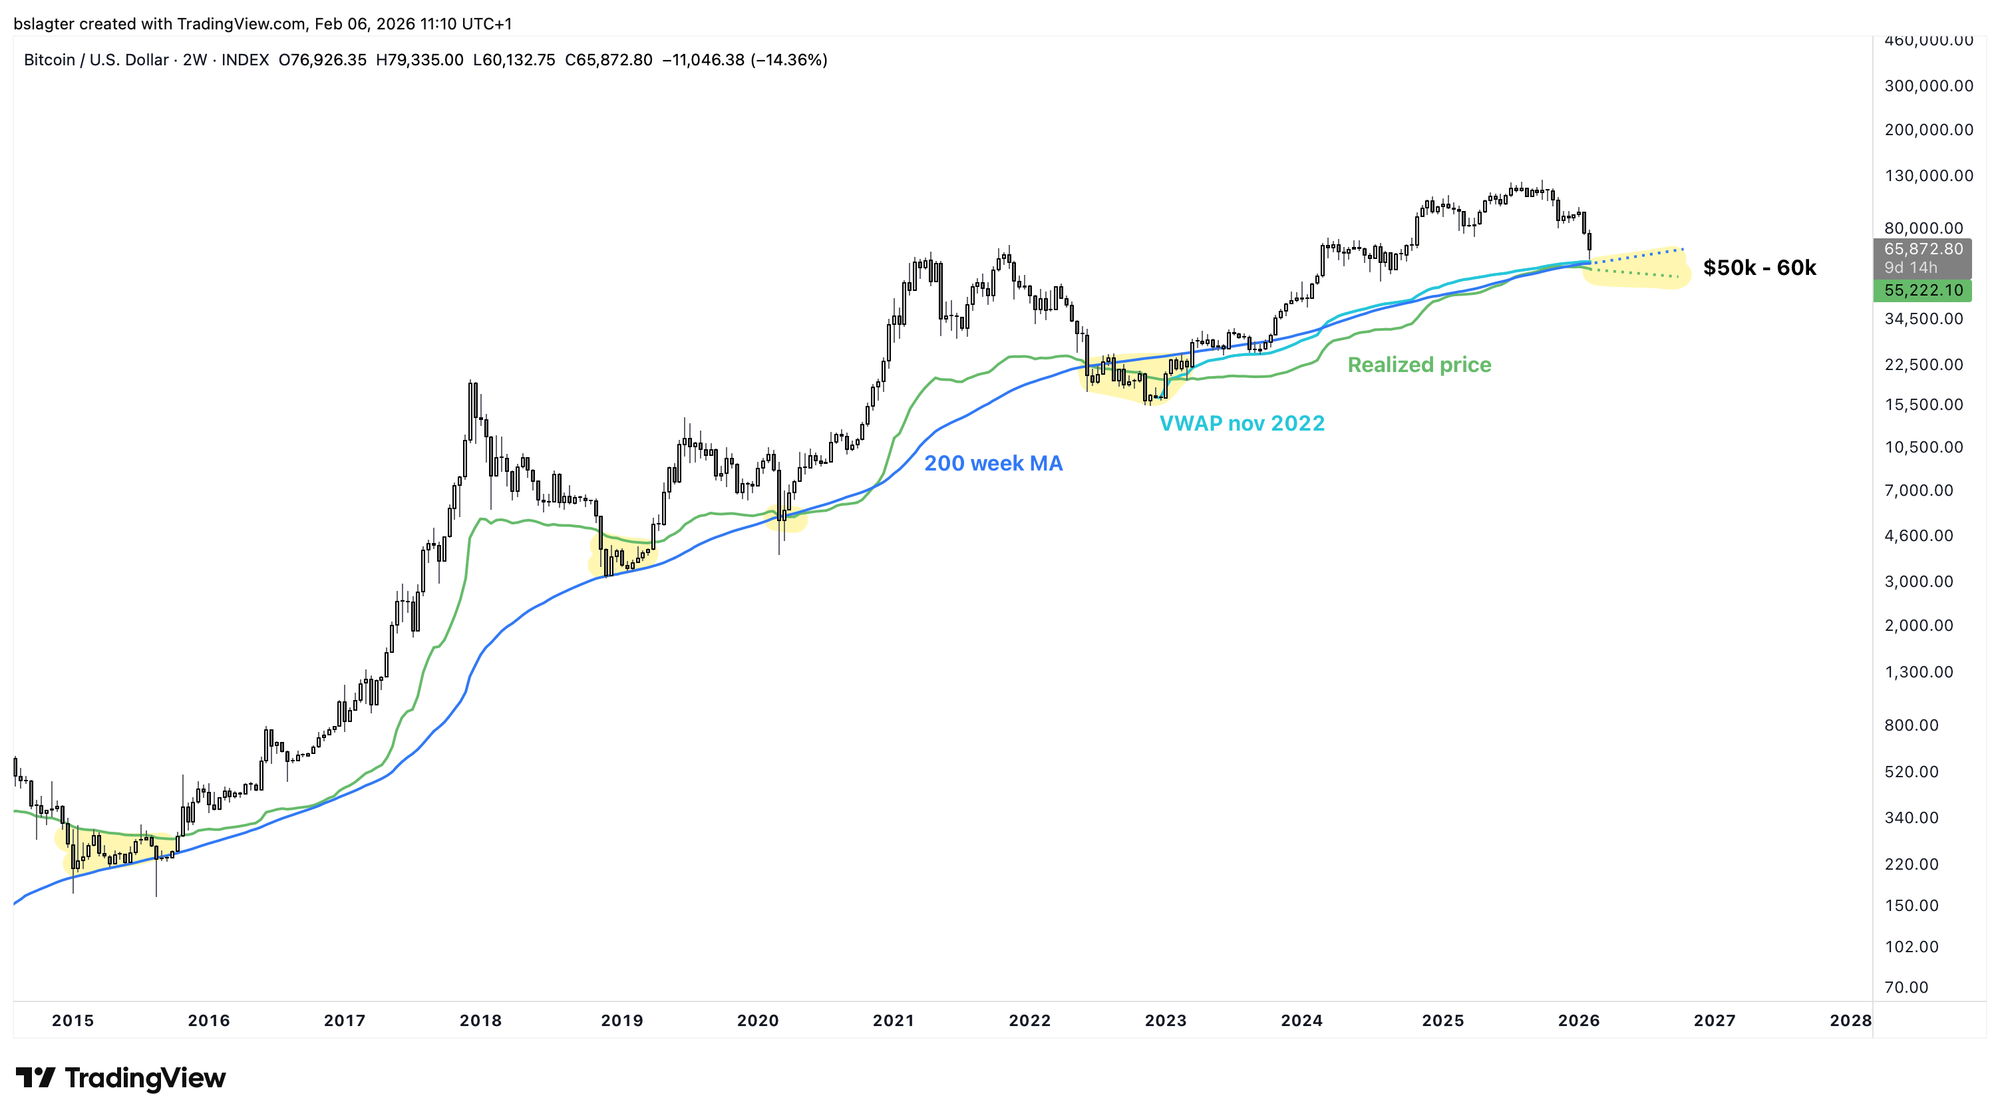
In previous bear markets, we saw accumulation around the 200-week moving average and around the realized price. Both are rough estimates of the average purchase price across all investors. They currently both sit around $57,000.
In bear markets, we see the realized price decline slightly because more investors take losses than take profits. The 200-week moving average continues rising as long as today's price is higher than the price four years ago. This creates the landing zone for the bear market, marked in yellow in the chart below.
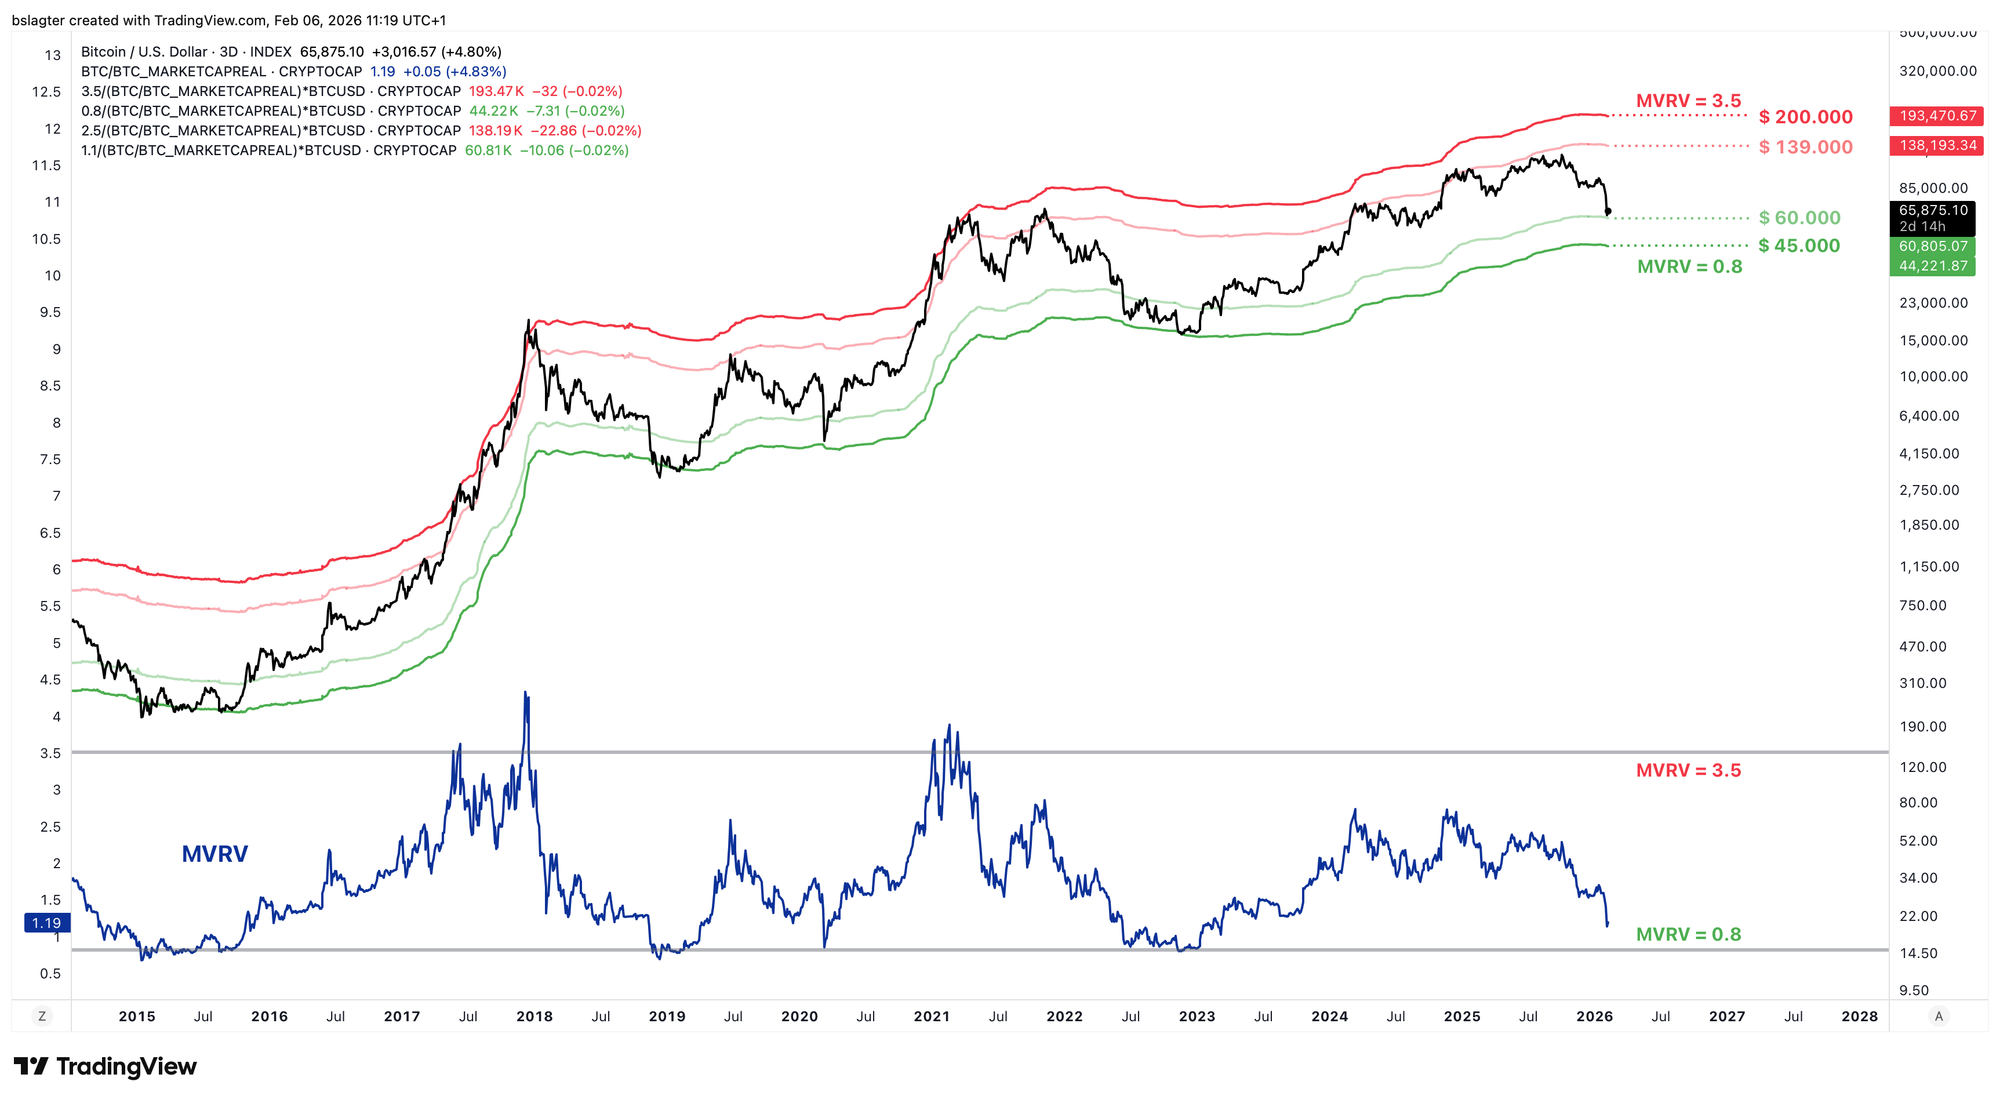
Another way to visualize the same thing is with MVRV. MVRV tells us how far the market value (MV) is stretched above the realized value (RV). Are investors willing to let their unrealized gains run significantly? Then we see that optimism reflected in a high MVRV. This indicator is sometimes said to measure the market's temperature, from cold to overheated.
An MVRV of 1 occurs by definition when the price equals the realized price. Also around $57,000, then. Previous bottoms formed in the zone between MVRV = 0.8 and MVRV = 1.1. This currently corresponds to prices between $45,000 and $60,000.
These are the declines from the top corresponding to those price targets:
- $45,000 is a 64% decline
- $57,000 is a 55% decline
- $60,000 is a 52% decline
This fits our scenario 3: a mild bear market. In terms of valuation relative to cost basis, it's as deep as previous bear markets, but looking at the decline from the top, considerably shallower.
A time target for this bear market
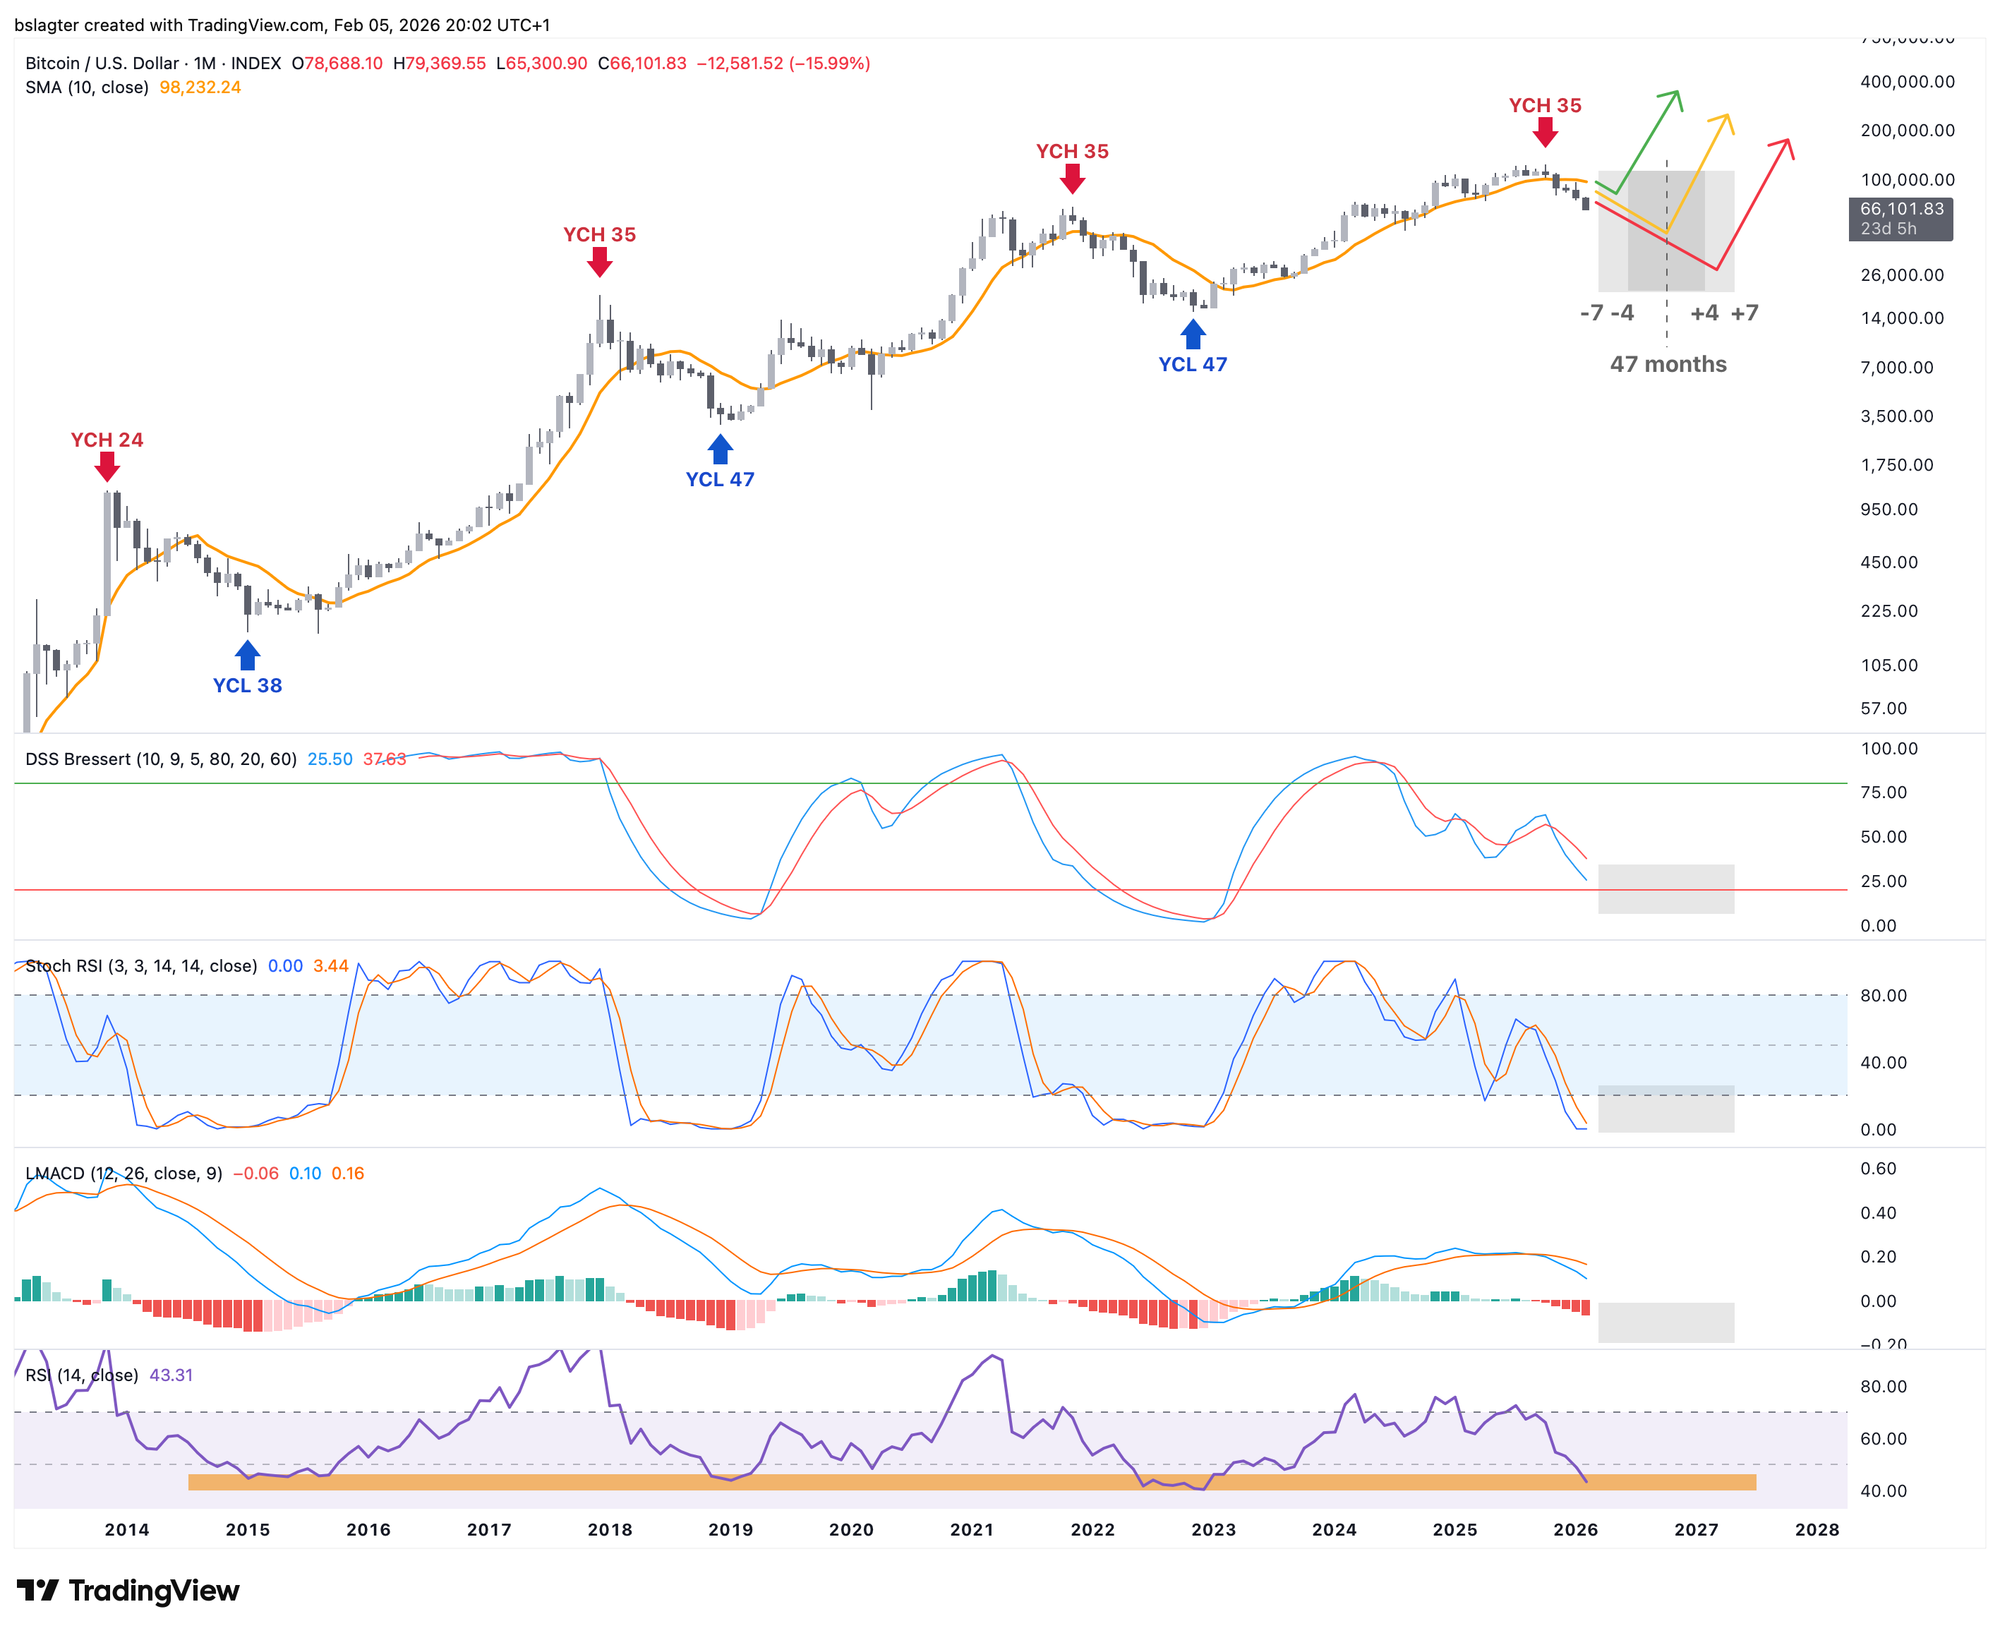
Let's look at where we stand through the lens of cycle analysis. We'll start with the yearly cycle. We draw this on the monthly chart, with the 10-month moving average as the dividing line between the rising and falling portions of the market cycle.
On Sunday, we got the January candle added to this chart. The oscillators have taken a step down. The Stochastic RSI is already flat at the bottom. The RSI is at the level where we also found the bottom in previous bear markets.
Assuming an average length of 47 months, a spread of -15% to +15% yields a time window of March 2026 to May 2027 for the yearly cycle low (YCL), the bottom of the bear market.
We're only in week 11 of the weekly cycle, which averages around 26 weeks. Over the past two years, it was actually 31 weeks a few times. Either way, it's still too early for a normal weekly cycle low.
It's likely that this fierce decline will pause soon. A few months sideways or a relief rally. And then the decline to the bottom of this weekly cycle. In scenario 3, this is probably also the bottom of the bear market.
1️⃣ All high-risk investments are under fire
Bert
A narrative has emerged that all investments are doing well except bitcoin (and by extension, the rest of the crypto market). That there are specific reasons why bitcoin is facing headwinds now, such as:
- The crash of October 10
- Quantum computing risks
- The end of the four-year cycle
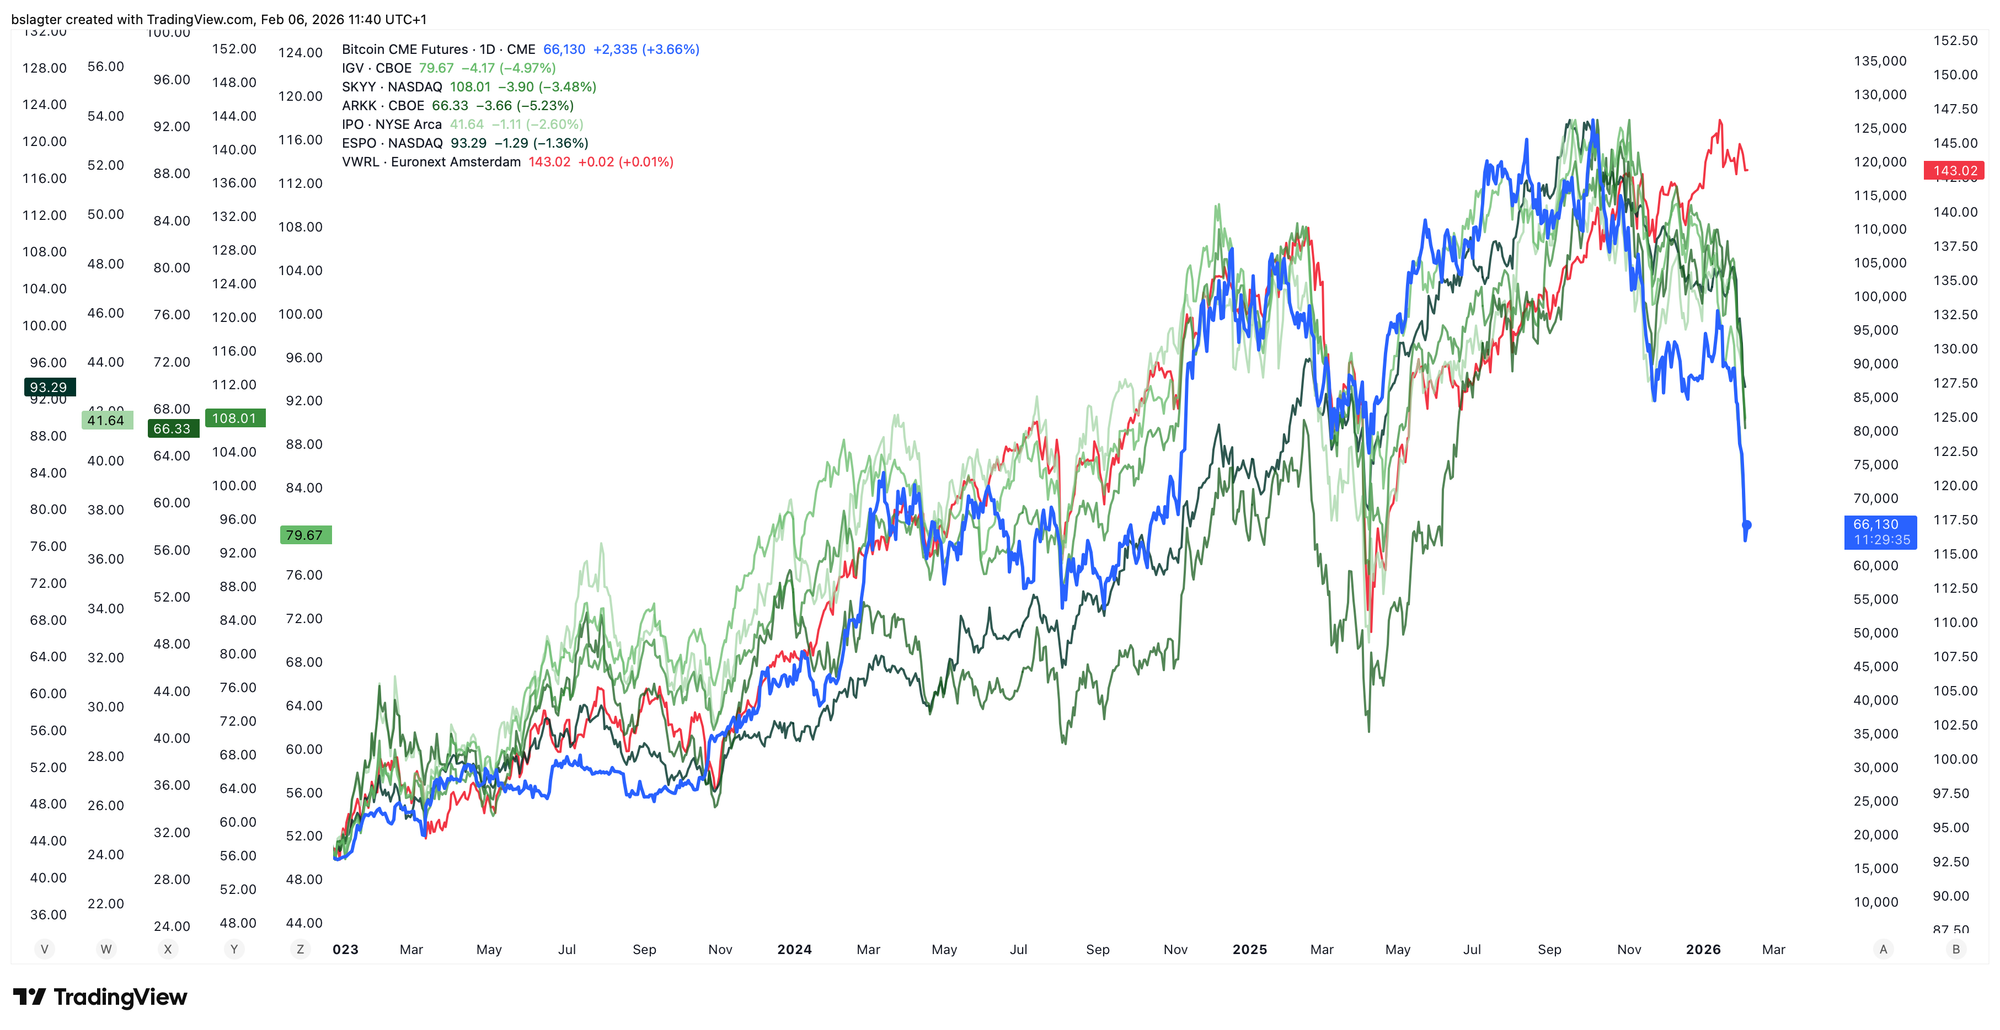
But many more high-risk investments peaked in October and have been in a downtrend since. In the chart below, I've compared five ETFs with bitcoin.
- IGV: Tech-Software Sector ETF with Microsoft, Palantir, Oracle, and Salesforce as largest holdings.
- IPO: ETF with recent IPOs, such as CoreWeave, Kenvue, Reddit, Astera Labs.
- ARKK: The largest ARK Invest ETF with Tesla, CRISPR, Roku, and Tempus AI.
- ESPO: Video gaming & eSports ETF with Tencent, Nintendo, Netease, and Electronic Arts.
- SKYY: Cloud Computing ETF with Arista, Alphabet, and Amazon.
These five ETFs have a green line. Bitcoin is blue. And in red, I've added a broad world index. The S&P 500 roughly follows the red line's trajectory.
What stands out about these five ETFs?
All five peaked somewhere in October.
All five are in a downtrend.
Even yesterday's bitcoin crash shows up in the ETFs!
None of these five are affected by the October 10 crash.
None of these five have quantum computing stories.
None of these five have investors thinking about the four-year cycle.
In short: bitcoin is affected by more than just idiosyncratic forces; there's also a general risk-off move in the market that's invisible in the major indexes.
2️⃣ Accepting losses to limit the damage
Sam
Emotions are an important part of financial markets. Especially in the volatile world of crypto, there are high peaks of euphoria and deep valleys of panic and doubt.
Research has shown that a loss feels 2 to 2.5 times as strong as a gain of the same size. This is called loss aversion and stems from evolution. To survive, preventing loss—for example, being killed by a predator—was more important than acquiring some extra food.
That's why selling while your purchase is still underwater often feels extra unpleasant. On one hand, you have the often-used saying in the investment world "it's only a loss if you sell," but on the other hand, there can also be FOMO. You're not exactly keen to sell at a loss only to watch the price explode upward afterward.
Yet arguments should weigh heavier than emotion. You sell because your stop-loss was hit. Or because before buying, you had accepted losing a maximum of 10% of your investment.
Making a plan without emotions involved is very important, but even more important is following the plan. Otherwise, losses can be much larger than what you were actually willing to lose. In the most extreme case, there's even the risk of going bust. The risk of ruin.
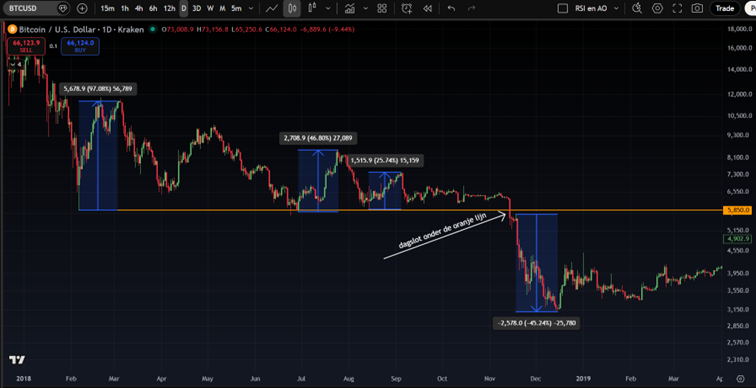
The image below shows bitcoin during the 2018 bear market. Every time the price reached the orange line, it subsequently rose. This happened multiple times over a period of nearly a year, with the narrative growing louder each time that this was the bear market's bottom price. The moment we got a strong daily close below it, this narrative was probably wrong, and taking a small loss would have been the right choice.
If you hadn't accepted that small loss, you were punished within days with an additional 45% decline. Looking back at the price from then, it doesn't feel that bad, but at the time, bitcoin's role was still limited, and it felt far from certain that the price would ever return to high levels.
In closing
All previous editions of Alpha Markets can be read in the archive. Questions, comments, and suggestions are welcome in the community.
Thank you for reading!
To stay informed about the latest market developments and insights, follow our team members on X:
- Bart Mol (@Bart_Mol)
- Peter Slagter (@pesla)
- Bert Slagter (@bslagter)
- Mike Lelieveld (@mlelieveld)
We appreciate your continued support and look forward to bringing you more comprehensive analysis in our next edition.
Until then!