Bulls Rise from the Valley
Bitcoin tested the $112k barrier and then burst above $116k—bulls seem to be making their move. As ETH eyes $4k and altcoins stir, could this be the tipping point for a new market phase? Meanwhile, Fed hints and stagflation fears add even more fuel to the crypto fire.

We held our breath last weekend. It was only natural that Bitcoin would test the area around $112,000. This level marked the previous all-time high, the neckline of a significant head-and-shoulders pattern, and the 50-day moving average. Even so, if it actually happens, it remains a bit nerve-wracking.
On Saturday, August 2, the price on Coinbase reached exactly $112,000. On many other exchanges, the price stalled just above that level. The following day, there was another attempt, and Bitcoin closed trading at $111,900. Later that same day, the price surged again, ending the week above $114k.
In recent days, the price has fluctuated between $112,600 and $115,700. The bears have defended the top, ideally hoping for consolidation within the $108k–$112k range.
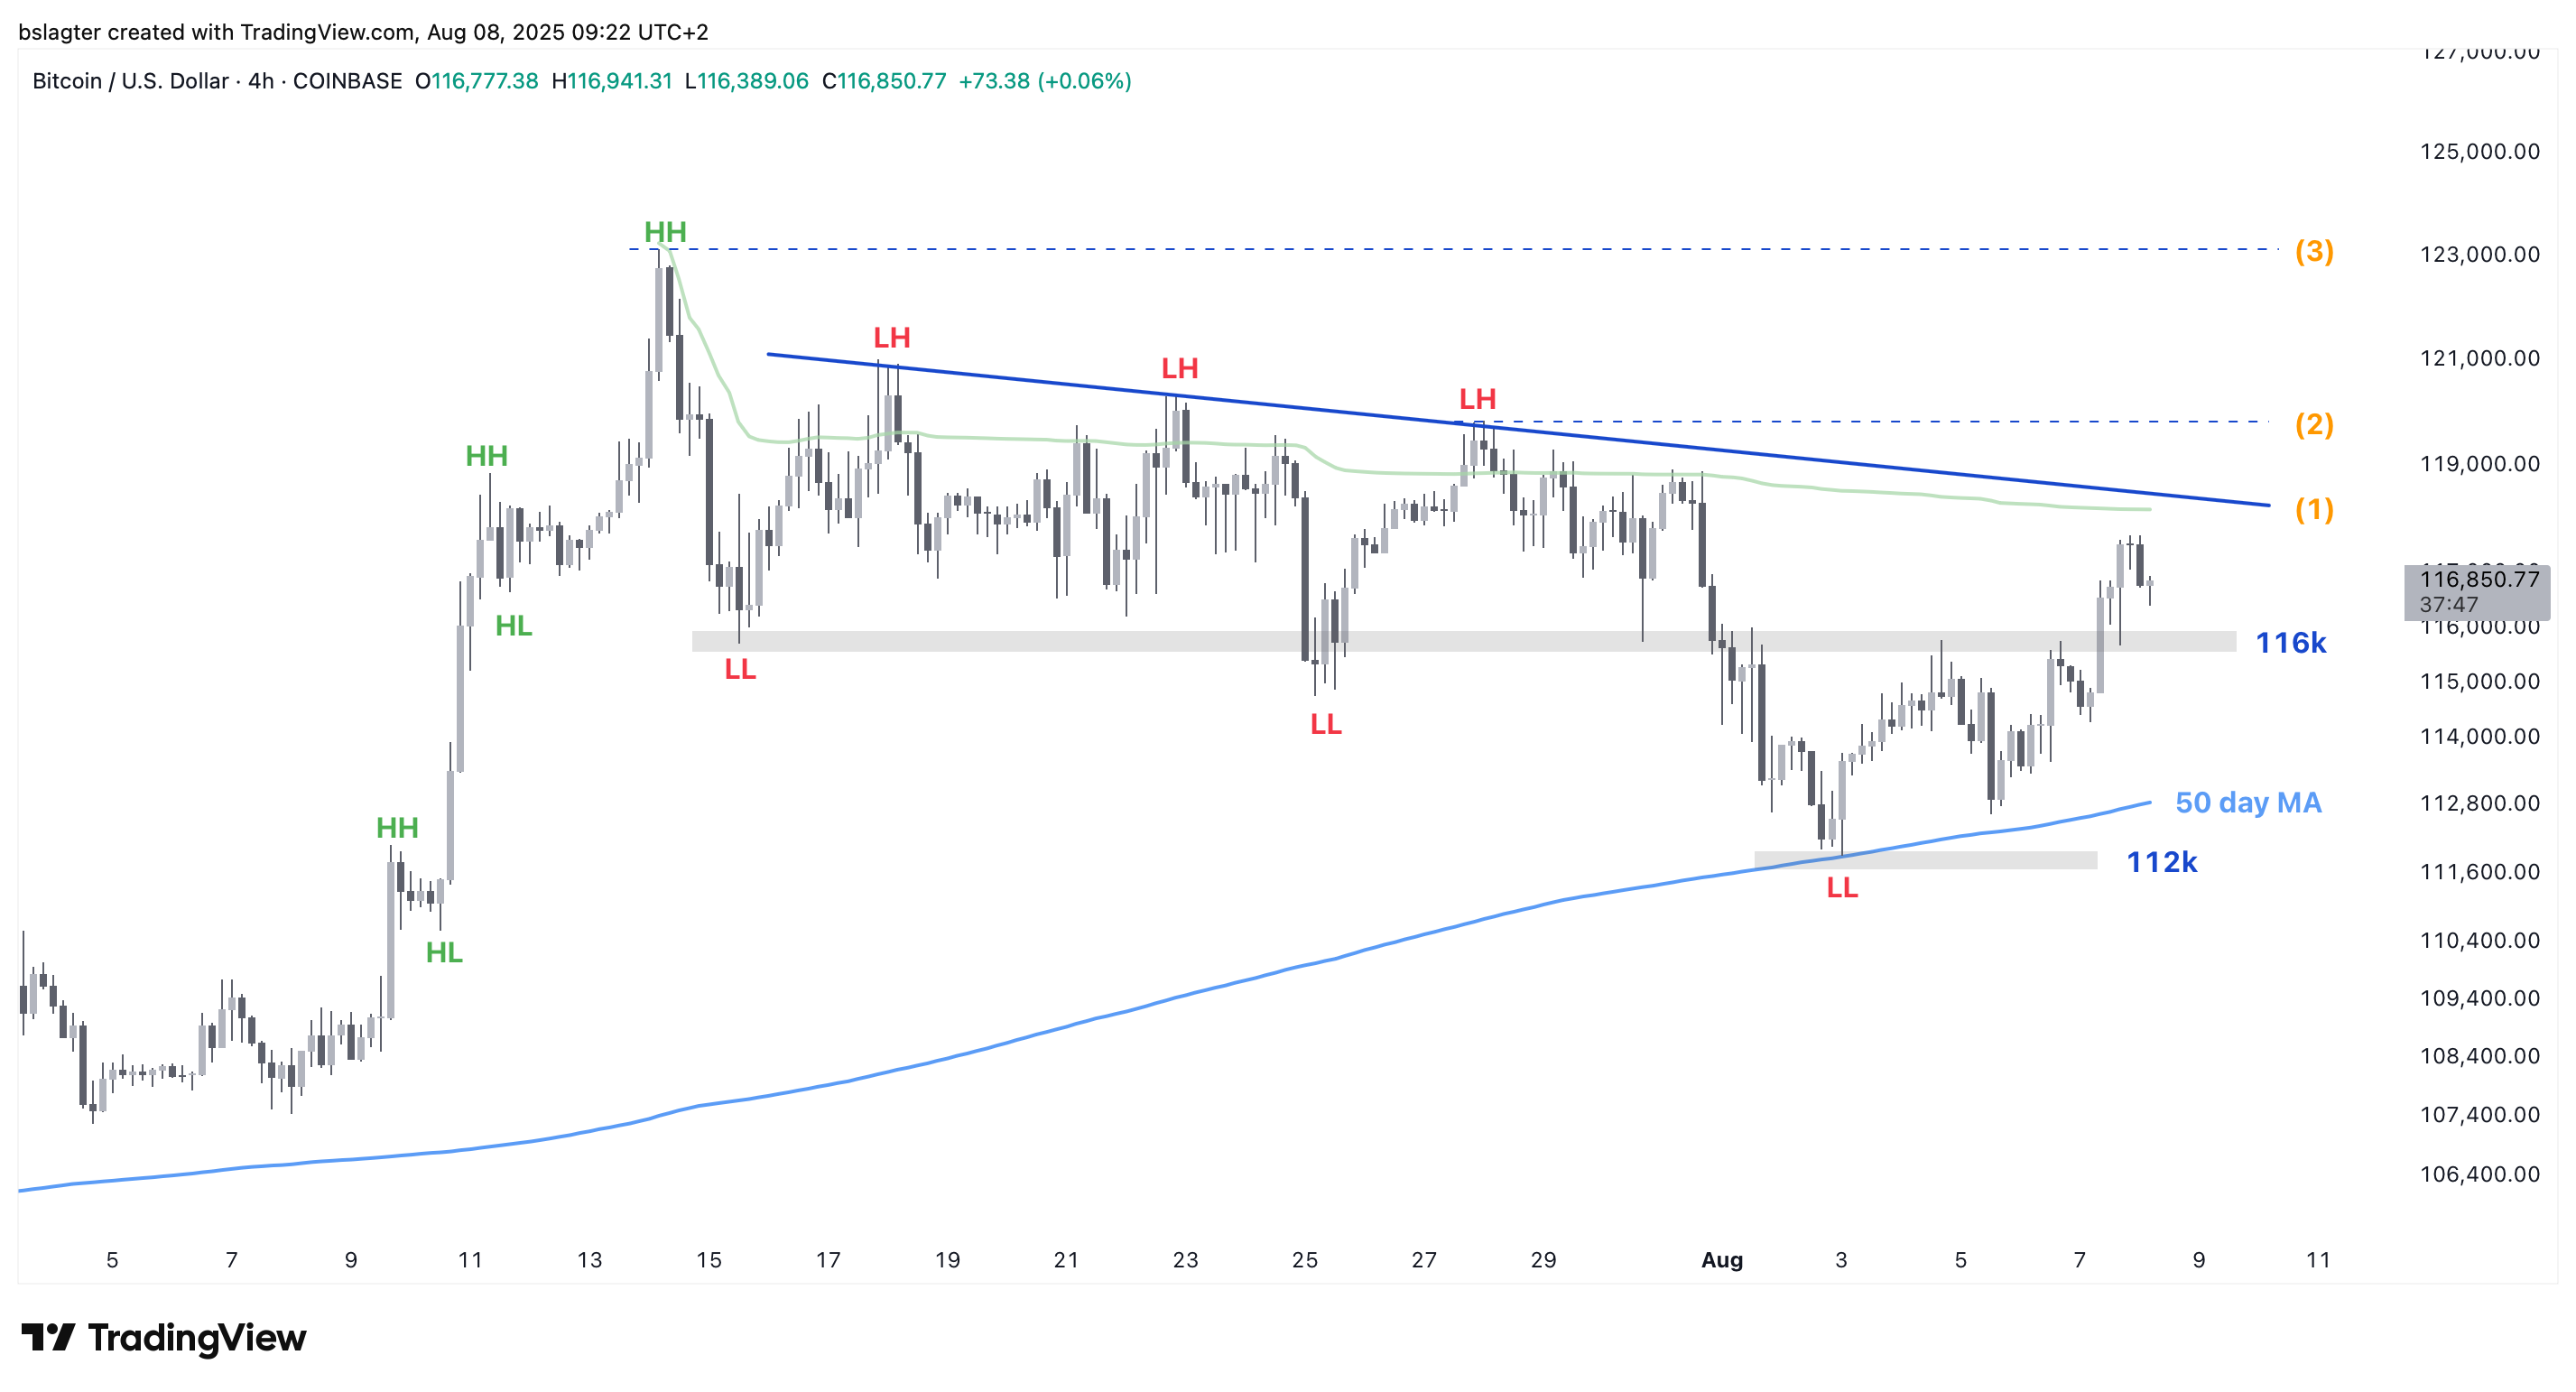
This afternoon the bears could no longer hold the pressure down. The price jumped above $116,000. For the bulls, this is a significant step toward emerging from the downturn. The remaining route upward is as follows:
- The descending trendline and the volume-weighted average from the top are at $118,000.
- At $119,700 we see the first higher high (HH) following a series of lower highs (LH).
- The all-time high is at $123,000.
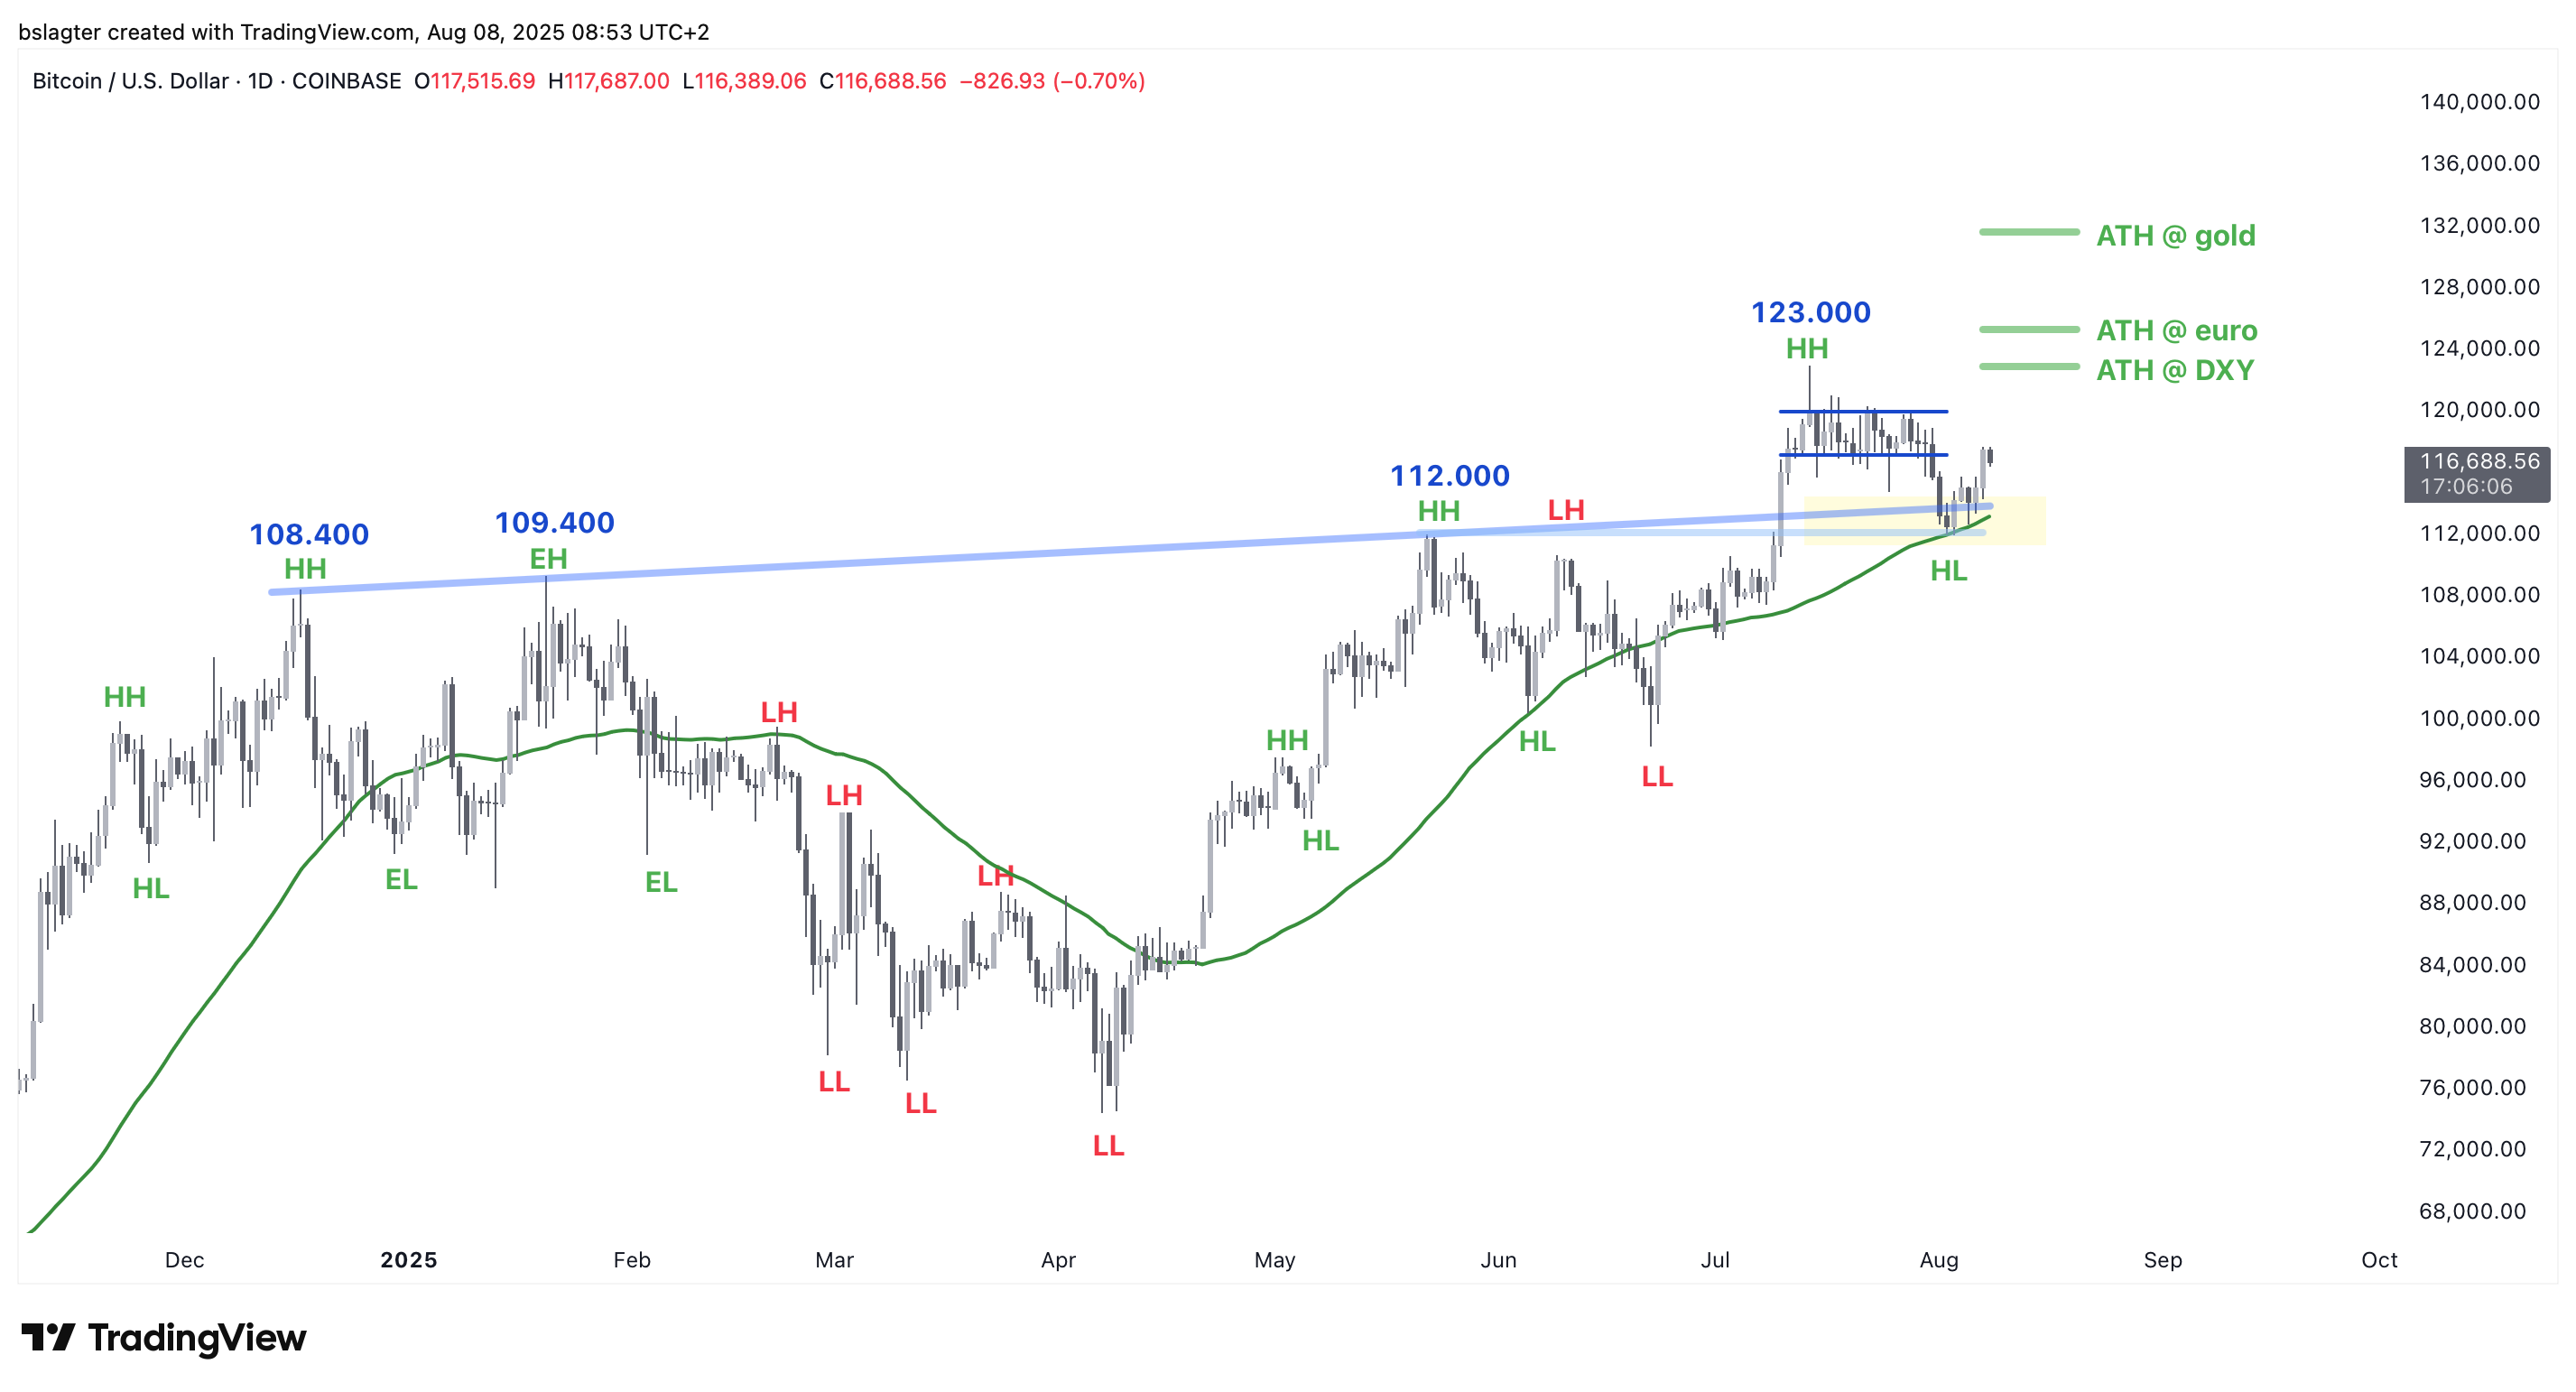
The bulls haven’t secured victory yet, but the outlook is promising. The chart below spans the past nine months, clearly highlighting the importance of the $112,000 zone.
Everyone is watching closely as the bulls have drawn the line right at that level. It’s hard to look at this chart without noticing a “breakout, retest & rebound.” With such a setup, it wouldn’t be surprising if investors confidently stepped in above $120,000, anticipating another upward phase.
Ideally, we’d see a rise to well over $132,000, so that Bitcoin not only sets a record against the weak dollar but also when measured in euros, Swiss francs, and gold. Only then will we have truly surpassed the significant $100k threshold.
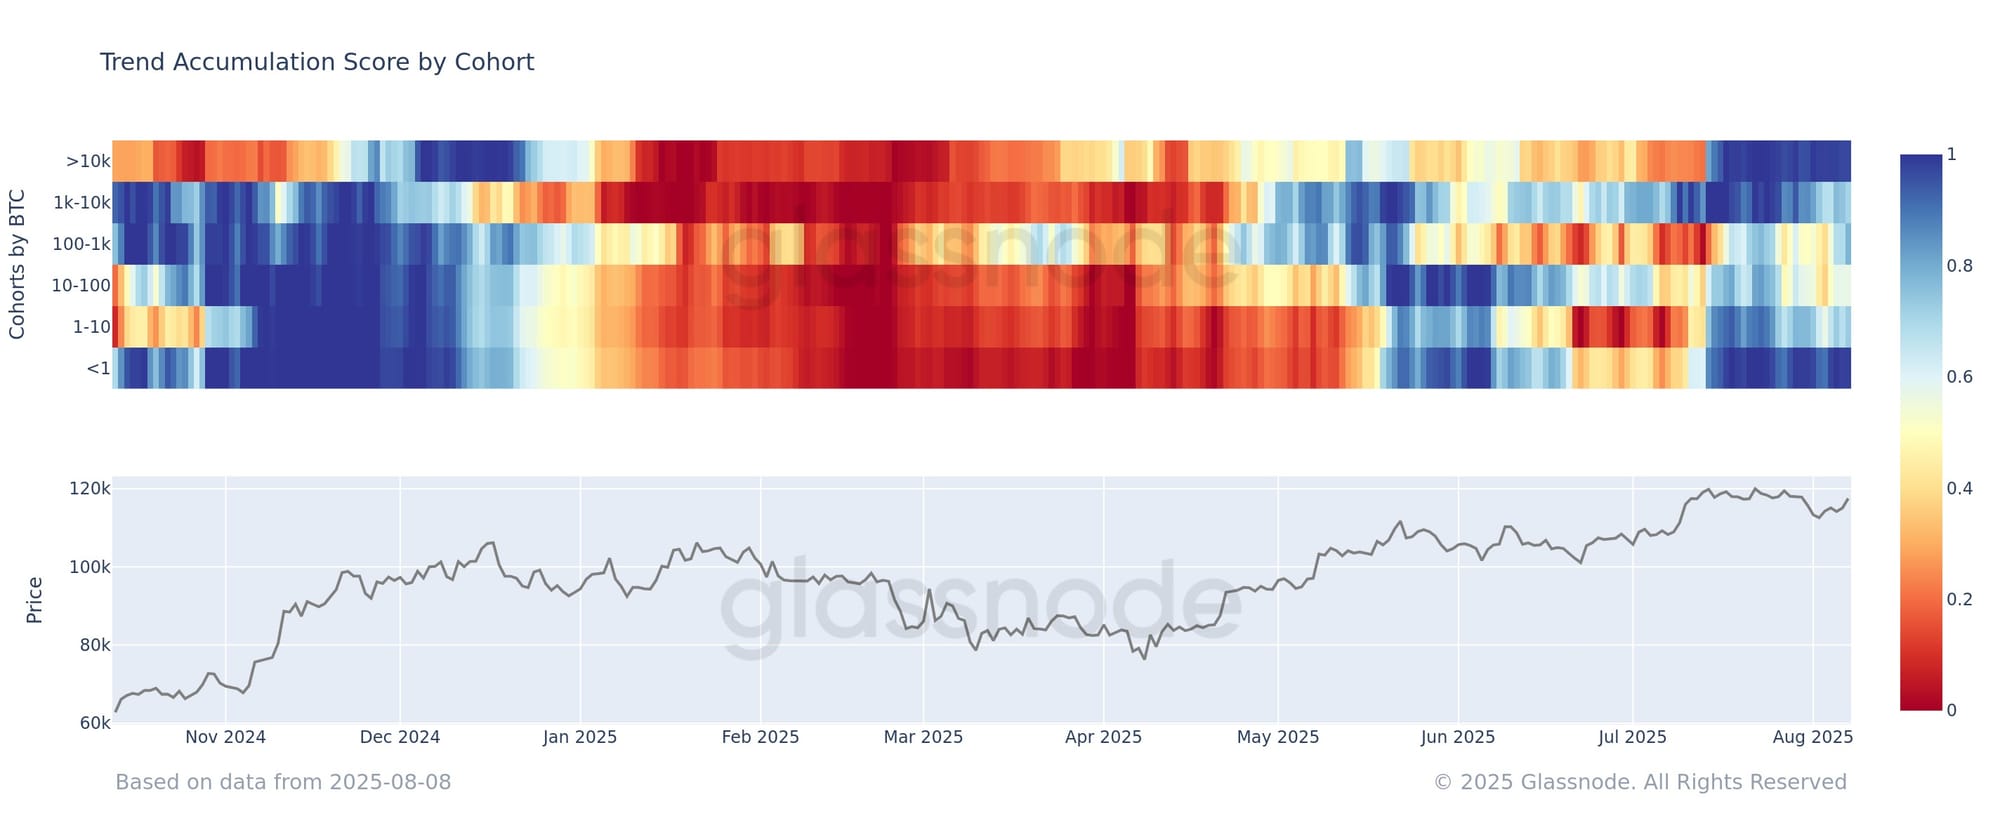
The drop to $112,000 hardly rattled existing investors. The heatmap below shows that they made only minimal exits from the accumulation phase. “This suggests initial dip-buying during the recent correction”, Glassnode captions on X.
For an in-depth explanation of the colors and cohorts, check out this YouTube video.
Additional on-chain data confirms the same story. There was some uncertainty and unrest, but no panic or capitulation. Investors were generally unwilling to sell at a loss, as evident from metrics such as SOPR and realized loss.
The observed on-chain behavior of investors suggests they remain confident and expect higher prices soon. A useful rule of thumb is that the price must rise 20% above the STH-RP to trigger additional supply. At that point, short-term holders would be sufficiently in profit to realize some gains. That level is now at $127,000.
We continue with the following topics for our Alpha Plus members:
- A new daily cycle
- Ether battling with $4,000
- Bitcoin season or altcoin season?
- Chris Waller succeeding Jerome Powell?
- Rising fears of stagflation – is it justified?
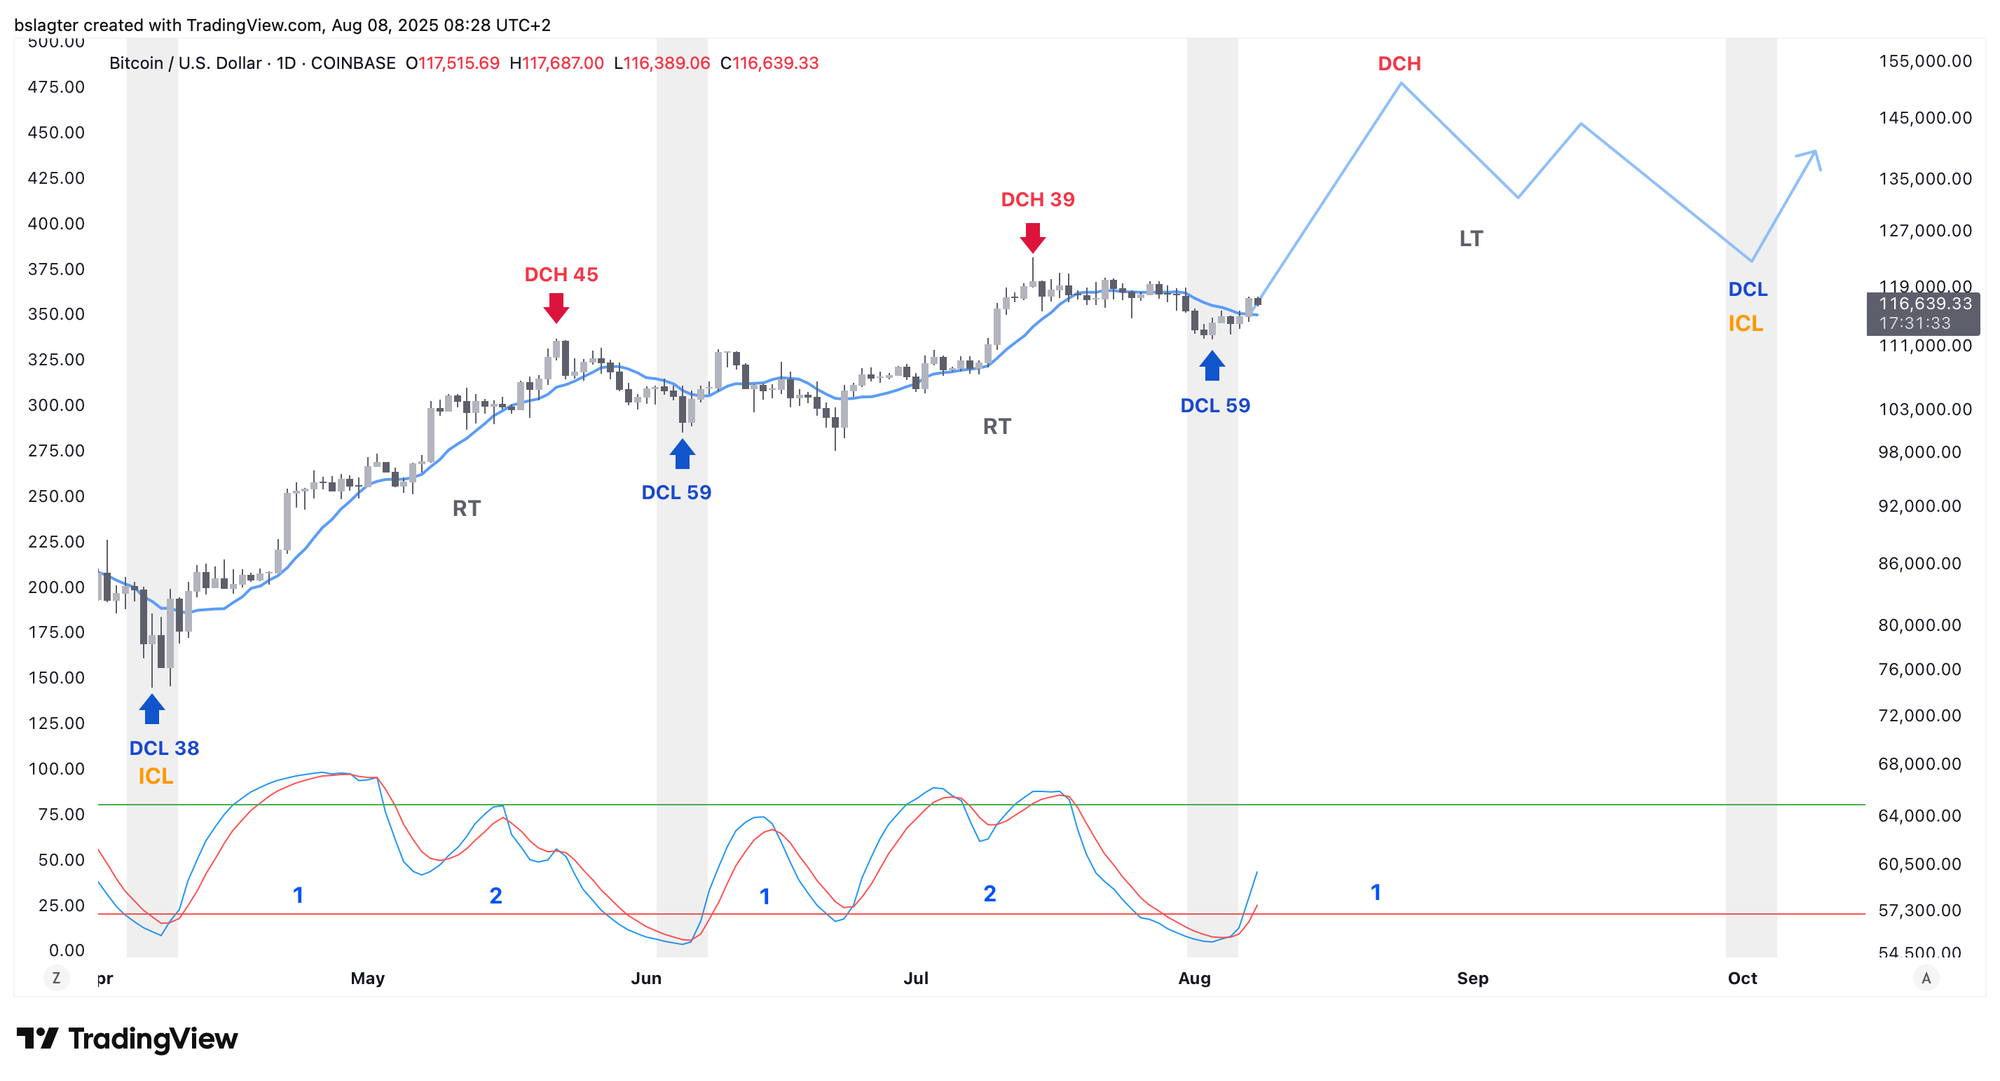
1️⃣ A new daily cycle
Last night, we saw the first daily close above the 10-day moving average since the bottom at $112k. This is an important indication that August 3 was indeed the daily cycle low (DCL) and that we have now entered a new daily cycle.
We are now in the third daily cycle of this weekly cycle. In this bull market phase, it’s likely that this daily cycle will peak higher than the previous cycle’s $123k. However, we shouldn’t be too surprised if that top comes early within the roughly 60 days that a daily cycle typically lasts. That still leaves plenty of time for the price to drop to a weekly cycle low, possibly in early October.
The fourth quarter will then begin with a new weekly cycle, and we have every reason to expect a strong start. From both a macroeconomic perspective and within the crypto market, it appears that the wind is at our back.
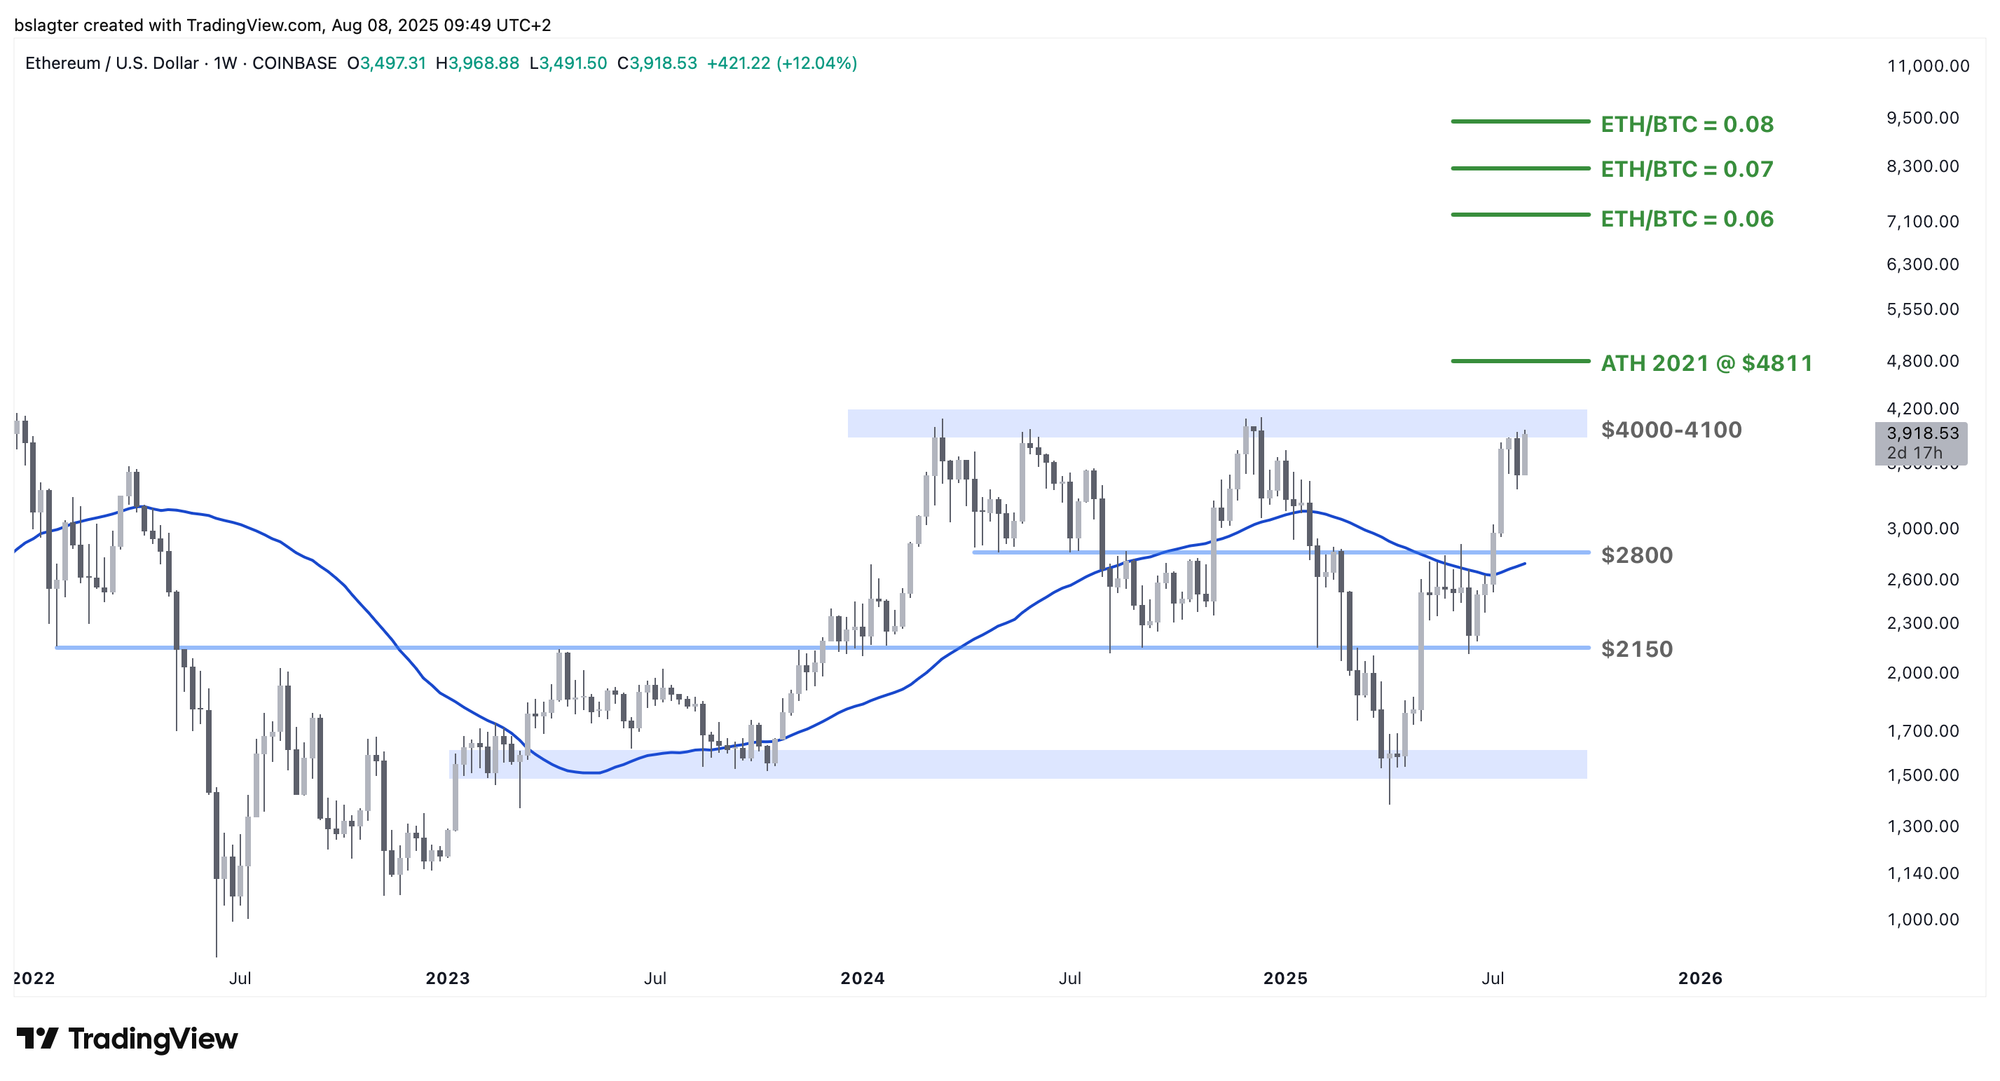
2️⃣ Ether battling with $4,000
Alongside Bitcoin, Ether experienced a brief correction last week. The price dropped 15% from $3,940 to $3,350—a modest decline considering the massive rise that preceded it. On April 9, the price was still at $1,400.
It comes as no surprise that ETH would reach $4,000. The coin has hit that mark three times in the past year and a half. The big question now is how much resistance it will face.
One downside for ETH is that during this bull market it hasn’t yet provided long-term investors with a solid exit. Bitcoin set a new record in March 2024 and confirmed the $100k level over the past six months, while Ether still has that milestone ahead.
A plus for ETH is the significant capital inflow into Ether ETFs and ETH treasury companies. When compared to its total market capitalization, it involves far more money than Bitcoin.
We’re very curious to see how these forces will balance out.
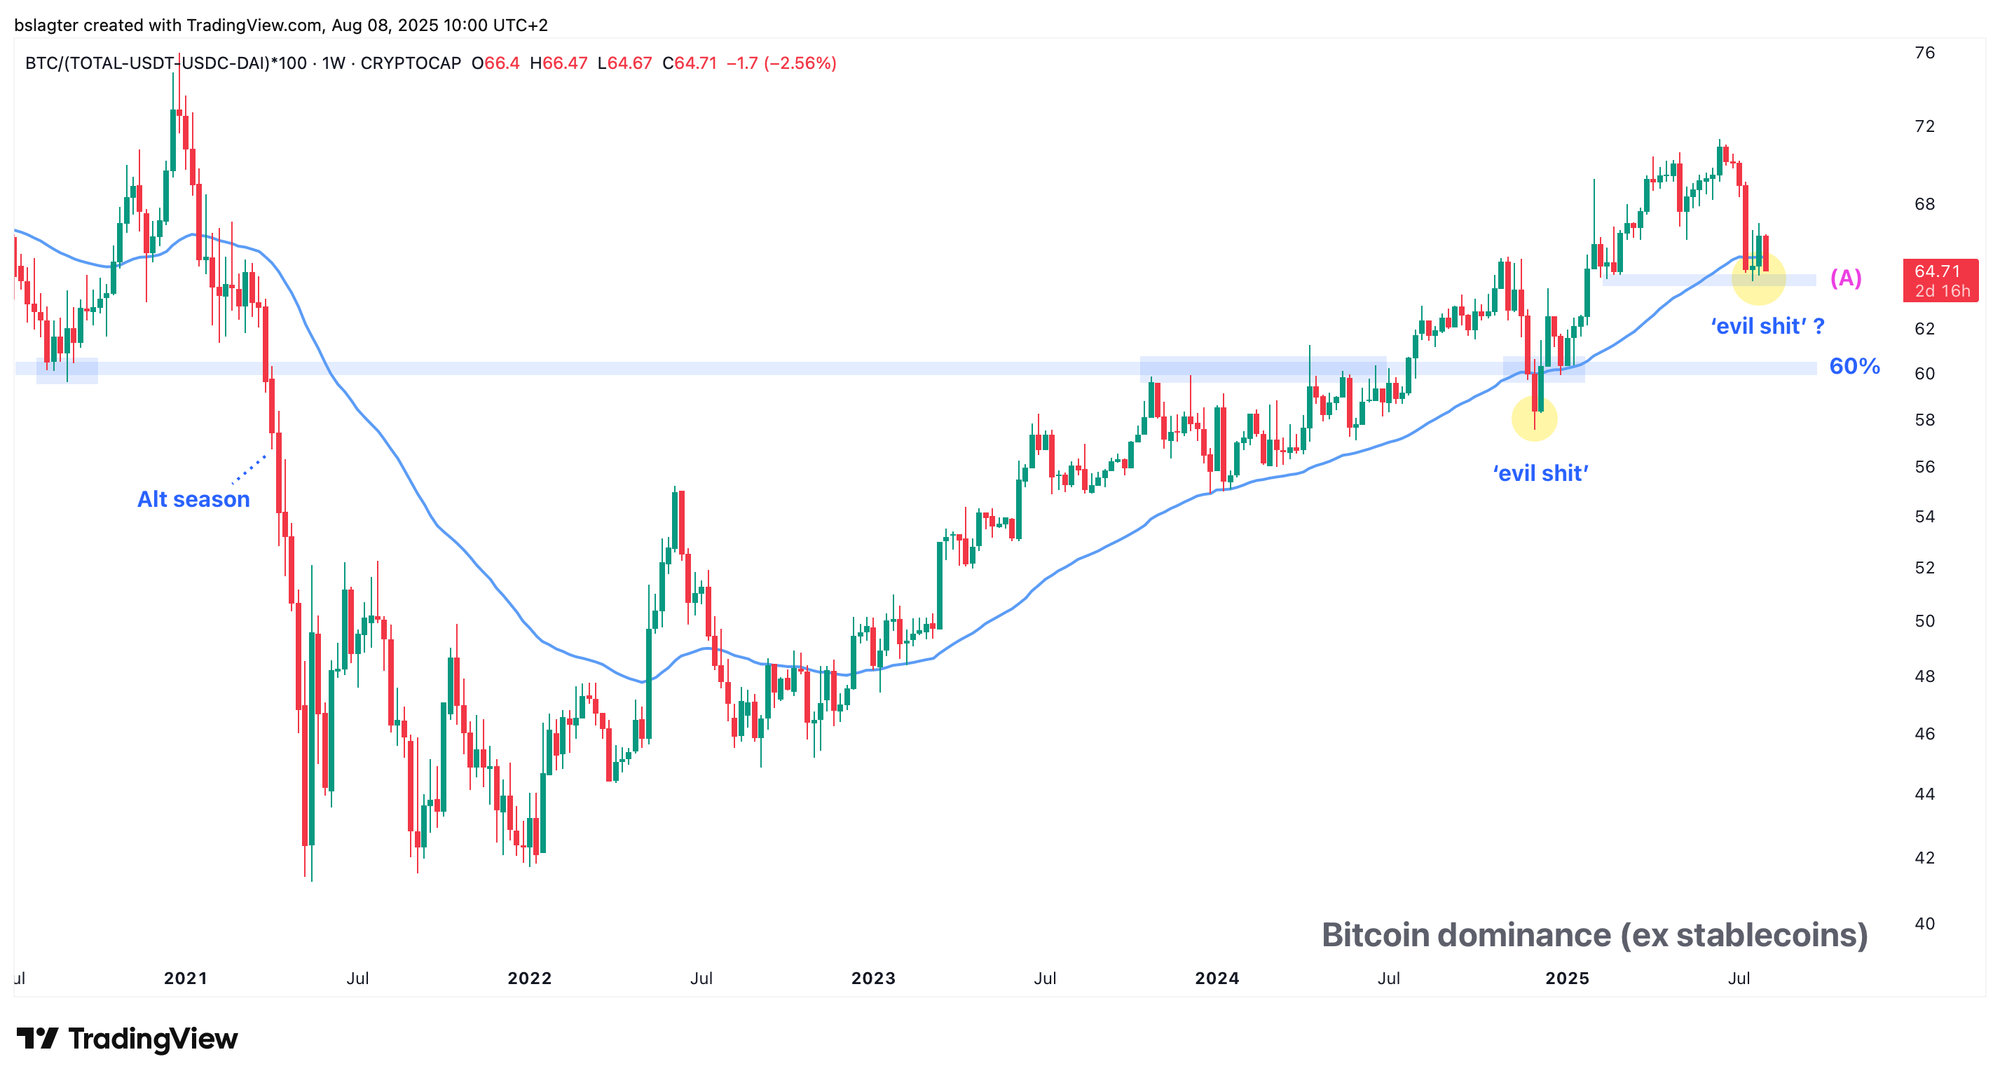
3️⃣ Bitcoin season or altcoin season?
Over the past two weeks, ETH not only held strong during the downturn but also quickly revved up for the rise. This is reflected in a declining Bitcoin dominance.
The past three years have been “Bitcoin season.” Bitcoin’s market share kept rising. Most altcoins are still well below the peaks reached during the 2021 bull market, while Bitcoin sits roughly 50% above those levels.
In the Alpha Markets update from July 18, we discussed the possibility of shifting from “BTC season” to “alt season.”
It would be a significant signal if Bitcoin dominance reversed from an upward to a downward trend. In November 2024, it seemed that might happen, but it turned out to be only temporary before the upward trend resumed. Now, we find ourselves at a similar crossroads.
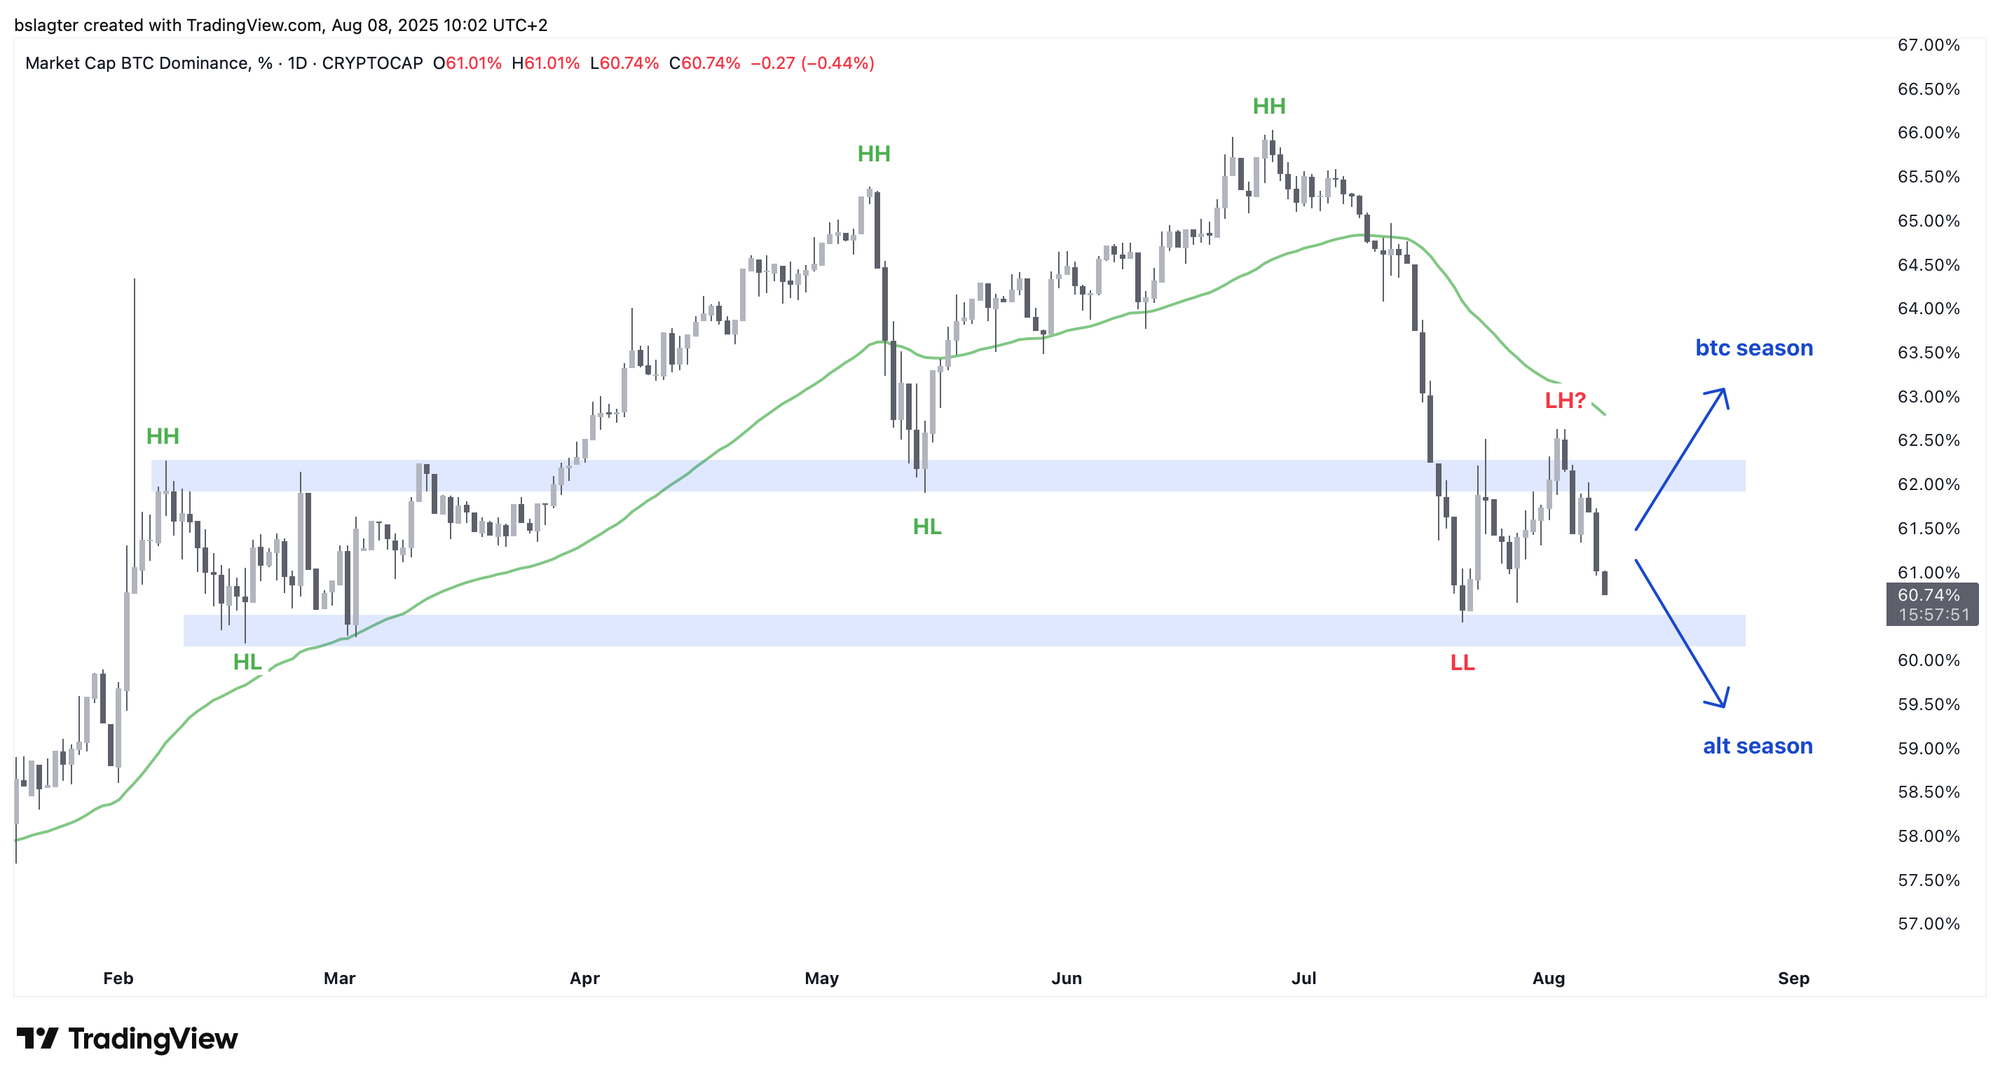
The chart below takes a closer look. Did we see a lower high (LH) at the beginning of August, and are we now on track for a lower low (LL)?
This brings us back to ETH’s strength. Much of the recent drop in Bitcoin dominance can be attributed to ETH, while most altcoins have yet to show a significant recovery.
It makes sense, then, to consider an “alt season index,” such as that from CoinMarketCap. This index indicates the proportion of altcoins that have outperformed Bitcoin over the past 90 days. If Bitcoin dominance declines while the alt season index remains low, it suggests that the gains are concentrated among a select few (major) altcoins.
An acceptance of Bitcoin dominance below 60% coupled with an alt season index rise to over 75% signals that we are indeed entering a phase where a significant portion of altcoins are rising faster than Bitcoin.
4️⃣ Chris Waller succeeding Jerome Powell?
On Thursday, it was announced that Christopher Waller is the favored candidate to replace Jerome Powell as chairman of the U.S. Federal Reserve. The timing is perfect for the Trump administration to release this information now.
The market is worried about the economy, and calls for interest rate cuts are growing louder. Waller is openly distancing himself from the rest of the Federal Reserve, and as early as July he signaled his willingness to implement a rate cut.
Just as doubts about the health of the economy start to surface, the Trump administration is signaling that the desired rate cuts will indeed come.
You might wonder if, with Waller at the helm, the U.S. Federal Reserve will remain entirely impartial. It probably won’t be the same, or at least not as much as before.
For investors, this isn’t a catastrophe given Donald Trump’s agenda. He wants to stimulate the economy as much as possible. With Waller as chairman, that objective will likely be met.
The most optimistic long-term scenarios for Bitcoin now seem more attainable. This, however, is particularly disadvantageous for the less affluent segments of society, as Trump’s policies will almost certainly lead to structurally higher inflation.

5️⃣ Rising fears of stagflation – is it justified?
The U.S. economy is sending mixed signals. From certain perspectives, economic growth appears to be under pressure while inflation continues to rise. As a result, investors increasingly view stagflation—a combination of sluggish growth and high inflation—as a realistic scenario.
This is evident from the following developments in recent weeks:
Inflation and prices
- PCE Price Index (June): +2.6% year-over-year
- Core PCE (excluding food and energy): +2.8%
- Both measures are above the 2% target
- S&P Global “Prices Paid” component for producers (a leading indicator for inflation): a strong increase, while “New Orders” came in at 47.1, indicating declining demand
- ISM Prices Paid index: 64.8, indicating rising input costs
Labor market
- Nonfarm payrolls (July, job growth): significantly below expectations
- Substantial downward revisions for May and June
- Average job growth over the past 3 months: 35,000—the lowest level since the pandemic
- Yet, unemployment remains historically low at 4.2%, with similarly low jobless claims
Economic growth
- S&P Global PMI (a broad indicator of economic health):
- July: 55.1 (the highest in 2025)
- Above 50 indicates expansion
- A streak of 30 consecutive months above 50
- Atlanta Fed GDPNow forecast for Q3 2025: +2.5% growth year-over-year
- Q2 growth was +3.0%, but Q1 was -0.5%, averaging 1.25% for the first half of 2025—clearly slower than in 2023 and 2024
Taken together, these factors unmistakably point to a weakening U.S. economy, though not yet to a critical level. Moreover, the Federal Reserve’s monetary policy remains a “trump card” that can eventually work in favor of the market. In light of all these developments, three 25-basis-point rate cuts are now expected for the remainder of 2025.
If needed, the Federal Reserve could also resume Quantitative Easing, essentially buying U.S. government bonds. This action injects liquidity directly into the financial system, pushing down interest rates and allowing capital in private markets to flow into other assets (a positive sign for Bitcoin).
Furthermore, I consider it very unlikely that Donald Trump will let the economy slip into a recession under his leadership. His recent actions and statements make his intentions clear:
- One Big Beautiful Bill: not cutting spending but stimulating growth.
- The desire to fire Jerome Powell because he wouldn’t cut rates.
- Firing the BLS director due to dissatisfaction with employment figures.
Of course, things can go awry, and it is possible that we might enter a recession, gradually ushering Bitcoin into a bear market. While the weaker economic figures deserve close monitoring, I still consider the likelihood of a negative outcome to be small.
Thank you for reading!
To stay informed about the latest market developments and insights, you can follow our team members on X:
- Bart Mol (@Bart_Mol)
- Peter Slagter (@pesla)
- Bert Slagter (@bslagter)
- Mike Lelieveld (@mlelieveld)
We appreciate your continued support and look forward to bringing you more comprehensive analysis in our next edition.
Until then!