Bull Market Remains Intact: Entering a New Weekly Cycle
Bitcoin rose 14% in April despite sharp dips, keeping the bull market alive. Can we double from $74.5K to $150K amid rising geopolitical risks? Discover the expert insights and market trends steering this rally—and join the conversation at our upcoming meetup!

A new month is the perfect opportunity to step back and view the market from a broader perspective. We rise above the daily noise and observe the longer-term trends, where major moves become clearer—more signal, less noise.
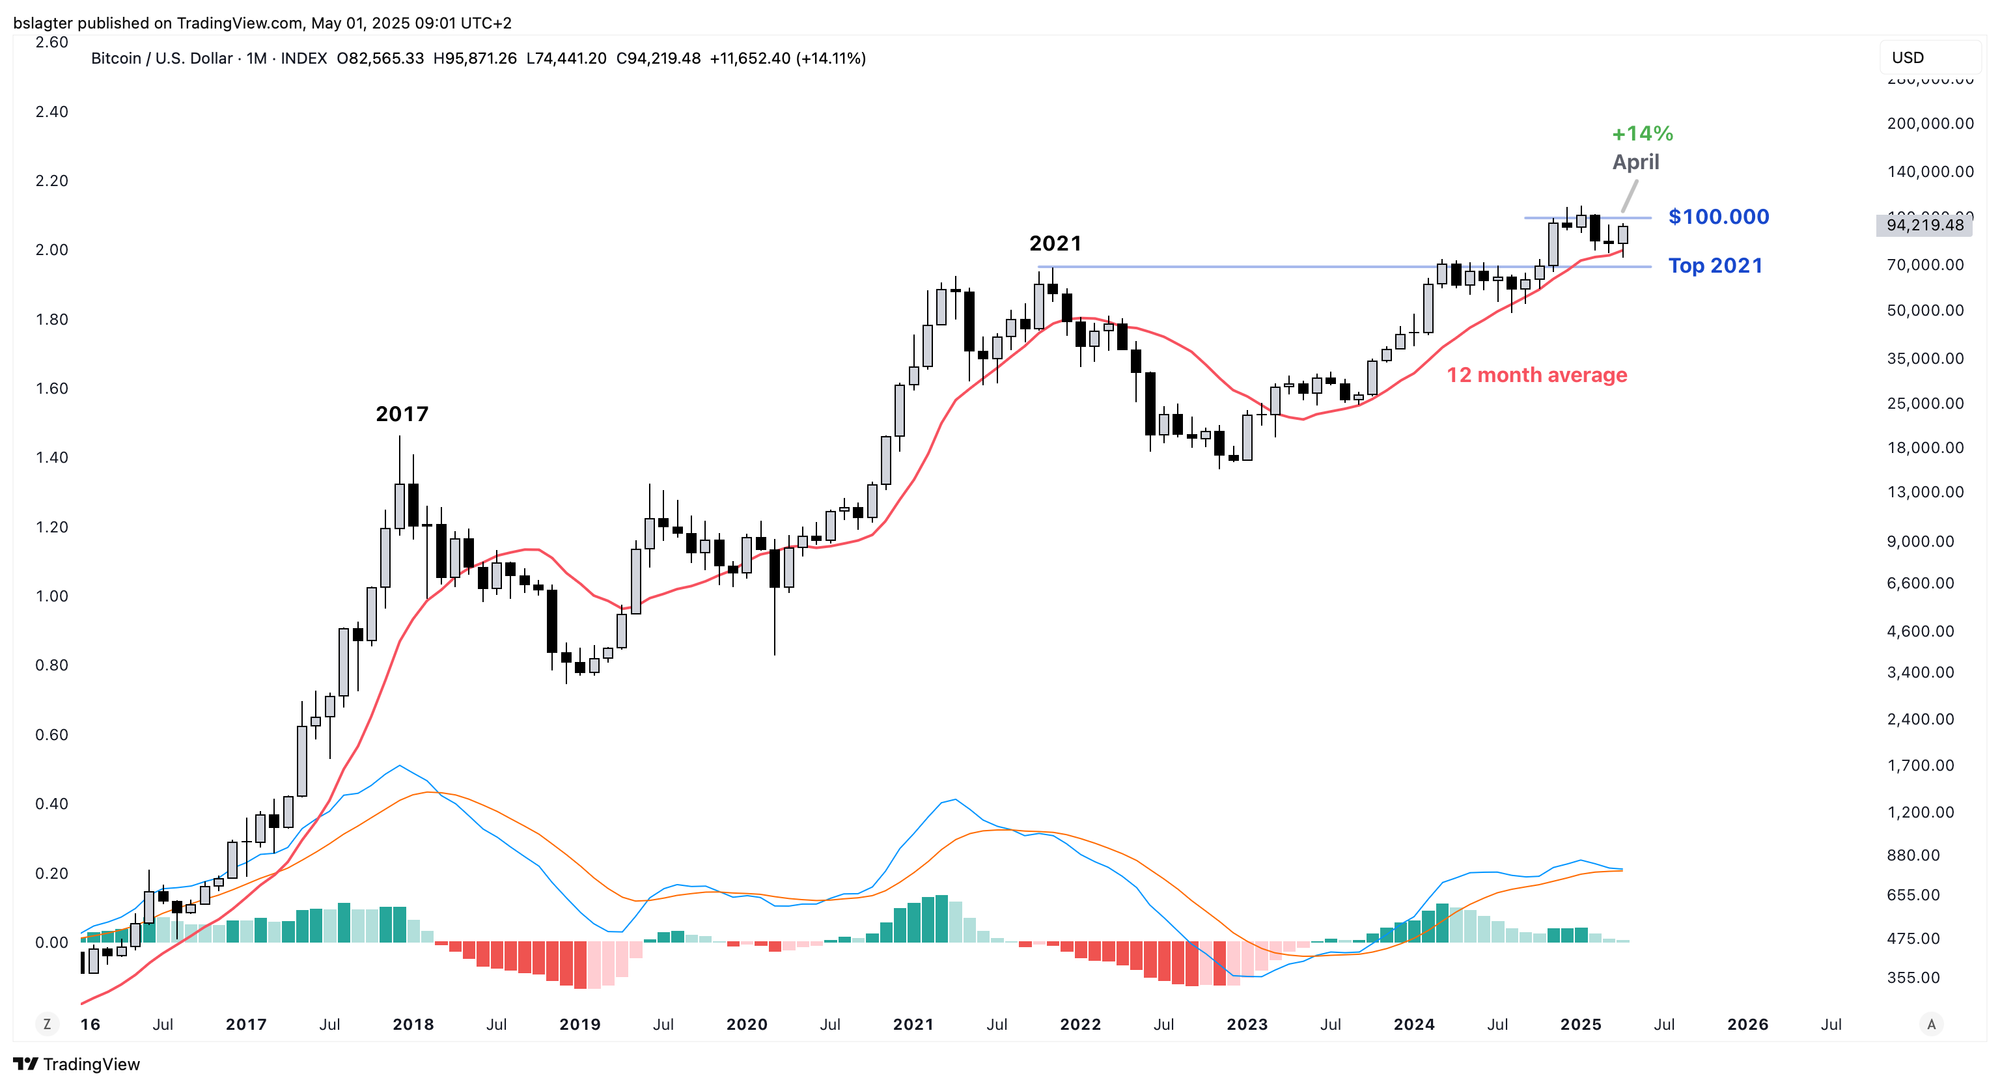
April turned out to be a strong month for bitcoin, with the price rising by 14% to close at $94,000.
This is a solid result, despite the challenges we faced on April 7 and 9. At that time, the price dropped to $74,500—32% below the January 20 peak of $109,500. That level is below the 12‐month average, which on the monthly chart serves as a key indicator of the long-term trend. A monthly close beneath that average would have strongly signaled an end to the bull market.
It ultimately marked the bottom. The short-term trend reversed from downward to upward, while the long-term trend continued its ascent. The bull market remains intact.
The monthly chart below shows that April’s rise was well-timed. Even a slight dip could have dragged us below the dominant average and pushed the MACD momentum indicator into negative territory, forcing us to revise our outlook to a bearish one.
You might view the period from November 2024 through April 2025 as a consolidation phase between the previous bull market’s peak and the $100,000 milestone. In a typical weekly cycle, we would be well above $100K within a couple of months, and on the monthly chart, we would eventually break through that significant barrier.
Our current base scenario is that we are at the start of a new weekly cycle within the upward phase of the yearly trend. We’ll delve into this in more detail later with supporting charts. For now, we assume that both the short-term and long-term trends are rising.
This assumption carries its risks, given the turbulent geopolitical landscape. Trump’s erratic and clumsy policies are generating significant uncertainty in the economy and financial markets, and there are no clear signs of a rapid return to the stability that benefits consumers, entrepreneurs, and investors.
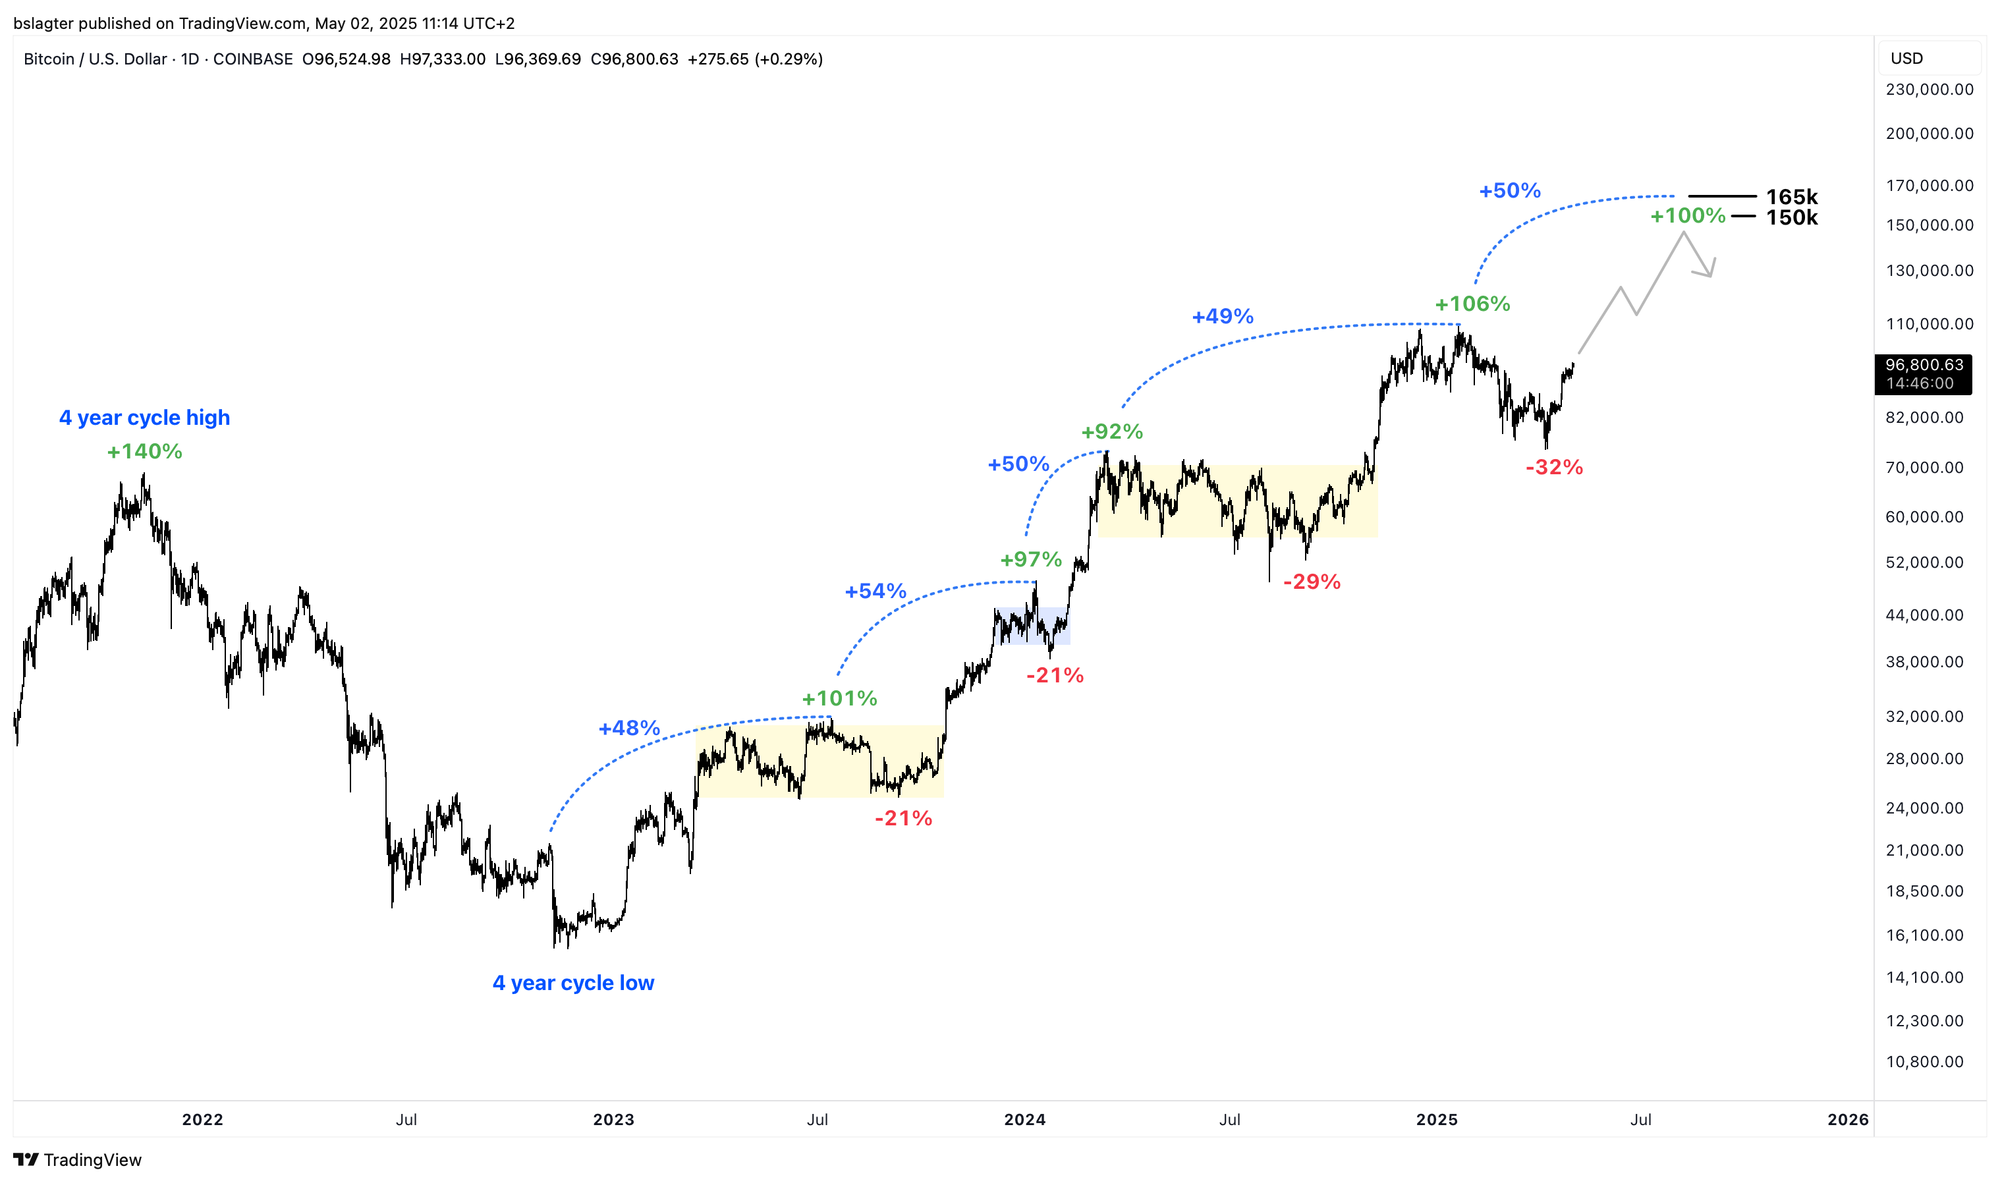
However, the majority of our data indicates that a new period of growth is on the horizon. If this weekly cycle follows the pattern of earlier cycles in this bull market, we can roughly expect prices to double from the $74,500 bottom to around $150,000.
Looking at peak-to-peak increases, we see roughly a 50% gain each time. Starting from the January 20 peak of $109,500, this would bring us to approximately $165,000.
To move from today’s $96K to the $150K–$165K range mentioned above, two factors need to come together.
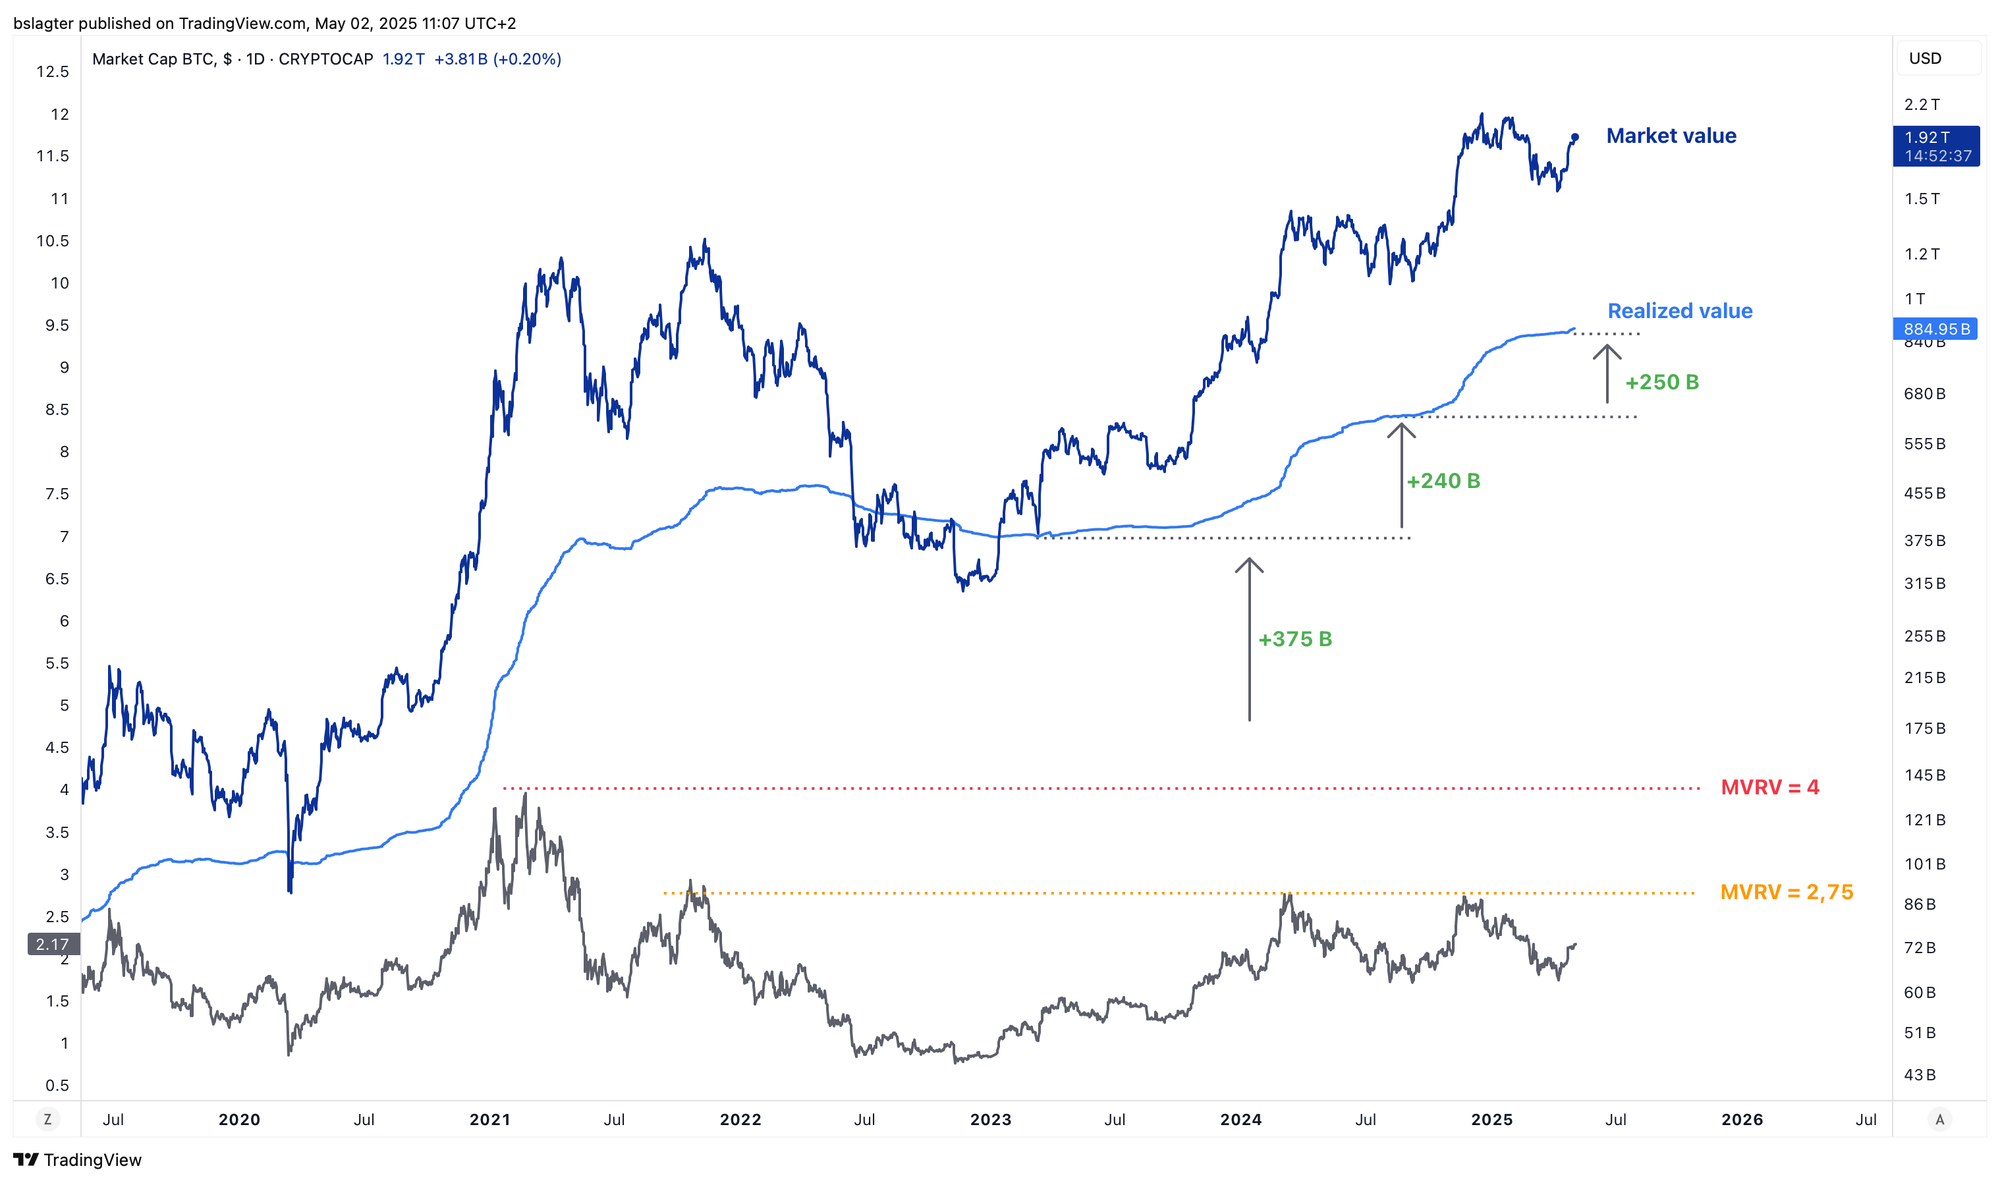
First, a major influx of new capital. Our on-chain data indicates that existing investors realized roughly $250 billion in profits during the previous weekly cycle. Essentially, this is the amount of new capital that had to come in to allow those profits to be taken.
Second, increased confidence in higher prices in the near future, along with a willingness to delay taking profits. This, in turn, pushes up the ratio between market value and realized value (MVRV), meaning that the price rises faster than one would expect solely from the influx of capital.
We consistently observe that both factors tend to occur together during periods of growth. It all boils down to optimism and bullish sentiment.
The chart below shows market value (MV), realized value (RV), and their ratio (MVRV). To hit a target price of $150,000, the market value would need to be around $3 trillion. With an additional $250 billion in new capital, the MVRV would have to rise to about 2.7 to achieve that market value.
If the market experiences the kind of widespread hype and frenzy seen in 2017 and 2021, the MVRV might even top 4. With the same $250 billion influx, that scenario could drive the price up to $225,000, likely resulting in a classic blow-off top formation.
At this point, however, we don’t see strong reasons to expect that scenario. Instead, we anticipate a milder weekly cycle, with less capital inflow and a lower multiple than in previous cycles.
Do you remember how, back in December, we were blown away by $3 billion in new capital entering the bitcoin market every day? Existing investors were taking profits on roughly 30,000 bitcoins per day. That level of enthusiasm still seems far off.
That’s why we remain cautious.
The signals are positive. The bull market is intact, and we’re at the beginning of a new weekly cycle. The data and the chart make us optimistic about the coming months.
However, it is entirely possible that an escalation of the trade war, a severe economic downturn, or other external shocks could upend this outlook.
The dividing lines are clear: a weekly close below the 50-week average (currently at $78,600) or a monthly close below the 12-month average (currently at $80,900) would be strong signs that the bull market is over. Until then, our view remains optimistic.
We now turn to the following topics for our Alpha Plus members:
- A new weekly cycle
- The best contraction ever for the U.S. economy
- Quarterly earnings season starts strong for tech giants
- Update on U.S. stocks
1️⃣ A new weekly cycle
Bert
Cycle analysis attempts to describe the rhythm with which market rises and falls alternate. Every market has its own cadence, but we consistently distinguish between yearly, weekly, and daily cycles.
For bitcoin, the yearly cycle spans roughly four years and encompasses both bull and bear segments.
A yearly cycle is composed of about eight weekly cycles, each lasting around 26 weeks, which represent the short-term trend. In a bull market, several months of robust gains are typically followed by a correction of 20%–30%. Moreover, a weekly cycle usually consists of roughly three daily cycles lasting about 60 days each.
60 days x 3 daily cycles x 8 weekly cycles = 1440 days = 4 years.
You can learn more about this structure in these Markets.
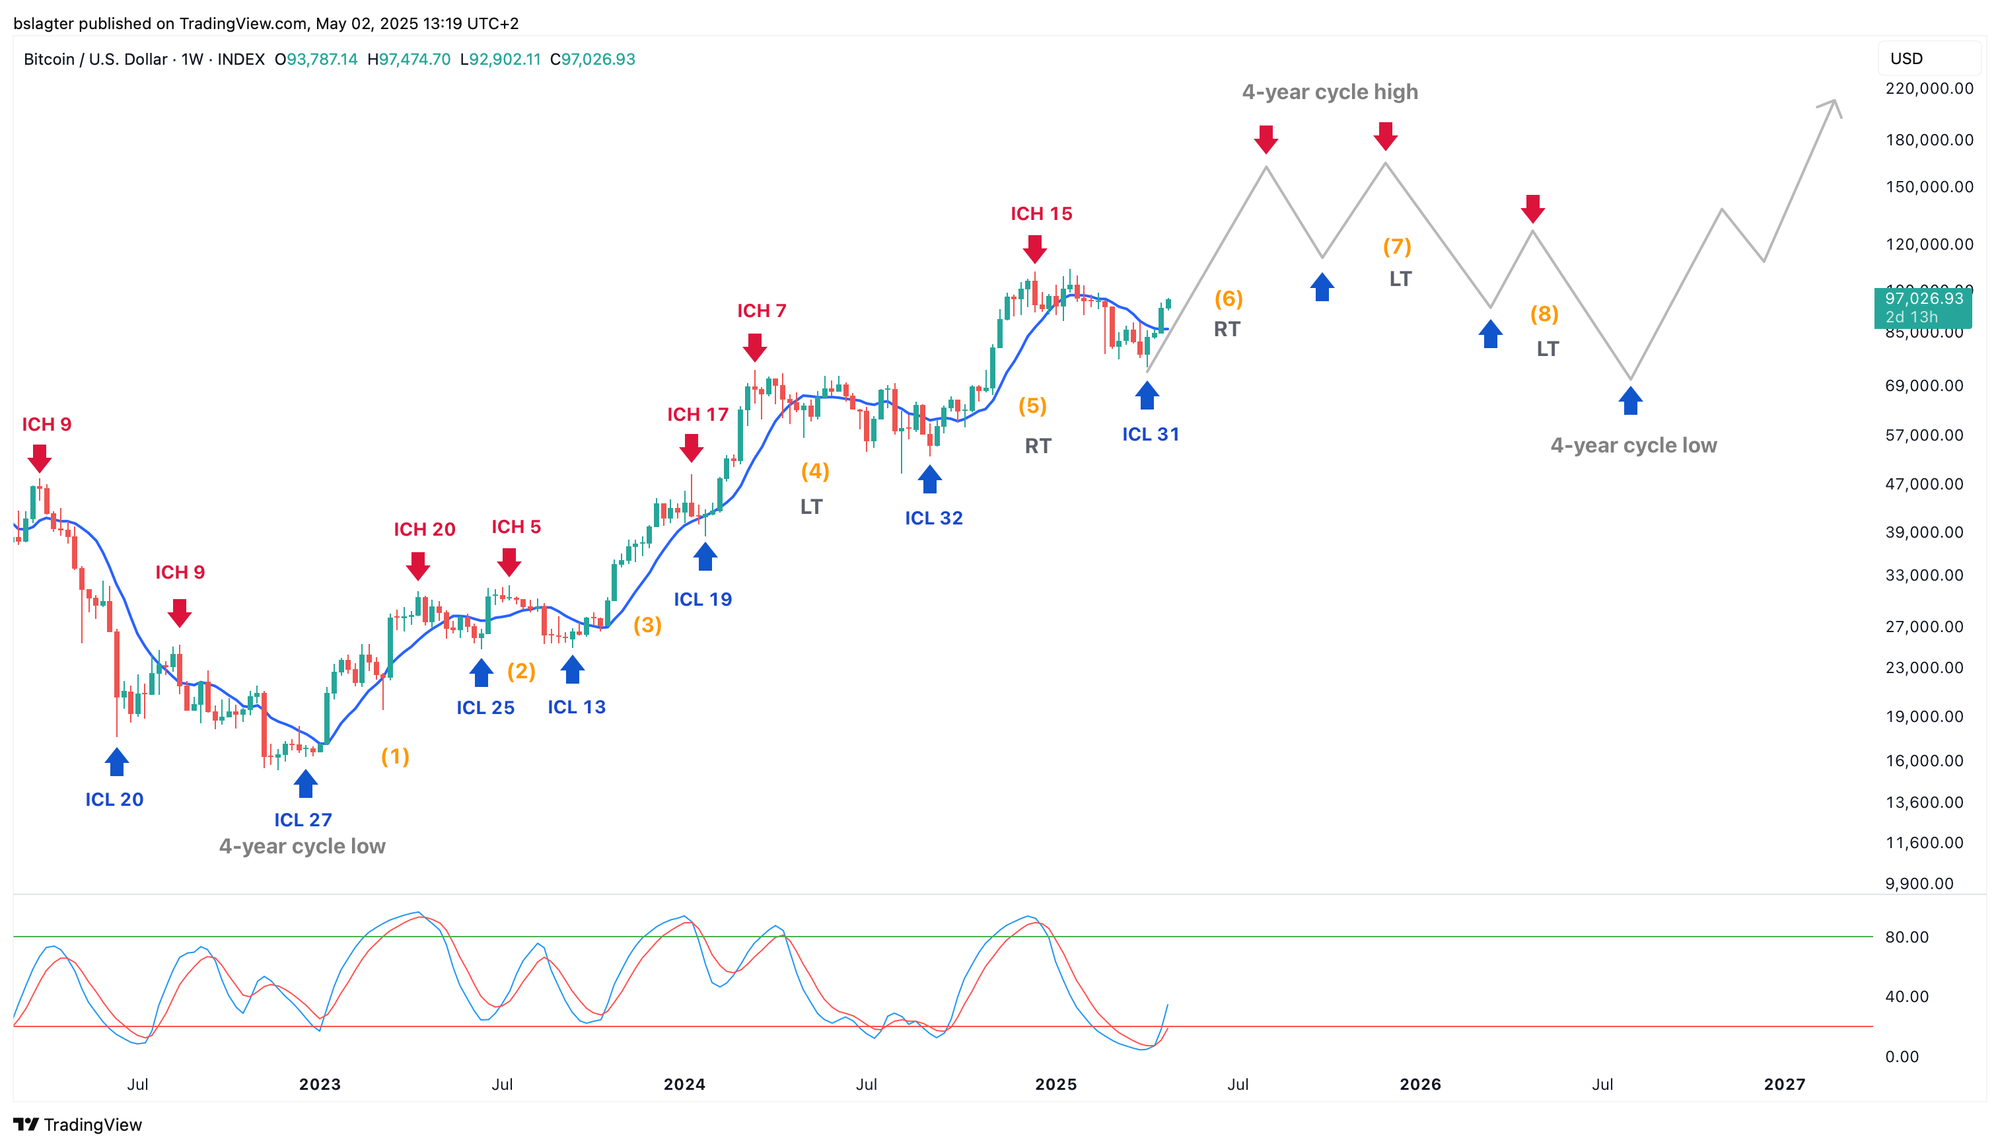
Below is a chart of the yearly cycle. We’re now in the 30th month and well past the midpoint, leaving little time for the upward phase to continue. From a cycle analysis perspective, it would be logical for the bull market’s peak to occur in the latter half of this year.
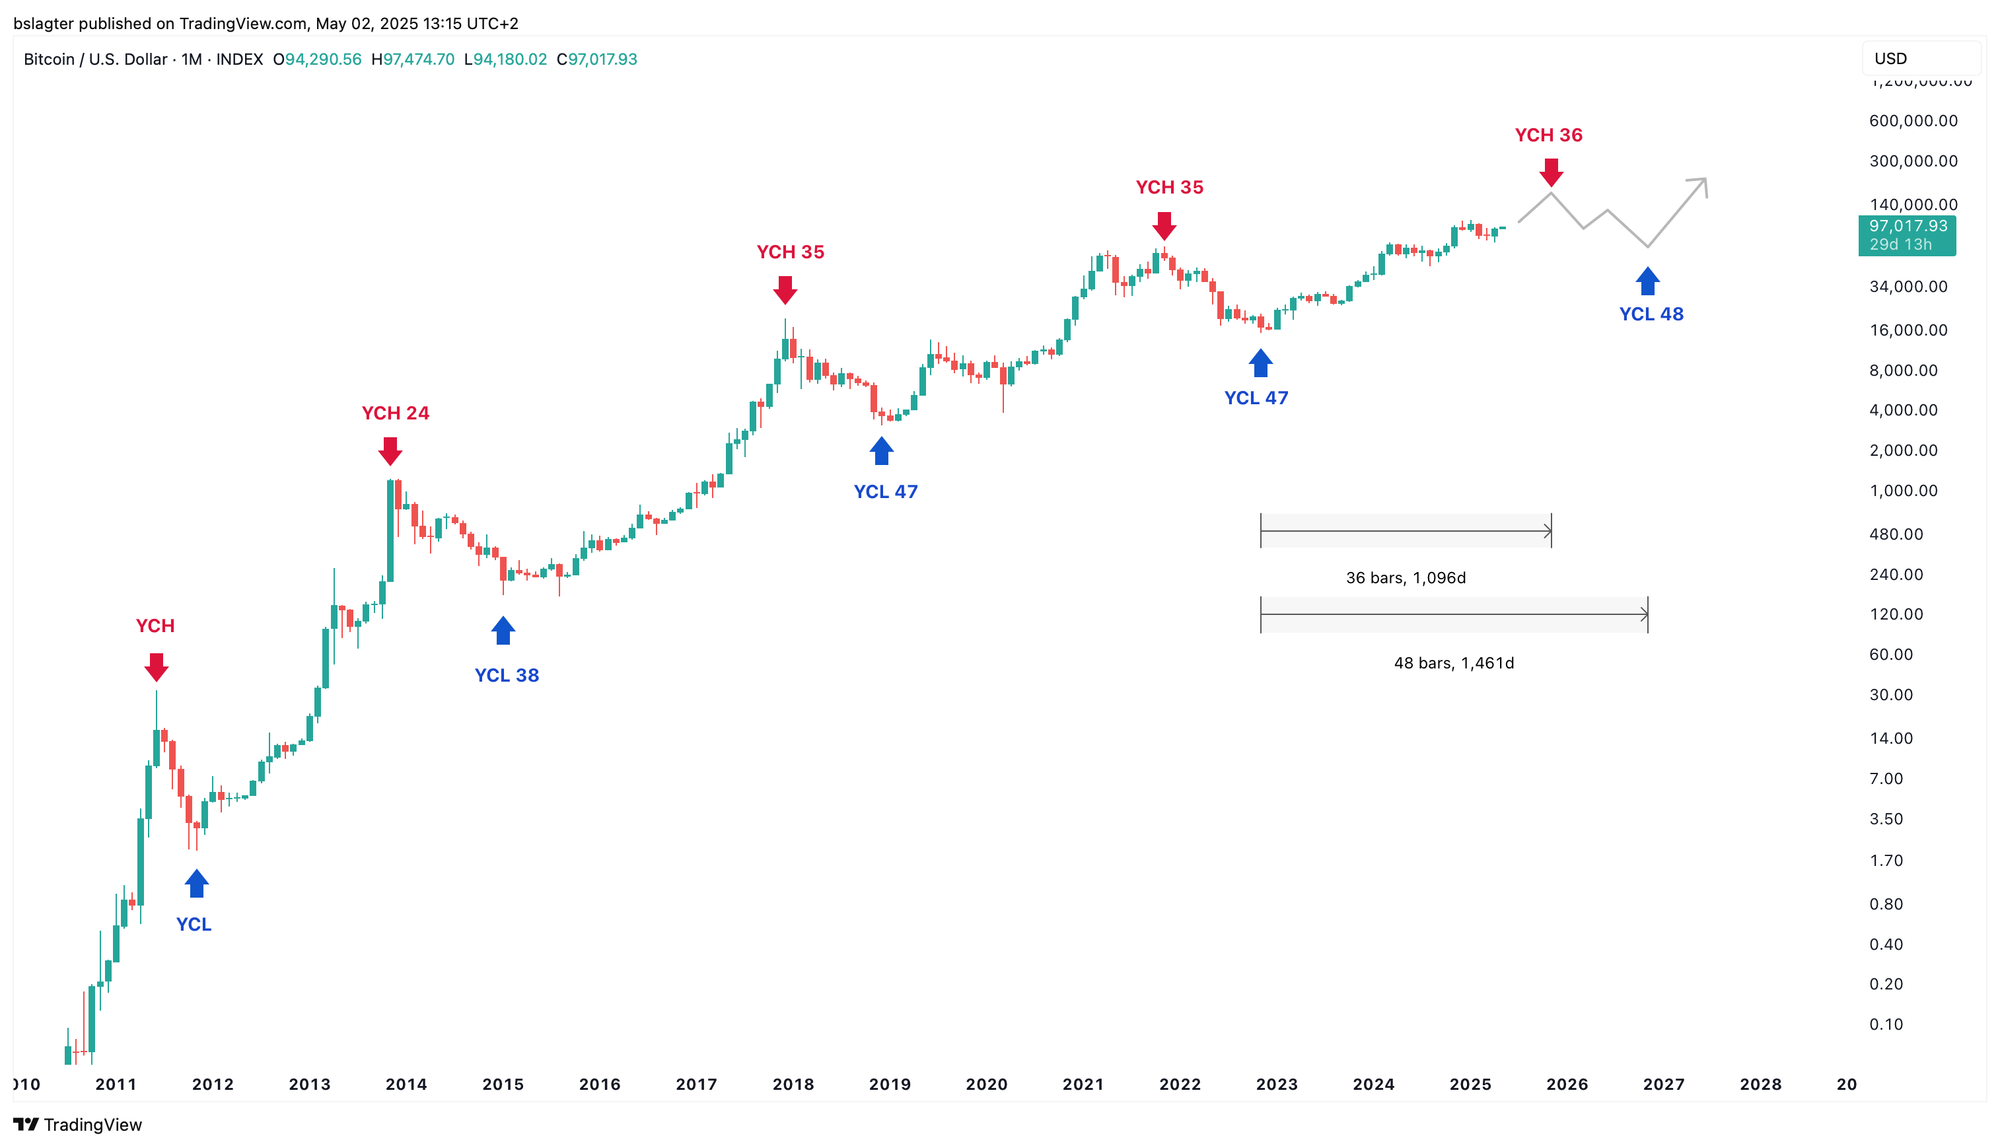
We have now entered the 6th weekly cycle. Since there is still room for growth in the yearly cycle, we expect this weekly cycle to be upward, peaking sometime in August. Could that be the peak of this bull market?
It’s possible, but not necessarily so. The 7th weekly cycle might produce an even higher peak—perhaps early in the cycle—before the bear market sets in, resulting in a classic blow-off top.
After that, we do expect a slightly longer period of weakness, perhaps spanning two weekly cycles with lower prices.
Given the subdued nature of this bull market, the subsequent bear market might also be relatively modest—shorter and less severe—similar to what is sometimes seen in other financial markets during a sustained bull run.
This could, for example, translate into a 50% drop over nine months between summer 2025 and spring 2026, followed by the onset of a new yearly cycle with record prices in 2026. This is not a prediction, but rather an outline of one possible scenario.
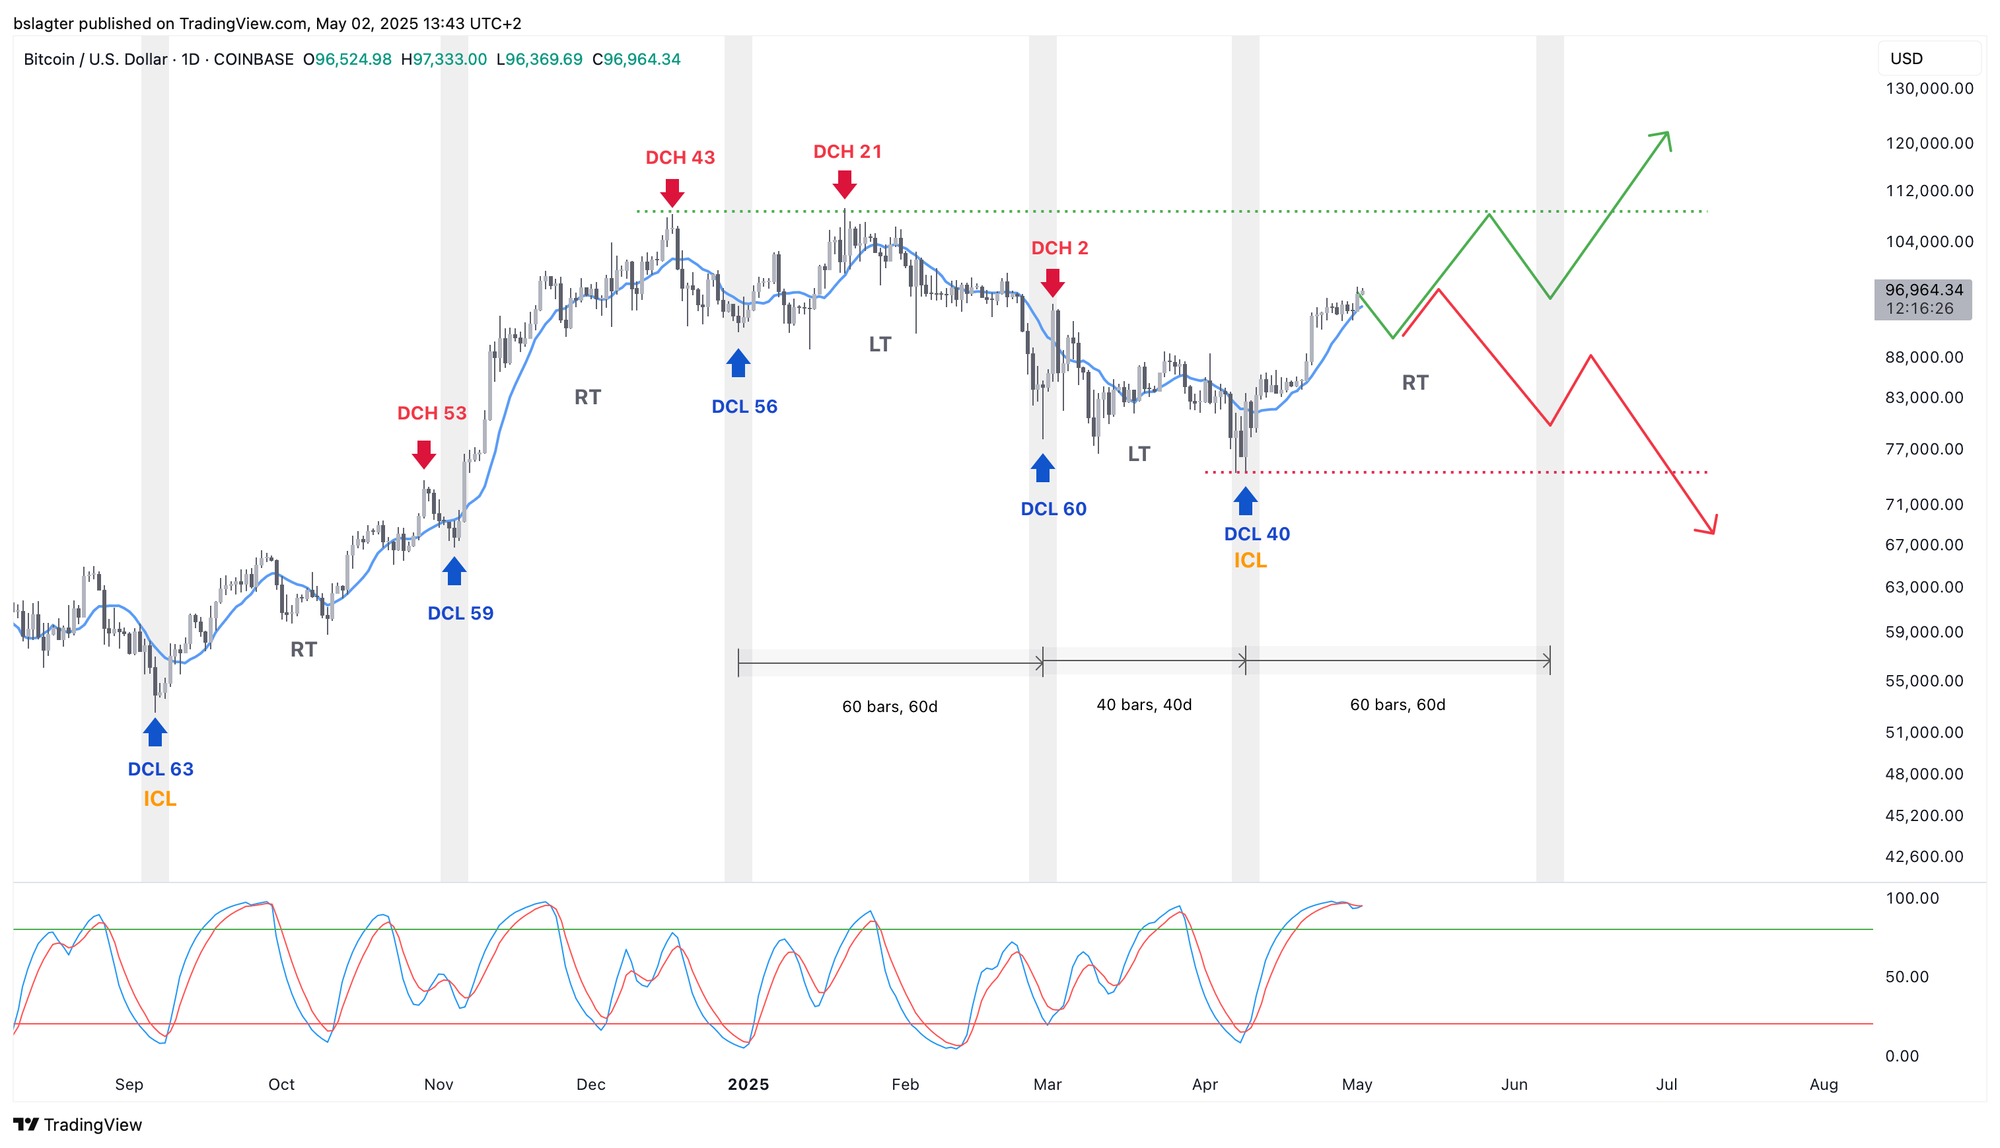
Initially, we thought the daily cycle low on February 28 would mark the end of the 5th weekly cycle, but a brief fourth daily cycle emerged instead. The recent price action is so characteristic of the start of a new weekly cycle that we cannot ignore that conclusion.
The first daily cycle is expected to trend upward. Even during bear markets, the initial daily cycle often shows gains. We are now roughly at its midpoint, a stage typically followed by a one- or two-week pause—a small correction that might bring prices back to around $90,000, as discussed last week. Given that many market observers expect a period of sideways movement, this scenario is also possible.
It’s clear that this daily cycle will unfold between $75,000 and $110,000. The next daily cycle will then reveal what the rest of this weekly cycle holds. Will we see new all-time highs (green), or have we already left the bull market’s peak behind (red)?
Either way, the $74,500 threshold is critical. If prices fall below that, we assume we’re entering the downward phase of the yearly cycle, heading toward a cycle low.
2️⃣ The best contraction ever for the U.S. economy
Thom
So, will a recession eventually come? On Wednesday, it was reported that the U.S. economy contracted by 0.3% year-on-year in Q1 2025. Under Donald Trump’s leadership, any economic contraction becomes headline news and intensifies criticism of his trade policies.
However, a closer look reveals that the decline was mainly due to a one-off surge in imports—up 41.3% compared to the previous quarter—which negatively contributed 5 percentage points to Q1 2025’s growth.
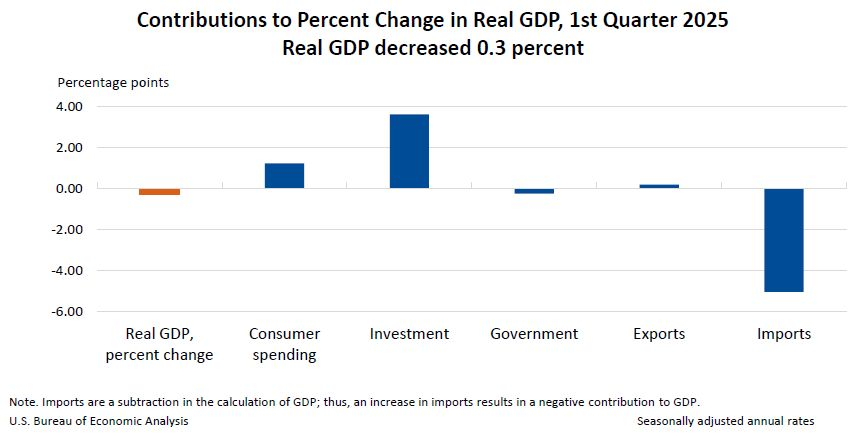
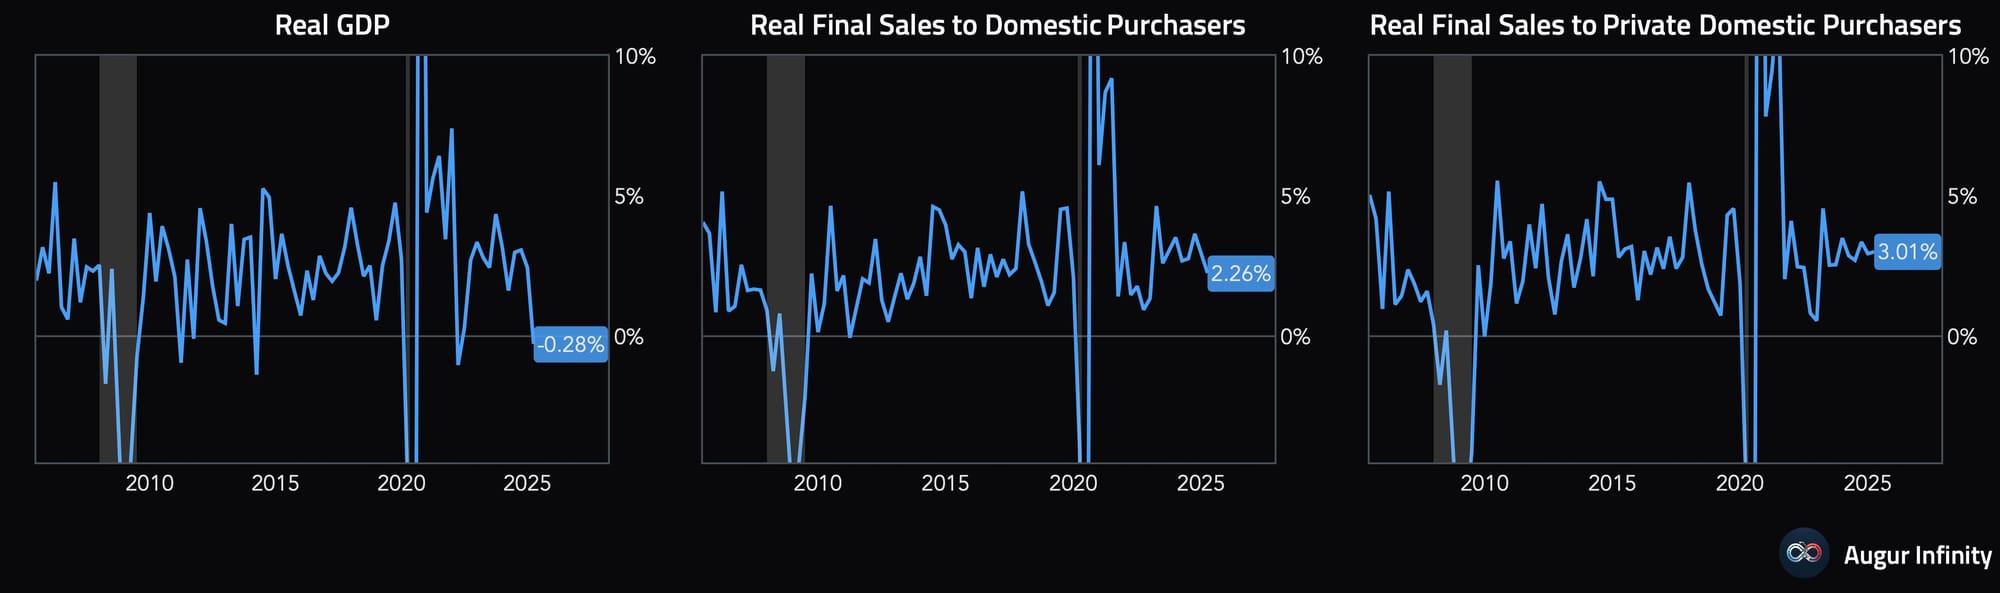
Companies built up massive inventories in anticipation of Trump’s import tariffs. Real inventory growth soared from $8.9 billion in Q4 2024 to $140.1 billion in Q1 2025. Excluding the effects of the trade deficit and stockpiling, there was a robust real growth of +2.26% compared to the previous quarter.
This is often referred to as core GDP: an alternative measure of gross domestic product that filters out temporary disturbances—like large swings in inventory levels and sudden import spikes.
When calculating core GDP, inventory changes and net exports (imports minus exports) are typically excluded. Sometimes even occasional government spending or subsidies are filtered out, depending on the method. The focus is then on domestic spending—primarily consumer expenditure, as well as business and government investment—to provide a clearer picture of underlying economic activity.
The bottom line is that this contraction is likely due to temporary trade and inventory effects, not a sign that consumers or businesses are fundamentally less active. In that sense, one might argue that we’re witnessing the best-case negative growth figure for the U.S. economy.
However, it would be naive to ignore the broader impact. Trump’s policies are undoubtedly harming the global economy, and under such conditions, I don’t expect bitcoin to smoothly scale to a new all-time high.
That being said, the foundation for a future bull market remains intact. Once the current uncertainty subsides and the U.S. economy stops sending recession signals, the essential basis for a bull market will still be there.
3️⃣ Quarterly earnings season starts strong for tech giants
Thom
Another indication that the U.S. economy is stronger than growth figures alone might suggest is the solid quarterly performance of tech giants. This trend started on Wednesday after the close, with Meta and Microsoft announcing their results.
Meta reported a 16% revenue increase and outperformed expectations across the board. The company is now well-positioned to allocate more funds to artificial intelligence investments in its bid to dominate that sector. Microsoft’s results were also better than expected in nearly every respect.
Although Apple and Amazon also posted better-than-expected quarterly results, their stocks dipped sharply in after-hours trading. This was primarily due to heightened concerns over the anticipated impact of the trade war on future earnings. Despite these declines, the S&P 500 and Nasdaq-100 managed to rise, suggesting that investor confidence is returning.
In my view, these results and the accompanying policy signals do not suggest that a recession is imminent. While economic growth has cooled since its peak in 2023, most hard data still points to a robust economy.
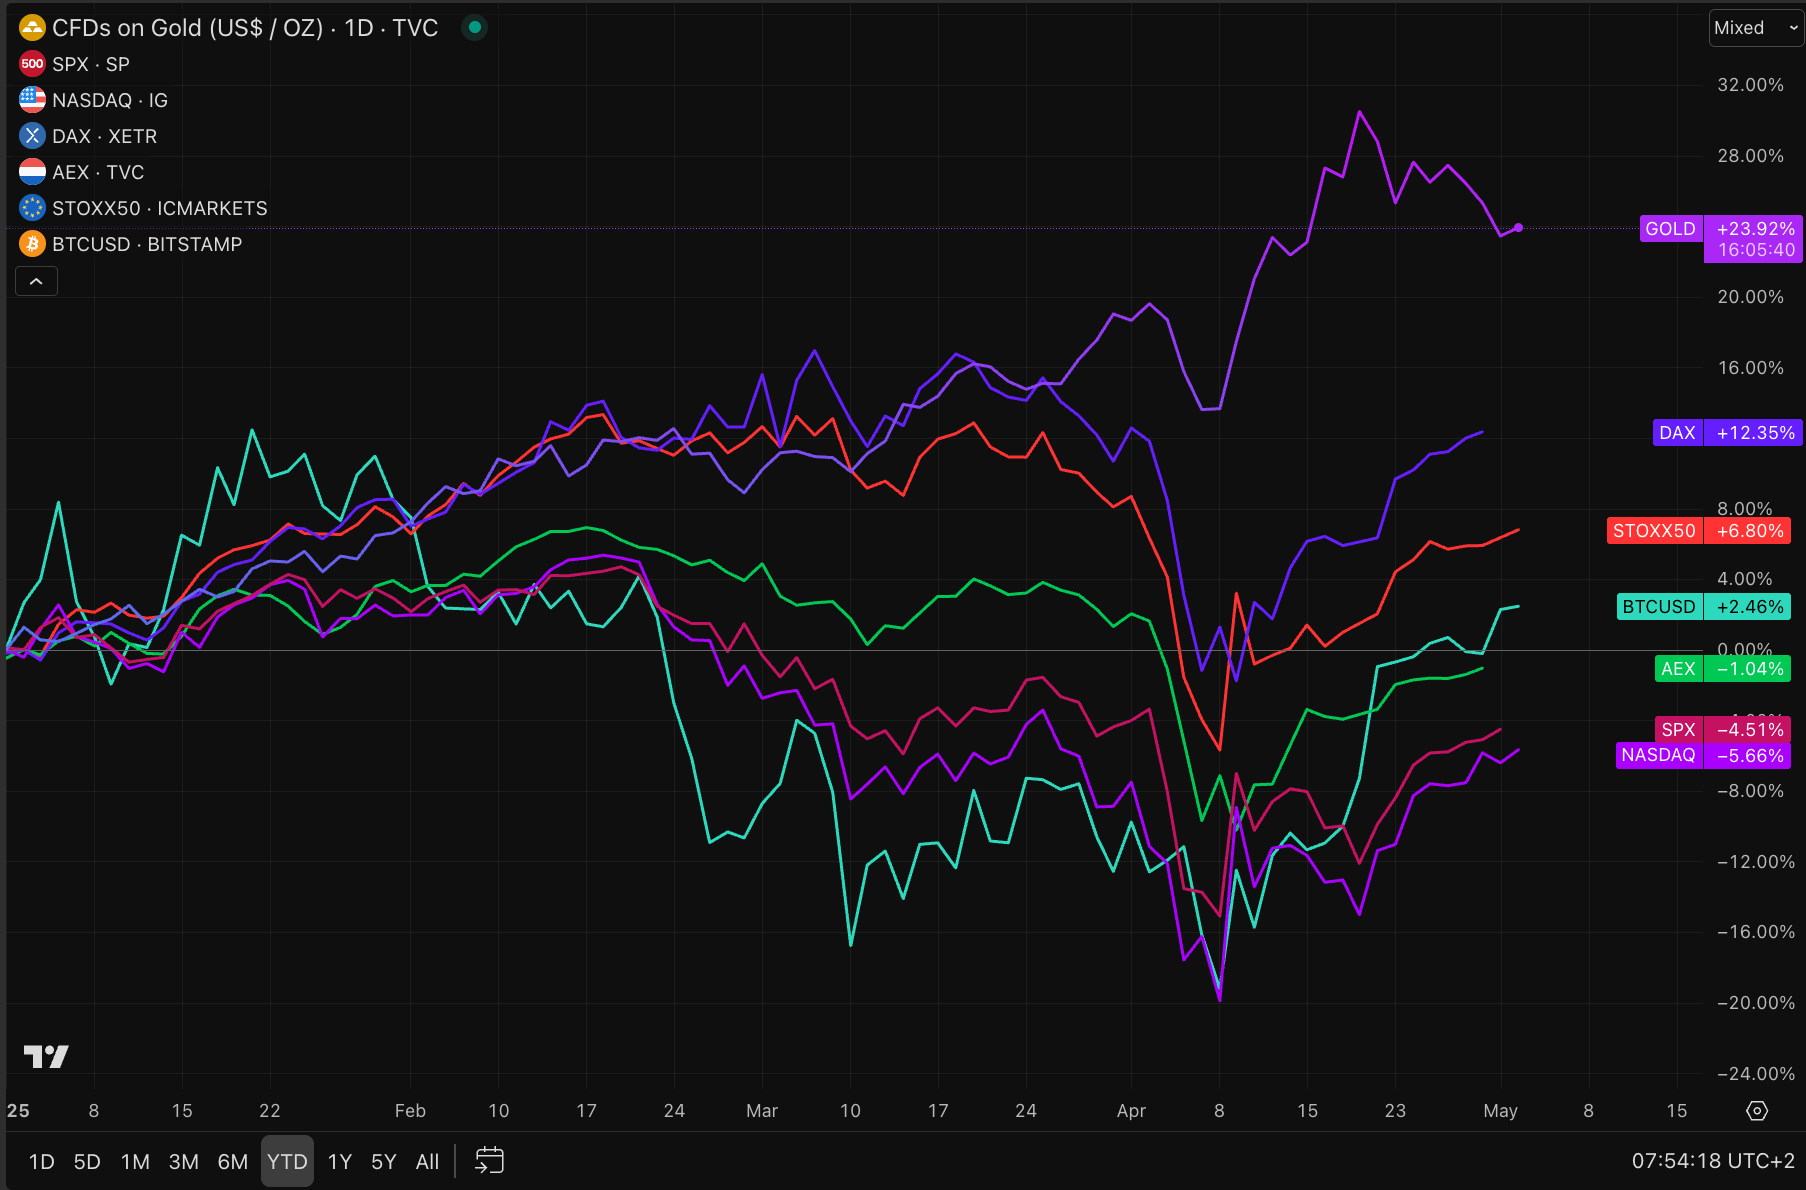
A look at the charts reveals a period when investors clearly shifted to a risk-off mindset. The uncertainty of the first quarter led many to reduce exposure and flock to safe havens like gold.
We’ve seen such episodes many times before in the market. However, these moves rarely signify a radical paradigm shift—such as a return to the gold standard—as similar narratives also emerge with bitcoin. It’s more likely that we will simply witness another round of portfolio rotation, with bitcoin and other riskier assets catching a temporary tailwind.
4️⃣ Update on U.S. stocks
Bert
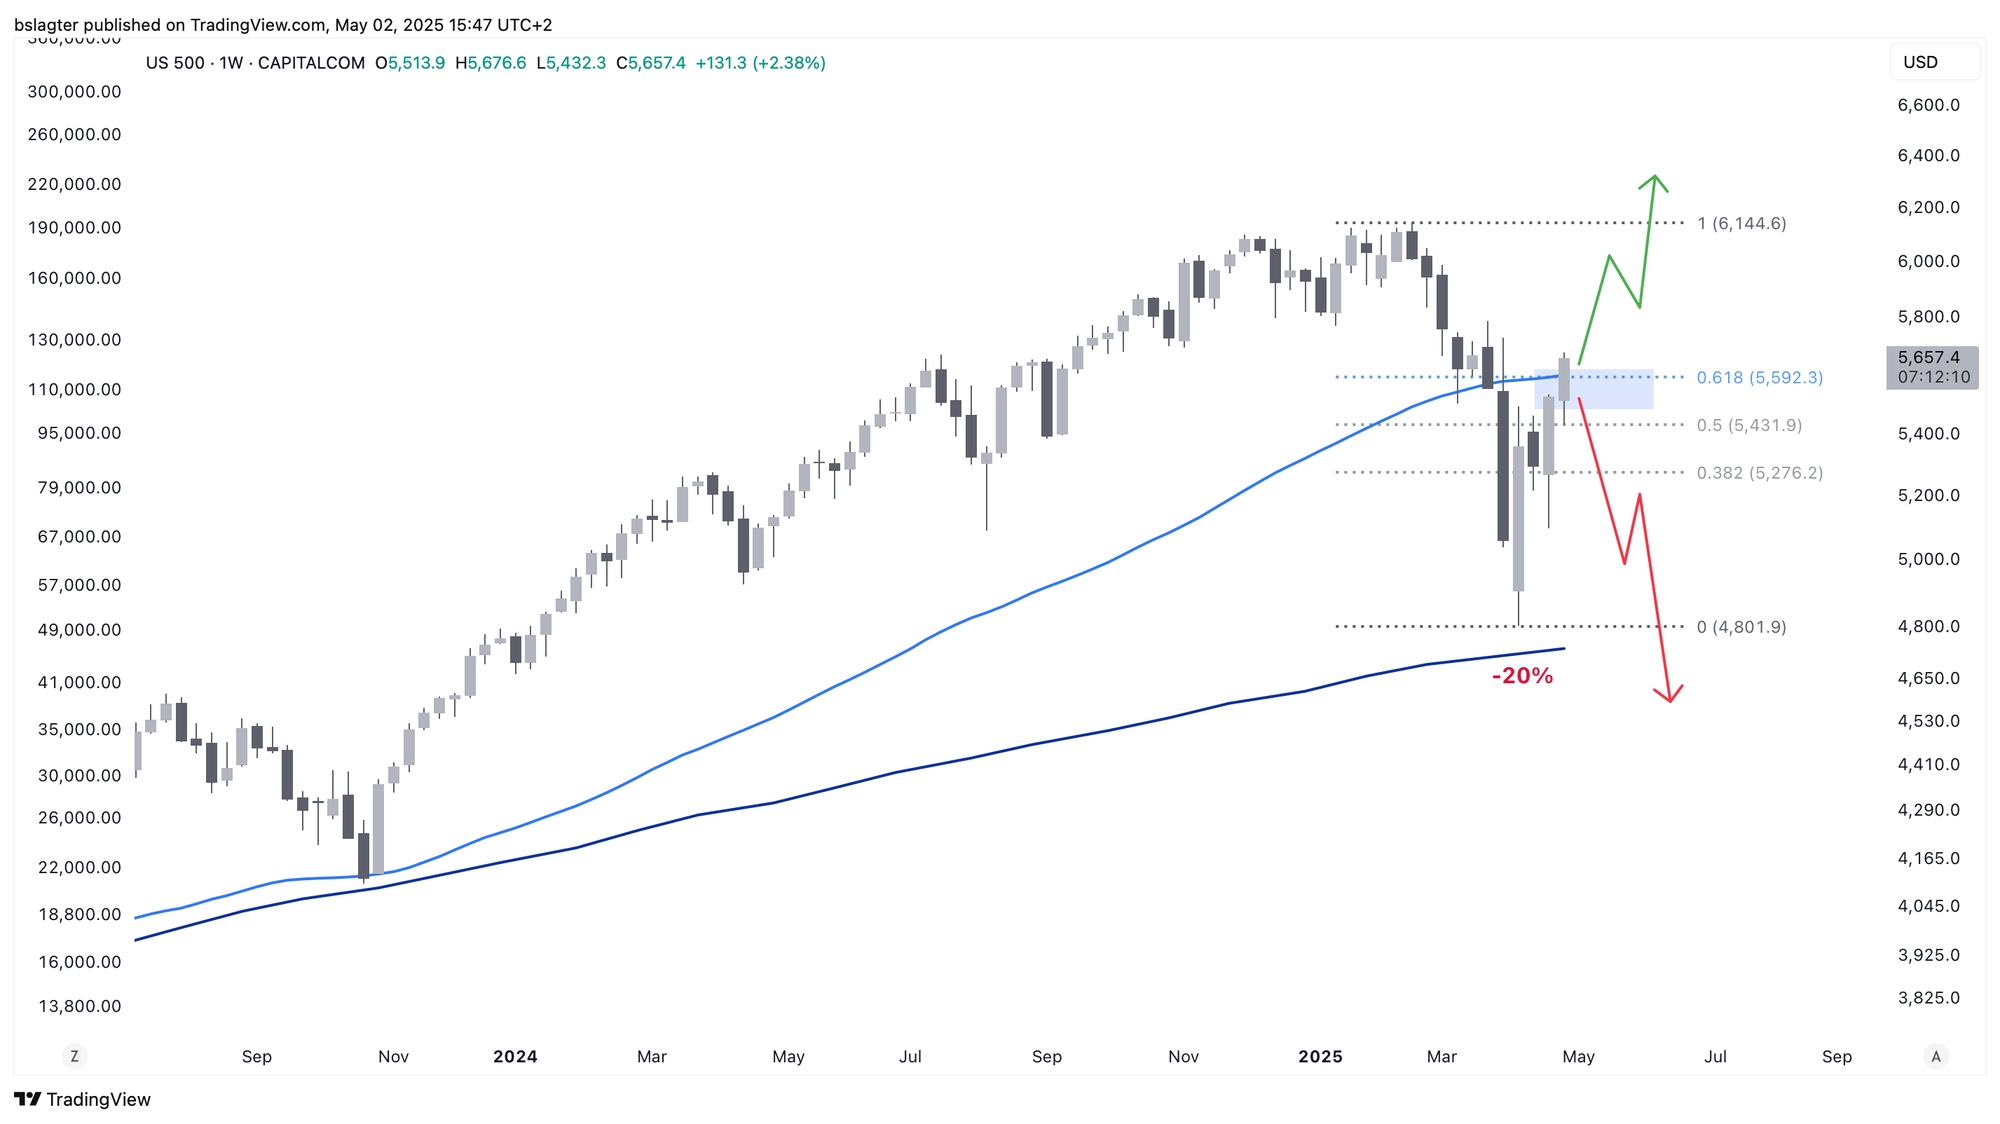
Last week, we featured an in-depth article on the S&P 500:
The S&P 500 has reached a crossroads. On April 7, the index fell to 20% below its all-time high—a sharp correction, though not yet a bear market.
Since then, the index has rebounded and is now only down 10%, roughly recovering half of its initial loss. We now face a critical juncture: if this correction were to extend into bear market territory, this would be the level where the recovery stalls, recouping between 50% and 61.8% of the decline before further downward movement. Otherwise, if the correction is over, the index will simply continue its upward trend.
Meanwhile, one week and one month have passed, and an increasing number of indicators suggest that the S&P 500 will continue its recovery over the coming month. With a few hours of trading remaining this week, a strong close would further support the bullish scenario. We’re eager to see how it unfolds!
Thank you for reading!
To stay informed about the latest market developments and insights, you can follow our team members on X:
- Bart Mol (@Bart_Mol)
- Peter Slagter (@pesla)
- Bert Slagter (@bslagter)
- Mike Lelieveld (@mlelieveld)
We appreciate your continued support and look forward to bringing you more comprehensive analysis in our next edition.
Until then!