Bitwise: "They Bought the Dip"
The rally seems to be losing steam, with price stuck around $80K—not exactly bull market behavior. Meanwhile, Bitwise just had its best quarter ever. Who's quietly accumulating?

JUST IN: Arthur Hayes says the bull market is starting
Bitcoin's rise above $80,000 has drawn the first bulls out of hibernation. The message: the bear market is over, the bottom is in, and new all-time highs are imminent.
The post above refers to the latest blog post by BitMEX founder Arthur Hayes, in which he argues that governments will pump unprecedented amounts of money into the economy, inevitably driving bitcoin prices higher.
The bull market began in earnest when the US attacked Iran on February 28th. [..] Bitcoin bottomed earlier this year at $60,000, and with a tailwind of trillions of dollars and yuan yet to be created at its back, retaking the $126,000 is a foregone conclusion.
Hayes isn't the only one. Finfluencers are nimbly pivoting from doom scenarios to 'moon soon,' but even serious analysts are raising the probability that we're now in a new bull market. For example, with the argument that the weekly RSI closed above 50 last week—something that historically only happened after the bear market bottom.
We made the video below about this over the weekend, where we review some X posts and then dive into the charts.
Could the $60,000 on February 6 have been the bottom? Could this be the start of a new bull market?
Sure, it's possible.
But it's not the highest-probability scenario.
And honestly, it doesn't matter much either. What we appreciate about a bull market is the clearly rising trend, where price alternates between periods of explosive gains and periods of mild decline. Bitcoin is in the spotlight and outperforms most other assets. There's widespread optimism and enthusiasm.
That's not where we are right now. Price is grinding higher—hesitant, labored. Other assets are stealing the attention. Trading volumes are low. Well-known crypto figures are quiet or focused on other things.
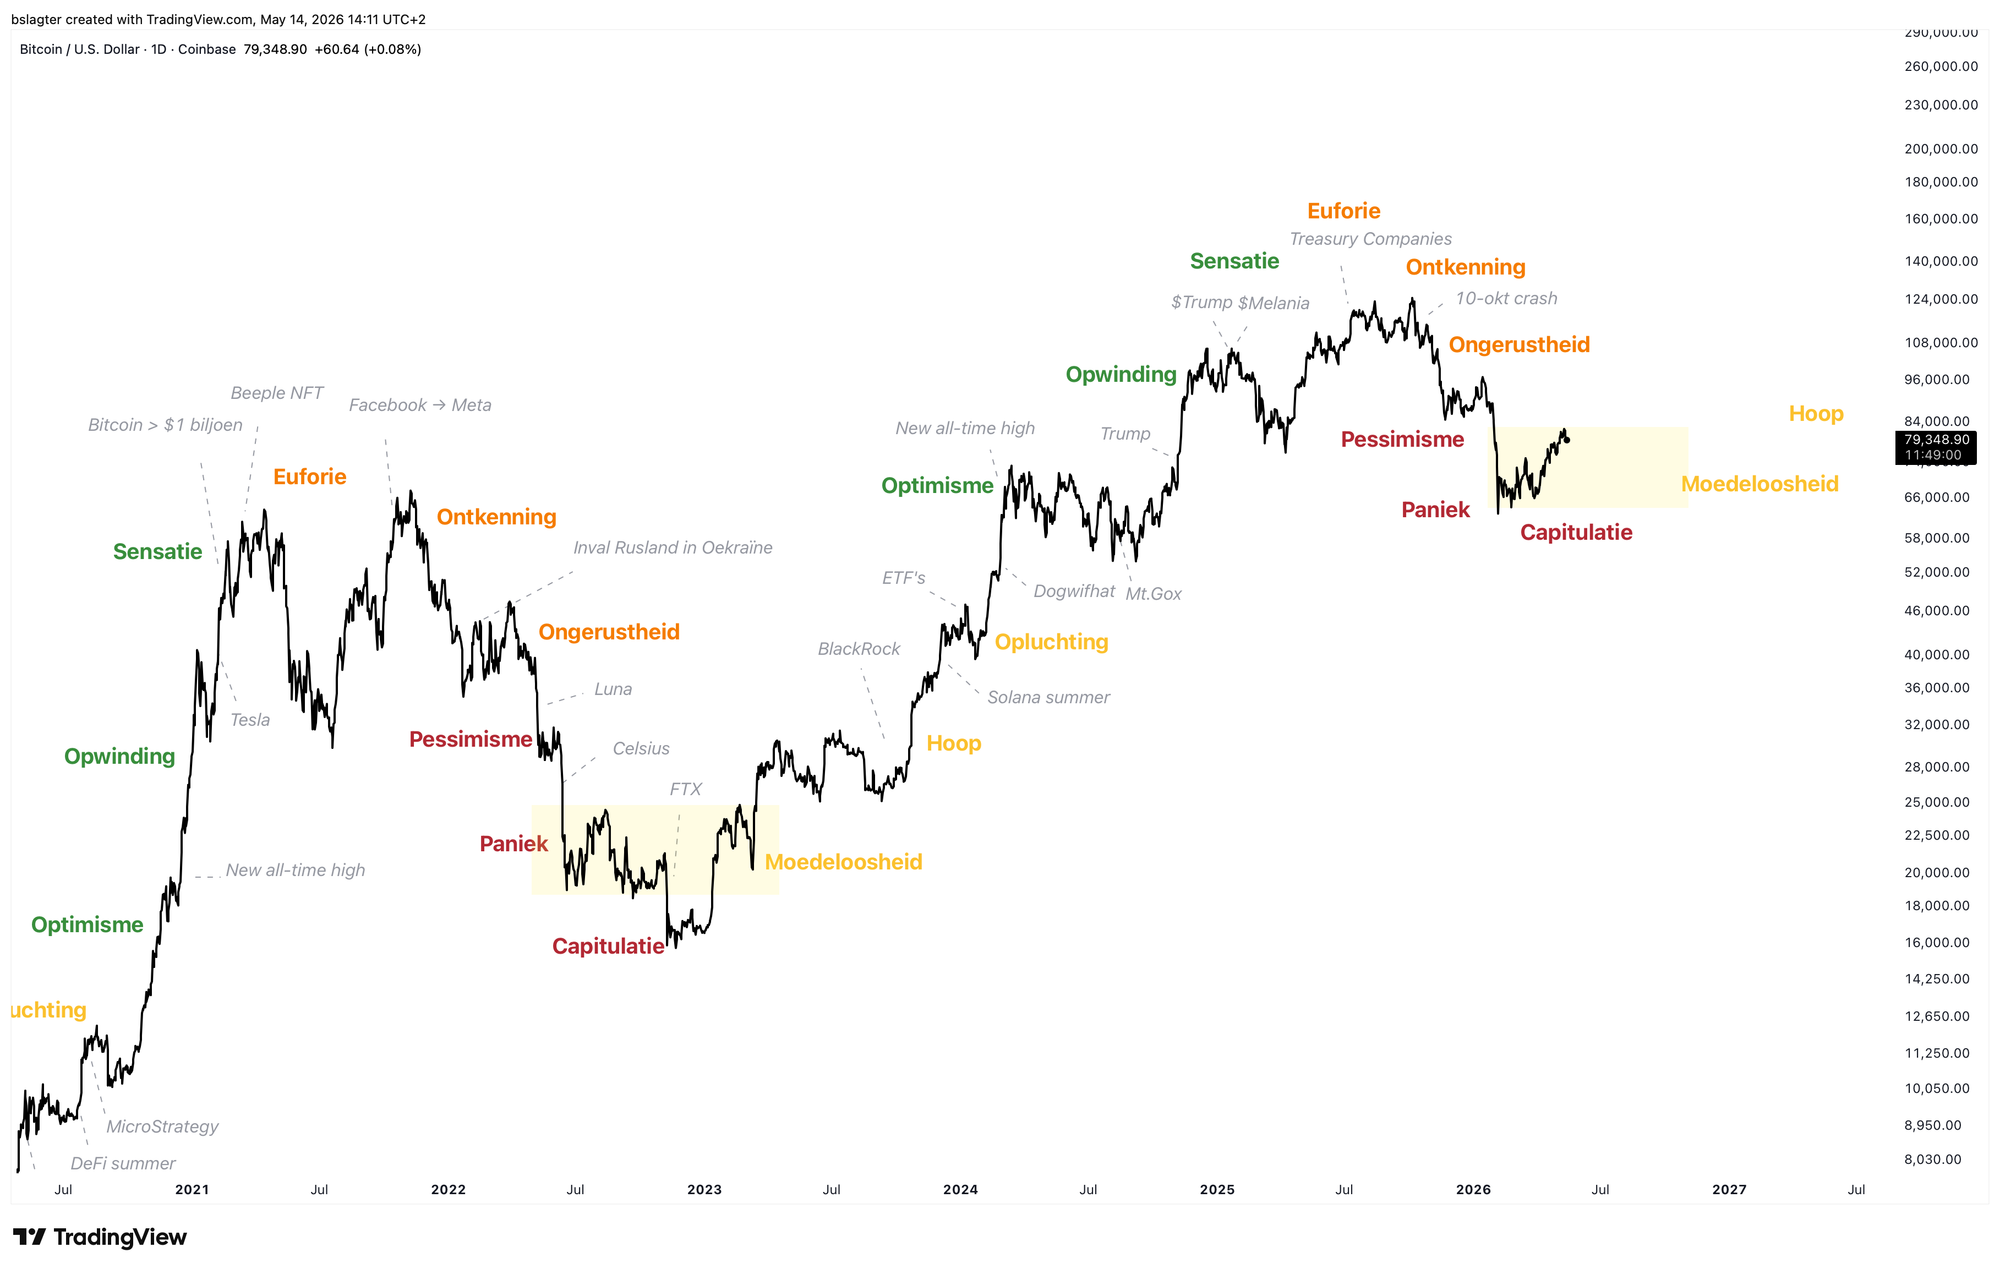
If we had to gauge the current sentiment, it sits somewhere around capitulation (tuning out, losing interest) and despondency.
The chart below shows the market cycle, annotated with a sequence of sentiments. We've clearly passed the denial and anxiety phase (that the bull market is over)—that was November and December. And we clearly haven't arrived at relief and optimism (that a new bull market has begun).
A hallmark of this phase is that long-term investors are systematically and quietly expanding their positions. In the past, those were the whales, the insiders, the experienced bitcoiners. Now it also includes investors guided by wealth managers and financial advisors.
They're putting a few percent of bitcoin in their portfolio. Between 5 and 10% for most investors. Maybe 20% for younger investors looking to build wealth with a concentrated position.
Bitwise CEO Hunter Horsley said this last week on stage at the Consensus 2026 crypto conference:
In the first quarter of this year, the market was down. And we had more inflows from the wealth management channel in the US than in any prior quarter in eight years.
Said differently, it was the best quarter of financial advisors in the wealth channel investing in Bitwise products in the first quarter of this year versus any prior quarter.
They bought the dip.
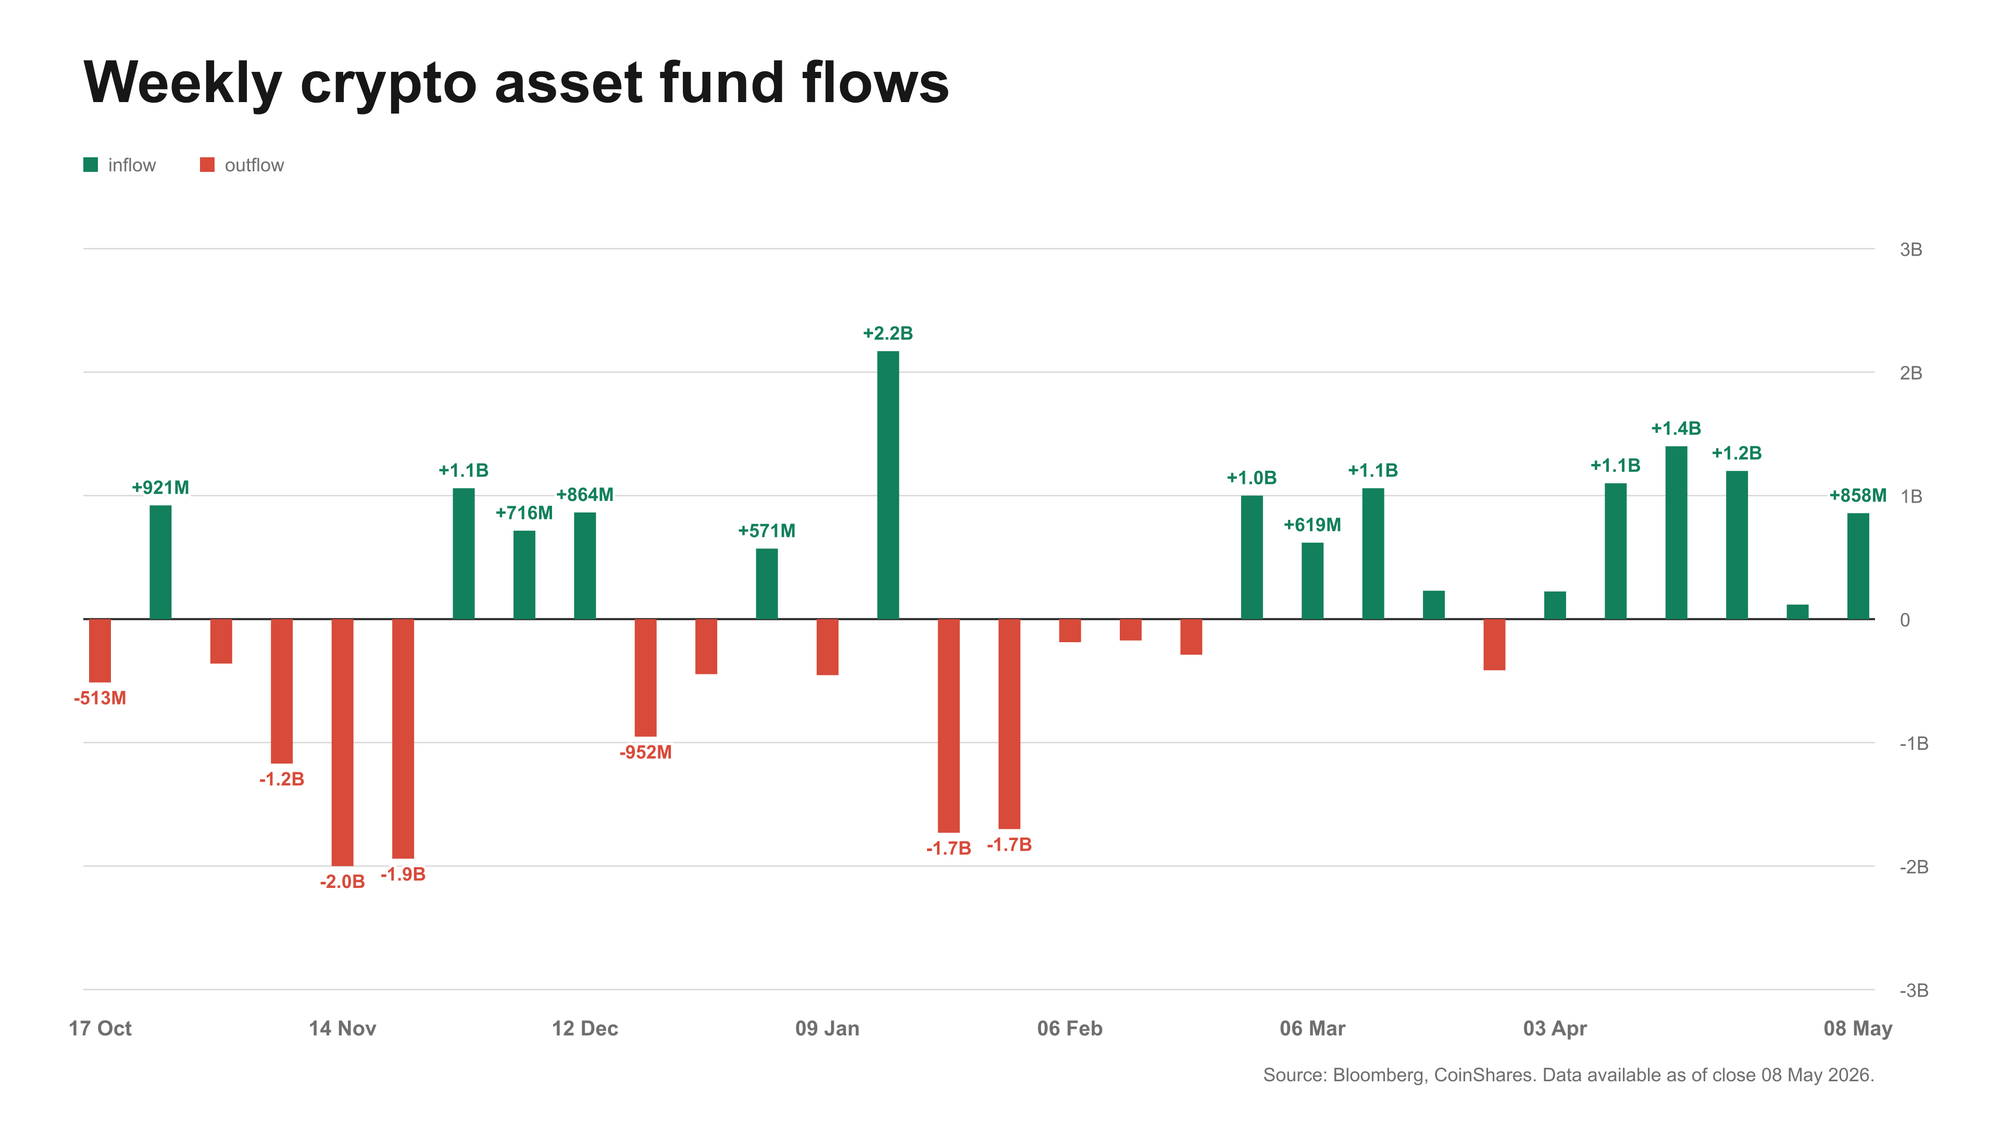
A similar signal comes from CoinShares' weekly report, which tracks global crypto fund flows. Of the past 11 weeks, 10 saw inflows. Last week it was $858 million.
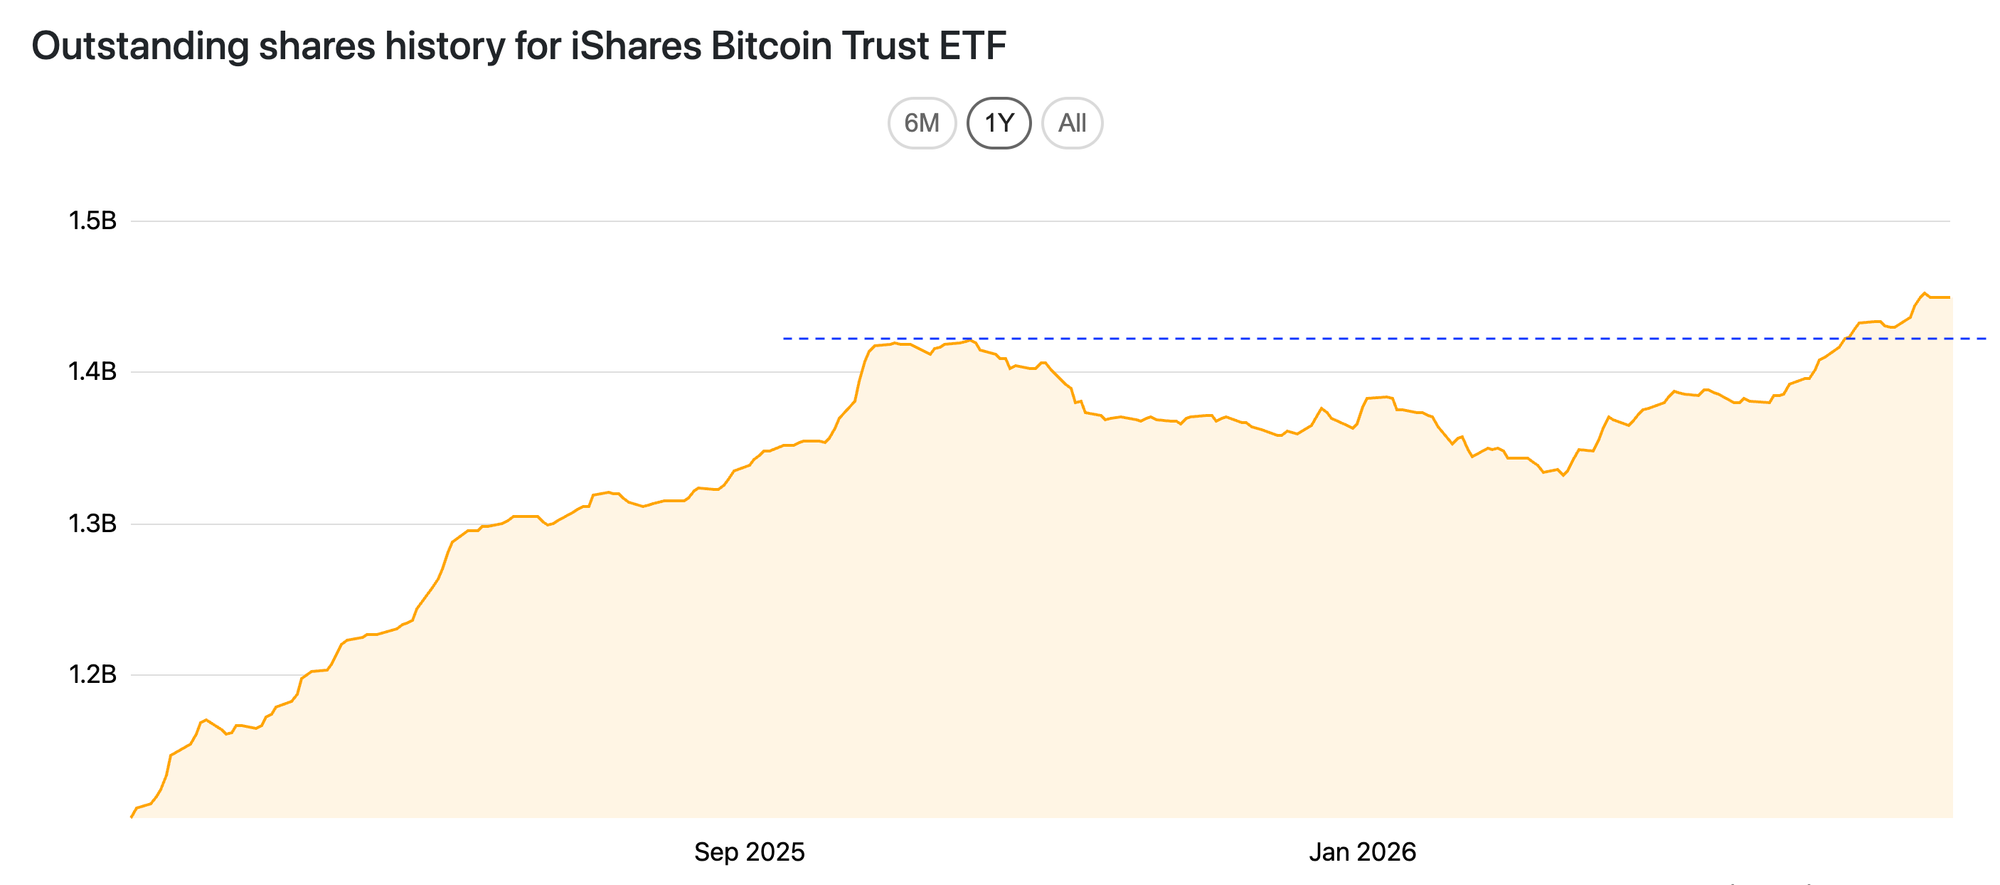
The chart below shows the number of outstanding shares of IBIT, BlackRock's bitcoin ETF. After the peak in October, this dropped by about 9%, partly due to reduced arbitrage activity. Since then, the number of shares outstanding has risen to a new all-time high.
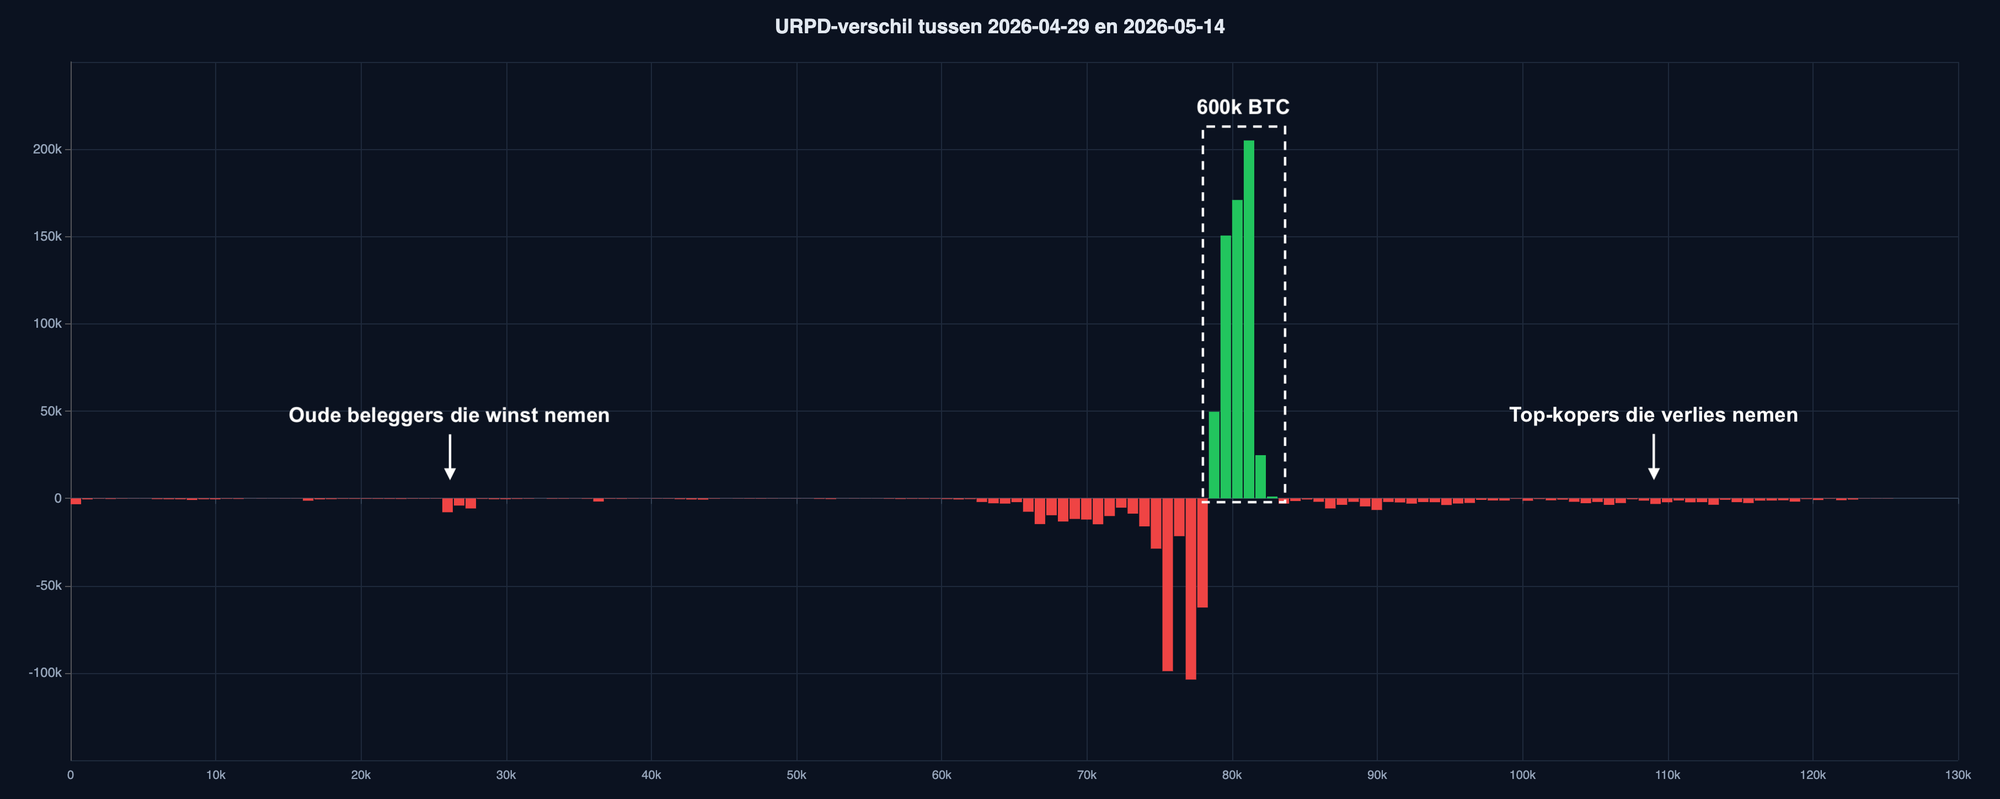
Over the past two weeks, on-chain data shows roughly 600,000 bitcoin changed hands. Buyers paid between $78K and $83K. The sellers are mostly investors who recently bought between $65K and $78K and are now taking profits.
You can see this in the URPD diff below—the difference in the distribution of cost bases between April 29 and May 14:
- Very few are selling at a loss—the small red bars on the right.
- Very few long-term holders are taking profits—the small red bars on the left.
- The bulk is trading by investors who bought at $75K–$77K and are selling a few percent higher.
A portion of the purchased bitcoin disappears into wallets where it will sit for years. And that transfer is what gradually forms the bear market bottom as months pass. A bottom is a process, not a point in time.
Our base case is that we're in the final stretch of the bear market, with the bottom still ahead of us. The most optimistic variant of this scenario is that this bear market turns out to be so mild that the yearly cycle low lands higher than the $60,000 on February 6. In that case, you could say February 6 was the price bottom, and that later this year the time bottom will form.
But that's not how bear markets typically play out. It's more likely that sometime in the coming months we'll see another period of weakness, perhaps triggered by a stock market correction, in which bitcoin completes the bear market.
However it plays out, we have a clear checklist:
⏹️ A higher low (HL) above the $60,000 of February 6
⏹️ A weekly close above the 50-week moving average at $95,000
⏹️ A higher high (HH) above the $98,000 of January 14
⏹️ A directional change of that moving average from declining to rising
Right now, we can't check a single box. So we assume we're in a bear market, and the downtrend on the weekly chart continues.
Assuming this rally doesn't reach $95,000, the first major test of the bear market is the next weekly cycle low:
- If it stays above $60,000, that's a first checkmark.
- If it drops below $60,000 but with bullish divergence, that's also an encouraging sign.
- If it falls much deeper and bullish divergence fails to appear, the bear market will last longer.
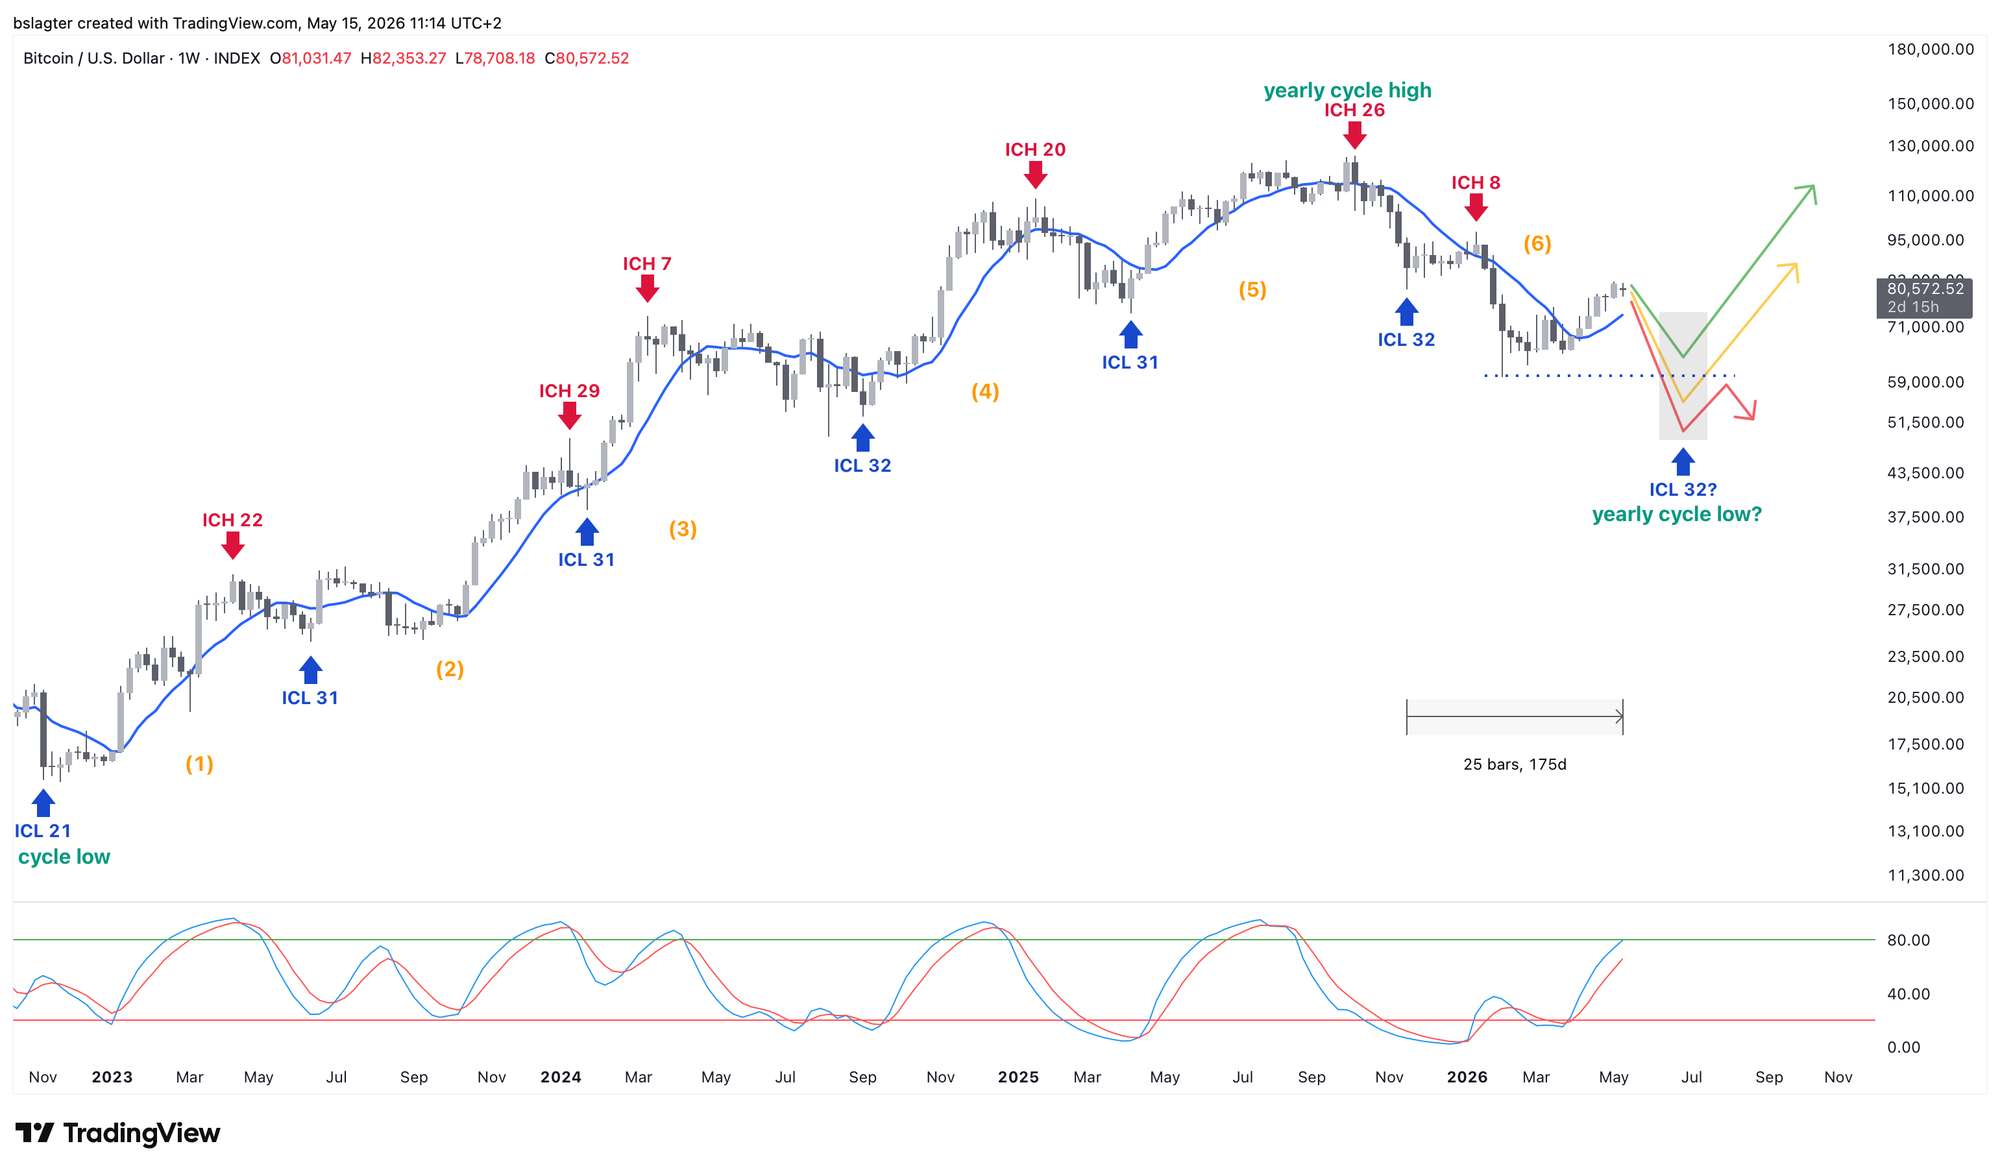
This weekly cycle is now in week 25 of an average 32 weeks. By the end of June, we'll know more. We're watching closely!
Let's continue with the following topics:
- Cycle update for bitcoin
- Bear market over? Polls are divided
- Taking profits during an upward correction
- Encouraging data from the US credit market
- Inflation figures put early pressure on Kevin Warsh
1️⃣ Cycle update for bitcoin
Bert
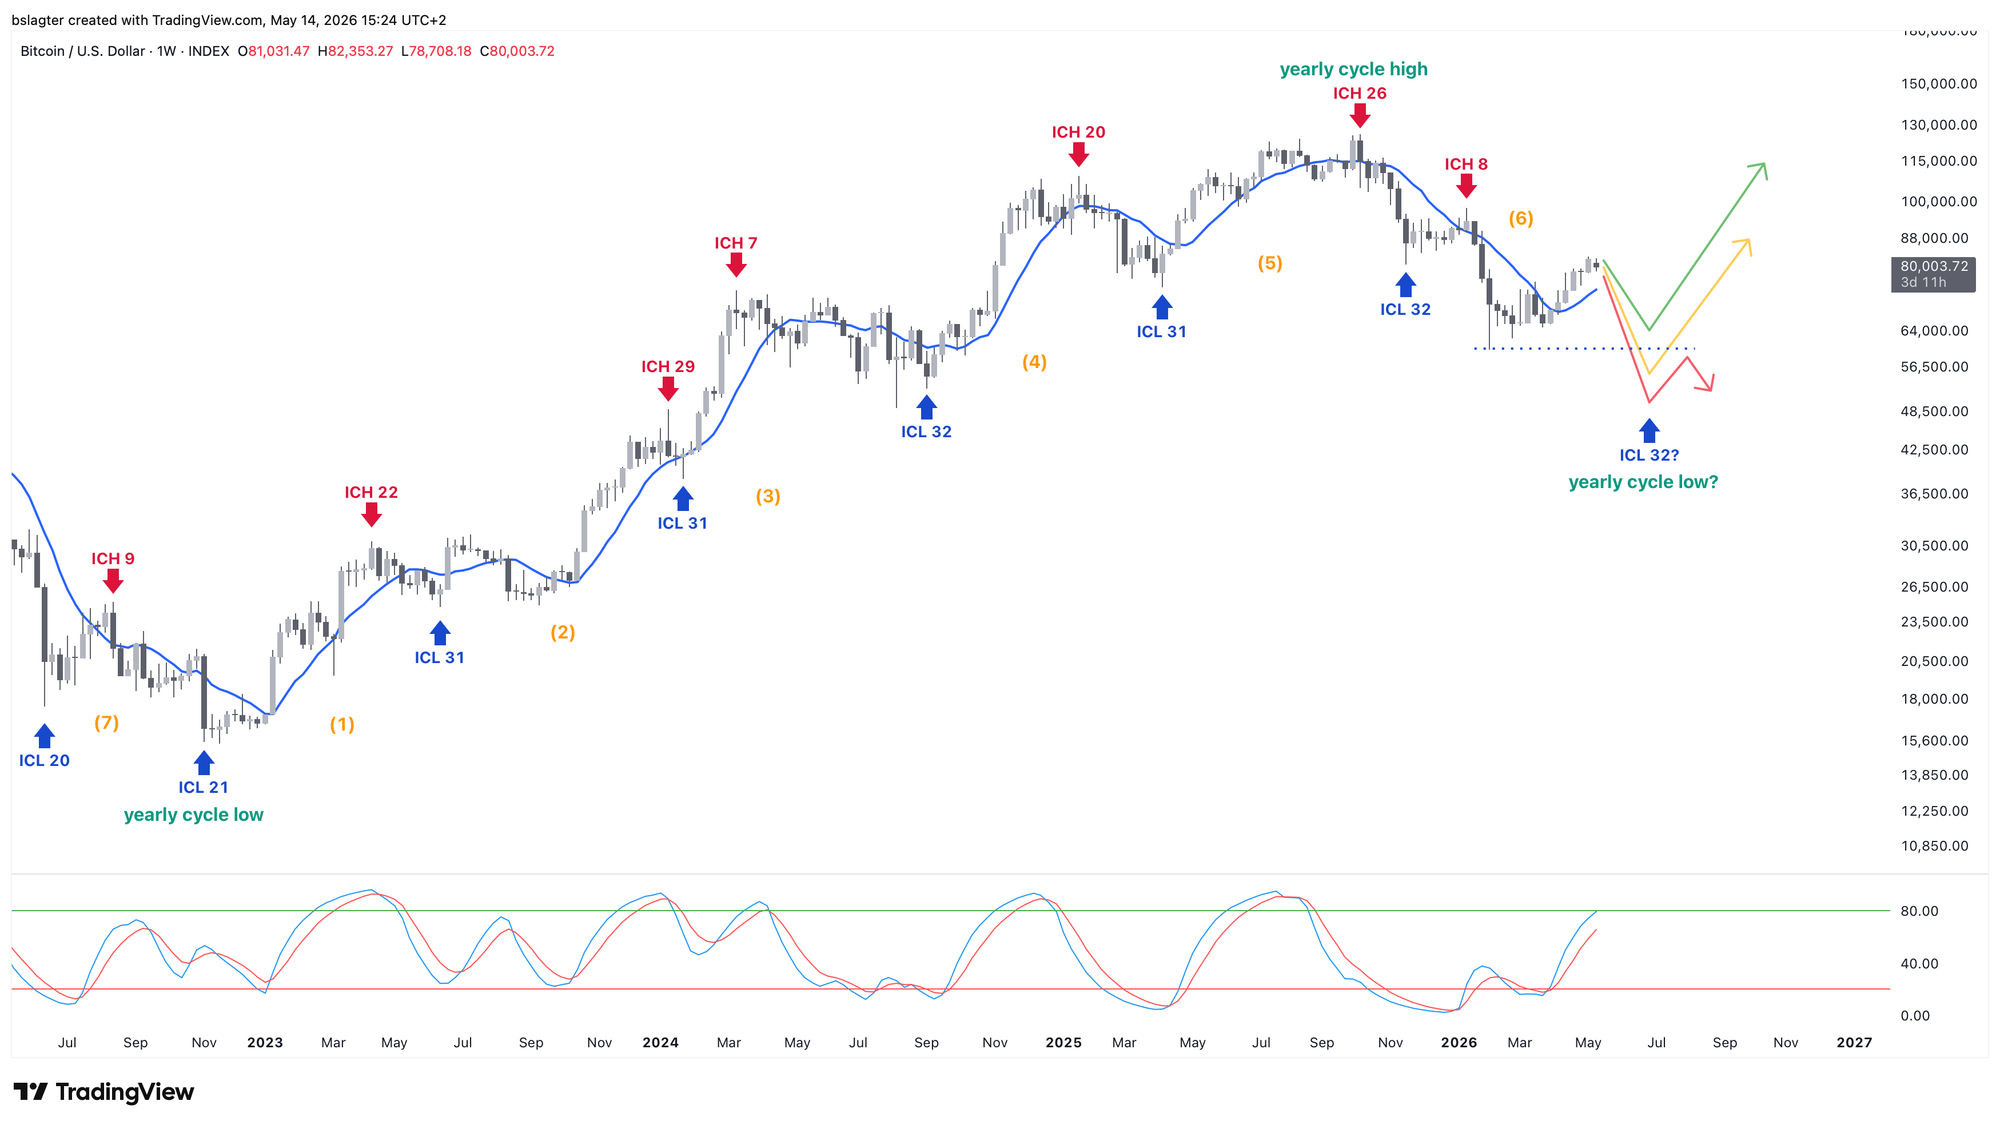
A new weekly cycle began on November 21. Weekly cycles have lasted about 31–32 weeks in recent years. In bear markets, we sometimes see somewhat shorter weekly cycles, as if the market is in a hurry. Think 20–25 weeks.
A short weekly cycle like that doesn't seem to be in play right now. A weekly cycle normally ends with a significant decline, especially at the end of a bear market. We're already in week 25 and haven't even begun the descent toward a weekly cycle low (ICL).
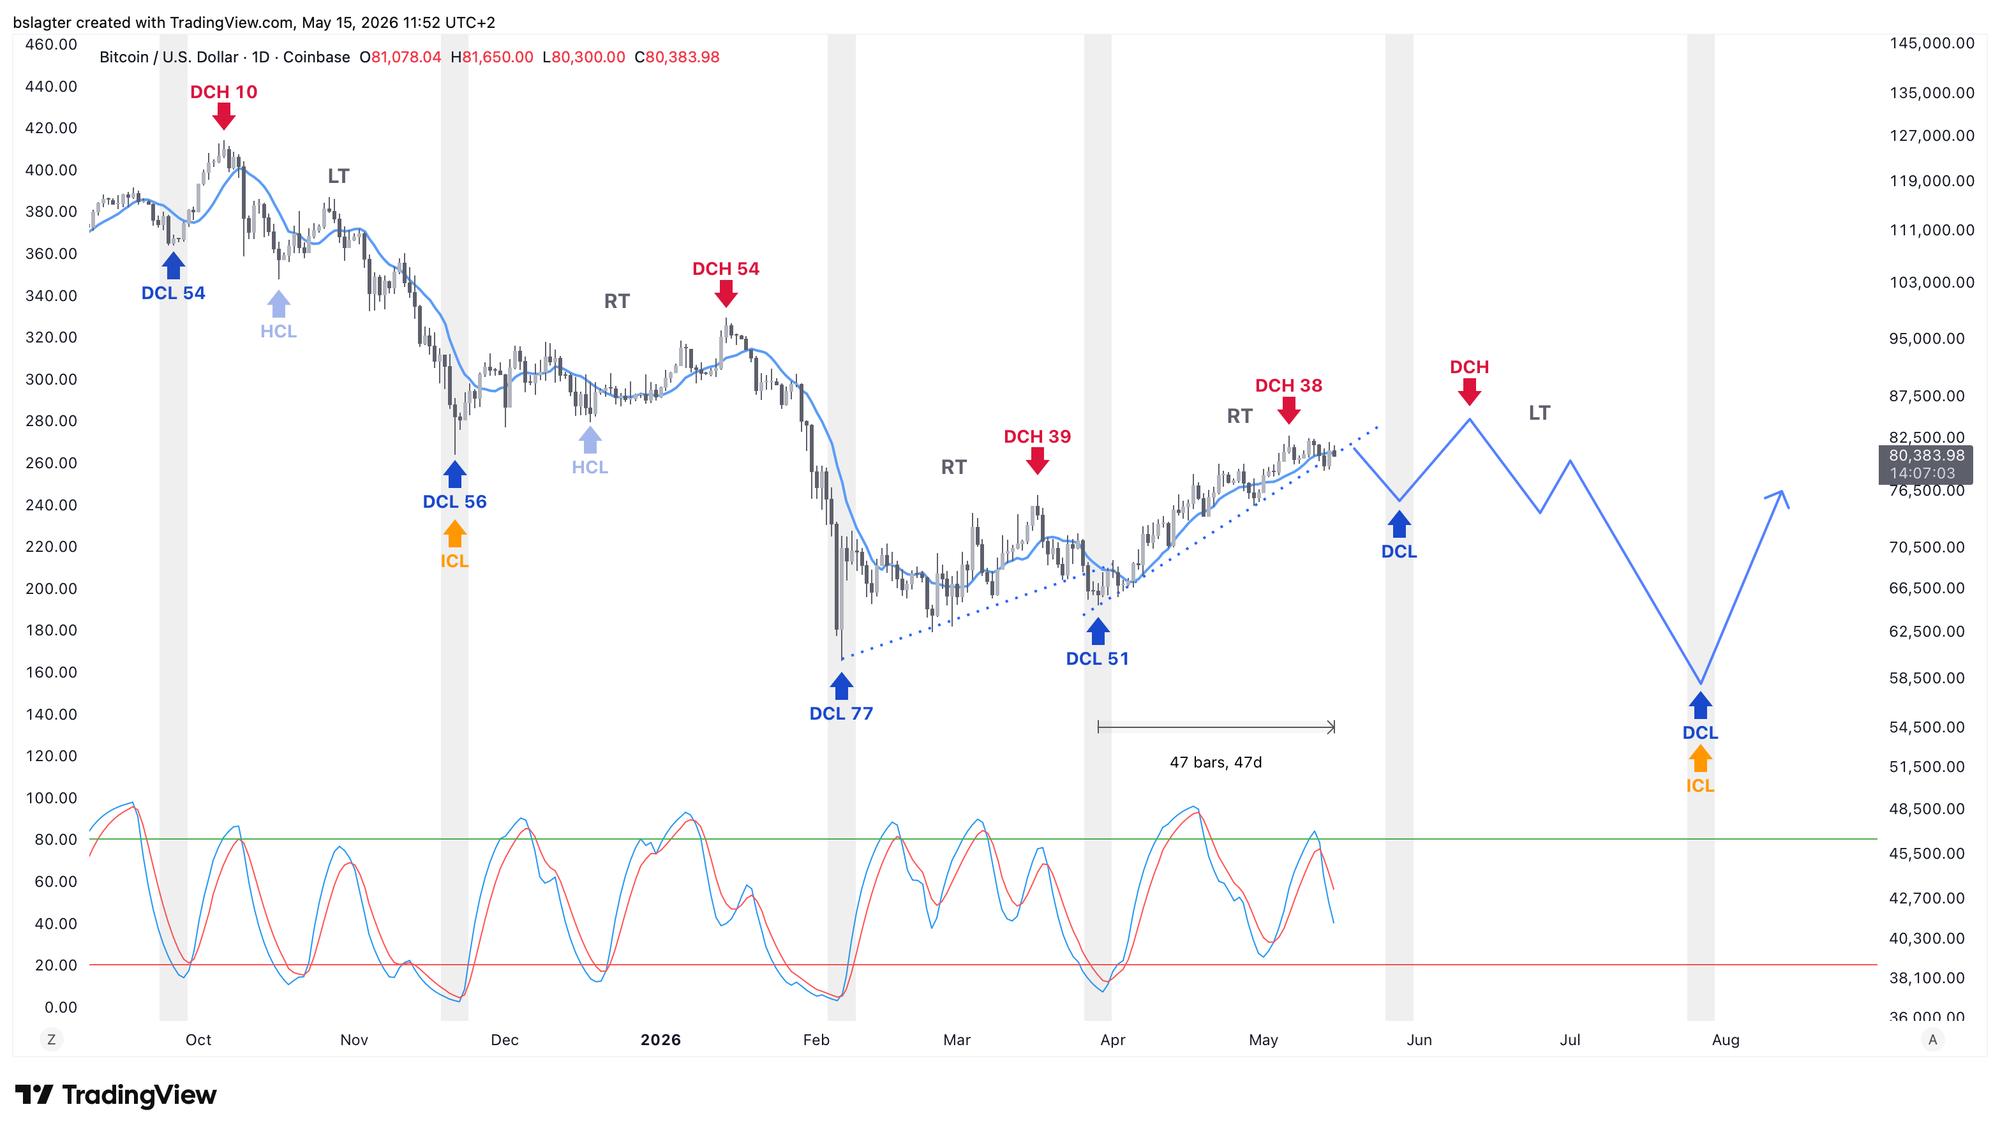
We're now on day 47 of the daily cycle, which averages 60 days. This is the third cycle within this weekly cycle. The first was a bit longer, stretched out by the deep crash that ended with the capitulation on February 6. The second compensated with a shorter duration.
We just observed that it doesn't look like this weekly cycle is nearly done. That gives us two options for the daily cycle:
- This daily cycle lasts unusually long to accommodate the decline toward the ICL.
- This daily cycle ends shallow, like the previous one, and we get a fourth daily cycle within this weekly cycle that contains the decline toward the ICL.
I think option 2 is the most likely. That's also because this daily cycle had a daily cycle high (DCH) on day 38. That likely makes it right translated (RT)—meaning the peak sits to the right of center. That's unusual for the last daily cycle of a weekly cycle, where you'd expect the market to spend more time declining than rising.
It would therefore make sense to see a fourth daily cycle that's left translated (LT) and leads to the ICL.
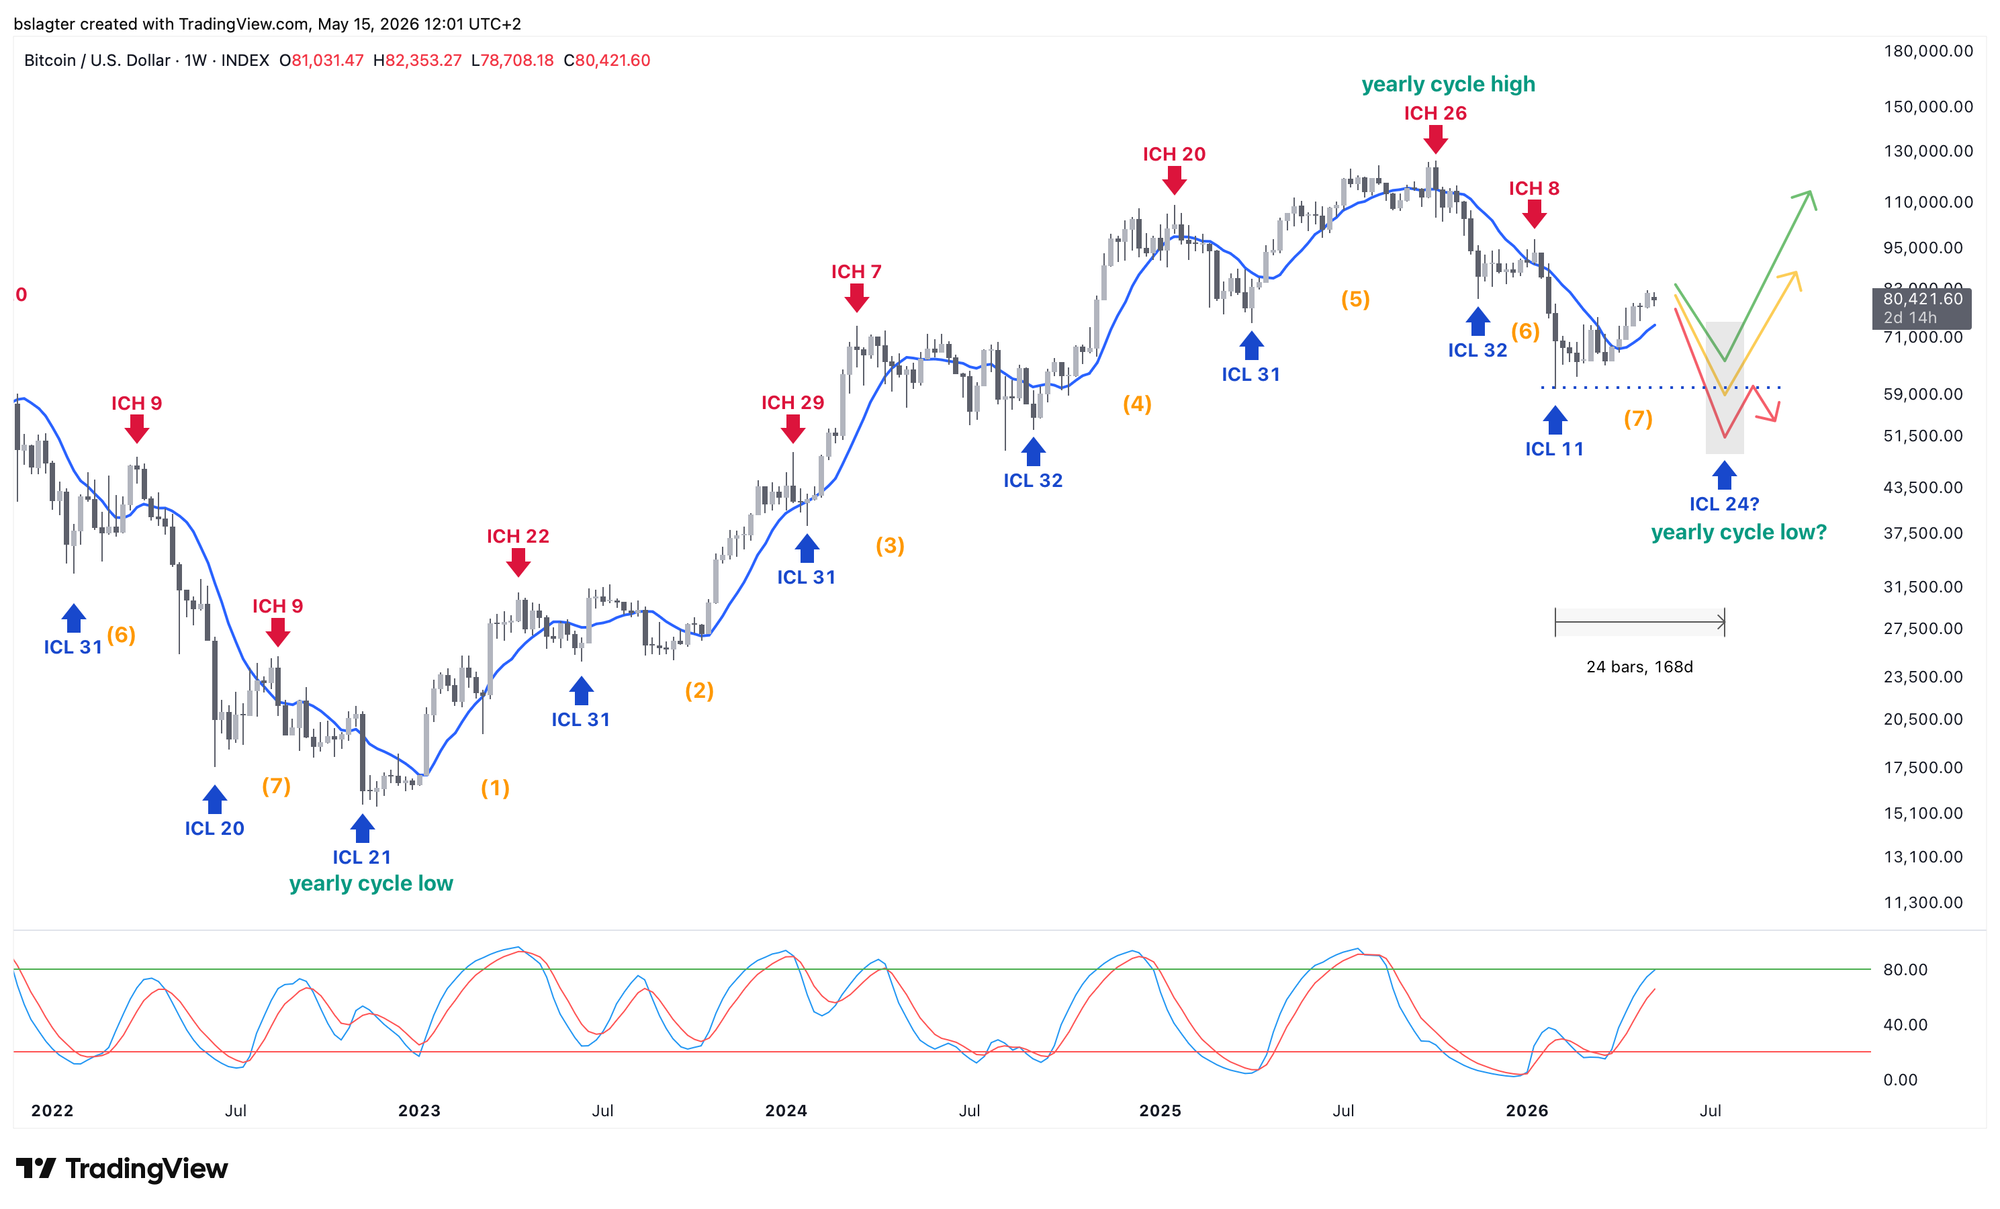
An alternative reading is that February 6 was an ICL of an ultra-short weekly cycle of just 11 weeks. In that case, this daily cycle would be the second, and the next one the third.
The chart below includes this alternative. The ICL—and possibly the bear market bottom—would then be pushed slightly further out to late July instead of early July.
On the left side of the chart, you can see the final stretch of the 2022 bear market. Back then, we also saw short weekly cycles 6 and 7 to wrap up the yearly cycle. In that regard, it would rhyme nicely.
2️⃣ Bear market over? Polls are divided
Bert
I came across two polls on X yesterday about whether the $60,000 on February 6 was the bottom of this bear market. One from PlanB and the other from Plan C—which in itself is pretty amusing.
Let's take a look at both:
Was Februari $60k the bottom of this bitcoin bear market, and does BTC go up from here?
— PlanB (@100trillionUSD) May 14, 2026
Or, is the bear market bottom yet to come, and below $60k?
Is the Bitcoin bottom in?
— Plan C (@TheRealPlanC) May 14, 2026
Opinions are split—roughly 50/50 for PlanB and about 60/40 in favor of a new bull market for Plan C.
Several more polls were conducted in recent weeks that roughly measure the same thing, such as this one from Bitcoin Archive and this one from Nik. Also divided.
Yano, co-founder of Blockworks, is now certain: the new bull market has begun.
Calling it: Beginning of a new bull market
— Yano 🟪 (@JasonYanowitz) May 14, 2026
Small signs here and there of life. Will become more obvious as the year progresses.
Giddy up.
No evidence, no data, no arguments—just something vague like "signs of life here and there." Pretty ironic for the founder of a company whose motto is: "We're building the backbone of crypto information."
It's valuable to look at sentiment and mood. But only as a small data point in the category of 'supporting evidence.' Not as the primary basis for your base case.
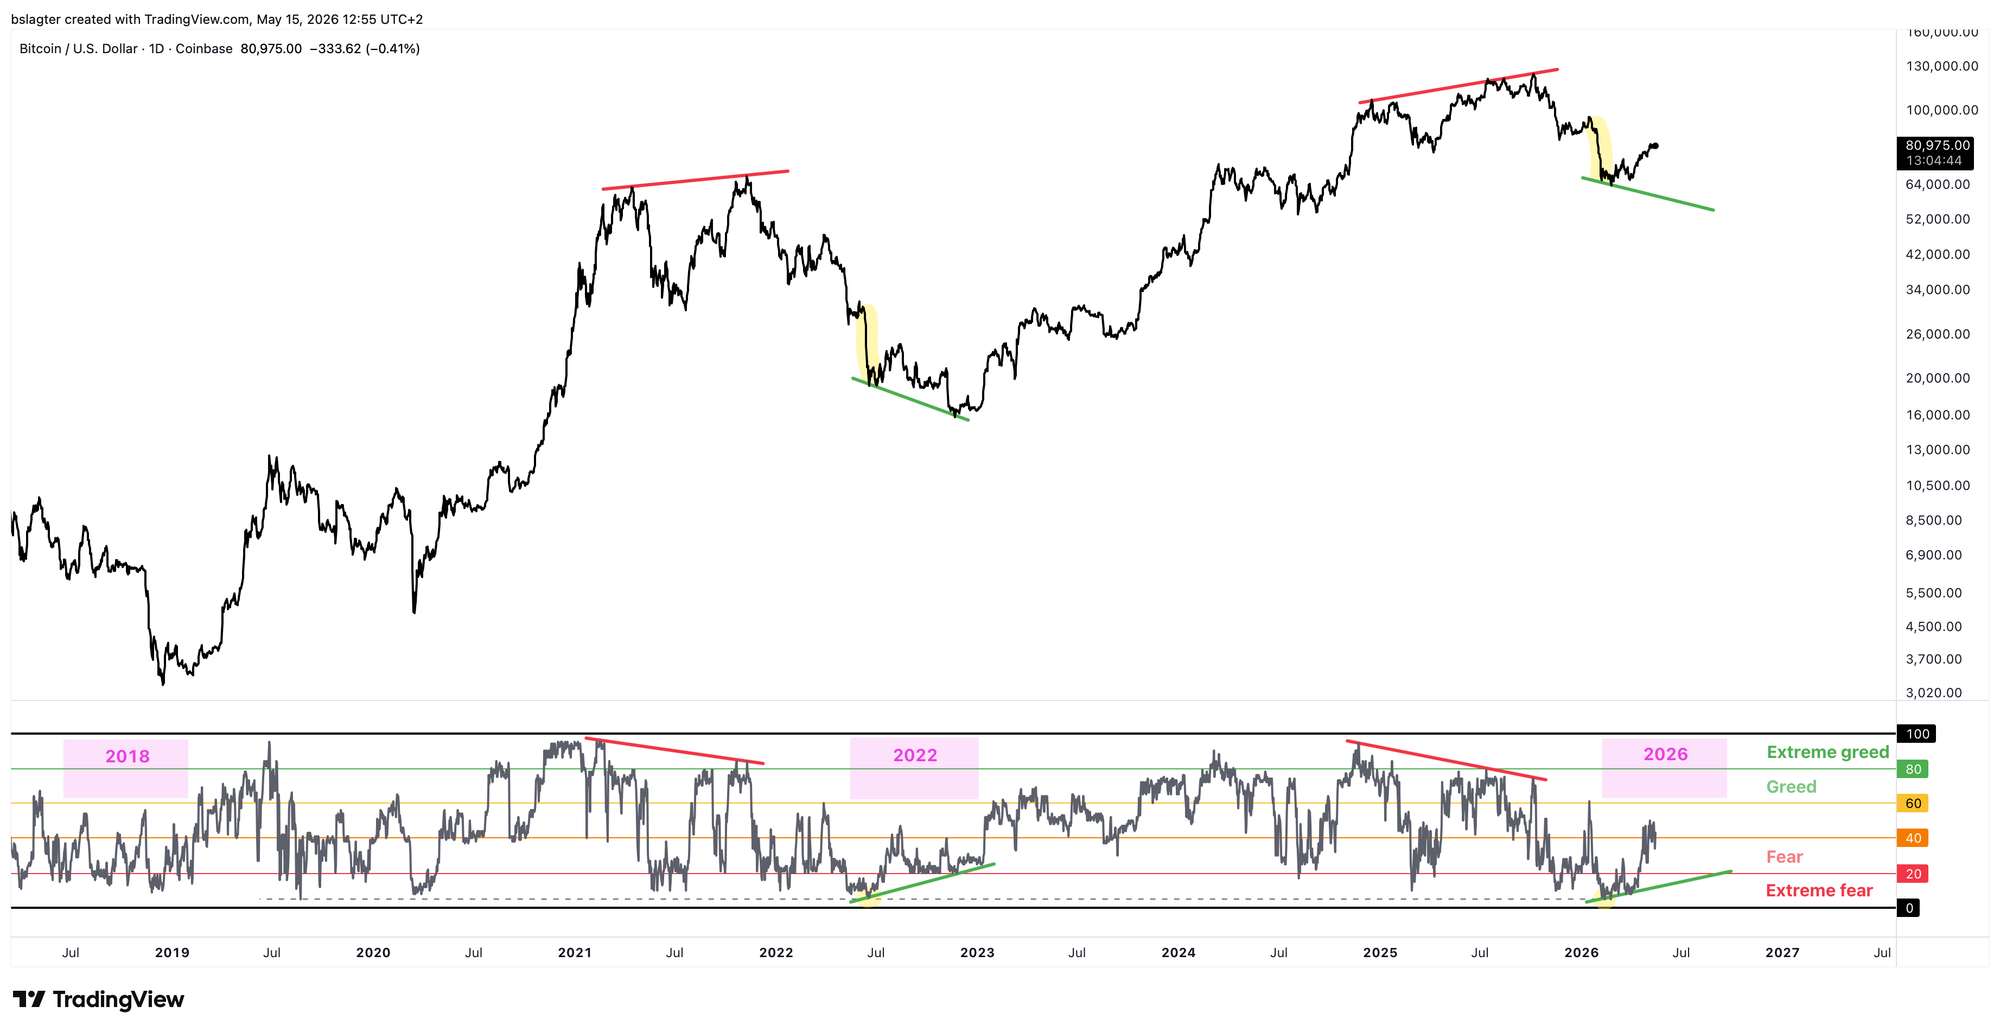
One way to quantify the mood is the Fear & Greed Index. It's unusual for its value to sit above 60 and land in the 'greed' category during a bear market. In 2018 and 2022, we didn't see greed again until the bottom was behind us. If that happens now, it would be a (small) argument for a new bull market.
3️⃣ Taking profits during an upward correction
Sam
The regime has shifted in recent weeks. From sideways chop to a now steadily rising price. With the scenario in mind that this rally will be followed by a visit to $60,000, a key question is: When is the best time to sell?
It's the million-dollar question for investors. It's impossible to sell at the exact top every time. But we can try to improve our odds—for example, by spotting a behavioral change early and acting on it. In this section, we'll cover two methods that work well in combination.
- Losing a dominant EMA
- Printing a lower low
An EMA is a momentum indicator. A steep line is a sign of strong momentum. In a strong uptrend, it can happen that an EMA on higher timeframes isn't even touched, or only gets touched after price has already taken a significant step down.
On the other hand, when we zoom out we may see a clear upward move, but with many short periods of sideways action in between. In that case, you'll notice that price shows little respect for the EMA on lower timeframes.
Bitcoin's current move that started in early April around $65,000 has regularly interacted with and respected the EMA trend on the 12-hour chart. That is, bitcoin regularly found support here during brief pauses in the uptrend. This is also visible in the green cloud on the chart below.
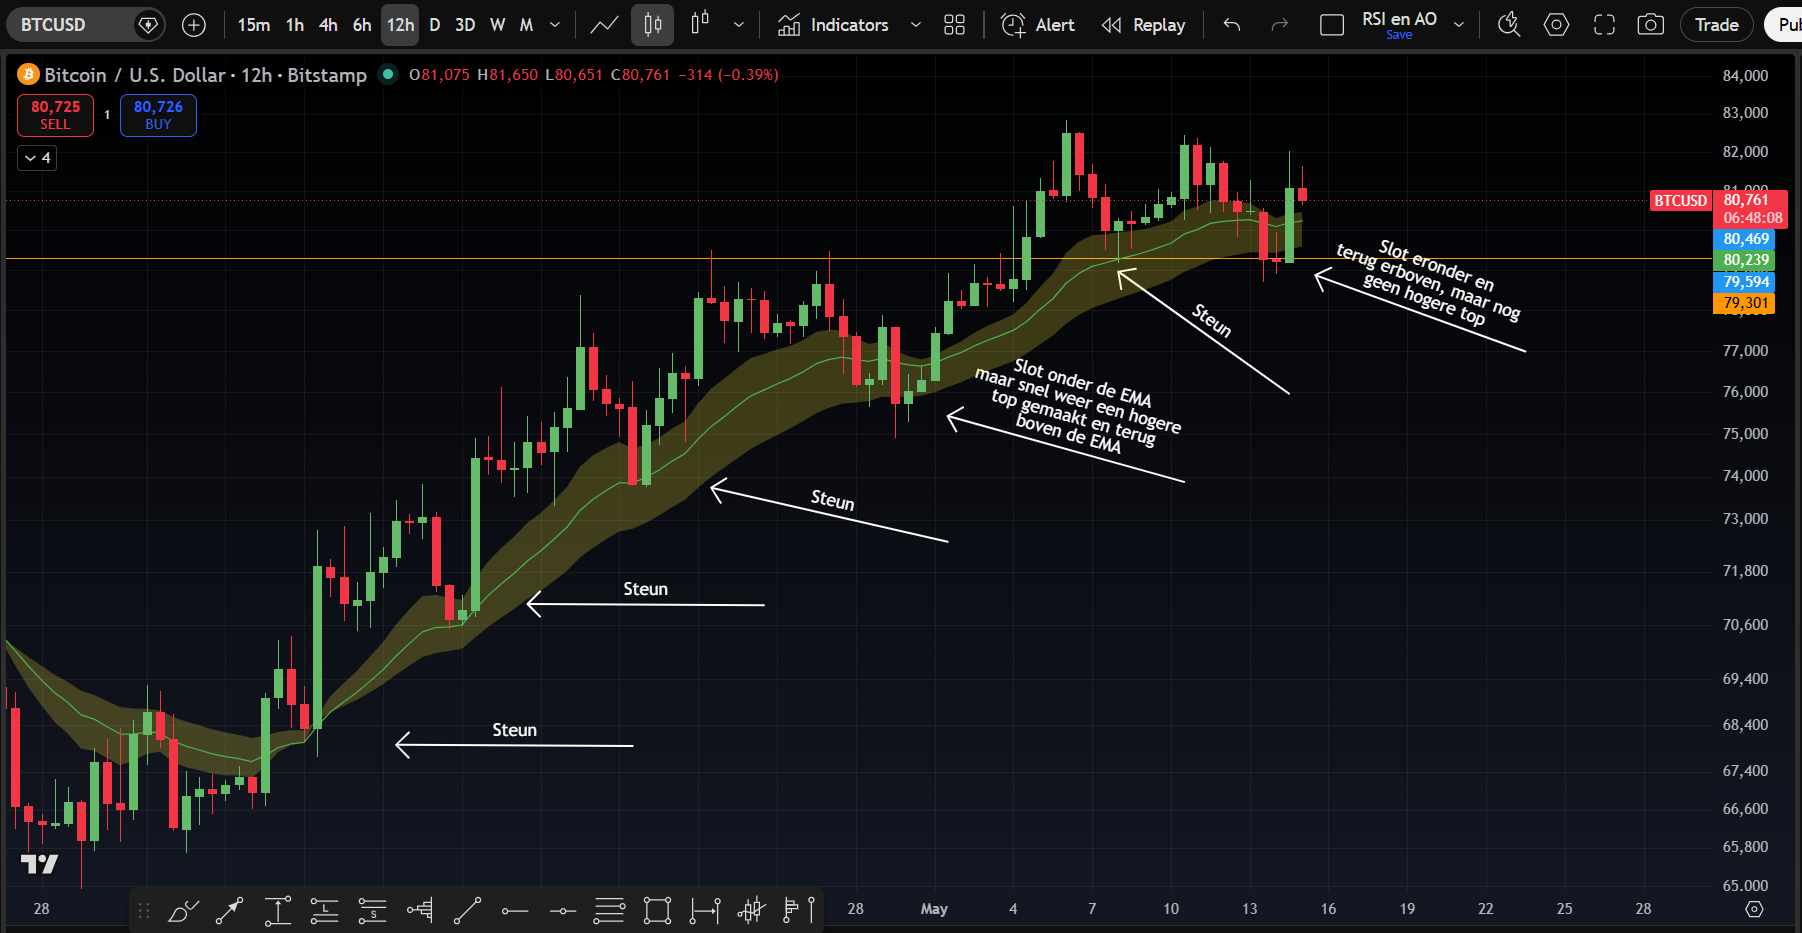
Once this EMA trend flattens out and bitcoin closes below it, that's a behavioral change and a first warning sign. This happened in the early hours of last Wednesday into Thursday.
Price has since moved back above it, but no higher high has been set. For now, that increases the probability that the uptrend is nearing its end. That doesn't mean the regime will shift to bearish. It could also mean a longer sideways consolidation is coming.
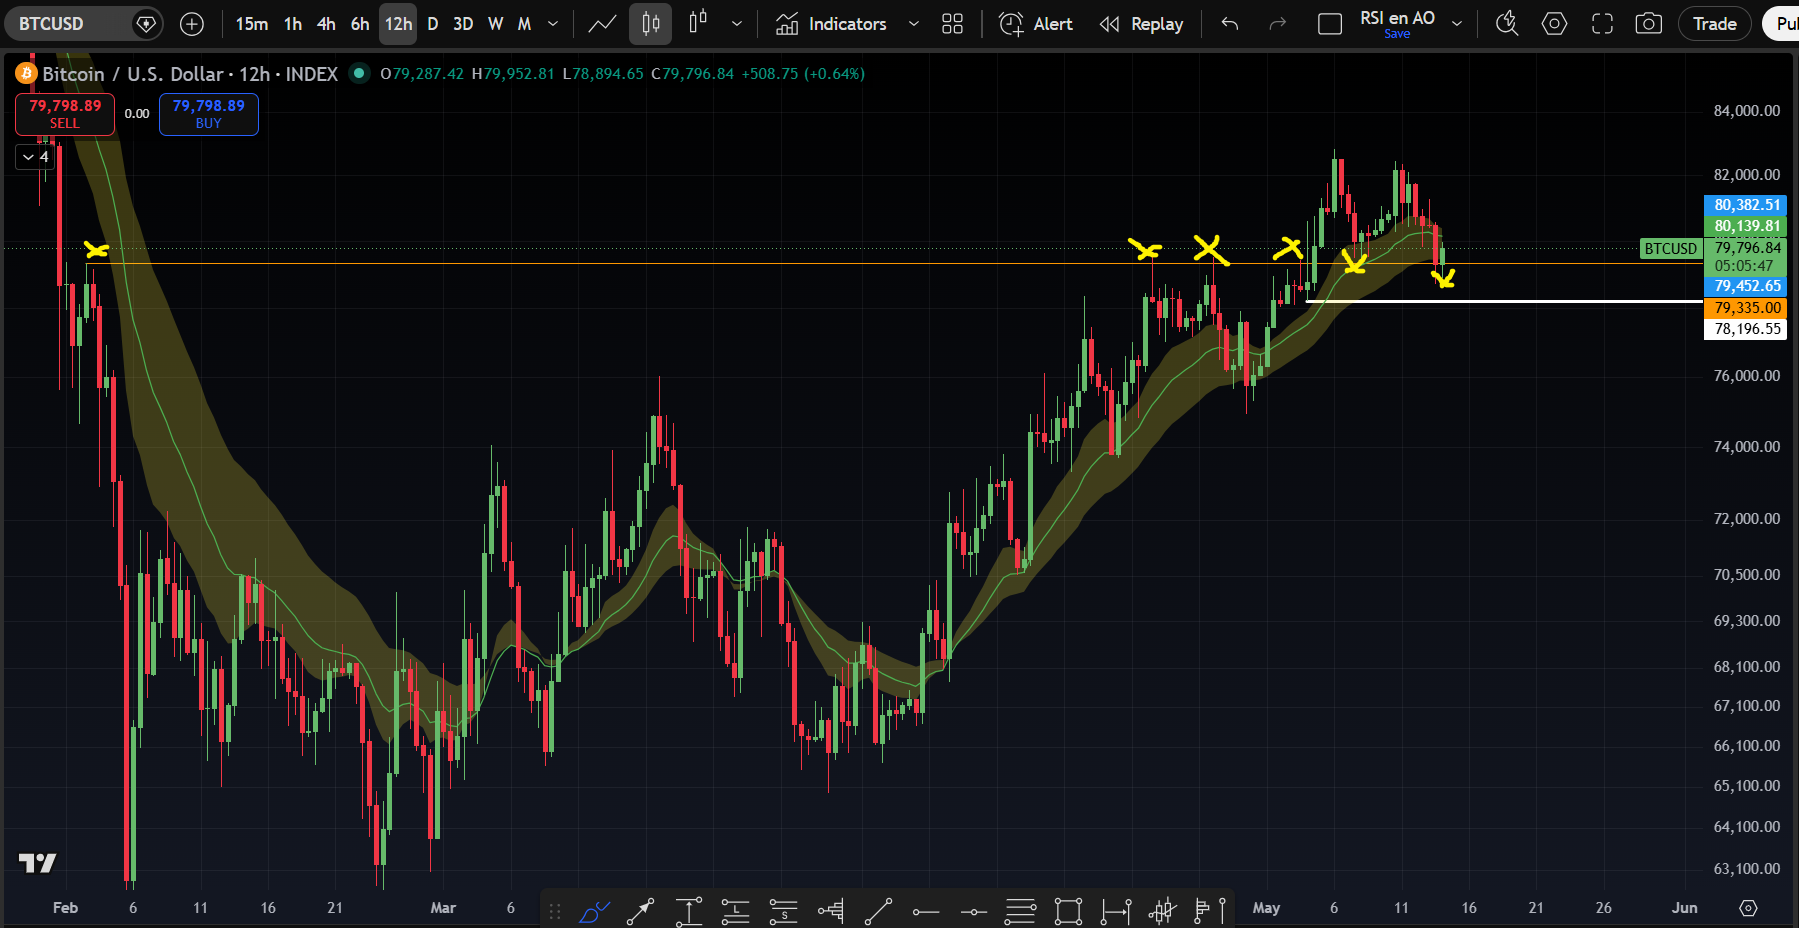
Staying on the 12-hour chart and looking at market structure, we see a clear uptrend with higher highs and higher lows. So a behavioral change here would be price printing a lower low.
To make this concrete: a close below $78,200 on the 12-hour chart would be a very strong warning signal. It would mean both a close below the EMA trend and a lower low.
Additionally, price would then fall back below $79,300. As shown below, this has proven to be an important level. It served as resistance multiple times and was recently tested as support.
So a first warning has been issued by the EMA, but market structure remains intact. This argues for a sideways market, and it's now a waiting game to see how long it takes before direction is chosen—and which way it goes.
4️⃣ Encouraging data from the US credit market
Thom
Bitcoin is the quintessential financial asset that thrives under favorable liquidity conditions. Simply put: for a rising bitcoin price, it's important that capital is willing to take risk. Investors need confidence in the future, financial conditions need to be accommodative, and credit needs to flow relatively freely through the system.
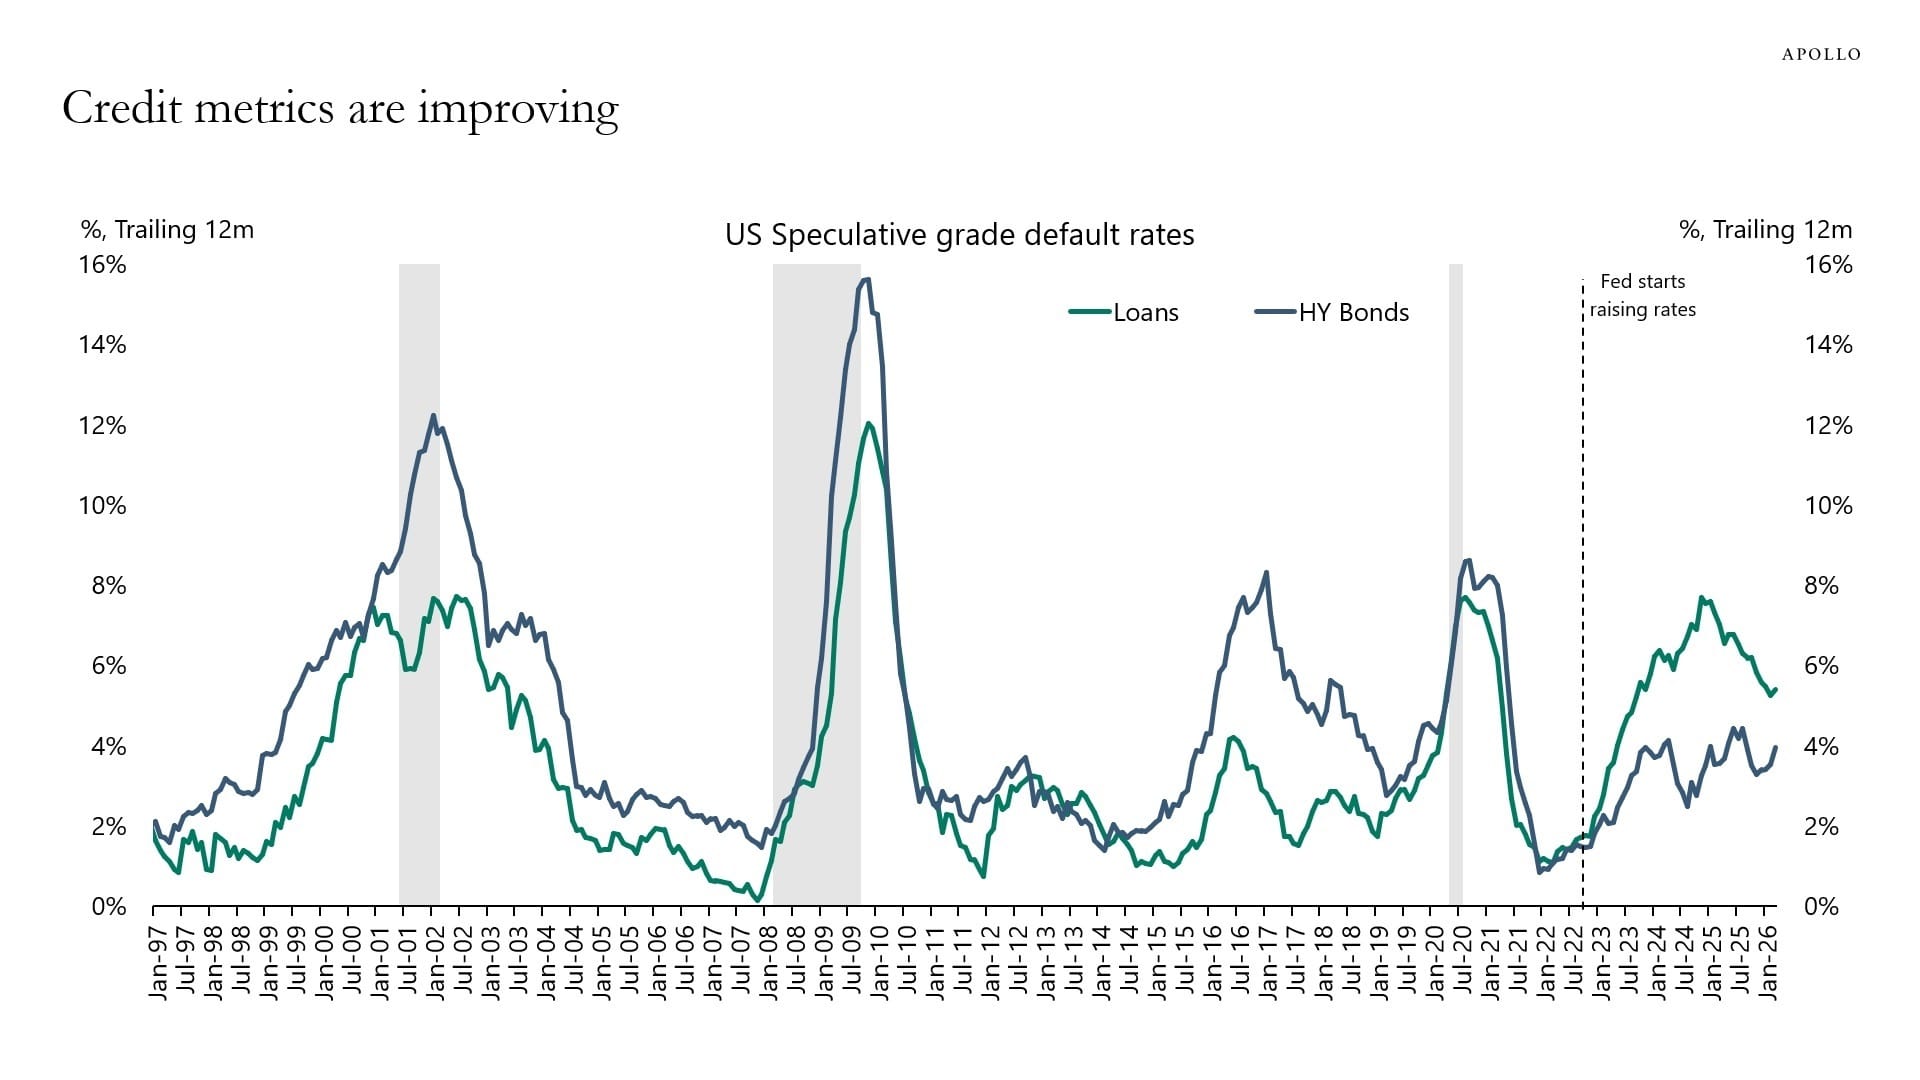
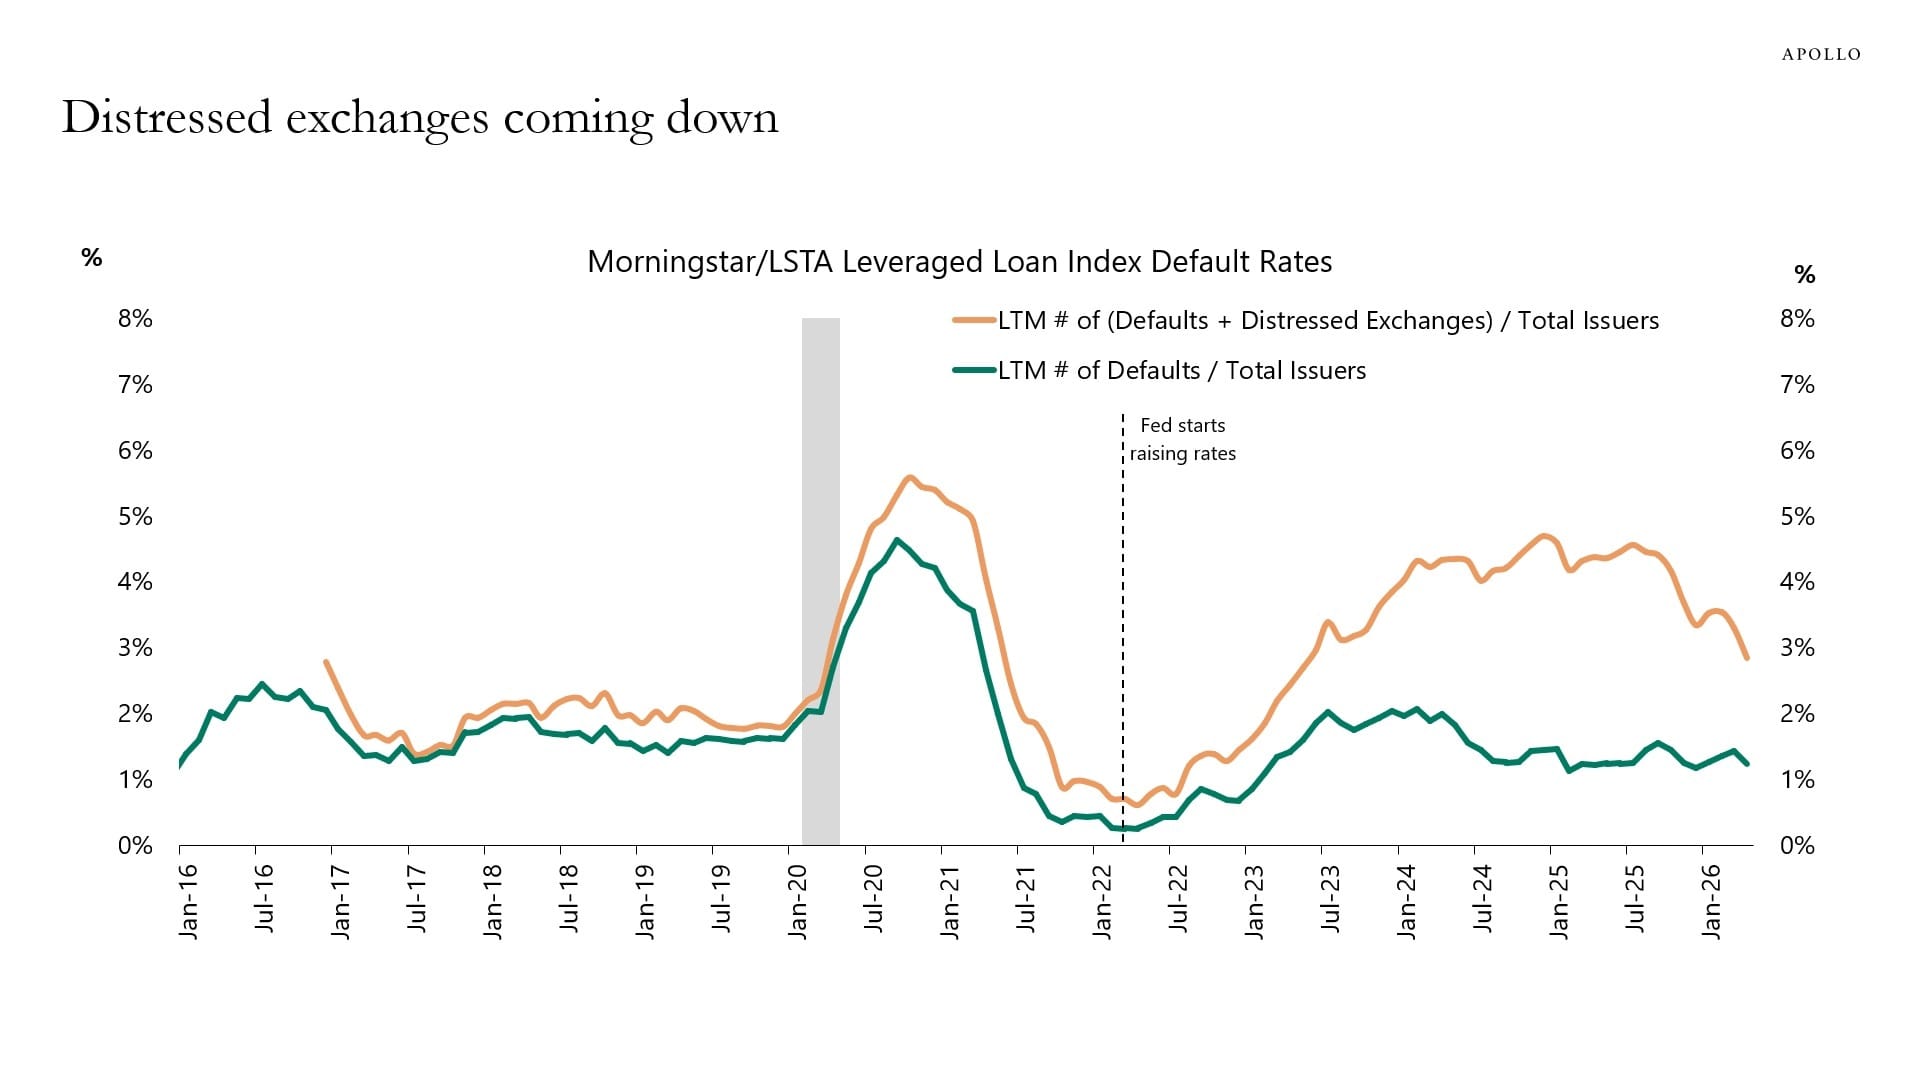
In that context, Torsten Sløk, chief economist at Apollo, came with encouraging data from the US credit market this week. His key message is that there's currently no classic pattern of a major credit crisis or a broad wave of bankruptcies. In fact, on several fronts, the US credit market actually appears to be getting healthier.
- Default rates are not accelerating—they're stabilizing or declining.
- Distressed debt exchanges, where companies ask creditors for longer maturities, for example, are decreasing.
- Financial emergency measures are declining, after having increased in 2024 and 2025.
The higher interest rates—the result of the Federal Reserve's tightening policy since 2022 to combat inflation—have caused pain, especially for weaker companies with heavy debt loads, but the stress is not escalating.
In the first chart, we see that defaults among speculative-grade companies are not spiraling out of control. These are companies with weaker credit ratings—exactly where you'd expect to see stress first. That stress did build up, but default rates are now declining again.
We see the same picture in the next chart for distressed debt exchanges (in orange). Companies are less frequently needing to ask creditors for extended maturities or altered terms. You can think of this as the anteroom to default—where improvement is also visible.
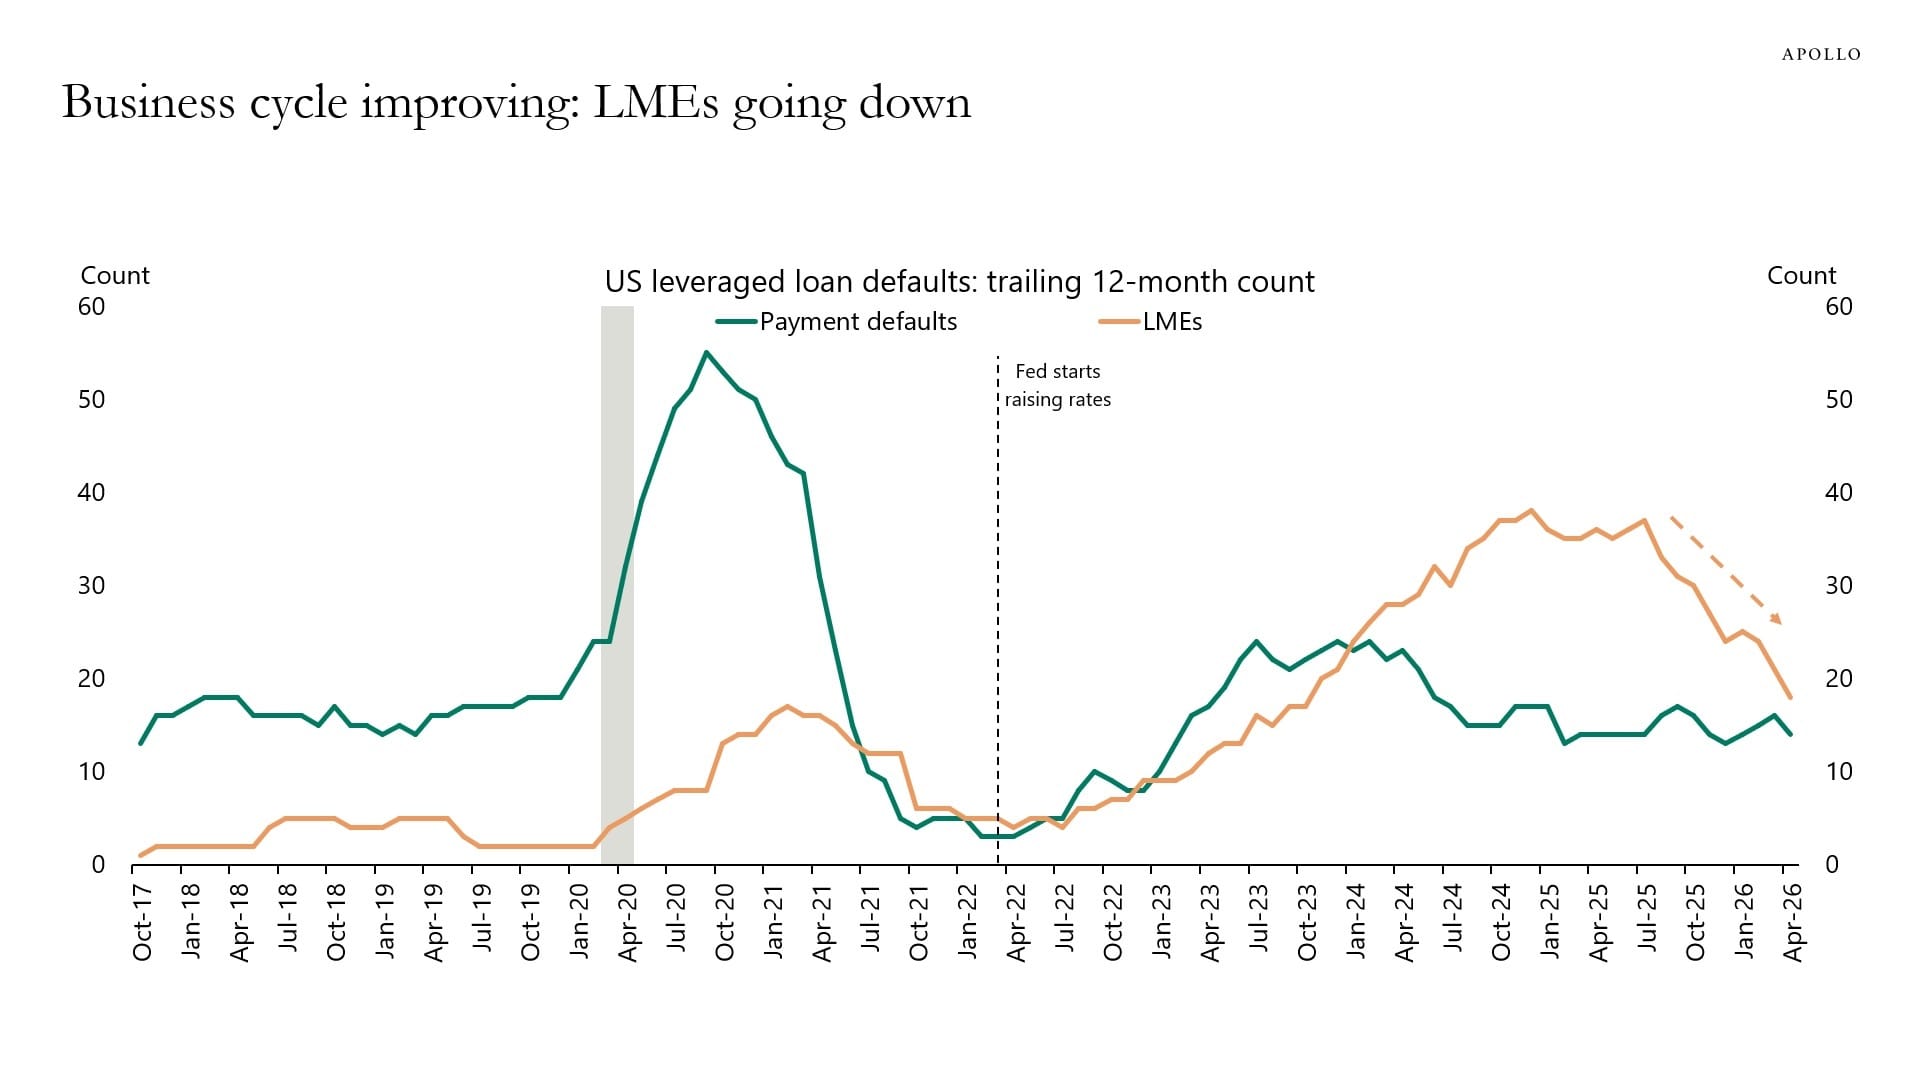
The third and final chart zooms in on the number of troubled cases within the US leveraged loan market (green). These are corporate loans with variable interest rates that move up with market rates. If higher rates were truly causing a major debt crisis, you'd likely see it in these loans first.
That's exactly why Sløk focuses on these loans—they generally belong to companies with relatively high leverage, whose interest costs move quickly with the market. Here too, we see a decline in defaults and debt restructurings.
LMEs (orange) are the previously mentioned interventions through which companies try to keep their debt burden manageable without officially defaulting—that is, failing to meet their obligations.
Across the board, we're not seeing a credit market that's coming under increasing pressure. Financial conditions appear to be improving instead. Companies have felt the pain, but the stress hasn't resulted in a crisis so far and now seems to be easing.
5️⃣ Inflation figures put early pressure on Kevin Warsh
Thom
This week was partly dominated by important inflation figures from the United States. These made clear that inflation is starting to accelerate and the trend is moving in the wrong direction. The US labor market also recently produced solid numbers, which in theory gives the central bank more room to focus on inflation.
The increase in inflation is obviously largely the result of rising energy prices due to the Iran war. Additionally, we're seeing that shelter inflation is starting to rise again after a period of decline. That doesn't help in getting inflation toward the desired 2.0% either.
The bottom line is that this provides ever more arguments for future rate hikes by the Federal Reserve. This comes at an interesting moment, as Donald Trump's nominee Kevin Warsh is about to take over the chairmanship from Jerome Powell.
From Warsh, we've heard mostly arguments in recent months for rate cuts based on the productivity revolution that AI is supposed to trigger.
Given the current trajectory of inflation, that narrative is becoming increasingly hard to believe. This could put Warsh in a tough spot right at the start of his term. We know Trump is counting on rate cuts from his new chair—and that he's not afraid to go to war over it.
Until recently, the market was still pricing in several rate cuts by the end of 2027. Those have since vanished into thin air; the futures market is now pricing in one cautious rate hike through the December 2027 meeting.
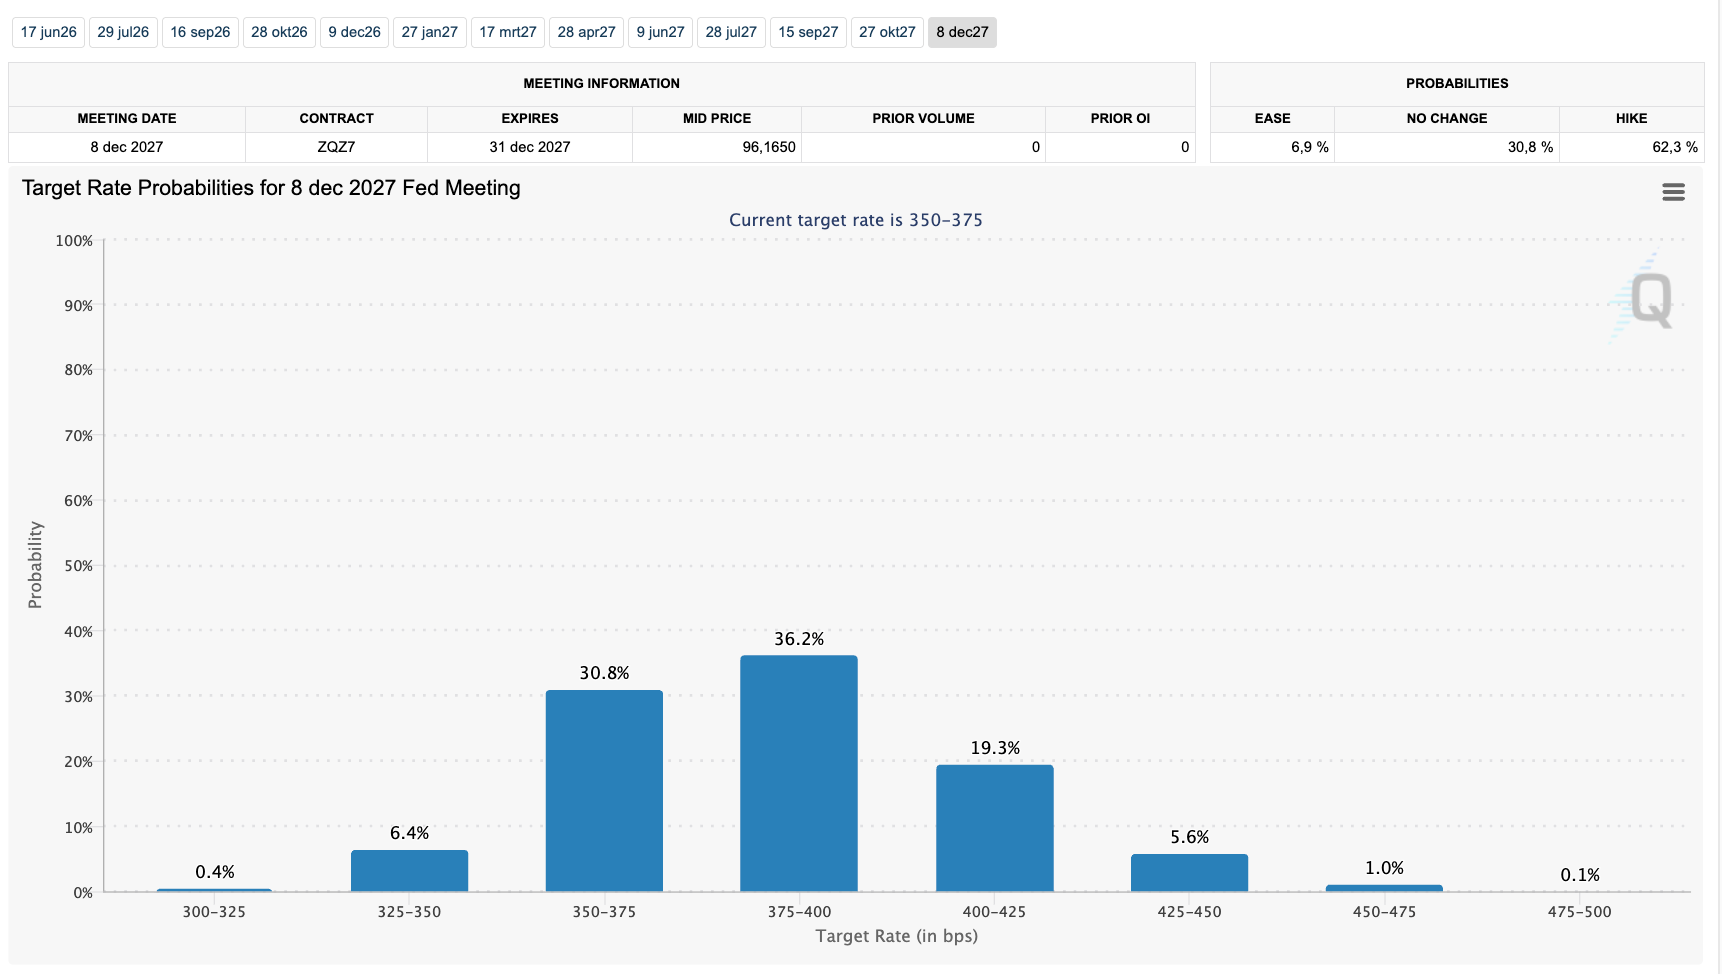
It's important to know that these kinds of expectations almost never come true. That's because the changes we're currently seeing—the pricing out of rate cuts and the pricing in of a rate hike—are already having an effect on markets.
The market doesn't wait for actual events; it also factors future expectations into prices. This is probably already acting as a headwind for risk assets—and thus for bitcoin—right now.
While that could create short-term headwinds, it doesn't change my longer-term expectations. A swift end to the Iran war is desirable right now, but I consider it unlikely that the US, China, and Europe will risk a recession during the AI revolution.
Should the situation become precarious for the global economy, I expect it won't be long before governments and central banks step in with support.
In closing
All previous editions of Alpha Markets can be found in the archive. Questions, comments, and suggestions are always welcome in the community.
Thank you for reading!
To stay informed about the latest market developments and insights, follow our team members on X:
- Bart Mol (@Bart_Mol)
- Peter Slagter (@pesla)
- Bert Slagter (@bslagter)
- Mike Lelieveld (@mlelieveld)
We appreciate your continued support and look forward to bringing you more comprehensive analysis in our next edition.
Until then!